acta structilia · 2018-04-14 · acta structilia. 2014:21(2) tydskrif vir die fisiese en ....
TRANSCRIPT

Vol 21 No 2 2014
Tydskrif vir die fisiese en ontwikkelingswetenskappe
Journal for the physical and development sciences
ACTA
Structilia

Acta Structilia2014:21(2)Uitgegee deur die Universiteit van die VrystaatBloemfontein9300
ISSN 1023-05642014 KopieregUniversiteit van die VrystaatBloemfontein
Uitleg: SUN MeDIA Bloemfontein
AdresDie RedakteurActa StructiliaInterne Posbus 47Universiteit van die VrystaatPosbus 3399300 BloemfonteinTel +27 51 4012248Faks +27 51 4013324
E-pos: [email protected]
Acta Structilia2014:21(2)Published by the University of the Free StateBloemfontein9300
ISSN 1023-05642014 CopyrightUniversity of the Free StateBloemfontein
Layout: SUN MeDIA Bloemfontein
AddressThe EditorActa StructiliaInternal Post Box 47University of the Free StateP O Box 3399300 BloemfonteinTel +27 51 4012248Fax +27 51 4013324
Email: [email protected]

Acta Structilia2014:21(2)Tydskrif vir die fisiese en ontwikkelingswetenskappe
Acta Structilia is ’n Suid-Afrikaanse geakkrediteerde tydskrif, wat publikasie geleenthede bied vir onafhanklik gerefereerde artikels deur plaaslike en buitelandse navorsers op die terreine van die fisiese en ontwikkelingswetenskappe. Elke gekeurde artikel word as sodanig aangedui. Die redaksie oorweeg Afrikaanse of Engelse artikels oor onderwerpe binne studie velde soos: argitektuur, stads- en streekbeplanning, bourekenkunde, konstruksie- en projekbestuur, bou-ekonomie, ingenieurswese, die eiendomsbedryf en die ontwikkelingsveld rondom gemeenskapsbouprojekte. Acta Structilia verskyn twee keer per jaar onder die vaandel van die Universiteit van die Vrystaat. Die tydskrif word gelewer aan die betrokke navorsingsinstansies, Suider-Afrikaanse universiteite met bogemelde navorsings-departemente, Suid-Afrikaanse navorsingsbiblioteke, geselekteerde buitelandse instansies en intekenaars. Menings en kritiek in die tydskrif is dié van die outeur(s). Publikasie daarvan is nie ’n aanvaarding dat die Redaksie of die Universiteit van die Vrystaat verantwoordelikheid daarvoor aanvaar nie.
Intekengeld:
Suid-Afrika: R40 per kopieInternasionaal: VSA$40 per kopie
Journal for the physical and development sciences
Acta Structilia is a South African accredited journal for independently adjudicated research articles on any topic in the field of the physical and development sciences. Each peer refereed article is indicated as such in the journal. The editorial staff considers articles in English and Afrikaans, written from any responsible point of view on subjects in any applicable field of scholarship, i.e. architecture, urban and regional planning, quantity surveying, construction management and project management, building economy, engineering and property or community development. Acta Structilia is published biannually by the University of the Free State. The journal is forwarded to all relevant research units and universities, Southern African research libraries, selected research institutions and libraries abroad, and to subscribers. Views and opinions expressed in this journal are those of the author(s). Publication thereof does not indicate that the Editorial Staff or the University of the Free State accept responsibility for it.
Subscription fees:
South Africa: R40 per copyInternational: US$40 per copy

Redaksie • Editorial Staff
Redakteur • Editor Professor JJP Verster Departement Bourekenkunde en Konstruksiebestuur (UV) Department of Quantity Surveying and Construction Management (UFS)
Adjunkredakteur • Deputy Editor Professor K Kajimo-Shakantu Departement Bourekenkunde en Konstruksiebestuur (UV) Department of Quantity Surveying and Construction Management (UFS)
Professor JJ Steÿn Departement Stads- en Streekbeplanning (UV) Department of Town and Regional Planning (UFS)
Mr HB Pretorius Departement Argitektuur (UV) Department of Architecture (UFS)
Assistentredakteurs • Assistant Editors Professor MJ Maritz Departement Bourekenkunde (UP) Department of Construction Economics (UP)
Professor HJ Marx Projek EnSci (UV)
Project EnSci (UFS)
Me AE Beukes Departement Bourekenkunde en Konstruksiebestuur (UV) Department of Quantity Surveying and Construction Management(UFS)
Redaksionele medewerkers • Editorial Associates Emeritus Professor D Holm Omgewingsontwerp en – Bestuur (UP) Environmental Design and Management (UP)
Dr P Smith Secretary General – International Cost Engineering Council
Redaksionele Raad • Editorial Board
Emeritus Professor WJ van H Botha (Practising urban and regional planner, Bloemfontein, South Africa)Professor D Wills (Pro-Vice Chancellor, University of Greenwich, United Kingdom)Professor K London (Deputy Pro Vice Chancellor Teaching and Learning, RMIT University. Australia)Professor J Tookey (Programme leader in MCM, AUT University, New Zealand)Professor O Joubert (Department of Architecture, University of the Free State, Bloemfontein, South Africa)Professor G Ofori (Head of Department of Building, School of Design and Environment, National University of Singapore)Professor TC Haupt (Director, Pinnacle Research and Development Solutions, Kuilsriver, South Africa)Dr BG Zulch (Department of Quantity Surveying and Construction Management, University of the Free State, Bloemfontein, South Africa)Dr S Brown (Royal Institution of Chartered Surveyors [RICS], UK)Mr G di Castri (Chair of Italian Association for Total Cost Management, Milan, Italy)Mr A Kerin (Vice President of Slovenian Project Management Board, Slovenia)Mr MA Aladapo (Chief Executive, Murty International Limited, Nigeria)

Acta Structilia Jaargang 21 Volume
Nommer 2 Number Desember 2014 December
Inhoud • Contents
Navorsingsartikels • Research articles
The strategic management of construction F Buys 1 companies during recessionary cycles R van Rooyen
Towards the establishment of a relevant H Cruywagen 22 national tender price index for the South African building industry
The influence of clients’ leadership in V Okorie 44 relation to construction health and FA Emuze safety in South Africa JJ Smallwood J van Wyk
Oorsigartikel • Review article
Sustainability impacts of building products: JT Gibberd 69 An assessment methodology for developing countries
Inligting aan outeurs • Information for authors 85

The South African Council for the Quantity Surveying Profession endorsesActa Structilia
The South African Council for the Quantity Surveying Profession (SACQSP) has simplified the submission and assessment of Continuining Professional Development (CPD) requirements of registered persons. CPD submission now requires disclosure of the number of hours invested meaningfully in activities in two main categories. Category 1 activities are those arranged or presented by or to ‘external’ organisatins such as participation in conferences, congresses, workshops or seminars, presentation of lectures, external examination for academic programmes, publication of articles in journals or magazines, other similar activities. Category 2 activities are less formal ‘internal’ activities such as in-house training or seminars, small group discussions, self-study of journals, magazines, articles on web pages, etc.
To assist registered persons with access to journal articles related to quantity surveying and, more generally, built environment issues, the SACQSP at its meeting in March 2007 adopted a recommendation to endorse the journal, Acta Structilia, which publishes quality, peer-reviewed articles and is accredited by the Department of Education.
Council encourages registered persons to peruse Acta Structilia and similar peer-reviewed journals as one of the alternative options to accumulate CPD credits in Category 2 activities. For a limited period, Council will encourage the circulation of Acta Structilia to registered persons.
Professor RN NkadoPresident
Royal Institution of Chartered Surveyors (RICS) supports Acta Structilia
Royal Institution of Chartered Surveyors (RICS) supports the aims and objectives of Acta Structilia and welcomes the efforts being made to improve our knowledge and understanding of the built environment, particularly in an African context.

1
Navorsingsartikels • Research articles
Fanie Buys & Roelof van Rooyen
The strategic management of construction companies during recessionary cycles
Peer reviewed and revised
Abstract This article reports on the results from a study done on the strident economic times in the construction industry following the FIFA Soccer World Cup – from August 2010 to December 2012. The research was conducted among Grade GB7, GB8 and GB9 main contractors in the Eastern Cape Province, South Africa, to identify the key strategies that are able to keep construction entities in operation. The study further investigated the key elements of a successful turnaround strategy, as well as the most effective methods of implementing strategies in construction organisations. A survey among twenty-two construction companies was conducted, using a questionnaire in which a 5-point Likert scale was used to assess the opinions of the respondents. Results from the study showed that companies tendered on more than one type of work (residential, commercial and/or industrial projects) during recessionary times, whereas they usually tendered on one type of work only. It was also noted that not only did the majority of the companies tender on different types of work (residential/commercial/industrial) during the recessionary period (2010-2012), but this was also found to be the most effective means of ‘keeping their doors open’.Construction industry companies are also advised that they should revise their short-term strategic plans on a quarterly basis, while the long-term vision should be assessed and adapted annually, whenever necessary.Keywords: Strategic management, survival strategies, turnaround strategies
AbstrakHierdie artikel doen verslag oor resulte uit navorsing wat gedoen is oor swak ekonomiese toestande in die konstruksienywerheid na afloop van die FIFA 2010 Sokker Wêreldbekerkompetisie tussen Augustus 2010 en Desember 2012. Die navorsing is gedoen onder Graad GB7, GB8 en GB9 hoofkontrakteurs in die Oos-Kaap, Suid Afrika, om die belangrikste strategieë om in moeilike tye staande te bly, te identifiseer. Die doel van die navorsing was ook om die sleutelelemente van ’n omkeerstrategie te bepaal, asook die mees doeltreffende metodes om dit te implementeer. ’n Opname deur middel van ’n vraelys aan twee-en-twintig
Prof. Fanie Buys, Department of Quantity Surveying, PO Box 77000, Nelson Mandela Metropolitan University, Port Elizabeth, 6031, South Africa. Phone: 041 5042023, email: <[email protected]>
Mr Roelof van Rooyen, Department of Quantity Surveying, PO Box 77000, Nelson Mandela Metropolitan University, Port Elizabeth, 6031, South Africa. Phone: 041 5042669, email: <[email protected]>

Acta Structilia 2014: 21(2)
2
hoofkontrakteurs is gedoen, en hul opinies is hoofsaaklik verkry deur gebruik te maak van ’n vraelys met ’n 5-punt Likertskaal. Die resultate van die ondersoek het aangedui dat kontrakteurs meestal op meer as een tipe werkkontrak (residensiële, kommersiële, nywerheid) getender het, in plaas van slegs die normale tipe kontrak. Behalwe dat kontrakteurs op meer as een tipe kontrak getender het, was dit ook die mees effektiewe metode om staande te bly gedurende hierdie moeilike ekonomiese tydperk (2010 tot 2012). Konstruksiemaatskappye word gemaan om hul korttermyn-strategieë kwartaalliks, en hul langtermynvisie jaarliks te hersien, en aanpassings te maak indien nodig.Sleutelwoorde: Strategiese bestuur, oorlewingstrategie, omkeerstrategieë
1. IntroductionA construction company is no different to any other business. By definition, a company is an organisation that looks after its own interests in generating profits from the sale of goods or services (Reverso, n.d: 1). Harris & McCaffer (2006: 2) state that the construction industry has been labelled as being inherently uncertain, due to the number of procedures required for normal projects to be concluded. Among others, the tendering process, the economic climate, profitability and physical production affected by the weather conditions have been identified as the main drivers behind this economic uncertainty (Harris & McCaffer, 2006: 2).
During the spring of 2008, the world experienced an economic recession. This was caused by, among other factors, the housing-market bubble that burst in the United States of America (SAPA, 2009: 1). According to Engineering News (2011: 1), the construction industry in South Africa was, to some extent, initially protected from this recession by the 2010 FIFA Soccer World Cup, which provided a cushioning effect in terms of a cash injection into the country, as well as jobs for contractors; these jobs were largely due to the construction of large infrastructural projects. After South Africa won the bid for the 2010 FIFA Soccer World Cup, investing organisations targeted South Africa for investment purposes during the global credit crunch, which originated during the fourth quarter of 2008. Engineering News (2013: 1) adds that the 2010 FIFA Soccer World Cup kept many construction companies open for business, due to the construction of the infrastructure, stadiums and accommodation – even though the global economic recession was at hand.
The South African construction industry’s activity levels were on a decline after the completion of the FIFA Soccer World Cup, due to the completion of major projects and funding issues with other projects (SAPA, 2013: 1; Rego, 2010: 1). Steyn (2011) agrees that the construction industry’s economic downturn struck after the

Buys & Van Rooyen • The strategic management of construction ...
3
completion of the 2010 FIFA Soccer World Cup in South Africa and states that South Africa’s construction industry GDP was at its lowest in eleven years ending in April 2011. Slabbert (2010: 1) indicates that the reduction of activity levels in the construction industry has placed the construction industry under stress, and that profit margins have, subsequently, been pressurised, due to the increase in competition.
Due to the reduction in the number of projects available, competing construction companies had to formulate and implement competitive strategies, in order to remain lucrative during these strident economic times (SAPA, 2011: 1). Many construction companies fail in this regard, and find it difficult to survive during recessions.
To address the problem of how construction firms can survive during strident economic times, this article reports on an investigation to determine whether construction companies should diversify their strategies, tender on different types of projects and use time frames to implement new business strategies, in order to assist construction companies to survive during strident economic times.
2. Management of competitive companies
2.1 Environment
A competitive organisation’s main focus is to increase revenues and/or to reduce its costs, in an effort to improve its performance, and generate higher levels of profit (Williams & Williams, 2007: 3). Johnson, Scholes & Whittington (2008: 54-57) are of the opinion that the essence of any profit-generating organisation’s survival is based on its ability to understand the environment in which it operates. Environment influences form three series of ‘layers’ which help organisations with ways of coping with change, namely macro-environment; industry/sector and the competitors/markets.
The macro-environment layer – The PESTEL framework (named after political, economic, social, technological, environmental, and legal forces) was found to be the most effective in outlining the major macro-environmental factors acting on any competitive organisation These six items are also known as the ‘global key drivers of change’. These will differ from sector to sector and from country to country. When the past is likely to be very different from the future, based on high levels of uncertainty regarding key environmental forces, constructing scenarios can be a useful way of understanding the implications of these influences on strategy. This could help managers consider how strategies might need to change depending on the

Acta Structilia 2014: 21(2)
4
different ways in which the business environment might change (Johnson et al., 2008: 54-57).
The industry or sector layer – This layer is made up of organisations producing the same products or services. The following five forces can be useful in understanding the competitive dynamics of an organisation: the threat of entry into an industry; the threat of substitutes to the industry’s products or services; the power of buyers of the industry’s products or services; the power of suppliers into the industry, and the extent of rivalry between competitors in the industry. Where these five forces are high, there will be too much competition and pressure for these industries to be attractive to compete in (Johnson et al., 2008: 59).
The competitions and markets layer – Within most industries or sectors there will be many different organisations with different characteristics and competing on different bases, some closer to a particular organisation, and others more remote. The concept of strategic groups can help identify close and more remote competitors as well as direct and indirect competitors. The success or failure of organisations also depends on how well they understand and are able to meet customers’ needs. In the understanding of markets, the concept of market segments can be useful in understanding similarities and differences between groups of customers or users. It is especially important to understand what different customer groups particularly value, as these values form the critical success factors of an organisation (Johnson et al., 2008: 77).
2.2 Strategic management
The business environment can be defined as “the sum of variables impacting on the competitiveness, and ultimately the survival and growth of a firm” (Goldman, Maritz, Nienaber, Pretorius, Priilaid & Williams, 2010: 2). In recent years, the business setting has been characterised by an increase in competition, globalisation, rapid technological advancement, and the changing needs of consumers. Due to the high number of business variables within an organisation, the strategy of the organisation is ultimately the key in keeping the corporate ship on course, in terms of future business success.
For success to be possible, the organisation needs to continuously develop, implement, monitor and evaluate the strategy of the entity (Temtime, 2000: 1). The key in any business is not only to be in power, but also to remain in power. This is the reason why organisations need to keep re-inventing themselves. Elements beyond the control
Buys & Van Rooyen • The strategic management of construction ...
5
of the entity, such as changes in consumer needs and advances in technology, play a large role in the success of a business, and they are the prime reasons why having a permanent competitive advantage is so challenging, but perhaps not always possible (Cusumano, 2010: 1).
Hitt, Hoskisson, Ireland, Morgan, Reinmoeller & Volberda (2011: 7-8) state that a strategy is a co-ordinated group of decisions and commitments made by stakeholders in an organisation, whereby the organisation can exploit its key competencies to gain a competitive advantage over the remainder of the market. They continue by stating that the strategy determines what the organisation will and will not do in both the short term and the long term.
The competitive advantage of an entity comprises the implemented strategy, thereby creating a system, which competitors cannot duplicate or find too costly to implement. Even though no competitive advantage is permanent, all organisations strive to have as many competitive advantages as possible, in order to avoid losing their competitive edge in the future. This competitive advantage allows an organisation to generate above-average returns, which represent the ideal state for any profitable entity in any competitive industry. Organisations with a below-average return will invariably cease to exist, if the low return rate continues, due to investors and stakeholders withdrawing their investments from an organisation (Hitt et al., 2011: 7-8).
Johnson et al. (2008: 3) maintain that the strategy of an organisation is the scope and direction which the organisation chooses to adopt for the long term in order to achieve its predetermined goals. During the strategising process, the organisation needs to configure its resources and competencies, in order to meet the stakeholders’ expectations.
Goldman et al. (2010: 14) maintain that various steps can be taken for the strategic management to be effective within an organisation. These steps can range from being completely formal in the principles of planned events and the use of prescribed books and models, to being informal by using elements implemented in an ad hoc fashion, and only when necessary. The systems and procedures required for the implementation of strategic management processess depend largely on the nature of the industry in which the organisation is operating, as well as the knowledge of higher level management techniques in the industry.
Strategic management can, therefore, be defined as any action executed to implement the corporate strategy of an organisation and any step taken in the direction of achieving one of the

Acta Structilia 2014: 21(2)
6
organisation’s future goals (Groenewald, Le Roux & Rossouw, 2007: 3). Strategic management can also be described as the method in which all organisational resources are aligned, implemented and co-ordinated to work with the particular business environment (Ehlers & Lazenby, 2010: 3).
The strategic management concept differs from other managerial areas, in the sense that issues arise out of non-routine and ambiguous situations. This means that the management of specific areas with controllable variables forms a minor part of the strategic management process. However, the manager needs to have a more holistic view of all operational units, in order to take part in the development of the concept within the organisation (Johnson et al., 2008: 11).
2.2.1 The formulation phase
The formulation phase is also known as the planning phase, or the strategic planning process, and it involves three key tasks, namely organising, leading and control. There are three levels of management within an organisation: top, middle and operational management. Each of the levels has its own responsibilities relevant to strategic management (Groenewald et al., 2007: 3-4). Ehlers & Lazenby (2010: 3) agree with Groenewald et al. (2007: 3-4), adding that the employee force also plays a role in the strategic management process.
2.2.2 Turnaround strategies
Turnaround strategies are very common and popular in South Africa. This type of strategy is pursued when the industry, in which an organisation operates, experiences an economic downturn; the entity must then make an effort to save itself (Groenewald et al., 2007: 116).
Generic strategies are not functional strategies during times when an organisation’s industry is in a decline. A great deal of information has been produced within the corporate strategy field, but not sufficiently to have any significant impact on the industry as a whole. During an economic decline, organisations consider alternatives in order to deal with any rapid changes in the business environment (Goldman et al., 2010: 55).
The turnaround situation can be defined as the moment when the organisation realises that it has to consider taking steps to adapt to an industry, which is experiencing an economic downturn. If the organisation does not accept the fact that it needs to take steps in the direction of a turnaround strategy, that entity would be sure to face failure, and possibly even cease to exist (Goldman et al., 2010: 56).

Buys & Van Rooyen • The strategic management of construction ...
7
In the event of a turnaround situation, the organisation usually appoints a turnaround manager, or considers restructuring the higher management. In attempts to identify the key steps for the turnaround strategy, the organisation has to assess the two elements required to define a new strategy. These are the cause and the resource abundance. The cause of the decline can be used to identify those elements which need to be adjusted, in order to become more balanced with the environment again.
Once the problem has been clearly identified, various routes can be assessed as to how the resources should be used, changed, or removed completely from the entity (Goldman et al., 2010: 56).
When declines in profit margins are anticipated, the organisation has the following options available (Groenewald et al., 2007: 116):
• Cost reduction: Retrenchment of staff. Leasing, rather than purchasing equipment. Dropping low profit items off the production line.
Discontinuing low profit customers.• Asset reduction:
The sale of land, buildings and equipment that is not necessary for pursuing the organisation’s core business.
• Revenue generation: This can be done by reviewing debtor and stock turn
over ratios.
Goldman et al. (2010: 57-58) explain three instances that are relevant when a turnaround situation is imminent:
• Strategic distress: Instances where the organisation in question is performing well, but then loses its competitive advantage within the industry. The symptoms of strategic distress are the loss of sales, where the market share has been stable. A sudden change in the level of demand, or a high investment in inventory growth could also cause strategic distress.
• Underperformance: The organisation experiences a good demand for its products, but as a whole it is not performing as effectively as it should. The organisation becomes cash-strapped, due to low outputs by the employees, and the competitive advantage that is put under strain as a result of this. The use of outdated systems could also cause such underperformance.

Acta Structilia 2014: 21(2)
8
• Strategic crisis: The entity is facing a crisis due to the scarcity of resources to be used in the direction of outputs; a last-resort strategy needs to be implemented as soon as possible.
2.2.3 The implementation phase
Johnson et al. (2008: 54-57) are of the opinion that the implementation phase needs to be developed and executed by every individual within an organisation; in doing so, all the employees develop a sense of belonging and increased levels of motivation. They also state that: “Strategic management does not belong only to an elite group at the top of an organization”. The best way of survival is to adapt effectively to a changing world. After the achievement of the strategy in the short and long term, the organisation needs to implement the plans as quickly and as effectively as possible. In succeeding in this, the organisation would then have a better prospect of leading the pack and remaining competitive (Cusumano, 2010: 10).
The three levels of management have various roles to play in the successful implementation of a new strategy within an organisation:
• The executive management level needs to make the required changes, in order for the new strategy to be effective. These changes may include changes within the organisational structure, the leadership style, systems, staff or organisational culture.
• Tactical management, which includes senior and middle management, must ensure that strategic goals are implemented within the tactical and operational levels of management.
• Operational management needs to ensure that the tactical strategies are transformed into action plans, and then implemented appropriately (Groenewald et al., 2007: 150).
Even though the corporate strategy is mainly developed by top-level management, it is up to the tactical and operational management levels to implement the strategies, and to work towards the new goals, which have been set. The lengthy plans and visions set by executive management are meaningless until they have been implemented properly. This is the reason why the implementation phase and the plans remain so critical. These processes need to be monitored, in order to evaluate the efficiency of the new systems (Groenewald et al., 2007: 149).
Buys & Van Rooyen • The strategic management of construction ...
9
3. Research methodologyThis article presents part of the findings of a research project on the strategic management of construction companies during recessionary periods, using a descriptive quantitative research approach. First, a literature review of the existing theory focused mainly on turnaround strategies in recessionary times. Primary data was obtained by distributing a structured questionnaire among three groups of main contracting firms listed as ‘small contractors’, ‘medium-sized contractors’ and ‘large contractors’. The three groups of contractors were listed as GB7, GB8 and GB9 main contracting firms. These correlate with the Construction Industry Development Board (cidb) project-size capability ratings (Construction Industry Development Regulations, 2008: 18).
This quantitative method of research involves ordinal scales analysed via non-parametric statistical tests, by using the mean scores, as advocated by Jamieson (2004: 1217). Some closed-ended questions requested respondents to answer by making use of ‘Yes’ or ’No’ answers. A structured questionnaire was administered to the study sample, along with a covering letter. The covering letter stated the purpose of the research and guaranteed that the information given by the respondents would be treated as confidential, and that no names would be mentioned in the research. The survey results were stored on a Microsoft Excel worksheet for analysis, and the information was gathered in order to determine the following:
• Diversification strategies, which kept construction-company doors open between 2010 and 2012;
• Turnaround strategies to survive, when there is a low level of construction industry activity;
• Key elements of an implementation strategy in construction companies, and
• The effectiveness of the survival strategies.
Questionnaires were completed anonymously to ensure a true reflection of the respondents’ views, and to meet the ethical criterion of confidentiality. It was assumed that the respondents were sincere in their responses, as they were assured of their anonymity.
The population sample, located in the Eastern Cape Province, specifically East London and Nelson Mandela Bay, consisted of contracting firms. From the 34 main contracting firms initially invited, 22 responded. This represents a response rate of 61% and is deemed to be a representative response rate. Leedy & Ormrod (2005: 193)

Acta Structilia 2014: 21(2)
10
describe a response rate of 50% as acceptable for a study of this nature.
The response rates for the contractor groups were: GB7 contractors, 61%; GB8 contractors, 58%, and GB9 contractors, 67%. Further analysis showed that the main contracting firms based in East London had a higher response rate, reflecting their willingness to be involved in the research. A total of 92% of the contractors located in East London participated in the study, compared to 56% of the contractors who were based in Port Elizabeth.
Although this research was conducted among construction companies in the Eastern Cape Province, there is no reason to believe that it would be any different in other provinces, although this issue is recommended as an opportunity for further research.
3.1 Analysis and interpretation
A 5-point Likert scale was used to obtain the opinions of the respondents, and to analyse the results of the survey. Leedy & Ormrod (2005: 185) maintain that Likert scales are effective when behaviours and characteristics are evaluated in a study. They can be used when a phenomenon is quite complex, and where numbers can be used to quantify the results. Wegner (2012: 11) agrees, adding that Likert scales can be used to measure a sample’s attitudes, preferences, and even perceptions. They can be used for the study of interval data; respondents are requested to indicate how strongly they feel regarding the statements or questions. Dawes (2008: 75) states that either 5-, 7- or 10-point scales are all comparable for analytical tools such as confirmatory factor analysis or structural equation models. For the purpose of analysis and interpretation, the following terminology was used regarding mean scores: ‘strongly disagree’ (≥1.0 & ≤1.8); ‘disagree’ (>1.8 & ≤2.6); ’neutral’ (>2.6 & ≤3.4); ‘agree’ (>3.4 & ≤4.2) and ‘strongly agree’ (>4.2 & ≤5.0).
When using Likert-type scales, it is imperative to calculate and report Cronbach’s alpha coefficient for internal consistency reliability for any scales or subscales used (Gliem & Gliem, 2003: 88). Reliability is the extent to which a measuring instrument is repeatable and consistent (Maree & Pietersen, 2007: 214).
For this article, the internal reliability of variables was tested using Cronbach’s alpha coefficient of reliability. Maree & Pietersen (2007: 216) suggest the following guidelines for the interpretation of Cronbach’s alpha coefficient: 0.90 – high reliability; 0.80 – moderate reliability, and 0.70 – low reliability. Cronbach’s alpha coefficient of

Buys & Van Rooyen • The strategic management of construction ...
11
reliability (Nunally, 1979: 85) was determined for each of the scale scores derived from the grouped items, as indicated in Tables 2 and 3.
The item/reliability analysis was performed on the items of the sections dealing with Effectiveness and Key elements. Due to small item-total correlations and improved alpha if an item was omitted, items 3 and 4 of the Effectiveness items and item 6 of the Key elements items were omitted in order to obtain acceptable alpha values (i.e., alpha>0.60).
4. Results and discussionThe average working experience of the respondents was 19 years in the construction industry. A high average experience rate indicates a high level of expertise and the respondents’ necessary experience and knowledge to provide reliable information.
Although the full research report includes a breakdown of the opinions of GB7, GB8 and GB9 contractors, only the results of the combined groups of contractors are included in this article. However, the opinions of the different groups are also briefly described.
4.1 Diversificationstrategies
The respondents were requested to state whether they had implemented any of the listed diversification strategies between 2010 and 2012, by stating ‘Yes’ or ’No’. It should be noted that some companies had made use of more than one strategy.
Table 1: Diversification strategies
# Diversification strategyUsing strategy
TotalYes % No %
1 Tendering on different types of work, i.e., residential/commercial/industrial 72.7 27.3 100
2 Entering into contract with other main contracting firms, i.e., joint ventures 54.5 45.5 100
3Buying into firms that do work, which complements your organisation, such as subcontractors and suppliers
45.5 54.5 100
4 Tendering in foreign areas 41.9 58.1 100
5 Buying into businesses that do not have any link to your core construction business 22.7 77.3 100
6 Buying into other companies that do the same work as your company 9.1 90.9 100
It is evident from Table 1 that the majority of the respondent companies (72.7%) tendered on more than one type of work (for

Acta Structilia 2014: 21(2)
12
example, residential, commercial and/or industrial projects), whereas they normally tendered on one type of work only. Slightly more than half of the respondent companies (54.5%) entered into contracts with other main contracting firms, i.e., joint ventures. Slightly less than half of the respondent companies (45.5%) indicated that they were buying into firms that do work, complementing their organisation (subcontractors and suppliers). Only 9.1% of the companies bought into other companies that do the same work as their company, i.e., merging with another company.
These results indicate that tendering on different types of work was the most used strategy by the majority of the construction companies. They would rather work on different types of work than revert to using any other strategy. The results, therefore, show that construction companies should diversify their strategies in order to assist them to survive during strident economic times.
4.2 The effectiveness of survival strategies
It is crucial that new strategies should be effective when implemented. Respondents were requested to state to what extent they agreed that the listed survival strategies were effective in ‘keeping the doors open’, where 1=strongly disagree, 2=disagree, 3=neutral, 4=agree, 5=strongly agree, and 6=unsure.
The results indicate that the average mean score (MS) of 2.86 for the ‘effectiveness of survival strategies’, which is on the lower end of the scale (i.e. <3.00), means that respondents were generally ’neutral’ regarding the effectiveness of the survival strategies.
The results also indicate that the most effective survival strategy used by construction companies is tendering on different types of work (e.g., residential/commercial/ industrial) (MS=3.77); as many as 31.8% of the respondents ‘strongly agreed’, and 40.9% ‘agreed’ that it is effective. Buying into firms that do work, complementing their organisation, such as subcontractors and suppliers (MS=3.09), was ranked second highest (’neutral’). Entering into contracts with other main contracting firms, i.e., joint ventures, and tendering in foreign areas were equally ranked third (MS=3.05), indicating that respondents were ’neutral’ regarding the effectiveness of this strategy.
The respondents ‘disagreed’ that buying into businesses that do not have any link to the company’s core construction business (MS=2.45), and buying into other companies that do the same work as their own company (MS=2.14) were ranked 4th and 5th as being effective, respectively.

Buys & Van Rooyen • The strategic management of construction ...
13
Tabl
e 2:
The
effe
ctiv
enes
s of s
urvi
val s
trate
gies
#Su
rviv
al st
rate
gyV
alid
N
12
34
56
Tota
lM
ean
scor
eRa
nkSD
DN
ASA
U
%%
%%
%%
1Te
nder
ing
on d
iffer
ent
type
s of w
ork,
i.e.
, re
siden
tial/
com
mer
cial
/in
dus
trial
22
4.55
18.1
84.
5540
.90
31.8
10.
0010
03.
771
2Bu
ying
into
firm
s tha
t do
wor
k, th
us c
ompl
emen
ting
your
org
anisa
tion,
such
as
subc
ontra
ctor
s and
su
pplie
rs
2213
.63
31.8
29.
0922
.73
22.7
30.
0010
03.
092
3En
terin
g in
to c
ontra
ct w
ith
othe
r mai
n co
ntra
ctin
g fir
ms,
i.e.,
join
t ven
ture
s 22
22.7
322
.73
0.00
36.3
618
.18
0.00
100
3.05
3=
4Te
nder
ing
in fo
reig
n ar
eas
229.
0940
.90
9.09
19.1
822
.72
0.00
100
3.05
3=
5Bu
ying
into
bus
ines
ses
that
do
not h
ave
any
link
to y
our c
ore
cons
truct
ion
busin
ess
2218
.18
50.0
09.
0913
.63
9.09
0.00
100
2.45
5
6Bu
ying
into
oth
er
com
pani
es th
at d
o th
e sa
me
wor
k as
you
r co
mpa
ny
2222
.73
50.0
013
.63
4.55
4.55
0.00
100
2.14
6
Ave
rage
2.86
Cro
nbac
h’s a
lpha
: 0.6
2 (a
ccep
tabl
e)St
and
ard
dev
iatio
n: 0
.84

Acta Structilia 2014: 21(2)
14
It is notable from Tables 1 and 2 that not only did the majority of the companies tender on different types of work, i.e., residential/commercial/industrial during the recessionary period (2010-2012), but this option was also found to be the most effective means of ‘keeping their doors open’. The results show that tendering on different types of projects is a solution to help construction companies survive during strident economic times.
Further analysis showed that GB7 and GB8 contractors regarded tendering on more than one type of project as being the most effective, whereas GB9 contractors considered tendering in foreign areas as being the most effective.
4.3 Turnaround strategies
The respondents were requested to state whether they implemented any of the listed turnaround strategies between 2010 and 2012 when there was a low level of activity in the construction industry, by stating ‘Yes’ or ’No’. It should be noted that some companies made use of more than one strategy.
The turnaround strategies included the following:
• Strategic realignment of resources;• Profit-margin lowering;• Boosting turnover, rather than focusing on high profit levels;• Retrenchment, and• Selling plant and land not required for core work.
Figure 1 shows the percentage ‘Yes’ and ’No’ responses to the various turnaround strategies used.
The findings indicate that 86% of the respondent companies strategically re-aligned their resources; 82% of the companies lowered their profit margins; almost 70% of the respondents opted to boost their turnover rather than to focus on high profit levels; 41% of the companies retrenched some of their staff members, and 36% indicated that they sold plant and land that was not required for core work.
The three most used turnaround strategies involved merely a change of strategy (without necessarily getting rid of human resources, and or plant/land), whereas the two least implemented strategies required companies to do this. Such course of action may prove to be disastrous in booming times.

Buys & Van Rooyen • The strategic management of construction ...
15
Figure 1: Turnaround strategies
4.4 Key elements of an implementation strategy
When new strategies are implemented within an organisation, it is imperative that certain steps be taken and certain elements included, in order to ensure a smooth and effective implementation. If not, this could result in a negative impact on the effectiveness of the new strategy.
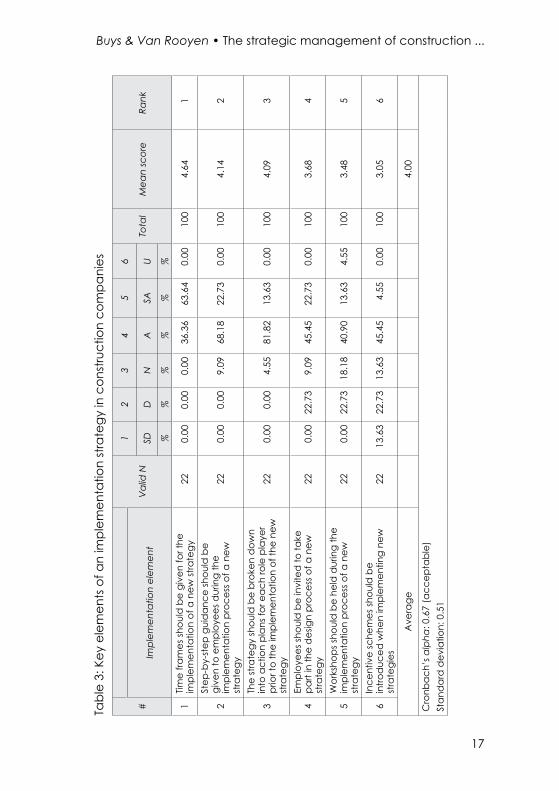
The respondents were requested to state to what extent they agreed that the listed elements were necessary, in order to ensure an effective implementation of any new strategy within the organisation (where 1=strongly disagree, 2=disagree, 3=neutral, 4=agree, 5=strongly agree, and 6=unsure.) Table 3 shows to what extent respondents agreed that the listed elements are part of an implementation strategy for construction companies.
The average MS of the ‘Key elements score’ is fairly high (4.00) on the scale. This means that respondents generally ‘agree’ with the key elements of an implementation strategy within construction companies.
The results in Table 3 show that the respondents ‘strongly agreed’ that time frames should be given for the implementation of a new strategy (MS=4.64), and they ‘agreed’ that step-by-step guidance should be given to employees during the implementation process of a new

Acta Structilia 2014: 21(2)
16
strategy. Employees are frequently unfamiliar with new strategies; therefore, they should be guided to ensure that these new strategies are effective when implemented.
Respondents also ‘agreed’ that the strategy should be broken down into action plans for each role player prior to the implementation of the new strategy (MS=4.09), thereby indicating that a new strategy should not merely be a strategy ‘on paper’, but should have action plans in place to ensure that it is actually implemented. Furthermore, they ‘agreed’ that employees should be invited to take part in the design process of a new strategy (MS=3.68), and that workshops should be held during the implementation process of a new strategy (MS=3.48). This is in-line with the need for step-by-step guidance, as stated earlier. The results show that the use of time frames to implement new business strategies will help construction companies survive during strident economic times.
Respondents were ’neutral’ regarding whether incentive schemes should be introduced when implementing new strategies (MS=3.05); this finding could be interpreted as it being unnecessary to provide incentives.
Further analysis indicated that GB7, GB8 and GB9 contractors individually also ranked ‘time frames’ as being the most important (rank 1st). GB7 contractors ranked ‘step-by-step guidance to be given to employees during the implementation process’ as the second highest; GB8 contractors ranked ‘the strategy should be broken down into action plans for each role player prior to the implementation of the new strategy’, as being the second highest priority, and GB9 contractors ranked the necessity of ‘holding workshops during the implementation process of a new strategy’ as the second highest priority.
The GB7 and GB9 contractors ranked ‘the strategy should be broken down into action plans for each role player prior to the implementation of the new strategy’ as being the third highest, and GB8 contractors ranked ‘step-by-step guidance to be given to employees during the implementation process’ as the third highest priority.
Buys & Van Rooyen • The strategic management of construction ...
17
Tabl
e 3:
Key
ele
men
ts o
f an
impl
emen
tatio
n st
rate
gy in
con
stru
ctio
n co
mpa
nies
#V
alid
N
12
34
56
Tota
lM
ean
scor
eRa
nkIm
plem
enta
tion
elem
ent
SDD
NA
SAU
%%
%%
%%
1Tim
e fra
mes
shou
ld b
e gi
ven
for t
he
impl
emen
tatio
n of
a n
ew st
rate
gy22
0.00
0.00
0.00
36.3
663
.64
0.00
100
4.64
1
2
Step
-by-
step
gui
dan
ce sh
ould
be
give
n to
em
ploy
ees d
urin
g th
e im
plem
enta
tion
proc
ess o
f a n
ew
stra
tegy
220.
000.
009.
0968
.18
22.7
30.
0010
04.
142
3
The
stra
tegy
shou
ld b
e br
oken
dow
n in
to a
ctio
n pl
ans f
or e
ach
role
pla
yer
prio
r to
the
impl
emen
tatio
n of
the
new
st
rate
gy
220.
000.
004.
5581
.82
13.6
30.
0010
04.
093
4Em
ploy
ees s
houl
d b
e in
vite
d to
take
pa
rt in
the
des
ign
proc
ess o
f a n
ew
stra
tegy
22
0.00
22.7
39.
0945
.45
22.7
30.
0010
03.
684
5W
orks
hops
shou
ld b
e he
ld d
urin
g th
e im
plem
enta
tion
proc
ess o
f a n
ew
stra
tegy
220.
0022
.73
18.1
840
.90
13.6
34.
5510
03.
485
6In
cent
ive
sche
mes
shou
ld b
e in
trod
uced
whe
n im
plem
entin
g ne
w
stra
tegi
es22
13.6
322
.73
13.6
345
.45
4.55
0.00
100
3.05
6
Ave
rage
4.00
Cro
nbac
h’s a
lpha
: 0.6
7 (a
ccep
tabl
e)St
and
ard
dev
iatio
n: 0
.51

Acta Structilia 2014: 21(2)
18
5. Conclusions The literature revealed that many construction organisations encountered difficulties with profitability in the construction industry between August 2010 and December 2012.
The results showed that the majority of the respondent companies tendered on more than one type of work (residential, commercial and/or industrial projects) during recessionary times, whereas they normally tendered on one type of work only. It was also noted that not only did the majority of the companies tender on different types of work, i.e., residential/commercial/industrial during the recessionary period (2010-2012), but this was also found to be the most effective means of keeping the construction company viable. However, respondents were of the opinion that buying into businesses that do not have any link to the company’s core construction business, and buying into other companies that do the same work as their company, were the least effective means of surviving.
In terms of turnaround strategies, it was found that the majority of the companies strategically re-aligned their resources, lowered their profit margins, or opted to boost their turnover rather than to continue focusing on high levels of profit during recessionary times. During the implementation process of a new strategy, it is very important that time frames be given for the implementation of any new strategy, and that step-by-step guidance be given to the employees of a construction company.
In conclusion, based on the results, construction companies could diversify their strategies, tender on different types of projects, and use time frames to implement new business strategies in order to help them survive during strident economic times.
6. Recommendations Construction companies are advised to diversify their work during recessionary times by tendering on different types of work, or even buying into firms that do work which complements their company (for example, subcontractors and suppliers of building material). Other possibilities include going into joint ventures or tendering for work in foreign countries. Construction companies should avoid buying into other companies that do the same type of work as their own company.
Companies should also strategically re-align their resources when there is a low level of construction activity, and even lower their profit margins. When new strategies are implemented, it is very important

Buys & Van Rooyen • The strategic management of construction ...
19
that time frames be given for the implementation of the new strategy to ensure that employees are guided throughout the implementation thereof. During the implementation of these strategies, emphasis should be placed on the deadline when the new strategy needs to be fully operational, as well as step-by-step guidance sessions to ensure that the new systems are fully operational and remain fully functional. These sessions need to mobilise all the relevant members of staff into their new roles and responsibilities, in order to fulfil the new strategy of the organisation.
AcknowledgementsThe authors are grateful to Drs Danie Venter and Jacques Pietersen of the Nelson Mandela Metropolitan University, Port Elizabeth, South Africa, for their statistical assistance and advice, and Mr Patrick Goldstone for his editorial assistance.
References listConstruction Industry Development Regulations, 2004 (as amended) as at 14 November 2008. 2008. [Online]. Available from: <http://www.cidb.org.za/Documents/KC/cidb_Publications/Leg_Regs/other_leg_regs/leg_regs_regulation_amended_14nov08.pdf> [Accessed: 10 July 2013].
Cusumano, M.A. 2010. Staying power. New York: Oxford University Press.
Dawes, J. 2008. Do data characteristics change according to the number of scale points used? An experiment using 5-point, 7-point and 10-point scales. International Journal of Market Research, 50(1), pp. 61-74.
Ehlers, T. & Lazenby, K. 2010. Strategic management: South African concepts and cases. Pretoria: Van Schaik Publishers.
Engineering News. 2011. Construction industry research report released by Creamer Media. [Online]. Available from: http://www.engineeringnews.co.za/article/construction-industry-research-report-released-by-creamer-media-2011-06-06 [Accessed: 10 April 2013].
Engineering News. 2013. Creamer media publishes Construction 2013: A review of South Africa’s construction sector electronic report. [Online]. Available from: http://www.engineeringnews.co.za/article/creamer-media-publishes-construction-2013-a-review-of-south-africas-construction-sector-electronic-report-2013-03-04 [Accessed: 5 June 2013].

Acta Structilia 2014: 21(2)
20
Goldman, A., Maritz, R., Nienaber, H., Pretorius, M., Priilaid, D. & Williams, D. 2010. Strategic management: Supplement for South Africa. Cape Town: Pearson Education.
Groenewald, D., Le Roux, S.J. & Rossouw, D. 2007. Strategic management: An applied South African perspective. Cape Town: New Africa Books.
Harris, F. & McCaffer, R. 2006. Modern construction management. 6th edition. Oxford: Blackwell Publishing.
Hitt, M.A., Hoskisson, R.E., Ireland, R.D., Morgan, R.E., Reinmoeller, P. & Volberda, H.W. 2011. Strategic management: Concepts and cases competitiveness and globalization. Andover, Hampshire: Cengage Learning.
Jamieson, S. 2004. Likert scales: How to (ab)use them. Medical Education, 38(12), pp. 1212-1218.
Johnson, G., Scholes, K. & Whittington, R. 2008. Exploring corporate strategy: Text and cases. 8th edition. Harlow, Essex: Pearson Education.
Leedy, P.D. & Ormrod, J.E. 2005. Practical research planning and design. 8th edition. Upper Saddle River, New Jersey: Pearson Education.
Maree, K. & Pietersen, J. 2007. Surveys and the use of questionnaires. In: Maree, K. (Ed.). First steps in research. Pretoria: Van Schaik Publishes, pp.155-170.
Rego, N. 2010. Building sector may shed jobs. [Online]. Available from: <http://www.fin24.com/Business/Building-sector-may-shed-jobs- 20100113> [Accessed: 15 January 2013].
Nunally, J. 1979. Psychometric theory. 2nd edition. New York: McGraw-Hill.
Reverso. n.d. Portal of linguistic tools. [Online]. Available from: <http://dictionary.reverso.net/english-cobuild/company> [Accessed: 25 May 2012].
SAPA. 2009. South Africa joins global recession. [Online]. Available from: <http://www.southafrica.info/news/business/33972.htm> [Accessed: 10 December 2011].
SAPA (South African Press Association). 2011. Bleak outlook for construction sector. [Online]. Available from: <http://www.fin24.com/Economy/Bleak-outlook-for-construction-sector-20110117> [Accessed: 6 June 2012].
Buys & Van Rooyen • The strategic management of construction ...
21
SAPA (South African Press Association). 2013. SA construction industry takes a dip. [Online]. Available from: <http://www.iol.co.za/business/news/sa-construction-industry-takes-a-dip-1.1616249#.UsFxLlKIprA> [Accessed: 4 December 2013].
Slabbert, A. 2010. Grim outlook for construction firms. [Online]. Available from: <http://www.fin24.com/Business/Grim-outlook- for-construction-firms-20100630> [Accessed: 11 January 2011].
Steyn, G. 2011. Confidence declines again. [Online]. Available from: <http://www.fin24.com/Finweek/Trends/Confidence-declines-again-20110425> [Accessed: 11 January 2012].
Temtime, Z.T. 2000. Reducing strategic uncertainty through environ-mental scanning. In: Groenewald, D., Le Roux, S.J. & Roussow, D. (Eds). Strategic management: An applied South African perspective. Cape Town: New Africa Books, pp.1-14.
Wegner, T. 2012. Applied business statistics: Methods and Excel-based applications. 3rd edition. Cape Town: Juta.
Williams, N. & Williams, S. 2007. The profit impact of business intelligence. San Francisco, California: Morgan Kaufmann Publishers.

22
Hoffie Cruywagen
Towards the establishment of a relevant national tender price index for the South African building industry
Peer reviewed and revised
AbstractThere is currently only one published tender price index available in South Africa for use by built-environment practitioners. The purpose of this article is to report on an investigation into the nature of a more recent tender price index.A literature study was conducted to examine the theory of indices in order to establish which type of index as well as which formula would be appropriate for use in South Africa. Thereafter, the priced bills of quantities of a selected number of projects were analysed in order to identify representative indicator items as well as the weighting thereof for an index. Thirty-two indicator items were identified that could be used for calculating an index. In addition, sourced priced bills of quantities for a number of projects over a six-and-a-half year period were analysed to calculate average rates for the 32 selected indicator items. These rates, together with the established weightings of items, were used to calculate an index.The main finding that emerged from the research was that, by using the above methodology, an alternative tender price index could be determined for use by the South African building industry.Keywords: Indices, bills of quantities, rates
AbstrakDaar is tans slegs een gepubliseerde tenderprysindeks beskikbaar in Suid-Afrika vir gebruik deur bou-omgewing praktisyns. Die doel van hierdie artikel is om verslag te lewer oor ’n studie wat gedoen is oor hoe ’n meer onlangse tenderprysindeks daar sou uitsien.’n Literatuurstudie is uitgevoer om die teorie van indekse te bestudeer. Dit is gedoen ten einde te bepaal watter tipe indeks asook watter formule die mees geskikte sou wees vir gebruik in Suid-Afrika. Daarna is die gepryste hoeveelheidslyste van geselekteerde projekte ontleed om verteenwoordigende aanwyseritems te bepaal asook die gewigte daarvan. Twee-en-dertig verteenwoordigende aanwyseritems wat gebruik kan word vir die berekening van die indeks is geïdentifiseer. Verdere ontleding van ingewinne gepryste hoeveelheidslyste van ’n aantal projekte oor ’n ses-en-’n-halfjaar tydperk is gedoen om gemiddelde tariewe vir die gekose 32 aanwyseritems te bepaal.
Mr Hoffie Cuywagen, Senior Lecturer, Department of Construction Economics, University of Pretoria, South Africa. Telephone: +27 12 4204973, Email: <[email protected]>
Cruywagen • Towards the establishment of a relevant national ...
23
Hierdie tariewe, saam met die bepaalde gewigte van die items, is gebruik vir berekening van ’n indeks.Die belangrikste bevinding van die studie is dat deur gebruik te maak van bostaande metodologie kan ’n tenderprysindeks daargestel word vir alternatiewe gebruik deur die Suid-Afrikaanse bou-industrie. Sleutelwoorde: Indekse, hoeveelheidslyste, tariewe
1. IntroductionConstruction-cost indices are used on a daily basis in the industry for cost planning (Kirkham, 2007); forecasting (Flemming & Tysoe, 1991: 18, 21; Yu & Ive, 2008: 694; Ashworth, 1991); updating cost estimates (Brook, 1974: 54; Ferry, Brandon & Ferry, 2003: 154); updating of tenders (Van der Walt, 1992: 1.1; Seeley, 1996: 224; Segalla, 1991: 44); monitoring price movements (Ferry et al., 2003: 176); replace ment cost of buildings (Segalla, 1991: 47; Kilian, 1980; Akintoye, Bowen & Hardcastle, 1998: 161); monitoring the national economy (Statistics Norway, 2007), and negotiation of contracts (Brook, 1974: 55; Statistics Finland, 2001: 52).
According to Mohammadian & Seymour (1997: 1), a number of role players in the building industry, such as producers and purchasers of construction projects, suppliers and manufacturers of construction products, designers, quantity surveyors, cost estimators and budget managers, can use cost indices. As there is currently only one tender price index in use in South Africa (the index of the Bureau of Economic Research [BER] of the Stellenbosch University) which uses 22 representative indicator items (Marx, 2005: 8), the author identified the need to conduct a study on the use and compilation of cost indices which might lead to the construction of a possible new tender price index for the South African building industry.
In order to construct a possible new tender price index for the South African building industry, 32 representative indicator items were sourced from priced bills of quantities over a six-and-a-half year period to calculate average unit rates which, in conjunction with the established weightings of items were used to calculate a new index. If the BER index, which, as deemed by some, is outdated and, therefore, no longer accurate, it could have a negative influence on a number of activities of these industries. On the other hand, if the BER index is still accurate, a new index would still be useful, as quantity surveyors and other users of the index could then use it as a checking mechanism in conjunction with the BER index. A new index would, therefore, make an important contribution to the quantity-surveying profession in South Africa.

Acta Structilia 2014: 21(2)
24
2. Index theory
2.1 Indices in general
Steyn, Smit, Du Toit & Strasheim (2007: 250) define an index as “[a] ratio that measures relative change”, whereas Flemming & Tysoe (1991: 1) state that “[i]ndex numbers of cost and prices provide a convenient means of expressing changes over time in the cost or prices of a group of related products in a single measure”. Another way of explaining an index is to state that index numbers are intended to show the average percentage changes in the value of certain products at a specific time, compared to another time. Furthermore, Marx (2005: 3) is of the opinion that indices only measure relative numbers and can, at best, only give an indication of the measure to which a variable, compared to an earlier period, has changed. Therefore, most index figures cannot be very accurate, being unable to reflect information regarding the actual level of a variable.
2.2 Types of indices
Steyn et al. (2007: 252) are of the opinion that one must distinguish between simple and composite indices, on the one hand, and un-weighted and weighted indices, on the other. A simple index is used to represent the price change of a single commodity, whereas a composite index represents the price changes of more than one commodity. In addition, when an un-weighted composite price index is calculated, the price changes of all commodities are regarded as equal, while in a weighted composite index, different weights are allocated to the different commodities.
All the important indices used in the construction industry are weighted composite indices. According to Yu & Ive (2008: 704-705), the two most popular indices used are the following:
The Laspeyres price index, for which the formula for calculating the index is:
Pl = 𝛴 pnqo x 100 (price in current period x base weight) x 100 𝛴 poqo (price in base period x base weight)
This formula thus calculates a base-weighted (or fixed basket) index, where the relative quantities of the base period provide the weighting.
The Paasche index has the following formula:
Pp = 𝛴 pnqn x 100 (weight in current period x price in current period) x 100 𝛴 poqn (weight in current period x price in base period)

Cruywagen • Towards the establishment of a relevant national ...
25
This formula calculates a current weighted price index, where current prices are compared with the base-year prices.
2.3 Indices in the construction industry
Flemming & Tysoe (1991: 41, 57, 133) and Eurostat (1980: 89-90) state that the following three main types of indices are used in the construction industry.
2.3.1 Input price index
The primary objective of such an index is to reflect local market prices and it can, therefore, be used to reimburse the contractor in respect of cost increases in labour and material. An example of such indices is the Construction Price Adjustment Provision indices published by Statistics South Africa on a quarterly basis.
2.3.2 Output/tender price index
Such indices attempt to measure the total cost of construction of a completed structure in each location, taking into account local conditions, changes in productivity, and contractors’ profit margins. For these type of indices, both the Laspeyres index (example: BER building-cost index) as well as the Paasche index (example: Building Cost Information Services (BCIS) index in the UK) may be used.
2.3.3 Seller’s price index
Such an index, according to Statistics Norway (2007), includes not only all the costs of the completed construction project, but also the cost of land, finance costs, professional fees, VAT, and the seller’s profit. This type of index is not used a great deal in the South African building industry.
2.4 Factors influencing the composition of indices
The following factors influence the composition of indices and should be taken into account when constructing a new index.
2.4.1 Availability of data
Sufficient data in the correct format should be available on a continual basis for any index to succeed (Akintoye, 1991: 27). For a tender price index, priced bills of quantities can be used as a data source if there are a sufficient number of projects available on a long-term basis. Priced bills of quantities provide a valuable source

Acta Structilia 2014: 21(2)
26
of information on unit rates of the various building elements. Van der Walt (1992: 3.3) is of the opinion that an index based on starting rates, as is found in tender documents, will be of greater value than using final account rates.
2.4.2 Selection of items
Selecting the items for inclusion can be difficult when constructing an index, especially if there are a number of possible items that can be included. Steyn et al. (2007: 261) suggest that a representative sample of items be selected from the survey population and that only these items be used in the index.
2.4.3 Base period/year
A number of authors (Akintoye, 1991: 27; Flemming & Tysoe, 1991: 33; Steyn et al., 2007: 260) conclude that the period chosen as the base (or reference) period should be one of relative economic stability with no ‘unusual’ occurrences such as wars, abnormal climatic conditions, serious recessions, and so forth.
2.4.4 Choice of weights
As discussed earlier under “selection of items”, it is possible to achieve a reliable index by significantly reducing the number of items that form part of the index. When these selected items are not of equal importance, the choice of weights for these items becomes very important. Akintoye (1991: 27) opines that the weights assigned to various items reflect their relative importance and should be carefully chosen in order to avoid biased and misleading results. This principle is commonly known as selecting a ‘basket of goods’. When using bills of quantities to be used in an index, Seeley (1996: 228) concludes that the major items incorporating the largest price extension in each trade of the bills of quantities should be included in the index.
Marx (2005: 6) cites Mitchell (1971) who has shown that, by selecting various items which represent as little as a 25% sample of the total contract value, an accepted level of reliability may be achieved. However, Marx (2005: 7) cautions that, after a period of time, such weights will have to be revised in order to accommodate changes in the quality of materials, improved construction techniques, and so forth. Statistics Finland (2001: 18) as well as The Statistics Directorate, European Union (1997: 33) support this observation by mentioning that weights for construction indices should be revised every five to ten years.

Cruywagen • Towards the establishment of a relevant national ...
27
2.4.5 Method of construction
As discussed earlier, the most frequently used indices in the building industry are the Laspeyres and the Paasche indices (Yu & Ive, 2008: 704-705).
2.5 Problems with indices
There are some inherent problems in the use of tender price indices. The following are some of the major problems as indicated in the literature:
2.5.1 Accuracy of the index
Van der Walt (1992: 4.72) mentions that an index is relative; in other words, it is not its absolute value that matters, but its tendency over time. It is, therefore, more of an economic model giving a general trend of change over time.
2.5.2 Sample size
To determine an adequate number of respondents is, to a large extent, a sampling question: the larger the number of respondents, the more detailed will the index be that is produced. Ferry et al. (2003: 193) mention that, in a tender-based index, a good sample of priced bills of quantities is required to avoid bias such as regional variations. Although the literature is vague about the actual number of priced bills of quantities that are required for an index, authors that comment on the BCIS’s tender price index conclude that the BCIS aims at sampling 80 projects per quarter, although this requirement is seldom met.
2.5.3 Changes in quality
Building quality and specifications have changed over time because of advances in building technology. As a typical index will measure the trend of building costs of a typical building, these changes in quality may not be taken into account. One way of overcoming this problem is to review the basket of items on a regular basis so that the components and their weights reflect the changes in standards and technology (Marx, 2005: 7).
2.5.4 Unit rates
According to Marx (2005: 8), the unit rates in bills of quantities can differ markedly. The reasons for these are the different approaches by tenderers to determine such rates, allowances made for inflation, and so forth.

Acta Structilia 2014: 21(2)
28
3. Indices in South AfricaVan der Walt (1992: 2.3) states that no officially published building cost-related indices existed in South Africa until the 1960s. Some local firms developed their own indices, mostly by re-pricing existing bills of quantities, but these were never officially published.
3.1 The building-cost index of Stellenbosch University’s Bureau of Economic Research
During the early 1960s, a quantity surveyor responsible for research and development at the then Department of Public Works (DPW) in Pretoria, D. Brook, developed an index for use by the DPW (Brook, 1974). The Bureau of Economic Research (BER) of the Stellenbosch University was seeking a deflator for building prices in the mid-1960s and, according to Kilian (1980: 30), obtained permission from the DPW to take over this index.
Marx (2005: 5) reports that the index is based on a 100m2, single-storey building to which a concrete slab was later added. From this building, 22 cost components were selected and expressed as quantities. Segalla (1991: 55) states that the reason for using these 22 components is that they are representative items from the original building and are weighted in proportion to the role they play in the total cost.
The index is obtained by multiplying each of the 22 weighted components with the current tariff of the items. The information on which the index is based is supplied by quantity surveyors and is submitted on a standard form supplied by the BER. The sum of the current market-related tariffs, multiplied by the base-period quantities, is then divided by the sum of the base-period tariffs multiplied by the base-period quantities. It is thus clear that the BER index is a Laspeyres index. Segalla (1991: 56) notes that, in order to ensure that correct comparisons are made, the index allows a 5% “P & G” amount (currently referred to as “preliminaries”) per project. According to Segalla (1991: 56), the 5% was derived from norms established during previous analyses.
Quantity surveyors who submit information to the BER on completed projects are also required to indicate the amounts for electrical work, lifts, air conditioning, and rates for different types of sanitary fittings. In this regard, Segalla (1991: 48) mentions that the amounts for electrical work, lifts and air conditioning are calculated as percentages of the specific contract and, when the index is published, the average percentages for this work section in a specific quarter are given. These

Cruywagen • Towards the establishment of a relevant national ...
29
percentages, as well as the published average rates per sanitary fitting, have no bearing on the index and are given as additional information.
3.2 The contract price index for buildings
Very little is known about this index, except that it was compiled by Van der Walt, a quantity surveyor in private practice in Pretoria. The research that was done in the compilation of the index was adapted and presented as part of a PhD thesis in 1992 at the University of Pretoria, but the study was already done in the early 1970s (Van der Walt, 1992: ii). The details of the index were made available to the then Central Statistical Services (CSS), currently known as Statistics South Africa, and published as Statistical Newsletter P0153 since 1980. Due to budget cuts in the CSS, this publication was discontinued in June 1998 (Klaas, 2011: personal communication).
The methodology used for this index was also based on a Laspeyres index with fixed base-year weights. The rates of approximately 270 items that appeared in bills of quantities were surveyed from quantity surveyors and used to publish a contract price index for buildings as well as the weighted average price indices according to region on a quarterly basis (Van der Walt, 1992: 5.2).
4. Constructing a new indexBased on the literature reviewed, the factors that should be considered before constructing an index include a selection of the constituent items as well as the choice of the weights. After determining these factors, the steps towards calculating the index can be followed. For purposes of this article, the following steps have been followed:
• Draw sample of bill of quantities; make adjustments. • Detail analysis of trades using 5% value (for weights). • Select indicator items from step 2.• Request further bills of quantities. • Analyse rates of indicator items per quarter. • Average unit rates; smooth out (3-quarter moving average).• Calculate index.
4.1 Constituent items
In the choice of formula, it was decided to steer the investigation in the direction of a fixed weight, short-list method with priced bills of quantities as basis (Laspeyres index). The main reason for not using

Acta Structilia 2014: 21(2)
30
the Paasche index is because of the unavailability of a so-called ‘price book’ as in the United Kingdom. Such a price book is compiled annually and can be used to re-price bills of quantities with base rates, as has been done by the BCIS.
Preliminaries form an important part of any contract and can fluctuate between contracts and varying economic climates. The BER allows a 5% fixed amount per project. For this article, however, it was decided to spread the preliminaries as priced for each project as a percentage across all rates.
Neither the BER nor the BCIS makes any provision for provisional amounts/sums in their indices. As provisional amounts, as currently priced in contracts in South Africa, can be as high as 40% to 50% of the contract amount, it is considered to be an important item that should form part of a new index. The decision was, therefore, made to include the amounts for the main items such as electrical and mechanical installations on own merit in the index.
Influence of region and site – Although it is anticipated that there will be differences in the prices of labour and material across different regions, only the rates will be influenced by it. This problem can be overcome if a sufficient number of priced bills of quantities can be sourced and averaged rates used. Regarding differences in site conditions, this will be reflected in the rates for poor soil conditions and no other rates would be influenced by it.
4.2 Determination of a new basket of items and their weights
It was mainly decided that the calculation of a new index will be based on fixed weight, short-list method of indicator items, because priced bills of quantities are freely available, as it is still one of the preferred procurement methods in South Africa. In order to establish weights for such an index, it was decided to use the analysis of a variation of buildings to compose an ‘average’ representative building. This method is, in essence, using the analysis of a variation of different building types to compose an ‘average’ representative building. Using averages is an accepted method of calculating construction price indices, as indicated by Van der Walt (1992: 4.32) who states that a set of standard weights may be used for all buildings. In Finland the weights of the building-cost index are based on the estimated share of four different types of projects (flats, houses, offices and warehouses) (Statistics Finland, 2001: 8).
First, in order to determine these weights, a sample of buildings that could be regarded as representative of the South African building

Cruywagen • Towards the establishment of a relevant national ...
31
industry were determined. The information used for this was that published by Statistics South Africa, viz. Statistical release P5041.3, Selected building statistics of the private sector as reported by local government institutions, 2008 (Statistics South Africa, 2009). Table 1 shows the selected sample.
Table 1: Value of completed buildings by municipalities, 2008 Building type Total value (R’000) % of total
Office and banking space 4 805 301 35Shopping space 3 636 047 27Industrial and warehouse space 3 714 338 27Schools, nursery schools, hospitals, and so on 145 406 1Churches, sport and recreation clubs, and so on 282 209 2All other non-residential spaces 137 826 1Hotels, holiday chalets, tourism accommodation, and so on 892 815 7
Total 13 613 942 100
Source: Adapted from Statistics South Africa statistical release P5041.3
Secondly, the actual amount of priced bills of quantities needs to be analysed in order to have sufficient information to determine weights that could be regarded as representative of an average building in South Africa. As the literature does not indicate anything specific in this regard, it was decided, in conjunction with the Department of Statistics at the University of Pretoria, to first analyse 20 buildings, then another 10, and finally another 10. At this stage, it was found that the difference in the average percentages that were calculated for the various trades decreased as the number of projects increased. It was thus decided to analyse only 40 priced bills of quantities of different projects.
In terms of the sample of building types that were identified previously from data published by Statistics South Africa, a proportional allocation could be made for the 40 projects that were to be sourced. Table 2 shows the number of bills of quantities per project type; however, in comparison with the percentages as calculated in Table 1, it was decided to reduce the number of industrial buildings. At the same time, it was decided to increase the number of schools and hospitals and to include a block of flats in order to provide a better balance to the projects. Housing was deliberately excluded from the selection because of the different nature thereof (e.g., mostly single storeys with moderate levels of specification), compared with more sophisticated projects such as offices, shops, and so on. Provision was made in

Acta Structilia 2014: 21(2)
32
the selection for single-storey buildings to include a single-storey primary school.
Table 2: Number of bills of quantities per project type Building type Number % of total
Office space 12 30Shopping space 10 25Industrial space 8 20Schools and hospitals 3 7,50Churches 1 2,50All other non-residential spaces 1 2,50Hotels, holiday chalets 4 10Flats 1 2,50Total 40 100
4.3 Steps towards calculating the index
Step 1: Draw sample of bill of quantities and make adjustments
Purposive sampling was used to collect bills of quantities for the analysis. A number of well-known quantity-surveying firms throughout South Africa were contacted via e-mail with the request to submit priced bills of quantities for new or so-called ‘green fields’ projects that were executed between 2005 and 2008. A number of firms responded and a total of 183 priced bills from 27 different firms were received. From these projects another purposive sample was drawn to match the selection of 40 projects needed.
First, some adjustments were made, viz. by omitting allowances for contingencies and the External Works trades, and then adjusting the Preliminaries amounts pro-rata. Secondly, the arithmetic mean for each trade per project was calculated and this average was then expressed as a percentage of the arithmetic mean of all projects. It became evident from this analysis that not all trades, as indicated in the Standard System of Measuring Building Works (ASAQS, 1999), are always present in a project. As a result, the less represented trades such as Alterations, Lateral Support, Piling, Precast Concrete and Paperhanging, were omitted from inclusion in the index. Table 3 shows the chosen trades, expressed as percentages (or possible weights), of an ‘average’ building.

Cruywagen • Towards the establishment of a relevant national ...
33
Table 3: Trades’ percentages Trade Percentage
Earthworks 2.70Concrete, formwork and reinforcement 20.00Masonry 8.40Waterproofing 1.10Roof coverings 3.50Carpentry and joinery 4.60Ceilings, partitions and access flooring 3.40Floor coverings, wall linings, and so on 1.10Ironmongery 0.70Structural steelwork 6.20Metalwork 6.80Plastering 3.40Tiling 3.30Plumbing and drainage 3.90Glazing 0.20Paintwork 1.80Provisional sums 28.90Total 100
The chosen projects were all measured according to the Standard System of Measuring Building Works (ASAQS, 1999) with no or little alteration works involved; it was sourced from the entire country (seven of the nine provinces were represented), and the value of the projects ranged between R2.78m and R568m.
Step 2: Detailed analysis of trades using 5% value (for weights)
Step 2 included a detailed analysis of all the trades in the various bills of quantities. In order to keep to the objective of identifying the minimum number of items to make up a short-list of items, each project’s bills of quantities were analysed by selecting all the measured items with a monetary value of more than 5% of the total value of that particular trade. The 5% value is an arbitrary value, as the literature is not clear on this aspect. In this article, on a trial-and-error basis, 5% of the trade value was deemed to give an acceptable lower line of demarcation prior to items becoming insignificant in value. It was found that, with the 5% rule that was adopted, the average number of items selected amounted to 24.7% of the total. These items represented 75.6% of the total adjusted contract amount and, therefore, compares favourably with the BCIS index, where 25% of the items are considered to be adequate for evaluation. Table 4 gives an example of the trade analysis of one project.

Acta Structilia 2014: 21(2)
34
Table 4: Extract for bills of quantities analysis
Trade Trade total
5% of trade Item value % of
trade% of adj. tender
C, F & R 2 357 886 117 84925MPa r.conc. in strip footings 333 500 14.14 2.03
25MPa r conc. In surface bed 322 872 13.69 1.97
25MPa r conc. In slabs, beams 271 400 11.51 1.65
Rough formwork to soffits 167 485 7.1 1.02193 fabric reinforcement 175 240 7.43 1.07High tensile 20-32mm 141 450 6.00 0.86High tensile 10-16mm 317 860 13.48 1.90Total 1 729 810 73.36 10.53
As is clear from Table 4, the value for the trade Concrete, formwork and reinforcement of this project was R2 357 886, with 5% of this amounting to R117 894,30. Seven items were identified with amounts of over 5% of the trade value, as indicated. These seven items represent just over 73% of the trade value and 10.5% of the adjusted tender amount.
Step 3: Select indicator items from step 2
In step 3, all the identified items in step 2 were carried to a spreadsheet indicating all items for all trades to determine which could be selected as indicator items in terms of both the frequency of occurrence and the weight they represent. After some adjustments were made, especially in the Preliminaries trade, the provisional amounts allowed for measurable trades (such as structural steel, aluminium windows and doors, timber fittings, plumbing and drainage, floor and wall tiling, and so forth) were removed and allocated to the various trades where they belong. Of these items, those with the most frequent occurrence were identified. An example of this is the Concrete, Formwork and Reinforcement trade, where a total of 35 items were identified as having a value of over 5%. The most frequent items were the following:
• 25MPa reinforced concrete in strip footings (37 out of the 40 projects).
• 25/30MPa reinforced concrete in surface beds (39).• 25/30MPa reinforced concrete in slabs and beams (34).• Rough/smooth formwork to soffits of slabs 1.5 to 3.5m high (34).• High tensile steel reinforcement 20 to 32mm in diameter (33).• High tensile steel reinforcement 10 to 16mm in diameter (37).

Cruywagen • Towards the establishment of a relevant national ...
35
Four clear groups can be identified from this trade, with the following distribution:
• Concrete: 8.80%• Formwork: 3.46%• Reinforcement: 7.22%• Other: 0.52%• Total percentage for trade: 20.00%
The same principles were followed with all other trades, some of which were more complex than others, with a large number and variety of items, e.g., Ironmongery, Plumbing and Drainage, and so forth. Resulting from this, 32 indicator items were identified that could be used for calculating an index. There is no indication in the literature on how many items should be necessary to calculate an index (a similar index in Finland consists of 60 items [Statistics Finland, 2001], while one in Ireland uses 40 [Farrely, 2010: personal communication]). From the methodology that was followed, however, the 32 items can be deemed to be adequate to satisfy the requirement of having enough representative items in terms of monetary value to calculate an index. The final weightings for the various groups and items are indicated in Table 5.
Table 5: Final weights according to groups and indicator items
Categories and indicator items % (items)
% (category)
Earthworks 2.70Excavate not exceeding 2m deep for trenches 2.00Extra over excavations for carting away surplus material from site 0.70Concrete, formwork & reinforcement 20.0025/30MPa reinforced concrete in surface beds 3.4025/30MPa reinforced concrete in slabs, beams, inverted beams 5.60Rough/smooth formwork to soffits of slabs propped 1.5-3.5m high 3.60High tensile steel reinforcement 10-16mm diameter 7.40Masonry 8.40One-brick walls 7.10Extra over ordinary brickwork for face brickwork 1.30Waterproofing 1.10250-micron waterproof sheeting under surface beds 0.304mm waterproofing system on concrete roofs 0.80Roof coverings 3.500.6mm galvanised steel sheet roof coverings with Chromadek finish 3.00Insulation with roof coverings 0.50Carpentry and joinery 4.60Wrought hardwood skirting 2.20

Acta Structilia 2014: 21(2)
36
Categories and indicator items % (items)
% (category)
Single semi-solid door with veneer both sides 2.40Ceilings, partitions and access flooring 3.40600x600x12.5mm vinyl suspended ceilings below concrete slab 3.40Floor coverings, plastic linings, and so on 1.10500x500mm carpet floor tiles to screeded floors 1.10Ironmongery 0.70Two-lever mortise lockset 0.70Structural steelwork 6.20Welded and bolted columns, beams, and so on 6.20Metalwork 6.80Galvanised pressed steel single rebated frame for door 813x2032mm suitable for half-brick walls 0.40
Aluminium windows and doors 6.40Plastering 3.4025mm thick cement mortar screed on floors 0.90One coat 1:5 internal cement plaster on brick walls 2.50Tiling 3.30300x300mm ceramic tiles fixed to walls with tile adhesive 1.00400x400mm ceramic tiles fixed to floors with tile adhesive 2.30Plumbing and drainage 3.90110mm uPVC soil pipes in ground not exceeding 1m deep 1.10White vitreous china WC close coupled pan and matching 9-litre cistern and double flap seat 2.10
150-litre 400kPa electric water heater complete with control valve, safety valve, vacuum breakers, and so on 0.70
Glazing 0.206mm silvered float glass copper-backed mirror size 400x600mm high fixed with mirror screws 0.20
Paintwork 1.80One coat primer and two coats interior quality PVA emulsion paint on internal walls 1.40
Three coats clear varnish on timber doors 0.40Provisional sums 28.90Electrical installation 16.70Mechanical installation 12.20Total 100.00 100.00
In determining the unit rates, all the selected indicator items were transferred from the spreadsheet to another spreadsheet. This meant that, where more than one unit rate was selected from the priced bills of quantities, now only one would be selected (those that were closest to the original list of indicator items where there was no exact match). Only the rates inclusive of the respective preliminary percentages were used.

Cruywagen • Towards the establishment of a relevant national ...
37
For purposes of this article, the base year to which the estimated weightings related was 2006, as it complied with most of the requirements for a “normal” year, as set out in the literature, e.g., no abnormalities in the levels of production and devoid of abnormal conditions such as war, droughts, floods, and so on (Akintoye, 1991: 27). It also complied with another requirement, namely that it should not be too far in the past (Steyn et al., 2007: 260). Resulting from the above, 2006 was chosen as the base year with a value of 100.
Step 4: Request further bills of quantities
Once the weightings, unit rates and base year were established, further bills of quantities could be requested in order to calculate the index.
In order to obtain a representative sample, another purposive sample was done by requesting price bills of quantities from quantity-surveying firms. A request was e-mailed to firms across South Africa and, ultimately, the bills of quantities of 231 projects received from 37 firms were used. The projects covered the period January 2006 to June 2012 and represented 26 quarters in total. The distribution per year is indicated in Table 6.
Table 6: Number of projects used per yearYear Number of projects2006 292007 312008 392009 362010 482011 362012 12 (1st and 2nd quarters)Total 231
Step 5: Analyse rates of indicator items per quarter
In step 5, all the projects from the bills of quantities were analysed, using an Excel spreadsheet, going through the bills of quantities of each project and listing the tariff of the various items that were selected as indicator items to make up the weighting, as discussed earlier. In the first phase of the analysis, more items were extracted from the bills of quantities than those listed. The reason for this was that, in some instances, the exact item as listed might not have been available, but a close substitute was. An example of such items could be found in the Formwork trade, where items with different propping height and/or

Acta Structilia 2014: 21(2)
38
different slab thicknesses occurred similar to the original indicator item. As decided erlier, the amount for Preliminaries for each project was added proportionally to the rates of that project. Once the above process was concluded for all projects, the analysis was refined by drawing up another spreadsheet, containing only the rates for one indicator item (those that matched or the closest to the original).
Step 6: Average unit rates and smooth out (3-quarter moving average)
During step 6, when analysing the unit rates captured, it was found that there were substantial differences in the unit rates for the same item during the same time period. Various options were considered on how to deal with such outliers in the rates. One option was to set upper and lower limits (e.g., 30% above and 20% below) to the mean rate. If any rates exceeded these upper or lower limits, they were substituted with either the maximum or the minimum rate. Another option mentioned by Van der Walt (1992: 4.34) was to calculate the standard deviation from the mean rate and use this as a limit. However, Van der Walt (1992: 4.34) concluded that by using this method, too many rates would fall outside this limit and, therefore, change the distribution dramatically.
Both of these options were tested. However, after consultation with the Statistics Department at UP, it was decided to use a more simplistic method, where only the highest and lowest rates were discarded from a series of similar rates and the mean of the remaining rates calculated. These figures would then be used as the base rate for that quarter. The advantage of using this method is that the majority of the rates in a series are considered. This is beneficial where a low number of rates have been received in a particular series.
Once the above calculations were made, the averaged rates were transferred to another spreadsheet. Even though the rates had been averaged, it became apparent that there was still a large amount of fluctuation among the rates from one quarter to another. After further discussions with the Statistics Department at UP, it was decided to smooth the rates further by calculating a three-quarter moving average for each rate for the time period under investigation. According to Steyn et al. (2007: 227), the principle of using a moving average within a time series is to smooth out short-term fluctuations.
Step 7: Calculate the index
After completion of steps 1 to 6, the complete index for the time period under investigation could be calculated. This was achieved by following the principles of the Laspeyres index, as discussed earlier,

Cruywagen • Towards the establishment of a relevant national ...
39
viz. by calculating the total of the base-year quantities at current rates, divided by the total of the base-year quantities at base-year rates, multiplied by 100. This was done for each quarter in the study period. The calculation, for example, for Quarter one, 2007, would be as follows: 273 344,67 X 100
243 535,96
= 112.24
Similarly, the calculation for Quarter Two, 2007, would be:
287 057,59 X 100
243 535,96
= 117.87
The calculation for the full time period, first quarter 2007 to end of second quarter 2012, analysed, is shown in Table 7.
Table 7: Calculation of price movement: 2006 to 2012 (2nd quarter)2006 100
Q1 2007 112.24Q2 2007 117.87Q3 2007 117.22Q4 2007 114.72Q1 2008 113.44Q2 2008 133.13Q3 2008 153.80Q4 2008 158.99Q1 2009 157.90Q2 2009 139.93Q3 2009 131.25Q4 2009 111.34Q1 2010 106.94Q2 2010 106.24Q3 2010 110.18Q4 2010 113.22Q1 2011 114.28Q2 2011 115.48Q3 2011 115.87Q4 2011 115.54Q1 2012 112.68Q2 2012 110.41
Figure 1 shows the above movement graphically.

Acta Structilia 2014: 21(2)
40
Figure 1
Figure 2: Combined BER/UP 2006 indices
0.0020.0040.0060.0080.00
100.00120.00140.00160.00180.00
3-Quarter moving average 2006 to 2012
Series1
0.00
50.00
100.00
150.00
200.00
020406080
100120140160
2006
Q1
2007
Q2
2007
Q3
2007
Q4
2007
Q1
2008
Q2
2008
Q3
2008
Q4
2008
Q1
2009
Q2
2009
Q3
2009
Q4
2009
Q1
2010
Q2
2010
Q3
2010
Q4
2010
Q1
2011
Q2
2011
Q3
2011
Q4
2011
Q1
2012
Q2
2012
Combined BER/UP 2006
BER UP=2006
Figure 1: Three-quarter moving average 2006 to 2012 (2nd quarter)
5. DiscussionAs indicated earlier, a tender price index is an indication of the movement of a basket of rates over a period of time. The new index under scrutiny should be examined in that context (for research purposes, the index can be referred to as the ‘UP 2006’ index). The index, as depicted in Figure 1, shows an upward curve from 2006 (UP 2006 = 100) to about the end of 2008, where the index peaked at 158.99. This represents an increase in prices of almost 60% over the two-year (or eight quarters) period or an average of approximately 7.5% per quarter. As indicated earlier, this was a period in the history of the South African building industry which overlapped with a worldwide boom in the construction activity, especially in the light of the then upcoming 2010 Soccer World Cup. Therefore, the general movement of this peak in the UP 2006 index seems to be defendable.
After the construction boom period, there was a sharp decline in construction activities. This could be attributed to the conclusion of the World Cup projects and to the worldwide economic recession, which also started to have an impact on the South African economy. The UP 2006 index shows a similar movement with the trend going down from the 158.99 figure in the fourth quarter of 2008 to a low of 106.24 in the second quarter of 2010.
This represents a decline of 33.18% over a six-quarter period, with an average of approximately 5.5% per quarter. After this, the UP 2006 index shows a relatively consistent movement over the following two years until the end of the research period, the second period of 2012. This movement seems consistent with what emerged from the

Cruywagen • Towards the establishment of a relevant national ...
41
projects that were investigated over this period, viz. that tendered rates did not show a significant amount of increase during this two-year period.
6. Comparison of indicesIn order to determine whether it is possible to construct a new tender price index based on accepted norms and standards regarding index theory, a comparison was made between the BER building cost index and the UP 2006 index. To compare the two indices over the same time period, it was necessary to extract information for the BER index from information published by Medium Term Forecasting Associates (2008 to 2013) for the same time period, and then to extrapolate the data.
Figure 2 shows that there is a reasonable degree of correlation between the two data sets. The biggest difference is shown from the second half of 2009, where the UP 2006 trend is sharply downwards, and the BER trend is more gradual.
Figure 1
Figure 2: Combined BER/UP 2006 indices
0.0020.0040.0060.0080.00
100.00120.00140.00160.00180.00
3-Quarter moving average 2006 to 2012
Series1
0.00
50.00
100.00
150.00
200.00
020406080
100120140160
2006
Q1
2007
Q2
2007
Q3
2007
Q4
2007
Q1
2008
Q2
2008
Q3
2008
Q4
2008
Q1
2009
Q2
2009
Q3
2009
Q4
2009
Q1
2010
Q2
2010
Q3
2010
Q4
2010
Q1
2011
Q2
2011
Q3
2011
Q4
2011
Q1
2012
Q2
2012
Combined BER/UP 2006
BER UP=2006
Figure 2: Combined BER/UP 2006 indices
7. ConclusionBased on the reasonable degree of correlation between the BER and UP indices, it may be concluded that it is possible to construct a new tender price index based on accepted norms and standards regarding index theory as laid down in the literature and in studies conducted on other similar indices. In order to test the validity of the UP 2006 index, it is suggested that comparisons be made with the movement of the economy in general over a longer time period. It will also be beneficial if a larger sample of priced bills of quantities be

Acta Structilia 2014: 21(2)
42
obtained to make it statistically more stable. To achieve this, a new method of collecting these projects will have to be considered, e.g., in collaboration with the ASAQS. The UP 2006 index can also be made available to the quantity-surveying community on a quarterly basis for comments and to test it in a commercial environment.
References listAkintoye, A., Bowen, P. & Hardcastle, C. 1998. Macro-economic leading indicators of construction contract prices. Construction Management and Economics, 16(2), pp. 159-175.
Akintoye, S.A. 1991. Construction tender price index: Modelling and forecasting trends. PhD thesis. University of Salford, UK.
Ashworth, A. 1991. Cost studies of buildings. Essex, UK: Longman.
Association of South African Quantity Surveyors (ASAQS). 1999. Standard system of measuring building works. 6th revised edition. Midrand: ASAQS.
Brook, D.E. 1974. Building cost index. How it works and how to use it. BER Building Survey, 21, pp. 5-18.
Farrely, B. 2010. (The Society of Chartered Surveyors, Dublin, Ireland). Personal communication on tender price indices in Ireland. Date of communication: 5 January 2010.
Ferry, D.J., Brandon, P.S. & Ferry, J.D. 2003. Cost planning of buildings. 7th edition. Oxford: Blackwell Publishing.
Flemming, M.C. & Tysoe, B.A. 1991. Spon’s construction cost and price indices handbook. London: E & FN Spon.
Kilian, W.F. 1980. An assessment of the BER building cost index. Building survey no. 44, January 1980. University of Stellenbosch, Stellenbosch, South Africa.
Kirkham, R. 2007. Ferry and Brandon’s cost planning of buildings. 8th edition. Oxford: Blackwell Publishing.
Klaas, R. 2011. (Senior statistician, Statistics South Africa). Personal communication on Statistical newsletter P. 0153. Date of communication: 15 November 2011. Pretoria, South Africa.
Marx, H.J. 2005. Correctness of the BER building cost index. Research Report: Department of Quantity Surveying and Construction Management, University of the Free State, Bloemfontein. June 2005.

Cruywagen • Towards the establishment of a relevant national ...
43
Mohammadian, R. & Seymour, S. 1997. An analysis of some construction price methodologies. Statistics Canada, price division. Catalogue no. 62, F0014, MPB, no. 2. April.
Seeley, I.H. 1996. Building economics. 4th edition. London: Macmillan Press.
Segalla, U. 1991. The BER building cost index – an overview. Journal for Studies in Economics and Econometrics, 15(1), pp. 43-57.
Statistics Directorate, European Union. 1997. Sources and methods: Construction price indices. Luxembourg: Statistical Office of the European Community.
Statistics Finland. 2001. Building cost index 2000 = 100: User’s handbook. Helsinki: Hakapaino Oy.
Statistics Norway. 2007. Construction price indices and house and property price indices 2006: Results and methods. Oslo: Statistics Norway.
Statistics South Africa. 2009. Selected building statistics of the private sector as reported by local government institutions, 2008. Statistical release P5041.3. Embargoed: 29 June 2009.
Steyn, A.G.W., Smit, C.F., Du Toit, S.H. & Strasheim, C. 2007. Modern statistics in practice. 7th edition. Pretoria: Van Schaik Publishers.
Van der Walt, P. 1992. ’n Kontrakprysindeks vir geboue in die Republiek van Suid-Afrika. PhD proefskrif. Universiteit van Pretoria, Pretoria.
Yu, M.K.W. & Ive, G. 2008. The compilation methods of building price indices in Britain: A critical survey. Construction Management and Economics, 26(7), pp. 693-705.

44
Victor Okorie, Fidelis Emuze, John Smallwood & Jacobus van Wyk(†)
The influence of clients’ leadership in relation to construction health and safety in South Africa
Peer reviewed and revised
Abstract The South African Construction Regulations realise the contributions by each member of a project team to health and safety (H&S) improvement. These Regulations amplify the roles and contributions of clients to project realisation. The tenets of the Regulations conform with the observation that clients’ H&S leadership and behaviours are an effective means of improving construction H&S performance in the industry. This article reports on a study that examined current clients’ leadership approach and expectations in terms of H&S in South African construction. The review of relevant literature provides the platform for the research survey, which was conducted among selected clients of the industry. The findings show that clients’ H&S leadership roles and behaviours have a significant influence on construction H&S performance in South Africa. Findings reveal that unethical behaviour, in terms of procurement and contract awards, is a serious challenge to the improvement of H&S performance in the industry. Keywords: Behaviours, clients, construction, leadership, health and safety, South Africa
AbstrakDie Suid-Afrikaanse Konstruksie Regulasies besef die bydraes van elke lid van ’n projekspan om beroepsgesondheid en veiligheid (H&S) te verbeter. Hierdie Regulering versterk die rol en bydraes van kliënte teenoor projekverwesenliking. Die beginsels van die Regulasies stem ooreen met die waarneming dat kliënte se leierskap en gedrag ten opsigte van H&S ’n doeltreffende manier is om konstruksie H&S-prestasie in die bedryf te verbeter. Hierdie artikel gee
Dr Victor Okorie, PhD (Construction Management) graduate at the Department of Construction Management, Nelson Mandela Metropolitan University, PO Box 77000, Port Elizabeth, 6031, South Africa. Phone: (041) 504 2790, Email: <[email protected]>
Dr Fidelis Emuze, Senior Lecturer and Head, Department of Built Environment, Central University of Technology, Free State (CUT), Private Bag X20539, Bloemfontein, 9300, South Africa. Phone: +27 51 507 3089, Email: <[email protected]>
Prof. John Smallwood, Professor and Head, Department of Construction Management, Nelson Mandela Metropolitan University, PO Box 77000, Port Elizabeth, 6031, South Africa. Phone: (041) 504 2790, E-mail: <[email protected]>
Prof. Jacobus van Wyk, Professor, Department of Building and Human Settlement Development, Nelson Mandela Metropolitan University, South Africa. († 1 February 2014).

Okorie, Emuze, Smallwood & Van Wyk • The influence of clients’ ...
45
bevindinge oor ʼn ondersoek wat gedoen is om huidige kliënte in die konstruksie-industrie se leierskapsbenadering en verwagtings oor H&S in Suid-Afrikaanse konstruksie te ondersoek. Die literatuurstudie het die onderbou gevorm vir die navorsingsondersoek, gedoen onder uitgesoekte kliënte in die industrie. Die bevindinge toon dat kliënte se leierskapsrolle ten opsigte van H&S ʼn groot invloed het op H&S in Suid-Afrika. Onetiese gedrag in terme van aankope en kontraktoekenning is ʼn groot uitdaging vir die verbetering van H&S-prestasie in die industrie.
1. IntroductionConstruction sites remain one of the most dangerous and hazardous workplaces, due to the high number of reported and unreported cases of injuries and fatalities (Coble & Haupt, 1999: 211; Bust, Gibb & Pink, 2008: 585; Fewings, 2010: 165; Spangenberg, 2009: 112). According to the International Labour Organisation (ILO, 2011: 1), the risk of injuries and fatalities in construction is 7-10 times more than that in other industries. In South Africa, the Construction Industry Development Board (cidb) (2009: 3) reports that accidents in the industry are among the highest in all industry sectors, resulting in a third of all work fatalities. Construction accidents and incidents cost national economies over 5% of their gross domestic product (GDP) (ILO, 2010: 2).
Exposure to various hazards when working at heights, under water and/or with hazardous chemical substances forms part of daily work routines on construction sites (cidb, 2009: ii; Coke & Sridhar, 2010: 139). The discovery that construction workers are often at risk of an accident, ill health and fatality at work when compared to other industrial sectors is cause for concern for individuals, stakeholders, and governments (Kheni, 2008: 54; McAleenan, 2010: 39).
In South Africa, previous research focused on the causes of site accidents and occupational safety: Occupational safety (Matthysen, 1984: 10); The role of project managers in construction H&S (Smallwood, 1996: 227); Implementation of H&S on construction sites (Coble & Haupt, 1999: 211); The cost of construction accidents (Pillay & Haupt, 2008: 268); The economic and social impact of site accidents (Mthalane, Othman & Pearl, 2008: 78); A model to improve the effectiveness of the occupational H&S inspectorate (Geminiani, 2008: 23), and The impact of H&S culture on construction site performance (Okorie & Smallwood, 2010: 380). Despite this research, a gap exists between effective leadership of the key project leaders in H&S management and its positive impact on industry performance. Set against these previous studies, this gap may be connected to clients’ poor H&S leadership and behaviour,

Acta Structilia 2014: 21(2)
46
causing contracts to be awarded to contractors with poor H&S records. For the purpose of this article, the influence of the critical leadership and behaviours of the clients in South African construction that could be used to proactively influence measures for effective H&S management were examined. This exploratory article forms a basis for a more in-depth study into the drivers for client involvement and commitment to improving construction H&S.
2. The construction clientThe South African Construction Regulations (RSA, 2003: 8) define clients as the people who, in the course of furtherance of business or operation, seek or accept the services of others which may be used in carrying out projects for themselves. In the context of construction projects, clients could be individuals, corporate bodies or government departments (Okorie, 2014: 151). As owners of projects, the clients have a substantial influence on the way in which a project is run (cidb, 2009: 18). McAleenan (2010: 101) asserts that the governance of any project begins and ends with the client.
2.1 Clients’ H&S leadership roles and behaviour
Behm (2005: 24) and Huang & Hinze (2006: 174) stress the importance of clients’ H&S leadership, particularly decisions made at the early project-planning phase through the appointment of the design team, contractors, selection of professional advisors, and procurement methods. In addition, public-sector clients are governed by legislation that requires them to treat all contractors equally, without discrimination, and to act in a transparent and appropriate manner (McAleenan, 2010: 101). The South African Construction Regulations (RSA, 2003: 12) require that clients appoint competent professional designers, project managers, and quantity surveyors. Emphasising the importance of client leadership roles for effective H&S management, Hinze (2006: 87), McAleenan (2010: 42), and Oloke (2010: 30) argue that accidents are caused by inappropriate responses to certain constraints and the environment. All of these factors impact on H&S and are directly influenced by clients. Conversely, clients’ lack of visible leadership in the appointment of competent professionals often leads to awarding contracts to contractors without adequate H&S records (Musonda, Pretorius & Haupt, 2012: 71). For example, unethical behaviour and non-adherence to the procurement process in clients’ organisations have been noted as major factors contributing to poor H&S performance (cidb, 2011: ii).

Okorie, Emuze, Smallwood & Van Wyk • The influence of clients’ ...
47
2.2 Clients’ H&S leadership in the appointment of the design team
The Construction Regulations (RSA, 2003: 8) require clients to verify the competencies of designers such as architects, engineers, quantity surveyors, and project managers before appointing them. It is very important at the project-planning stage that clients’ H&S commitment and leadership should reflect on the appointment of the project team, as their competencies have a direct and indirect influence on overall construction H&S performance. The composition of the design team is very important with respect to their advice regarding the appointment of a competent contractor. According to Hinze (2006: 316), the need for clients’ commitment to project H&S stems from the rising costs of workers’ compensation claims and high costs of litigation associated with poor construction H&S performance.
2.3 Clients’ H&S leadership in the provision of H&S information
The Construction Regulations (RSA, 2003: 8) require clients to provide information and instructions that might affect the H&S of a worker doing work. During the design stage, clients have a legal duty to provide adequate information with respect to the site or premises to the designers who are responsible for designing H&S into the project (cidb, 2009: 19; Haslam, Hide, Gibb, Gyi & Atkinson, 2005: 22). Changing weather, cyclical economic downturns, natural occurrences such as weather, information regarding what lies beneath the ground are factors impossible of predicting and may bring uncertainty (Brauer, 2006: 167). Regardless of the argument of uncertainty in predicting the future, clients’ provision of adequate H&S information to the design team has a significant impact on project H&S performance (Gambatese, Toole & Behm, 2008: 12; cidb, 2009: 19). The level of non-compliance with this important role by some clients suggests poor leadership and a lack of commitment to project H&S.
2.4 Clients’ H&S leadership in the provision of adequate financial resources
The Construction Regulations (RSA, 2003: 4) require clients to make adequate financial provision for their projects. By obtaining cost advice relative to construction H&S during the project-planning stage, a client proactively takes cost risk-control measures, such as adequate budgeting for H&S and problems arising during construction (Steven, 2010: 63-64). Clients’ lack of adequate financial provision for H&S during the project-planning stage has been noted as a vital challenge for H&S management (Gambatese et al., 2008: 13; cidb, 2009: 18).

Acta Structilia 2014: 21(2)
48
2.5 Clients’ H&S leadership in pre-qualification of contractors
Contractor pre-qualification is crucial to both the client and the contractor organisations, as it helps them meet regulatory compliance and achieve H&S improvement performance (cidb, 2009: 17). Pre-qualification is an effective means of identifying which contractors meet the client’s requirements to perform the work in the most effective and efficient manner. Pre-qualification enables clients to assess relevant information with respect to contractors’ H&S management systems such as H&S historical and performance records, insurance records, workers’ H&S training, and employees’ competencies. Clients evaluate the information against pre-established criteria to determine whether the contractor is qualified to bid for the work and, if not, client organisations can exclude unsafe contractors from client lists (Lutchman, Maraj & Ghanem, 2012: 174).
Client organisations’ lack of H&S pre-qualification allows contractors, without the prerequisite competencies, to carry out their construction projects; this often results in fatalities and injuries on site.
2.6 Clients’ H&S leadership in the contract-procurement process
Procurement is the process of clients selecting or appointing the most economically viable or competent contractor to carry out construction projects (McAleenan, 2010: 111). However, construction process and contractual relationships between clients and contractors differ from other ordinary contracts in many respects. Construction-project contracts are governed by legislation and regulations at both provincial and national levels. For example, the Construction Regulations (RSA, 2003: 12) require that clients, who wish to procure a construction project, should take every reasonable step to ensure that the person (contractor) appointed or engaged is competent to carry out the work in the safest and most efficient manner. Notably, the public sector is the largest client of the South African construction industry, with the responsibility of providing quality products. In meeting this obligation, public-sector clients are governed by legislation that requires them to treat all contractors equally, without any discrimination, and to act in a transparent manner (McAleenan, 2010: 111).
According to McAleenan (2010: 112), clients that have visible leadership and that are committed to follow a procurement policy governed by ethical behaviour enable best values to be achieved and encourage the improvement of the procurement process early in the supply chain (McAleenan, 2010: 112).

Okorie, Emuze, Smallwood & Van Wyk • The influence of clients’ ...
49
2.7 Clients’ H&S leadership in the awarding of contracts to contractors
Awarding a contract to a successful bidder (contractor) by a client organisation (public and private) follows a due process. Construction-procurement guidelines for the public sector (clients), that set common minimum standards for procuring and awarding contracts to contractors, can be found in terms of the National Home Builders Registration Council (NHBRC) and the Preferential Procurement Policy Framework Act (PPPFA) (RSA, 2001: 2).
The NHBRC outlines the following conditions under which registered contractors’ tenders will be evaluated for awarding contracts: financial capability; technical competency; construction experience, and management. Instances have shown that the Council does not strictly adhere to these guidelines. As noted by the cidb reports (2011: 21), the poor quality of work completed by some contractors who are registered under the NHBRC raises a big question as to how contracts were awarded to them. Investigations as to why contracts were awarded to these contractors showed that the tender process was poorly managed and, more specifically, that it was open to abuses such as bribery, fraud, corruption, and nepotism (cidb, 2011: 21). These abuses constitute unethical behaviour and indicate poor leadership. The consequences of awarding contracts to contractors without adequate competencies are poor project performance, including H&S.
The Preferential Procurement Policy Framework Act (PPPFA) (RSA, 2001: 2) provides for both the evaluation of tenders and the awarding of contracts in the public sector on the basis of price and preference; response to the proposed scope of work or project design; quality control practices and procedures; qualifications and demonstrable experience of the key staff, and demonstrated experience of the tendering entity with respect to specific aspects of the project and comparable projects. Conversely, these policies and procedures are hardly adhered to by the appointed construction H&S officers in construction, as noted by Fourie (2009: 45). The non-adherence to these procedures is a manifestation of poor leadership and a lack of commitment (Fourie, 2009: 41). The cidb (2011: 22) report also notes that there have been instances where contracts are not awarded in accordance with a client’s procurement policy, for example, overturning the recommendations of a tender evaluation committee, due to political interference. A survey conducted by the cidb construction industry in 2009 indicated the extent of contracts that were not awarded in accordance with client-procurement

Acta Structilia 2014: 21(2)
50
policies to be: 22% for provincial, 16% for national corporations, 7% for national departments, and 7% for local authorities. It has also been noted that political interference and lack of transparency frequently result in the appointment or awarding of contracts to contractors that do not have the necessary abilities to carry out the work in a safe and efficient manner (cidb, 2011: 23).
Comparing the criteria for tender evaluation in both the NHBRC and the PPPF Act 2001, there was no reference to H&S. The lack of inclusion of an H&S management system as a pre-qualification criterion in the South African procurement policy and guidelines could be a factor for clients’ inadequate budgeting for H&S during the project-planning stage (cidb, 2011: 27). The cidb (2011: 28) notes in a report that lack of commitment to H&S, and lack of transparency during tender evaluations resulted in the awarding of contracts to contractors without adequate H&S records.
2.8 Clients’ H&S leadership in the appointment of contractors
Oloke (2010: 39) and Musonda et al. (2012: 71) contend that clients have a pivotal leadership role in setting and achieving high standards in construction H&S performance. The consensus of various H&S researchers regarding the influence of clients in improving construction H&S converges on the central idea that clients’ H&S leadership is desirable for effective H&S management (Brauer, 2006: 12; Huang & Hinze, 2006: 175; Gambatese et al., 2008: 2; Spangenberg, 2009: 56; Conchie, Taylor & Charlton, 2011: 1209). They set the tone for projects, have overall control of contracts and the way projects are undertaken, make key decisions such as those related to budget and time, and appoint the design team and contractors. Huang & Hinze (2006: 178) and Musonda et al. (2012: 23) argue that high standards of H&S are achieved on projects where clients are committed and demonstrate transparent leadership. The importance of clients’ H&S leadership in both the public and the private sectors, leading to the award of a contract to a competent contractor, is highly desirable for effective H&S management.
2.9 H&S project monitoring by clients
As the owners and financiers of construction projects, clients have a legal obligation to monitor and ensure that the principal contractors have put in place all arrangements with respect to a construction-phase H&S plan on site. Lingard & Rowlinson (2005: 163) maintain that effective H&S management entails adequate monitoring and reporting of performance and process to review

Okorie, Emuze, Smallwood & Van Wyk • The influence of clients’ ...
51
performance and make improvements. According to Musonda et al. (2012: 111) and Hinze (2006: 121), active and reactive monitoring provides clients with the information needed to review activities and decide how to improve workers’ H&S on site. Hinze (2006: 121) argues that successful H&S management requires clients to regularly attend site H&S meetings to discuss H&S matters. Clients’ visible H&S leadership, commitment to workers’ H&S and active involvement through monitoring their project H&S can contribute to effective H&S management.
Krause (2003: 3) and Hopkins (2008: 31) point out that the ultimate success of project H&S management is, to a large extent, dependent upon clients’ H&S leadership and commitment. The influence of clients can be found in the work of Huang & Hinze (2006: 23), which shows that construction H&S performance can be measured and ultimately changed through the various commitments of clients as the owners and financiers relative to a particular construction project. These commitments depend on their visible leadership in the appointment of the design team; provision of H&S information; allocation of adequate financial resources to H&S; pre-qualification of contractors on H&S; contract-procurement process; awarding of contracts to contractors with good H&S records, and monitoring workers’ H&S on sites (Musonda et al., 2012: 75). Documented research findings (Behm, 2005: 2; Hinze, 2006: 102; Huang & Hinze, 2006: 2; Suraji, Duff & Peckitt, 2006: 1; Chinda & Mohammed, 2008: 2; Musonda & Smallwood, 2008: 2; cidb, 2009: 39) maintain that clients can contribute to improvement in construction H&S performance.
3. Research methodologyA qualitative research approach is commonly employed in studying complex situations, particularly in research involving people (Sutrisna, 2009: 57). According to Borrego, Douglas & Amelink (2009: 54), qualitative research is good for approaches in which a theory or hypothesis justifies the variables, the purpose statement, and the direction of the narrowly defined research questions. The hypothesis: ‘Clients’ poor H&S leadership and behaviours lead to the award of contracts to contractors with poor H&S records’ is being tested through the phrasing of research questions which aim to determine to what extent clients exude H&S leadership and commitment in construction projects.
The review of the literature resulted in the formulation of a structured questionnaire, which forms the basis for the semi-structured questions for the focus-group discussions. Focus-group interviews

Acta Structilia 2014: 21(2)
52
were conducted among public and private clients in the four major provinces of South Africa, namely Eastern Cape, Gauteng, KwaZulu-Natal, and Western Cape. The selection of the interviewees was conducted by searching the data bases of the National and Provincial Offices of the Department of Public Works (DPW) and the South African Property Owners Association (SAPOA). The purposive sampling technique was used for selecting directors and senior managers considered to be sufficiently knowledgeable for the enquiry. Time, cost, experience, and a small sample needed for the group discussion were the special circumstances that were considered in the choice of the purposive sampling technique for this study (Sutrisna, 2009: 71). The participants from the public sector included architects, quantity surveyors, and H&S officers; while those from the private sector were in top-management positions.
For the questionnaire, closed-ended questions were preferred, as they reduce the respondent’s bias (Akintoye & Main, 2007: 601). From the 560 questionnaires distributed, 143 were returned; this resulted in a response rate of 25.5%. The response rate achieved for this research is similar to that achieved in other surveys (Sutrisna, 2009: 84; Collins, 2010: 43). It could be inferred from Sutrisna (2009: 56) and Dainty (2008: 6) that performing a statistical analysis in a survey with response rates equal to, or above the threshold of thirty (30) is acceptable. Thus, 143 responses achieved in this survey provide reasonable data for analysis.
Open-ended semi-structured questions were developed to guide the focus-group discussions. The questions allowed the participants to share as much or as little as they wished with respect to their H&S practices and behaviours that can bring about H&S performance improvement in South African construction. The questions allowed the participating clients to discuss the following areas that involve their leadership skills and behaviours: appointment of the design team; provision of adequate H&S information; financial provision for project H&S; pre-qualification of contractors on H&S; procurement policies, guidelines and contract award; monitoring and implementation of project H&S plans, and clients’ H&S leadership.
Out of the thirty (30) people who were invited to participate in the study, only eleven (11) took part in the focus-group discussions. The number of participants was considered sufficient for a quorum, since Gillen, Kool, McCall, Sum & Moulden (2004: 235) and Babbie (2007: 56) suggest that three to six participants should be brought together in a typical focus-group discussion. Gillen et al. (2004: 23) further contend

Okorie, Emuze, Smallwood & Van Wyk • The influence of clients’ ...
53
that smaller groups increase participants’ opportunity to fully express ideas without interruptions.
Multiple methods of outreach, including the posting of the structured open-ended questions, telephone contact, and e-mails, were employed to contact participants. The discussions were conducted with due regard to ethical considerations governing research of this nature. Although qualitative research involves studying respondents in their true setting, no research can truly capture the full effect of the setting or respondents, because they are complex entities (Sutrisna, 2009: 56).
3.1 Data analysis and interpretation of findings
3.1.1 Questionnaire
For the questionnaire survey, a 5-point Likert-scale measurement was used to obtain the opinions of the respondents and to analyse the results. Leedy & Ormrod (2005: 185) maintain that Likert scales are effective to elicit participants’ opinions on various statements.
For the purpose of analysis and interpretation of mean scores, the following scale measurement was used: 1 = Minor extent; 2 = Near minor; 3 = Some extent; 4 = Near major extent; 5 = Major extent. The Statistica (version 10.0) statistical analysis software package was used to generate the descriptive and inferential statistics. The Microsoft Excel Ranking function was used to compute the rank of mean scores recorded in the data analysis. This ranking method enabled the researcher to evaluate the importance of problems, parameters and individual statements relative to each other. When using Likert scale-type scales, it is imperative to calculate and report Cronbach’s alpha coefficient for internal consistency and reliability for any scales (Gliem & Gliem, 2003: 88). Maree & Pietersen (2007: 216) suggest the following guidelines for the interpretation of Cronbach’s alpha coeffient: 0.90 – high reliability; 0.80 – moderate reliability, and 0.70 – low reliability. The questionnaire survey shows a moderate reliability Cronbrach’s alpha of 0.89.
3.1.2 Focus group
For the focus-group discussions, the principal researcher served as the group leader to facilitate the discussion and the debriefing. The participants were reminded of the voluntary nature of their participation in the study as well as the ethics of group confidentiality. Discussions that were transcribed verbatim were recorded on iPhone with permission of the participants. The transcribed versions were sent

Acta Structilia 2014: 21(2)
54
to the participants to vouch for accuracy. At the end of the one-day group discussion, the data was captured on a computer. The facilitator of the group discussions listened several times to the recordings and personally transcribed them. To enhance the validity of the findings, the transcribed versions were sent to the participants who vouched that accurate versions of the discussions had been realised.
3.1.3 Hypothesis
In testing the hypothesis, the p-value, which is the level of significance for the t-test, was 5%. This suggests that the p-value may be assumed to be less than 0.05. The smaller the p-value, the stronger the evidence is against the null hypothesis (Agresti & Franklin, 2007: 369). The p-value, which was calculated by presuming that the null hypothesis Hₒ is true, is the probability that the test statistics equal the observed values or a value even more extreme (Samuels, Witmer & Schaffner, 2012: 45).
4. Results and findings
4.1 Questionnaire responses
The majority of the responses (66%) were received from practitioners in the public sector. Over 50% of the respondents have been involved in construction for over 15 years; 91.6% have tertiary qualifications; 62.2% hold management positions; 23.8% work for clients; 20.3% work for general building contractors; 14.7% are designers; 2.3% are project managers; 10.5% are general civil contractors; 7.7% are quantity surveyors; 11% are others; 30.8% are managers, and 22.4% are managing members and principals.
The data analysis reveals that the respondents fall within the key project participants and, therefore, their perceptions can be deemed reliable and valid. The respondents are academically qualified to comprehend the questions and their judgements are reliable, as they have the experience to make sound judgements.
4.2 Questionnaire results
A five-point Likert-scale questionnaire that provides for ‘unsure’ was used to examine the contributions and behaviour of clients to poor H&S performance. Table 1 indicates the perceived behaviour or contributions of clients in the construction industry to poor construction H&S performance (at-risk work practices or unsafe behaviour).

Okorie, Emuze, Smallwood & Van Wyk • The influence of clients’ ...
55
Table 1: Client-related H&S behaviour contributing to poor con-struc tion H&S performance
Behaviour/Contributions
Valid N Unsure
Response (%)MS SD RankMinor ………………… Major
1 2 3 4 5Failure to ensure that the contractor has made adequate financial provision for H&S
143 2.1 7.0 11.2 23.8 32.9 23.1 3.54 1.17 1
Inadequate monitoring to ensure that contractors comply with the H&S plan
143 1.4 6.3 16.9 22.5 30.3 22.5 3.46 1.19 2
Non-facilitation of financial provision for H&S
143 4.2 7.7 12.6 28.0 30.1 17.5 3.37 1.14 3
Inadequate addressing of H&S matters during contract negotiation/tendering process
143 2.5 3.5 18.9 31.5 23.1 19.6 3.36 1.10 4
Lack of pre-qualification of contractors on H&S
143 2.8 4.9 18.2 28.7 28.0 11.2 3.35 1.11 5
Inadequate provision of financial resources for H&S
143 0.7 8.4 16.8 26.6 30.1 17.5 3.31 1.19 6
Inadequate H&S specification provided to the design team
143 3.5 9.8 18.9 28.7 28.0 11.2 3.12 1.14 7
Inadequate project duration 143 3.5 14.0 16.8 28.7 20.3 16.8 3.09 1.27 8
Poor choice of procurement system 143 6.3 8.4 19.6 34.3 18.9 12.6 3.08 1.11 9
Inadequate provision of H&S information to the design team
143 5.6 8.5 25.4 32.4 17.6 10.6 2.96 1.09 10
Poor project brief provided to the design
143 4.2 12.0 21.1 32.4 19.0 11.3 2.96 1.16 11
Average 3.23 1.15Cronbach’s alpha: 0.89 (moderate reliability)Average inter-item: 0.45
Acta Structilia 2014: 21(2)
56
Table 1 indicates the respondents’ perceptions of the extent to which identified behaviour related to clients’ H&S leadership and behaviour contributes to at-risk work practices or unsafe behaviour. It shows this in terms of percentage responses to a scale of 1 (minor) to 5 (major), and a MS ranging between 1.00 and 5.00. It is notable that nine MSs were above the midpoint of 3.00, which, with an average MS of 3.23, indicates that the respondents perceive that client-related H&S behaviour contributes to at-risk practices or unsafe behaviour of workers on site. The findings indicate that the respondents perceive that the following can be deemed to contribute significantly to at-risk work practices:
• Failure to ensure that clients have made adequate financial provision for H&S;
• Inadequate monitoring to ensure that contractors comply with the H&S plans;
• Non-facilitation of financial provision for H&S, and• Inadequate addressing of H&S matters during contract
negotiation/tendering process.
Although inadequate provision of H&S information to the design team and poor project brief provided to the design team have the lowest MSs in Table 1, these critical client leadership roles should not be overlooked in this context.
4.3 Focus-group responses and discussion
In addition to the questionnaire responses, the questions for the focus-group discussions allowed the participants to share as much or as little as they wished with respect to their practices and behaviour that can realise H&S improvement in South African construction.
4.3.1 Clients’ H&S leadership roles and behaviour
The following question related to clients’ H&S leadership attributes that can realise improvement in the area of construction H&S performance was posed to participants:
“Despite the interventions that have been mentioned in the course of this discussion, do you think that leadership abilities/attributes can improve construction H&S performance?”
One of the participants commented that visible leadership is critical to the promotion of H&S culture in construction. The participant succinctly stated the following: “We should be a role model when we visit site by wearing our safety hats” and “Talk to workers as human

Okorie, Emuze, Smallwood & Van Wyk • The influence of clients’ ...
57
beings”. These comments indicate that there is a need for leaders at all levels of management to demonstrate visible leadership when visiting construction sites, since workers tend to emulate their good or bad behaviours. As one of the Directors put it, workers hear what we say, but what they do reflects on what we do. Therefore, leaders at all levels should demonstrate attributes or qualities that inspire, and reflect trust and respect to workers when visiting sites.
In addition, the participants were asked to provide their perceptions regarding poor H&S leadership and client organisations’ lack of commitment to workers’ H&S. Responses included inadequate financial budgeting for H&S; lack of pre-qualification of contractors on H&S; inadequate monitoring to ensure that contractors comply with project H&S plans, and inability to ensure that contractors have made adequate financial provision for H&S in their tenders. Furthermore, references were made to bribery, corruption, and political interference that exist in clients’ organisations as being poor behaviour and a lack of commitment, thus contributing to workers’ unsafe behaviour on sites.
However, bribery, corruption, and political interference, particularly among public-sector clients, have become endemic in society. These practices are not only limited to public clients, but also apply to private clients. Such social ills are prevalent in developing nations and are becoming increasingly more dominant in South Africa. The resultant effects of this poor leadership and behaviour among clients often lead to circumventing procurement guidelines and polices. As a consequence, contracts are awarded to contractors with poor H&S records, resulting in site fatalities, injuries, and diseases.
4.3.2 Clients’ H&S leadership in the appointment of the design team
Two questions addressed the important issue related to the appoint-ment of the design team that implies that designers have the responsibility to improve construction site H&S performance through their design decisions, particularly during the project-planning and design stages.
“Based on your experience, do you think designers’ H&S critical decisions impact on workers’ H&S behaviour on site?”
Participants’ comments included:
• “H&S information is not incorporated into designs”.• “Hazard identification and risk assessment are not carried out
on the intended project”.

Acta Structilia 2014: 21(2)
58
The above comments by the participants indicate the extent to which designers’ roles can contribute to at-risk work practices or unsafe behaviour. Designing H&S into construction entails that designers should give due consideration to workers’ H&S during the project-planning and design stages. Designers should uphold designing H&S into construction, by ensuring that H&S information is provided in the drawings, by conducting hazard identification and risk assessment, and not specifying any hazardous materials.
“What are the criteria adopted or used in your organisation in the appointment of consultants such as architects, engineers, and quantity surveyors at the project conception and design stages?”
In response to this, one of the participants commented: “We have a selected list of consultants that we use for each project” and “We ensure that they are registered members of their professional institutes”. Although these statements were made by public-sector clients, the cidb (2011: ii) reports on the investigation into the barriers to quality in construction, which include the traditional barriers within the design, procurement, and construction processes, namely corruption, political interference, and institutional barriers in the appointment of consultants, that were not capable of undertaking the necessary work, could be attributed, to a large extent, to poor leadership in the procurement process in South African construction. The above examples point out the extent of poor leadership and unethical behaviours among clients relative to the construction project-procurement processes. Of specific interest in the report are indications that corruption is increasing in South Africa.
4.3.3 Clients’ H&S leadership in the provision of H&S information
As far as the importance of H&S information relative to construction sites is concerned, the participants were asked to give their opinion on the following question:
“Based on your experience, do you think preliminary site investigations have an impact on workers’ H&S behaviour on sites?”
A director in the private sector responded as follows: “In all our projects we endeavour to carry out detailed site investigations” and “We also ensure designers incorporate site information into designs”. Private clients such as members of SAPOA can be deemed to carry out detailed preliminary site investigations, as they are profit oriented. The case is contrary to public-sector clients, where the leaders and some

Okorie, Emuze, Smallwood & Van Wyk • The influence of clients’ ...
59
politicians circumvent all stages of the construction project delivery chain, due to corruption and political patronage (Fourie, 2009: 48).
4.3.4 Clients’ H&S leadership in the provision of adequate financial resources
To address the importance of financial provision for H&S during the project-planning and tendering stages, the following question was asked:
“What effect does inadequate financial provision for H&S at the tendering stage have on the ability of contractors to ensure adequate on-site H&S interventions?”
In discussing the above question, the participants commented as follows:
• “H&S is not considered as important as quality.”• “Contractors price H&S items very low in order to win the
tender.”• “Some private clients do not use the services of quantity
surveyors.”
The perception that H&S is not considered as important as the other project parameters (cost, quality, and time) indicates why clients do not budget or allocate adequate financial resources for H&S in their projects. Contractors tendering competitively often ignore H&S items or price them very low in the BoQs. The consequence is lack of funds for H&S interventions on sites. The most complex aspect of this problem is that clients and contractors do not make use of quantity surveyors, who are experts in terms of construction costs.
4.3.5 Clients’ H&S leadership in pre-qualification of contractors
The question regarding the pre-qualification of contractors is notable, as all the participating clients unanimously agreed that pre quali-fication of contractors contributes to workers’ H&S behaviours, when asked to answer the question:
“In your opinion, do you agree that lack of pre-qualification of contractors on H&S can contribute to workers’ unsafe behaviours?”
4.3.6 Clients’ H&S leadership in procurement policies and guidelines and the awarding of contracts to contractors
Participants were asked to comment on the extent to which they adhere to contracts’ procurement policies and guidelines in their organisations. Specifically, participants from the public-sector clients

Acta Structilia 2014: 21(2)
60
commented: “We follow due process in the selection of contractors in our department” and “We ensure that contractors we select have made adequate provision for H&S in their tenders”. However, as noted by Fourie (2009: 45), evidence indicates that the appointed officers hardly adhere to these policies and procedures. The cidb (2011: 22) report notes that there have been instances where contracts were awarded in violation of procurement policy such as overturning the recommendations of a tender evaluation committee, due to political interference. A survey conducted by the cidb in 2009 showed the extent to which contracts were not awarded in accordance with clients’ procurement policy to be: 22% for provincial entities, 16% for national corporations, 7% for national departments, and 7% for local authorities. Comparing the criteria for tender evaluation in both the NHBRC and the PPPF Act 2001, there was no reference to H&S, but at the international level, H&S is included as one of the pre-qualification criteria for tender evaluation and contract award.
In response to the information in the cidb report, a second question addressed opinions regarding the awarding of contracts to contractors:
“Is it possible that poor leadership and lack of commitment to H&S by clients qcontribute to the award of contracts to such contractors?”
Participants unanimously answered “Yes”, “Corruption is too much”, “Contracts are awarded only to top politicians”, and “The top management are not transparent”.
These comments indicate that clients’ H&S leadership is poor, particularly the public-sector clients, as exemplified by the fact that contractors without adequate H&S records are awarded contracts. A contractor without adequate H&S records increases not only accident and injury rates on sites, but also fatalities, and the cost of medical care for the government. It could be argued that poor leadership and lack of transparency among the top leaders are possible reasons for the award of contracts to contractors with poor H&S records in the South African construction industry.
4.3.7 Clients’ monitoring and implementation of project H&S plans
To address the issue of clients as the owners and financiers of construction projects, who have a legal obligation to monitor and ensure that principal contractors have implemented the necessary arrangements with respect to construction H&S plans on site, respondents were asked to reply to the following question:

Okorie, Emuze, Smallwood & Van Wyk • The influence of clients’ ...
61
“In most construction projects that you were/are involved, have you encountered the use of an H&S plan?”
The participants noted: “In major projects, contractors have written H&S plans for the projects”, but “implementation of H&S plans is the problem”. These comments indicate that monitoring of project H&S plan implementation by clients and their appointed agents is inadequate.
Monitoring provides information with regard to performance. Poor monitoring of project H&S plans by clients, designers, and project managers will definitely result in inadequate implementation by contractors on site. A project H&S plan is vital for construction-site H&S management, as it identifies environmental restrictions and existing on-site risks peculiar to a project.
4.4 Implications of the results
The test of means was used to determine whether there is a statistical significance between the respondents’ responses and the hypothetical statements. The significance is the result obtained from testing a null hypothesis against an alternative hypothesis with the aim of determining the p-value (probability value) as the output result. The p-value is a numerical measure of the statistical significance of a hypothesis test. The researcher making the decision should choose significance level α. The common choices are α ꞊ 0.10, 0.05, and 0.01.
For the purpose of this article, in the choice of p-value, if the p-value of the data is less than or equal to α, the data is judged to provide statistical evidence in favour of the alternative hypothesis (Hı), and the null hypothesis (Hₒ) is rejected. On the other hand, if the p-value of the data is greater than the significance level α, it could be concluded that the data provides insufficient evidence to claim that Hı is true, and that the Hₒ is not rejected. These criteria were adopted in drawing conclusions from testing the research hypotheses in this article. As shown in Table 2, the statistical software (Statistica version 10.0) provided the test statistics (t-value) of 3.56 and p-value of 0.000253 for the hypothesis that has been tested in terms of means, and not proportions. The simple sample t-test tested whether the sample mean on each of the constructs is significantly greater than 3, which is the middle (mid-point) of the 5-point scale. The results from the software show that the mean of 3.24 is significantly greater than 3. Thus, the hypothesis testing was conducted without a comparison between t-value and critical value.

Acta Structilia 2014: 21(2)
62
Table 2: Test of means against reference constant (value) for hypothesis
Mean SD N R t-value df p-value3.24 0.80 143 3 3.56 142 0.000253
The following conditions were used for testing the postulated research hypotheses:
• The significance level α ꞊ 5% (0.05);• The confidence level at 95%;• The null hypothesis is Hₒ: p ꞊ 3, and• The alternative is Hı: p ≤ 3.
The null hypothesis states: Poor H&S leadership and behaviour by clients does not lead to award of contracts to contractors with poor H&S records.
The alternative hypothesis states: Poor H&S leadership and behaviour by clients lead to the award of contracts to contractors with poor H&S records.
If p-value < 0.05, then Hₒ is rejected, but p-value ꞊ 0.000253, p < 0.05.
Since p < 0.05, the alternative hypothesis (Hı), which states that poor H&S leadership and behaviour by clients lead to the awarding of contracts to contractors with poor H&S records, is supported.
In conclusion, the data provide statistically significant evidence that poor H&S leadership and behaviour by clients lead to the awarding of contracts to contractors with poor H&S records.
5. DiscussionThe results show that clients in both the public and the private sectors are well aware of the hazards and risks workers face on construction sites. Both public and private clients emphasised the importance of leadership and ethical behaviours in all stages of construction-project delivery so as to improve workers’ H&S behaviours. However, the participating clients agreed that some senior managers and public office holders collude with some contractors to circumvent the construction-procurement guidelines, due to corruption, nepotism, and political interference to award contracts to contractors without adequate H&S records. The need for visible leadership, and commitment to workers’ H&S among the clients, is apparent.

Okorie, Emuze, Smallwood & Van Wyk • The influence of clients’ ...
63
The participants also expressed the need for the assessment of competencies among consultants, construction management systems and contractors’ previous performance relative to H&S as criteria for pre-qualifying contractors and awarding of contracts to contractors. They also recognised and acknowledged corruption, bribery, fraud, nepotism, political interference, and institutional barriers, particularly in the design of permanent works, appointment of quantity surveyors, and project managers. Of great concern is the observation that such political interference is growing rapidly in the public sector, frequently resulting in the appointment of consultants and contractors that do not have the necessary competencies to manage construction projects effectively. The results have been poor project performance, including H&S.
As owners and initiators of construction projects, clients have responsibilities to appoint competent professionals. This is achievable through visible leadership and commitment to workers’ H&S. It is important to view workers’ rights to a healthy and safe workplace as a moral claim, something employers are morally obliged to do, even if it is not required of them by law or corporate policy. Thus, employers’ behaviours and commitment towards workers should be viewed as a moral responsibility to provide a healthy and safe work environment to save the nation from wanton destruction of precious lives and property.
It can be argued that the construction process needs clients as leaders to inspire trust, exercise power where necessary, and demonstrate honesty and integrity in their behaviours. Thus, effective H&S leadership among clients is highly desirable.
However, there are several limitations to this study. The study population was limited to only four provinces in South Africa. Secondly, the clients in the form of directors, senior managers, and managers who participated in this study may have been more likely to be more interested in workers’ H&S than others. Another limitation is the issue of qualitative findings that do not allow extensive generalisation. Furthermore, the nature of the research topic and sensitiveness attached to H&S leadership and behaviours of the clients made it difficult for the participants to discuss inadequacies relative to H&S management in their respective organisations. The constructs applied in this study were drawn from the literature review. The study focused on the critical H&S leadership and behaviours of the clients, and excluded the contributions of workers to the causes of at-risk work practices or unsafe behaviours of workers. This is, to a certain degree, a limitation to the study. However, despite these limitations, the survey

Acta Structilia 2014: 21(2)
64
provided important findings on clients’ leadership approach towards construction H&S management:
• Poor leadership, lack of commitment to, involvement and participation in H&S exist among the top management among clients;
• Unethical behaviours are prevalent among top leaders;• Project H&S plans are inadequate and inappropriate, thus
militating against contractors complying with legislative requirements and achieving healthy and safe workplaces;
• H&S is not accorded status equal to that afforded to cost, quality, and time in respect of project success parameters, the consequence being, inter alia, inadequate financial provision for project H&S by clients in the BoQs, and contractors’ inability to make adequate financial provision for H&S in their tenders, and
• The complex and dynamic nature of construction-site workplaces further shows that inadequate construction H&S workplace planning impacts on workers’ unsafe behaviours or at-risk work practices.
6. Conclusions and recommendationsBased on the research results, it can be concluded that clients’ poor H&S leadership and behaviour lead to the award of contracts to contractors with poor H&S records. The major consequence of poor clients’ H&S leadership, lack of commitment and involvement in project H&S is a lack of funds for contractors’ H&S interventions on sites. This results in an increase in site fatalities, injuries, ill health, poor H&S training, and inadequate provision of PPE to workers. Therefore, adequate financial provision for project H&S during the planning phases, pre-qualification of contractors on H&S, and adequate monitoring to ensure that contractors comply with the project H&S plans in the clients’ organisations should be adequately implemented. In addition, causes of workers’ unsafe behaviour and poor construction H&S relative to clients’ poor H&S leadership and behaviour, such as the appointment of contractors with poor H&S records and inadequate financial allocation for project H&S, should be addressed. Clients should, as a matter of importance, provide H&S information to the design team during the project-planning phases.

Okorie, Emuze, Smallwood & Van Wyk • The influence of clients’ ...
65
References listAgresti, A. & Franklin, H. 2007. Statistics: The art and science of learning from data. Upper Saddle River, New Jersey: Pearson Prentice Hall.
Akintoye, A. & Main, J. 2007. Collaborative relationships in construction: The UK contractor’s perception. Engineering, Construction and Architectural Management, 14(6), pp. 597-617.
Babbie, E. 2007. Basics of social research. 3rd edition. Belmont, California: Thomson/Wordsworth Learning.
Behm, M. 2005. Linking construction fatalities to design for construction safety concept. Safety Science, 43(8), pp. 589-611.
Borrego, M., Douglas, E.P. & Amelink, C.T. 2009. Quantitative, qualitative and mixed research methods in engineering education. Journal of Engineering Education, 98(1), pp. 53-66.
Brauer, L.R. 2006. Safety and health for engineers. 2nd edition. Hoboken, New Jersey: Wiley-Interscience.
Bust, D.P., Gibb, F.G.A. & Pink, S. 2008. Managing construction health and safety: Workers and communicating safety messages. Safety Science, 46(3), pp. 585-597.
Chinda, T. & Mohammed, S. 2008. Structural equation model of construction safety culture. Engineering Construction and Management, 15(2), pp. 114-131.
Coble, R.J. & Haupt, T.C. 1999. Implementation of safety and health on construction sites. In: Hinze, J. & Coble, R.J. (Eds). Proceedings of the 2nd International Conference of W99 Working Commission, 24-27 March, Honolulu: University of Florida, pp. 904-916.
Coke, A. & Sridhar, C. 2010. Controlling exposure to biological hazards. In: McAleenan, C. & Oloke, D. (Eds). ICE manual of health and safety in construction. London: Thomas Telford, pp. 135-148.
Conchie, S.M., Taylor, P.J. & Charlton, A. 2011. Trust and distrust in leadership: Mirror reflections? Safety Science, 49(1), pp. 1208-1214.
cidb (Construction Industry Development Board). 2009. Construction health and safety in South Africa: Status and recommendations. Pretoria: cidb.
cidb (Construction Industry Development Board). 2011. Construction quality in South Africa: A client perspective. Pretoria: cidb.

Acta Structilia 2014: 21(2)
66
Dainty, A.R.J. 2008. Methodological pluralism in construction management research. In: Knight, A. & Roddock, L. (Eds). Advanced research methods in the built environment. Oxford: Willey-Blackwell, pp. 1-13.
Fewings, P. 2010. Working at height and roof work. In: McAleenan, C. & Oloke, D. (Eds). ICE manual of health and safety in construction. London: Thomas Telford, pp. 165-176.
Fourie, J. 2009. Construction safety. Construction World, April, pp. 40-41.
Gambatese, J.A., Toole, T.M. & Behm, M. 2008. Prevention through design practice: A construction industry perspective. Professional Safety, 50(9), pp. 32-44.
Geminiani, F.L. 2008. A model to improve the effectiveness of the occupational health and safety inspectorate functions relative to South African construction. Unpublished DTech thesis, Nelson Mandela Metropolitan University, Port Elizabeth.
Gillen, M., Kool, S., McCall, C., Sum, J. & Moulden, K. 2004. Construction managers’ perceptions of construction safety practices in small and large firms: A qualitative investigation. American Journal of Industrial Medicine, 23(3), pp. 233-243.
Gliem, J.A. & Gliem, R.R. 2003. Calculating, interpreting, and reporting Cronbach’s alpha reliability coefficient for Likert-type scales. In: 21th Annual Midwest Research-to-Practice Conference on Adult, Continuing and Community Education, 8-10 October, Columbus, Ohio, pp. 82-88.
Haslam, R.A., Hide, S.A, Gibb, A.G.F., Gyi, D.E. & Atkinson, S. 2005. Ergonomics in building and construction. Applied Ergonomics, 36(4), pp. 401-415.
Hinze, J.W. 2006. Construction safety. 2nd edition. Upper Saddle River, New Jersey: Prentice-Hall.
Hopkins, P. 2008. The skills crisis in the pipeline sector of the oil and gas business. Journal of Pipeline Engineering, 7(3), pp. 147-172.
Huang, X. & Hinze, J. 2006. Owner’s role in construction safety. Journal of Construction Engineering and Management, 132(2), pp. 174-181.
ILO (International Labour Organisation). 2010. ILO standards on occupational safety and health, promoting a safe and healthy working environment. Geneva: ILO.

Okorie, Emuze, Smallwood & Van Wyk • The influence of clients’ ...
67
Kheni, N.A. 2008. Impact of health and safety performance of small and medium-sized construction businesses in Ghana. Unpublished PhD thesis, Loughborough University, United Kingdom.
Krause, T.R. 2003. A behaviour-based safety approach to accident investigation. Professional Safety, 45(12), pp. 342-356.
Leedy, P.D. & Ormrod, J.E. 2005. Practical research: Planning and design. 8th edition. Upper Saddle River, New Jersey: Pearson.
Lingard, H. & Rowlinson, S. 2005. Occupational health and safety in construction. Project management. New York: Spon Press.
Lutchman, C., Maraj, R. & Ghanem, W. 2012. Safety management: A comprehensive approach to developing a sustainable system. Boca Raton, Florida: CRC Press.
Maree, K. & Pietersen, J. 2007. Surveys and the use of questionnaires. In: Maree, K. (Ed.). First steps in research. Pretoria: Van Schaik Publishers, pp.155-170.
Matthysen, H.J. 1984. Occupational safety in South Africa. In: Bird, F. (Ed.). Management Guito loss control. 3rd edition. Atlanta, Georgia: Institute Press, pp.10-28.
McAleenan, P. 2010. Assessing safety issues in construction. In: McAleenan, C. & Oloke, D. (Eds). ICE manual of health and safety in construction. London: Thomas Telford, pp. 101-110.
Mthalane, D., Othman, A.A.E. & Pearl, R.G. 2008. The economic and social impacts of site accidents on the South African society. In: Verster, J.J.P. & Marx, H.J. (Eds). Proceedings of the 5th Post Graduate Conference on Construction Industry Development, 16-18 March 2008, Bloemfontein. Pretoria: cidb, pp. 1-10.
Musonda, I. & Smallwood, J. 2009. Client commitment and attitude to construction health and safety in Botswana. In: Haupt, T.C. & Smallwood, J.J. (Eds). Proceedings of People in Construction TG59 Conference, 12-14 July, Port Elizabeth, pp. 231-347.
Musonda, I., Pretorius, J. & Haupt, T.C. 2012. Assuring health and safety performance on construction projects: Clients’ role and influence. Acta Structilia, 19(1), pp. 71-105.
Okorie, V.N. 2014. Behaviour-based health and safety management in construction: A leadership-focused approach. Unpublished PhD thesis. Nelson Mandela Metropolitan University, Port Elizabeth: Department of Construction Management.

Acta Structilia 2014: 21(2)
68
Okorie, V.N. & Smallwood, J.J. 2010. Impact of health and safety culture on construction site performance in South Africa. In: Proceedings of ASOCSA 5th Built Environment Conference, 18-20 July, Durban, pp. 495-408.
Oloke, A.O. 2010. Responsibility of key duty holders in construction design and management. In: McAleenan, C. & Oloke, D. (Eds). ICE manual of health and safety in construction. London: Thomas Telford, pp. 29-37.
Pillay, K. & Haupt, T.C. 2009. The cost of construction accidents: An exploratory study. In: Haupt, T.C. & Smallwood, J.J. (Eds). Proceedings of TG59 People in Construction Conference, 12-14 July, Port Elizabeth, pp. 137-148.
RSA (Republic of South Africa). 2001. Preferential Procurement Policy Framework Act, Act No. 5 of 2000. Government Gazette No. 22549. Pretoria: Government Printer.
RSA (Republic of South Africa). 2003. Construction Regulations 2003. Government Gazette No. 25207. Pretoria: Government Printer.
Samuels, L.M., Witmer, A.J. & Schaffner, A. 2012. Statistics for the life sciences. 4th edition. New York: Pearson.
Smallwood, J.J. 1996. The role of project managers in occupational health and safety. In: Alves Dias, L.M. & Coble, R.J. (Eds). Proceedings of the First International Conference of CIB Working Commission W99 Implementation of Safety and Health on Construction Sites, 4-7 September. Rotterdam: Balkema, pp. 227-236.
Spangenberg, S. 2009. An injury risk model for large construction projects. Risk Management, an International Journal, 24(2), pp. 111-134.
Steven, S. 2010. The different phases in construction – Design in health and safety to the project life cycle. In: McAleenan, C. & Oloke, D. (Eds). ICE manual of health and safety in construction. London: Thomas Telford, pp. 51-69.
Suraji, A., Duff, R.A. & Peckitt, J.S. 2006. Development of causal model of construction accident causation. Journal of Construction Engineering and Management, 127(4), pp. 344-354.
Sutrisna, M. 2009. Research methodology in doctorial research: Understanding the meaning of conducting qualitative research. Working Paper presented in ARCOM Doctorial Workshop, Liverpool, John Moores University, 12 May.

69
Oorsigartikel • Review article
Jeremy Gibberd
Sustainability impacts of building products: An assessment methodology for developing countries
Peer reviewed and revised
Abstract This article investigates sustainability impacts of building products during production stage in developing countries. An analysis of literature is undertaken in order to establish current building product assessment methodologies and their relevance to developing country contexts. The review finds that many of these methodologies have limited applicability to developing countries and, therefore, an alternative methodology, termed the Sustainable Building Material Index (SBMI), is proposed. The SBMI methodology draws on both a life-cycle assessment approach and an expanded definition of sustainability, which includes social and economic aspects as well as environmental impacts, to develop a sustainability impact index of building products. The article describes and critically evaluates the SBMI and makes recommendations for further research. It appears that the SBMI has potential as methodology for establishing, and presenting, sustainability impacts of building products in developing countries. It is innovative as it provides a way of capturing simple socio-economic sustainability aspects related to building products that do not include other building product assessment methodologies. This aspect makes it particularly relevant to developing countries where there is a strong interest in using construction and related industries to create beneficial social and economic impacts such as job creation and training. Keywords: sustainability, building materials, methodology, sustainable building material index (SBMI)
AbstrakHierdie artikel ondersoek die volhoubaarheidsimpak van bou-produkte tydens die produksie-fase in ontwikkelende lande. ’n Literatuurstudie is gedoen ten einde huidige bou-produk assesseringsmetodes te bepaal en vas te stel wat hul relevansie binne die konteks van ontwikkelende land is. Die oorsig het bevind dat baie van hierdie metodes beperkte toepaslikheid binne ontwikkelende lande het en dus word ’n alternatiewe metode, die Volhoubare Boumateriaal Indeks (SBMI), voorgestel. Die SBMI-metode maak gebruik van beide ’n lewensiklus assesseringsbenadering asook ’n uitgebreide definisie van volhoubaarheid wat maatskaplike en ekonomiese aspekte asook omgewingsimpakte insluit, om sodoende ’n volhoubaarheidsimpak indeks van bou-produkte te ontwikkel.
Dr Jeremy T. Gibberd, Adjunct Senior Lecturer, University of Pretoria, South Africa; Principal Researcher, CSIR, Pretoria, South Africa, and Specialist, Gauge, Pretoria, South Africa, PO Box 14738, Hatfield, Pretoria, South Africa, 0028. Phone: +27 82 857 1318, email: <[email protected]>

Acta Structilia 2014: 21(2)
70
Die artikel beskryf en evalueer krities die SBMI en maak aanbevelings vir verdere navorsing. Die SBMI kom voor as ’n potensiële metode vir die stigting en aanbieding van volhoubaarheidsimpakte vir bou-produkte in ont wikkelende lande. Dit is innoverend, want dit bied ’n manier om eenvoudige sosio-ekonomiese volhoubaarheidsaspekte wat verband hou met bou-produkte wat nie in ander bou-produk assesseringsmetodologieë ingesluit is nie, vas te vang. Hierdie aspek is veral relevant vir ontwikkelende lande waar daar ’n sterk belangstelling is in die gebruik van die konstruksie en verwante bedrywe om voordelige sosiale en ekonomiese impak soos werkskepping en opleiding te skep.
1. IntroductionThe assessment of materials in terms of sustainability is still in its infancy and is not well understood (Ding, 2008: 451-464). Current methodologies tend to focus on environmental issues and rely on life-cycle assessment or similar processes (Jönsson, 2000: 223-238). However, these systems tend not to address social or economic aspects and, therefore, cannot be said to assess sustainability (Cole, 2005: 455-467; Cooper, 1999: 321-331; Liu, Li & Yao, 2010: 1482-1490; Zuo & Zhao, 2014: 271-281). In developing countries, the lack of social and economic sustainability criteria and assessment is a significant shortcoming, as there is a strong interest in using construction and related industries to create social and economic impacts such as job creation and training (Gibberd, 2014: 49-61).
This article draws on a definition of sustainability, which includes social, economic and environmental aspects, and applies it to building products. The definition is analysed to develop environmental, social and economic criteria that can be used to assess the sustainability impacts of building-product manufacture. This is combined with concepts from a life-cycle assessment (LCA) approach in order to develop an index that can be used to compare building products. This index is referred to as the Sustainable Building Materials Index (SBMI). The article describes and critically reviews the SBMI and develops recommendations for further research.
2. Sustainability impacts of building materialsThe building-product industry has very substantial environmental impacts. Conventional building processes mean that buildings require a vast quantity and variety of materials. In Spain, for instance, it is estimated that every habitable square meter of a conventional building requires a total of 2.3 tonnes of more than 100 types of materials (Zabalza Bribián, Valero Capilla & Aranda Usón, 2011: 1133-1140).
Approximately 50% of all materials extracted from the earth’s crust are manufactured into construction materials and products.

Gibberd • Sustainability impacts of building products
71
Consequently, these materials also account for 50% of the waste stream (Koroneos & Dompros, 2007: 2114-2123). In Europe, minerals extracted for building materials amount to 4.8 tonnes per inhabitant per year, 64 times the average weight of a person (Zabalza Bribián et al., 2009: 1133-1140).
The production of materials is also energy intensive and produces significant carbon emissions. For instance, the embodied energy of materials is estimated to account for between 15% and 60% of a building’s life-cycle energy consumption (Huberman & Pearlmutter, 2008: 837-848; Liu et al., 2010: 1482-1490). Carbon emissions from one industry, the cement industry, are estimated to produce 5% of global carbon emissions (Pulselli, Simoncini, Ridolfi & Bastianoni, 2008: 647-656). The very significant impacts of building materials and products indicate that it is important to understand how this can be assessed in terms of sustainability.
3. Defining sustainabilityThe World Conservation Union, the United Nations Environment Programme and the World Wide Fund for Nature define sustainable development as “... improving the quality of human life while living within the carrying capacity of supporting eco-systems (International Union for Conservation of Nature, 1991: 1-223).
This provides clear objectives, namely ‘improving quality of human life’ and ‘living within carrying capacity of supporting eco-systems’. The World Wildlife Fund (WWF) quantifies these objectives to define sustainability as a state within which societies have an Ecological Footprint (EF) of less than 1.8 global hectares per person and a Human Development Index (HDI) value of above 0.8 (WWF, 2006: 1-44).
An EF is an estimate of the amount of biologically productive land and sea required to provide the resources a human population consumes, and absorb the corresponding waste. These estimates are based on consumption of resources and production of waste and emissions in the following areas:
• Food, measured in type and amount of food consumed.• Shelter, measured in size, utilisation and energy consumption.• Mobility, measured in type of transport used and distances
travelled.• Goods, measured in type and quantity consumed.• Services, measured in type and quantity consumed• Waste, measured in type and quantity produced.
Acta Structilia 2014: 21(2)
72
The area of biologically productive land and sea for each of these areas is calculated in global hectares (gha) and then added together to provide an overall EF (Wackernagel & Yount, 2000: 21-42). This measure relates impacts to the earth’s carrying capacity of 1.8 global hectares (gha) per person.
The HDI was developed by the United Nations to measure ‘quality of life’ and as an alternative to economic indicators for establishing development progress (UNDP, 2007: 1-224). The measure is based on:
• A long healthy life, measured by life expectancy at birth.• Knowledge, measured by the adult literacy rate and combined
primary, secondary, and tertiary gross enrolment ratio.• A decent standard of living, as measured by the GDP per
capita in purchasing power parity (PPP) in terms of US dollars.The HDI is based on widely available data and provides an inter-nationally acceptable definition of quality of life.
This article focuses on building-product manufacture impacts related to EF and HDI performance. While this is complex, an understanding of these fields can be developed by analysing the subcomponents of the EF and HDI and applying these to a building-product manufacturing site. This process can be informed by an understanding of life-cycle assessment processes that aim to establish the environmental impacts of products.
3.1 Life-cycle assessment (LCA)
A growing awareness of the environmental impacts of materials has led to a wide variety of claims in manufacturers’ literature (Cole, 2005: 455-467). These aim to appeal to the architect and the client wishing to achieve a green building. However claims can be selective and highlight only positive aspects, while obscuring areas of poor performance. There is, therefore, a need for standardised, rigorous and objective assessment methods. This gap is being addressed by a range of systems, including Eco-Quantm, Athena, Envest 2, BeCost and BEES, that aim to understand and assess the environmental impacts of building materials.
Eco-Quantum is an Australian life-cycle assessment method based on ISO 14040. It assesses environmental impacts and greenhouse gas emissions of products over their entire total life cycle. Athena is an American life-cycle assessment tool for building and building assemblies. The process also complies with ISO 14040. Envest 2 was developed by the British Research Establishment to assess and present

Gibberd • Sustainability impacts of building products
73
environmental and life-cycle costs of different material and building assembly options. Twelve criteria, ranging from climate change to toxicity, are used to measure environmental impacts, and these are agglomerated into a single Ecopoint score. BeCost was developed by VTT Technical Research Centre in Finland. The tool can be used to assess and present environmental impact data and maintenance costs. BEES (Building for Environmental and Economic Sustainability) was developed by the National Institute of Standards and Technology in the USA. It measures the environmental performance of building products using a life-cycle approach aligned with ISO 14040. All of these assessment methodologies are based on life-cycle assessment approaches (Rincón, Castell, Pérez, Solé, Boer & Cabeza, 2013: 44-552; Hertwich, Pease & Koshland, 1997: 13-29; Peris Mora, 2007: 1329-1334; Esin, 2007: 3860-3871; Malmqvist, Glaumann, Scarpellini, Zabalza, Aranda, Llera & Díaz, 2011: 900-1907; Ekvall, 2005: 351-1358; Zabalza Bribián et al., 2009: 2510-2520).
A number of benefits are associated with life-cycle assessment approaches. The methodology provides a structured process whereby often complex data sets can be acquired, assimilated and analysed in order to provide a picture of the impacts of product or building throughout its life cycle. It can be used to identify areas with significantly negative impacts and evaluate options for improving this. In addition, the results of life-cycle assessments support environmental labelling of buildings and can contribute to the setting of environmental targets for buildings and the building sector as a whole (Zabalza Bribián et al., 2009: 2510-2520).
Life-cycle assessment approaches can support significant reduction in environmental impacts associated with building materials. For instance, González & García Navarro (2006: 902-909) show that 30% reductions in carbon emissions can be achieved through the careful selection of materials. Morel, Mesbah, Oggero & Walker (2001: 1119-1126) also show that the use of local materials can reduce the energy used in building materials by up to 215% and the energy used in transportation of materials by 453%. Life-cycle assessments of building materials can also identify the benefits of different production processes and the value of recycling waste materials. Demir & Orhan (2003: 1451-1455), for instance, demonstrate that 30% of the consumption of raw materials and production of waste, by mass, can be reduced in clay-brick manufacture by recycling fired waste bricks in production.
However, life-cycle assessments may also be regarded as overly complex and costly. Acquisition of data may be a problem, as

Acta Structilia 2014: 21(2)
74
manufacturers do not readily share this with customers and LCA tool developers. The proliferation of systems and the differing results achieved with different systems also mean that there are concerns about the lack of a standard interface and potentially arbitrary results. Finally, there are also reservations about the accuracy of the results, in some instances (Zabalza Bribián et al., 2009: 2510-2520). This may be the reason for the slow adoption of LCA approaches within building-certification processes, green-building rating systems and in-building regulations. Difficulties related to acquisition of data, cost, and technical capacity to undertake life-cycle assessments are likely to be even more acute in developing countries.
3.2 Developing country contexts
A review of the literature indicates that product life-cycle assessment is rarely applied to contexts in developing countries. This may be due to the lack of required data and the perception that the processes are overly complex and expensive (Malmqvist et al., 2011: 1900-1907).
It may also be a result of the environmental focus of life-cycle assessment systems. While environmental issues are important, social and economic impacts are also of significant interest to developing countries. In these contexts, construction and related industries are often regarded as a means of creating beneficial social and economic impacts such as jobs and training. In South Africa, this is reflected in standards developed to promote preferential procurement of local products and materials, such as South African Technical Standard (SATS) 1286 (SABS, 2013: 1-5). SATS 1286 provides a protocol for measuring the local content of materials and products, in order to support the local industries. It enables local content requirements to be specified in tender documents and to be monitored during construction. Standards are also being developed to ensure that construction processes result in improved levels of education. Examples of this are the training targets set within the Standard for Developing Skills through Construction Works Contracts (cidb, 2012: 1-5). This standard sets out specific training requirements related to the construction value of projects and applies to both the professional teams and the construction workers.
In addition, it could be argued that environmental life-cycle assessment processes, by not measuring social and economic impacts, cannot claim to measure the broader concept of sustainability which includes social and economic aspects (Ortiz, Castells, & Sonnemann, 2009: 8-39). There is, therefore, a need to develop a simple methodology that is able to measure the social, economic and environmental sustainability

Gibberd • Sustainability impacts of building products
75
impacts of building products for contexts in developing countries. It is envisaged that assessments using this methodology, or the ‘indication of the sustainability impact’, of a building product will make a valuable contribution to understanding how sustainability principles can be integrated into building products (Ding, 2005: 3-16).
4. Research methodologyAn index of sustainability impacts related to the manufacture of a building product can be developed by drawing on the definition of sustainability provided earlier in this article, and combining this with aspects of a life-cycle approach. This can be used to synthesise a ‘hybrid’ methodology, termed the Sustainable Building Material Index (SBMI). The steps in developing this index are as follows.
• Establish a specification for the SBMI based on contexts in developing countries.
• Define sustainability indicators by applying an appropriate definition of sustainability to a building-product manufacturing system and develop an assessment framework.
• Apply the concept of a functional unit to the assessment framework, in order to standardise calculation methods and allow comparisons between different products.
• Define performance tables that enable results to be classified in a scale of 0 to 5 and develop an appropriate report.
This study focuses on building-product manufacture, as this is within the sphere of influence of the building-product industry rather than a full life-cycle assessment approach which includes many aspects such as building operation and demolition that are not directly under their control.
4.1 Specifications for a sustainable building material index
In the context of a developing country, environmental, social and economic data related to building materials are not readily available. There are no detailed environmental databases for materials such as those used for life-cycle assessment in Europe and the US. Similarly, detailed industry-specific social and economic statistics are not readily available to support analysis. This means that data used for sustainability assessments of building materials must be sourced directly from building-material manufacturers.
A lack of available data makes undertaking detailed calculations to ascertain direct EF and HDI impacts of building materials complex

Acta Structilia 2014: 21(2)
76
and time consuming (Malmqvist et al., 2011: 1900-1907). In this context, it is proposed that proxy indicators, or equivalent factors, be used to make the process of sustainability assessment practical (Hertwich et al., 1997: 13-29). As the capacity of small manufacturers to collect data may be limited, it is suggested that a restricted set of key sustainability indicators be developed. In addition, it is proposed that these be restricted to data that is readily available and easily collected by building manufacturers.
Therefore, the assessment methodology should:
• Use readily available data.• Measure social and economic impacts related to sustainability
as well as environmental impacts;• Be simple enough to be carried out by small building-product
manufacturers, and• Provide reports that will enable materials and products to be
assessed and compared in terms of their sustainability impacts.
4.2 The building manufacturing industry as a system
The first step in developing appropriate sustainability indicators is to describe the building-manufacturing industry as a system, with inputs, outputs, as well as social and economic impacts, as illustrated in Figure 1.
Building manufacturer• Employment• Training• Mentoring• Health and safety• Ill health
Outputs• Carbon emissions• Pollution• Waste
Outputs• Building product
Directly related enterprise• Employment
Inputs• Resources• Water• Energy• Land use
Figure 1: A building-product manufacturing systemSource: Author, 2014

Gibberd • Sustainability impacts of building products
77
Tables 1 and 2 describe in more detail indicators identified by means of this process. Table 1 describes ecological indicators and aims to provide a proxy for EF impact of building materials. Table 2 describes human development and aims to provide a proxy for HDI impact of building materials.
Table 1: Ecological indicators
Ecological indicator Units Description
Resource consumption (kg/year) This measures the quantity of material
consumed to produce the building product.
Carbon emissions (CO2equiv/year) This measures the quantity of carbon dioxide emitted to produce the building product.
Water consumption (kl/year) This measures the quantity of water consumed to produce the building product.
Land use (ha/year) This measures the quantity of land area used to produce the building product.
Waste (kg equiv/year) This measures the quantity of waste generated to produce the building product.
Pollution (kg equiv/year) This measures the quantity of waste generated to produce the building product.
Source: Author, 2014
Table 2: Human development indicatorsHuman
development indicator
Units Description
Employment (FTE employment years/year)
This measures the employment required to produce the building product.
Employment in related enterprises
(FTE enterprise years/year)
This is a measure of employment in related enterprises, such as catering, transport and security industries, required to produce the building product.
Formal training (Formal training hours/year)
This is a measure of education and training of employees during the production of the building product.
Formal mentoring(Formal mentoring hours/year)
This is a measure of education and is the extent of mentoring of employees during the production of the building product.
Health and safety (Incidents/year)This is a measure of health and is the extent of health and safety incidents experienced to produce the building product.
Ill health per year (Absenteeism days/year)
This is a measure of health and is the extent of absenteeism experienced to produce the building product.
Source: Author, 2014

Acta Structilia 2014: 21(2)
78
Tracking these indicators on a manufacturing site can be used both to support improved understanding of the sustainability impacts associated with a building product and to establish a measure of the impact per building product. This is calculated by dividing annual ecological or human development impacts associated with a manufacturing process by the number of products produced within the same time period, as indicated in Figure 2.
Figure 2: Ecological impact per productSource: Author, 2014
Human development impacts per product are established in the same way, and can be calculated by substituting ecological impact with human development impact in the equation in Figure 2. This calculation, while useful for measuring sustainability performance of manufacturing processes, does not support comparisons between different materials. This requires further standardisation, and the application of the concept of a functional unit.
4.3 Functional unit
The functional unit concept was developed within the life-cycle assessment methodology in order to support environmental impact comparisons between products. ISO 14044 defines the functional unit as the “quantified performance of a product system for use as a reference unit” (ISO, 2006: 1-46).
In the building industry, this can be applied by defining products in terms of quantities of ‘final useful constructed elements’ such as ‘an area of compliant wall assembly’. ‘Compliant’, in this context, means that the wall assembly meets required local performance standards related to thermal resistance, structure, as well as fire and water resistance (such as those found in national building regulations). Thus, environmental and human development impacts can be ascertained, and then compared, for the same functional unit, such as a square metre of compliant wall area. In this way, the use of a functional unit supports comparisons of different materials and products (Kellenberger & Althaus, 2009: 818-825).
Therefore, if the impacts of clay bricks are to be compared with those concrete blocks, wall assemblies of both materials that achieve

Gibberd • Sustainability impacts of building products
79
the same, or similar, performance (such as thermal resistance, fire resistance, structural integrity, and so on) need to be modelled. From each of these wall assemblies, quantities of materials (bricks and blocks) can then be calculated. Once these quantities have been calculated, they can be multiplied by the respective human development and ecological impacts of the unit of building product, as calculated in the equation in Figure 2. This process provides a full set of ecological and human development impacts per functional unit of the different products enabling the two to be compared on a like-for-like basis.
Including performance in the concept of the functional unit is valuable, as it encourages innovation and improvement not only in the manufacturing process, but also in the design of complete buildings. For instance, if an innovative design was able to attain ‘compliant’ performance with fewer bricks, a lower ecological impact per functional unit could be achieved. This concept can be applied to all functional products and materials used in buildings, including components such as water taps and roof sheeting. An example of its application to a building envelope is show in Figure 3.
Figure 3: Building envelope functional unitsSource: Author, 2014
4.4 Sustainable building material index
The final stage is the conversion of the sustainability impacts calculated per functional unit into an index. The index could consist of values from ‘0’ to ‘5’, with ‘5’ being the worst performance and ‘0’, the best performance. Index values could be calculated in the following way.

Acta Structilia 2014: 21(2)
80
Sustainability impacts could be identified for each functional unit and ‘5’ set as the value for average performance. The values for best performance can also be calculated in terms of optimum impacts. For instance, in the case of carbon emissions, this could be carbon neutrality, and would equate to a ‘0’. The values between ‘0’ and ‘5’ would then be equally spaced between these limits to define the respective index values between ‘0’ and ‘5’. A graphical and tabular report on these index values for a material could then be developed, with an example provided in Figure 4.
5. DiscussionA critical review of the SBMI methodology suggests that this has potential as a means for assessing building products and materials in terms of their sustainability impacts. However, the level of detail of the assessment is low compared to life-cycle assessment approaches. In addition, the SBMI does not assess the individual manufacturing processes that are used on a site and, therefore, it is not useful as a diagnostic tool for a building-product manufacturer wishing to improve these processes. Neither does it provide overall life-cycle impacts associated with different materials and products, which would be of interest to an architect and client.
However, by providing a high-level indication of sustainability impacts of materials, the SBMI does provide a manufacturer with a useful methodology for tracking the performance of production lines and plants. The methodology also lends itself to simple modelling, enabling a manufacturer to rapidly establish the impacts of different options. For instance, the ecological impacts of different processes can be calculated to inform decision-making. The methodology also provides a structured way in which manufacturers can assess their own products and, therefore, improve their sustainability performance over time.
The methodology offers a way for building designers to take sustainability into account when specifying products. Ecological and human development impacts of different products can be compared, in order to identify products with the most beneficial impacts. Minimum sustainability targets for materials can also be set and used as a way of improving manufacturing processes of building products and ensuring that required impacts are achieved.

Gibberd • Sustainability impacts of building products
81
SUSTAINABLE BUILDING MATERIAL INDEX (SBMI) V2Site address Thulamela siteAnalysis period 30 June 2013 - 1 July 2014Analysis period (days) 365
EcologicalResource consumption per year (kg/year) 3Carbon emissions per year (CO2equiv/year) 4Water consumption per year (kl/year) 5Land use hectares (ha/year) 3Waste per year (kg equiv/year) 3Pollution per year (kg equiv/year) 4
Human developmentEmployment per year (FTE employment years/year) 1Employment in related enterprises per year (FTE) 1Formal training per year (Formal training hours/year) 1Formal mentoring per year (Formal mentoring hours/ year) 2Health and safety incidents per year (Incidents/year) 3Ill health per year (Absenteeism days/year) 3
Ecological 3.67
Human development 1.83
Overall 2.75
Resource consumption
Carbon emissions
Water consumption
Land use
Waste
Pollution
Employment
Enterprise
Training
Mentoring
Health and safety
Ill health
1
0
2
3
4
5
Figure 4: Sustainable Building Material Index (SBMI) V2 reportSource: Author, 2014

Acta Structilia 2014: 21(2)
82
6. ConclusionThe SBMI methodology appears to have potential as a way of providing an indication of the sustainability impacts of building products. In particular, it is innovative as it provides a way of capturing simple socio-economic sustainability aspects related to building products, which has not been included in many other building-product assessment methodologies.
The escalating interest in sustainability and socio-economic impacts of building materials will make this methodology, and research in this field, increasingly relevant. It is recommended that further research be carried out to develop the methodology further and investigate how this can be applied to improve the sustainability impacts of building products.
References listCole, R.J. 2005. Building environmental assessment methods: Redefining intentions and roles. Building Research & Information, 33(5), pp. 455-467.
cidb (Construction Industry Development Board). 2012. Standard for developing skills through construction works contracts. [online] Available from: <http://www.cidb.org.za/Documents/KC/cidb_Publications/Best_prac_scheme/Standard_for_Construction_Skills_Development_2012_09_28.pdf> [Accessed: 15 January 2014].
Cooper, I. 1999. Which focus for building assessment methods – environmental performance or sustainability? Building Research & Information, 27(4-5), pp. 321-331.
Demir, I. & Orhan, M. 2003. Reuse of waste bricks in the production line. Building and Environment, 38(12), pp. 1451-1455.
Ding, G.K.C. 2005. Developing a multicriteria approach for the measurement of sustainable performance. Building Research & Information, 33(1), pp. 3-16.
Ding, G.K.C. 2008. Sustainable construction – The role of environmental assessment tools. Journal of Environmental Management, 86(3), pp. 451-464.
Ekvall, T. 2005. SETAC summaries. Journal of Cleaner Production, 13(13-14), pp. 1351-1358.
Esin, T. 2007. A study regarding the environmental impact analysis of the building materials production process (in Turkey). Building and Environment, 42(11), pp. 3860-3871.

Gibberd • Sustainability impacts of building products
83
González, M.J. & García Navarro, J. 2006. Assessment of the decrease of CO2 emissions in the construction field through the selection of materials: Practical case study of three houses of low environmental impact. Building and Environment, 41(7), pp. 902-909.
Gibberd, J. 2014. Measuring capability for sustainability: The Built Environment Sustainability Tool (BEST). Building Research & Information, 43(1), pp. 49-61.
Hertwich, E.G., Pease, W.S. & Koshland, C.P. 1997. Evaluating the environmental impact of products and production processes: A comparison of six methods. Science of the Total Environment, 196(1), pp. 13-29.
Huberman, N. & Pearlmutter, D. 2008. A life-cycle energy analysis of building materials in the Negev desert. Energy and Buildings, 40(5), pp. 837-848.
IUCN (International Union for Conservation of Nature). 1991. Caring for the earth: A strategy for sustainable living. Gland, Switzerland: IUCN.
ISO (International Organisation for Standardisation). 2006. ISO 14044: Environmental management – Life cycle assessment – Requirements and guidelines. Geneve: ISO).
Jönsson, Å. 2000. Tools and methods for environmental assessment of building products: Methodological analysis of six selected approaches. Building and Environment, 35(3), pp. 223-238.
Kellenberger, D. & Althaus, H.J. 2009. Relevance of simplifications in LCA of building components. Building and Environment, 44(4), pp. 818-825.
Koroneos, C. & Dompros, A. 2007. Environmental assessment of brick production in Greece. Building and Environment, 42(5), pp. 2114-2123.
Liu, M., Li, B. & Yao, R. 2010. A generic model of Exergy assessment for the environmental impact of building lifecycle. Energy and Buildings, 42(9), pp.1482-1490.
Malmqvist, T., Glaumann, M., Scarpellini, S., Zabalza, I., Aranda, A., Llera, E. & Díaz, S. 2011. Life cycle assessment in buildings: The ENSLIC simplified method and guidelines. Energy, 36(4), pp.1900-1907.
Morel, J.C., Mesbah, A., Oggero, M. & Walker, P. 2001. Building houses with local materials: Means to drastically reduce the environmental impact of construction. Building and Environment, 36(10), pp. 1119-1126.

Acta Structilia 2014: 21(2)
84
Ortiz, O., Castells, F. & Sonnemann, G. 2009. Sustainability in the construction industry: A review of recent developments based on LCA. Construction and Building Materials, 23(1), pp. 28-39.
Peris Mora, E. 2007. Life cycle, sustainability and the transcendent quality of building materials. Building and Environment, 42(3), pp. 1329-1334.
Pulselli, R.M., Simoncini, E., Ridolfi, R. & Bastianoni, S. 2008. Specific energy of cement and concrete: An energy-based appraisal of building materials and their transport. Ecological Indicators, 8(5), pp. 647-656.
Rincón, L., Castell, A., Pérez, G., Solé, C., Boer, D. & Cabeza, L.F. 2013. Evaluation of the environmental impact of experimental buildings with different constructive systems using material flow analysis and life cycle assessment. Applied Energy, 109, pp. 544-552.
SABS (South African Bureau of Standards). 2013. SATS 1286 Local content. [online] Available from: <https://www.sabs.co.za/Local-Content/index.asp> [Accessed: 15 January 2014].
UNDP (United Nations Development Programme). 2007. Human Development Report 2007/2008. Fighting climate change: Human solidarity in a divided world. New York: United Nations Development Programme.
Wackernagel, M. & Yount, D. 2000. Footprints for sustainability: The next steps. Environment, Development and Sustainability, 2(1), pp. 21-42.
World Commission on the Environment and Development. 1987. Our common future. Oxford: Oxford University Press.
WWF (World Wildlife Fund). 2006. The Living Planet Report. Gland, Switzerland: WWF International.
Zabalza Bribián, I., Aranda Usón, A. & Scarpellini, S. 2009. Life cycle assessment in buildings: State-of-the-art and simplified LCA methodology as a complement for building certification. Building and Environment, 44(12), pp. 2510-2520.
Zabalza Bribián, I., Valero Capilla, A. & Aranda Usón, A. 2011. Life cycle assessment of building materials: Comparative analysis of energy and environmental impacts and evaluation of the eco-efficiency improvement potential. Building and Environment, 46(5), pp. 1133-1140.
Zuo, J. & Zhao, Z.-Y. 2014. Green building research – current status and future agenda: A review. Renewable and Sustainable Energy Reviews, 30, pp. 271-281.

85
1. Acta Structilia publiseer artikels in Afrikaans en Engels. Die verlangde lengte vir ‘n artikel is tussen 4 000 en 12 000 woorde.
2. Voornemende outeurs moet ’n elektroniese kopie van ’n artikel in MS Word formaat (oorspronklike word deur die outeur bewaar) voorlê deur dit per epos aan te stuur (sien epos adres by punt 24.).
3. Enige toepaslike artikel, in ’n verstaanbare skryfstyl, duidelik uit eengesit en reeds taalversorg, word verwelkom. Diagramme, sketse en foto’s (jpeg of tifformaat teen 300dpi) mag ingesluit word.
4. Die redakteur behou hom die reg voor om veranderinge, indien nodig, wat betref styl en aanbieding aan te bring. Sou aansienlike wysigings deur referente voorgestel word, sal ’n artikel na die outeur terugverwys word.
5. Kopiereg word aan Acta Structilia by aanvaarding van die artikel oorgedra.
6. Teksgedeeltes van artikels moet in Microsoft Word, Ariel skrif, font grootte 12, enkel spasiëring gedoen word.
7. Die titel van die artikel moet kort en bondig wees en in beide Afrikaans en Engels aangebied word.
8. ’n Kort opsomming in Afrikaans en Engels moet aan die begin van die artikel aangebring word.
9. Toepaslike sleutelwoorde in Afrikaans en Engels moet onder die opsomming aangebring word.
10. Opskrifte en onderskrifte word in Arabiese syfers genommer, geskei deur ’n punt en hoogstens tot drie vlakke, waarna ’n letter in hakies gebruik word, bv. 1. en 1.1 gevolg deur 1.1.1 en daarna a) ens.
11. Bronverwysings in die teks geskied volgens die Harvardstyl van verwysing: (Outeur, datum: bladsynommer[s]): bv. (Schleien, 2004: 2023).
12. Net egte voet en eindnote met die tersaaklike inligting moet gebruik word. Die Harvardstyl van verwysing is hier van toepassing.
13. Die verwysingslys volgens die Harvardstyl van verwysing moet volledig in alfabetiese volgorde aangebied word. Bv. Sun, M. & Howard, R. 2004. Understanding I.T. in construction. London: Spon Press.
14. ’n Kopie van alle internet dokumente wat in die teks verwys en gelys is in die bibliografie, moet die artikel vergesel.
15. Aanhalings word nie kursief gedruk nie, en word in dubbelaanhalingstekens aan gedui. Invoegings binne aanhalings word in blokhakies aangedui. Aanhalings wat langer as drie reëls is, word ge ïndenteer en het nie aanhalings tekens nie.
16. Slegs standaardafkortings word aanbeveel. Afkortings vir instellings kan gebruik word nadat dit vir die eerste keer volledig uitgeskryf is, met die afkorting daarna in hakies, vir terugverwysing.
17. Kursief moet nie oormatig gebruik word nie, indien wel, slegs vir konvensionele Latynse uitdrukkings bv. per se en vir woorde in ander tale.
18. Beklemtonings kry en kel aanhalings tekens.
19. Besonderhede van die oorsprong van ’n artikel moet aangedui word, soos in die geval van ’n kongresreferaat. Artikels word net vir keuring oorweeg indien vergesel van ’n verklaring dat dit nie elders vir publikasie voorgelê is, of reeds gepubliseer is nie.
20. Artikels word anoniem gerefereer. Die outeur(s) kan die name en adresse van tot drie vakkundiges (nie aan outeur[s] se eie instansie van werk verbonde nie) voorstel wat as referente sou kon optree.
21. Die outeur(s) van artikels wat geplaas word, sal elk twee komplimentêre kopieë van die betrokke uitgawe van Acta Structilia ontvang.
22. ’n Artikel moet vergesel word van die volledige titel, kwalifikasie en affiliasie, adres, telefoon en faksimilieenommers en indien moontlik ’n eposadres van die betrokke outeur(s).
23. Neem kennis dat ’n publikasieheffing van R30 per bladsy op die artikels wat gepubliseer word, betaalbaar is. ’n Faktuur sal aan die hoofouteur gestuur word.
24. Rig u bydrae(s) aan: Die Redakteur: Acta Structilia
Interne Posbus 47 Universiteit van die Vrystaat Posbus 339 Bloemfontein, 9300 SuidAfrika
Epos adres: [email protected]
ACTA STRUCTILIA
INLIGTING AAN OUTEURS

86
1. An article may be submitted in Afrikaans or English. The desired length for an article is between 4 000 en 12 000 words.
2. A copy of the typed article must be submitted (authors keep the original) in electronic format (MS Word) forwarded via email (see point 24.). The format must be kept as plain as possible for extracting and printing purposes.
3. An edited (proofread) article on any relevant topic, well presented and written in easy understandable style, will be considered for publishing. Diagrams, sketches and photos (jpeg or tif format at 300 dpi) may be included.
4. The editor reserves the right to alter the article(s) where necessary with regard to the style and presentation of the publication. If extensive alterations are advised by adjudicators the article(s) will be returned to the author.
5. Copyright is transferred to Acta Structilia Journal when an article is accepted for publication.
6. Article content must be written in Microsoft Word, Arial, font size 12, single spacing.
7. Titles must be short and concise, but informative. Supply suitable headings and subheadings where necessary. The title must be in both Afrikaans and English.
8. A short summary, in both Afrikaans and English, must be provided at the beginning of the text.
9. Applicable keywords in Afrikaans and English must be given after the summary.
10. Use Arabic numbers with full stops in between for headings and subheadings, i.e. 1. followed by 1.1 and 1.1.1 up to a maximum of three levels. After that use a) etc.
11. Source references in the text must be in the Harvard style of referencing (Author, date: pages). i. e. (Schleien, 1996: 2040)
12. Foot and endnotes are likewise done in the Harvard style of referencing.
13. The references list (Harvard style of referencing) should contain all the relevant information, and be listed alphabetically according to the names of the authors. i. e. Sun, M. & Howard, R. 2004. Understanding I.T. in construction. London: Spon Press.
14. A copy of internet documents cited in the text and listed in the references must accompany the article.
15. Quotations are not in italics and must be written in double inverted commas. Inserts in quotations are placed in block brackets. Quotations longer than three lines are indented and are placed without quotation marks.
16. Avoid uncommon abbreviations and acronyms. Abbreviations should be limited to those in general use. Names of corporations, etc are at first written out in full with the abbreviation in brackets after which the abbreviated form may be used.
17. Italics are preferred for stereotyped Latin terms such as per se and for words in other languages.
18. Use single inverted commas to emphasise words or phrases.
19. Details concerning the origin of the article should be indicated, i.e if it was presented at a congress. An article will only be referred to the panel of referees if the author clearly stated that it has not been submitted to other journals.
20. Authors may submit the names and addresses of three scholars (experts) in his field (not members at own place of work) as possible adjudicators.
21. The author(s) will receive two complimentary copies of the relevant issue of Acta Structilia.
22. The article must contain the title, qualifications and affiliations of the author(s), the address, telephone and facsimile numbers and if possible, the email address.
23. Note that a publication fee of R3000 per page is payable for every article published. An invoice will be sent to the main author.
24. Editorial address: The Editor: Acta Structilia Internal Post Box 47 University of the Free State PO Box 339 Bloemfontein, 9300 South Africa
Email address: [email protected]
ACTA STRUCTILIA
INFORMATION FOR AUTHORS

Referente en konsultante • Referees and consultants
Prof. Basie Verster (Verster, Berry & Verster Quantity Surveyors, Bloemfontein, South Africa)
Prof. Das Steÿn (Department of Town and Regional Planning, University of the Free State, South Africa)
Emeritus Prof Rob Pearl (Department of Surveying and Construction, University of Kwazulu-Natal, South Africa)
Prof. Leslie Petrik (Faculty of Natural Science, University of Western Cape, South Africa)
Prof. Chrisna du Plessis (Department of construction economics, University of Pretoria, South Africa)
Prof. Theo Haupt (Managing Member, OCCUMED Port Elizabeth, South Africa)
Dr Maléne Campbell (Town and Regional Planning, University of the Free State, South Africa)
Dr Bee Hua Goh (Departement of Building, National University of Singapore, Singapore)
Dr Leskey Cele (Chemistry Departement, Tshwane University of Technology, South Africa)
Dr Innocent Musonda (Department of Construction Management and Quantity Surveying, University of Johannesburg)
Mr Mark Massyn (Department of Construction Economics and Management, University of Cape Town, South Africa)

Inhoud • Contents
Navorsingsartikels • Research articlesThe strategic management of construction F Buys 1 companies during recessionary cycles R van Rooyen
Towards the establishment of a relevant H Cruywagen 22 national tender price index for the South African building industry
The influence of clients’ leadership in V Okorie 44 relation to construction health and FA Emuze safety in South Africa JJ Smallwood J van Wyk
Oorsigartikel • Review articleSustainability impacts of building products: JT Gibberd 69 An assessment methodology for developing countries
Inligting aan outeurs • Information for authors 85
Acta Structilia 2014:21 (2) ISSN 1023-0564
Acta Structilia is endorsed by the South African Council for the Quantity Surveying Profession (SACQSP) for promoting research and Continuing Professional Development (CPD).