airopeek nx v1.2 quicktour
TRANSCRIPT

Quick TourQuick Tour
EtherPeek NX™
real-time expert protocol analysis

EtherPeek NX 2.1 Quick Tour Contents
Program overview ................................................................ 1
1 Monitor statistics ................................................................. 2Real-time statistics monitor traffic patterns
2 Capturing packets from multiple adapters ........................... 4Sampling network traffic in detail
3 Setting filters in capture windows ........................................ 7Pinpointing traffic of interest
4 Viewing decoded packets ................................................... 9Network traffic, decoded in detail
5 Expert view and Expert EventFinder ................................. 11Expert analysis of peer-to-peer communications
6 Peer map ........................................................................... 13Visualizing traffic patterns
7 Performance views ............................................................ 14Streamline monitor and capture
8 Alarms ............................................................................... 15Monitoring for multiple possible problems simultaneously
9 Output from statistics ........................................................ 16Building a history of your network's performance
There's more! ..................................................................... 18
Demonstration version of EtherPeek NX ........................... 19
System Requirements........................................................ 19
Additional product information............................................ 19
Copyright © 2003, WildPackets, Inc. All rights reserved.
EtherPeek NX ™ Quick Tour
Welcome to EtherPeek NX™, WildPackets' real-time Expert Analysis tool that combines EtherPeek's advanced set of troubleshooting and monitoring features with Expert problem detection heuristics and diagnostic capabilities. The Quick Tour is intended to help you become familiar with some key program features, including the Expert and Peer Map views.
EtherPeek NX works by capturing traffic from one or more adapters, providing the tools to filter, analyze and interpret traffic patterns, data packet contents, statistics, and protocol types. EtherPeek NX is an excellent diagnostic tool for determining the source of network problems as they occur. EtherPeek NX is the first analyzer to allow multiple simultaneous capture sessions, each using a different adapter. This ability is limited only by the number of adapters available and the processing power of the local host.
EtherPeek NX provides a wealth of features to explore. This Quick Tour begins with a brief overview of central program functions, then introduces a selection of key capabilities, walking you through each feature with step-by-step examples.
Program overviewEtherPeek NX is built around two distinct ways of looking at the network: Monitor statistics and packet capture. The next sections introduce these two approaches. Monitor statistics, Capture windows and Packet File windows provide EtherPeek NX with the foundations for fast, intuitive, and comprehensive network analysis in Ethernet environments.
Monitor statistics
The Monitor statistics function never saves packets, it only collects data. That data is always based on all the traffic found on the adapter selected in the Adapter view of the Monitor Options dialog. There can only be one instance of Monitor statistics at one time. From the Monitor menu, Monitor statistics provides the following views of network traffic:
■ Node Statistics
■ Protocol Statistics
■ Network Statistics
■ Size Statistics
■ Summary Statistics
■ History Statistics
Capture windows and Packet File windows
Packet capture is done in Capture windows. Packet File windowS. are used to open saved packet files. You can save packets into a new packet file from either a Capture window or a Packet File window. You can have multiple Capture windows and/or Packet File windows open at the same time, up to the limits of your system resources.
A Packet File window has all the statistical and analytical features of a Capture window, but none of the features required for packet capture. With that exception, everything said here about Capture windows applies equally to Packet File windows.
1

EtherPeek Quick Tour
2
All the capture-related properties of a Capture window are defined in the Capture Options dialog. Each Capture window must be assigned an adapter from which to capture (in the Adapter view), and a memory allocation called a capture buffer (in the General view). You can assign each Capture window a different adapter, choose the same adapter for multiple Capture windows, or any combination of shared and unique, so long as each Capture window has one valid adapter.
A Capture window or Packet File window provides the same types of statistics found in Monitor statistics (in the Nodes, Protocols, and Summary views), or provides near equivalents in the Graphs view. There is one crucial difference, however, between the statistics in these windows and the ones in Monitor statistics. The statistics in these windows are based only on the packets seen in the buffer of the particular Capture window or Packet File window. In a Packet File window (or in a Capture window, when capture is stopped), you can, for example, select a group of packets in the Packets view and choose Hide Selected Packets from the Edit menu to temporarily alter the apparent contents of the capture buffer. This forces a recalculation of statistics based on the remaining packets.
All the functions related to packet decodes—viewing, saving, and searching by the decoded contents of packets—are unique to Capture windows and Packet File windows.
Feature # 1: MONITOR STATISTICSReal-time statistics monitor traffic patterns
Monitor statistics provide insight into the overall flow of network traffic. They are like the view from a traffic helicopter and can indicate bottlenecks and anomalies. Use these windows to identify trends and current conditions that may signal unexpected network problems.
The Monitor statistics functions keep only the aggregate information needed to provide an updated tally of all the tracked parameters. Data collection for Monitor statistics is independent of any Capture windows, and cannot be altered by filters, triggers, or any other function.

Selecting an adapter for monitor statistics
The first time you start EtherPeek NX, you will be asked to select an adapter to be used to collect Monitor statistics. By default, Monitor statistics begin calculation based on the traffic that is passed to EtherPeek NX from the adapter selected in the Adapter view of the Monitor Options dialog and continue to accumulate while EtherPeek NX is running.
To begin collecting Monitor statistics:
1. Launch the program by choosing WildPackets EtherPeek NX from the Start menu.
2. Choose any supported Ethernet adapter from the list displayed in the Adapter view of the Monitor Options dialog.
3. EtherPeek NX will use this adapter, placing it in a “promiscuous” mode in which the adapter captures all traffic seen by the selected adapter, regardless of its destination address.
Note: As an alternative, you can choose a File as your adapter. If you choose New File Adapter, you can open any EtherPeek (*.pkt) packet file, such as those in the Samples directory in the main program directory. EtherPeek NX will cycle through the packets in the chosen file, allowing you to simulate most aspects of “live” functionality.
4. Under the Monitor menu, make sure the Monitor Statistics item has a check mark beside it, showing that it is enabled. If it does not, click the item to enable it.
5. EtherPeek NX will begin calculating Monitor statistics based on all the traffic seen on the selected adapter and will continue to collect Monitor statistics from the selected adapter until you quit the program or reset statistics.
Monitoring with Summary Statistics
The Summary Statistics feature allows you to monitor key network statistics in real time and save these statistics for later comparison. Use this feature to baseline “normal” network activity, save the data, then compare saved statistics with those observed during periods of erratic network behavior to help pinpoint the cause of the problem.
3
EtherPeek Quick Tour
4
Summary statistics are also extremely valuable in comparing the performance of two different network segments. For example, a field support engineer could compare the real-time statistics on a client's network with a saved “healthy” router snapshot and easily diagnose or eliminate the source of inconsistent or poor router performance.
To view Summary Statistics:
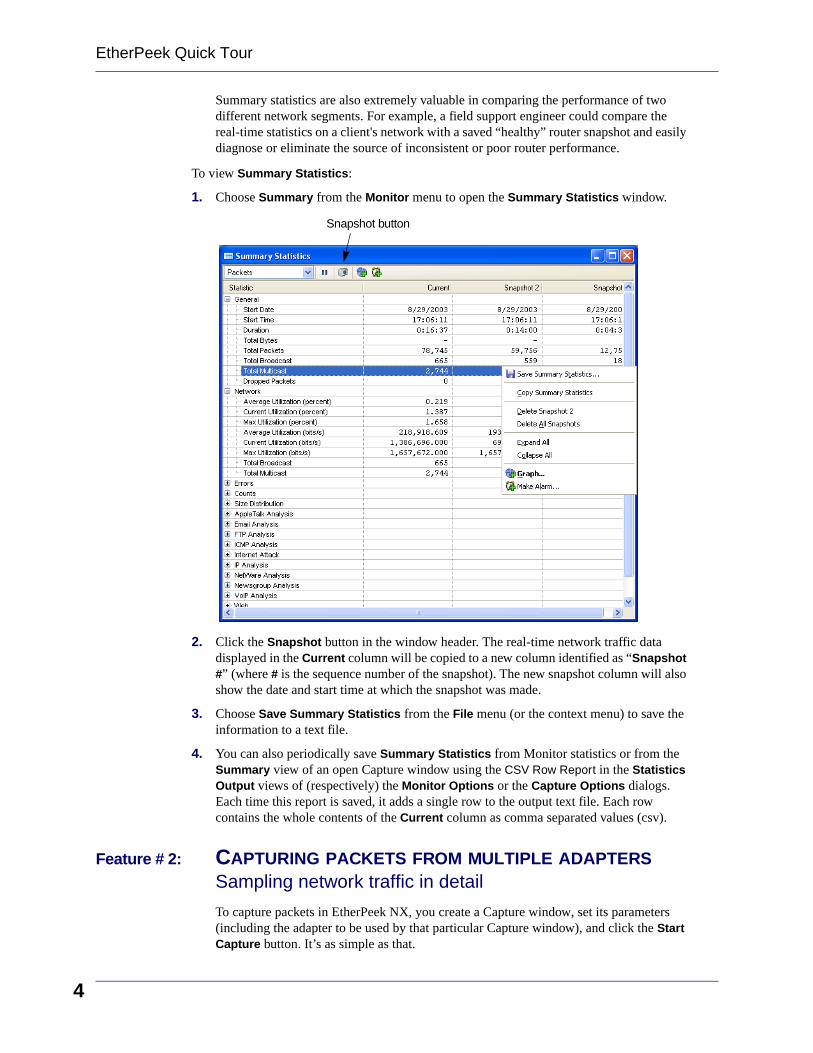
1. Choose Summary from the Monitor menu to open the Summary Statistics window.
2. Click the Snapshot button in the window header. The real-time network traffic data displayed in the Current column will be copied to a new column identified as “Snapshot #” (where # is the sequence number of the snapshot). The new snapshot column will also show the date and start time at which the snapshot was made.
3. Choose Save Summary Statistics from the File menu (or the context menu) to save the information to a text file.
4. You can also periodically save Summary Statistics from Monitor statistics or from the Summary view of an open Capture window using the CSV Row Report in the Statistics Output views of (respectively) the Monitor Options or the Capture Options dialogs. Each time this report is saved, it adds a single row to the output text file. Each row contains the whole contents of the Current column as comma separated values (csv).
Feature # 2: CAPTURING PACKETS FROM MULTIPLE ADAPTERSSampling network traffic in detail
To capture packets in EtherPeek NX, you create a Capture window, set its parameters (including the adapter to be used by that particular Capture window), and click the Start Capture button. It’s as simple as that.
Snapshot button

Start capture
To create a new Capture window:
1. Choose New… from the File menu to open the Capture Options dialog.
2. In the General view of the Capture Options dialog, set the Capture title (name) of the new Capture window.
3. Set the size of its capture buffer or accept the default in Buffer size: … kilobytes.
4. Use the Continuous capture section to determine how the buffer will be used during capture. When Continuous capture is unchecked, capture stops when the buffer becomes full. When Continuous capture is checked, use the radio buttons to Discard all packets when wrapping the buffer or Discard oldest packets first (use ring buffer).
5. Choose any supported Ethernet adapter from the list displayed in the Adapter view of the Capture Options dialog.
6. You can set any other options in the Triggers, Filters, Statistics Output, and/or Performance views, either when you first create the Capture window, or later, by returning to the Capture Options dialog for that window. Make the Capture window the active (frontmost) window and choose Capture Options… from the Capture menu to open the Capture Options dialog for an open Capture window.
7. When you have set the capture options, click OK to open the new Capture window.
8. Click Start Capture. You will see packets from your selected adapter processed and displayed in the new Capture window.
Packets view
In separate views, a Capture window provides many ways of looking at the traffic captured into that window. These views are accessible by clicking the view tabs across the bottom of the Capture window. For an overview, see “Capture windows and Packet File windows” on page 1.
packet slicing options
capture buffer size
Continuous
Capture window title
Buffer wrap
Save to diskoptions
options
“Show this dialog...”
options capture
5

EtherPeek Quick Tour
6
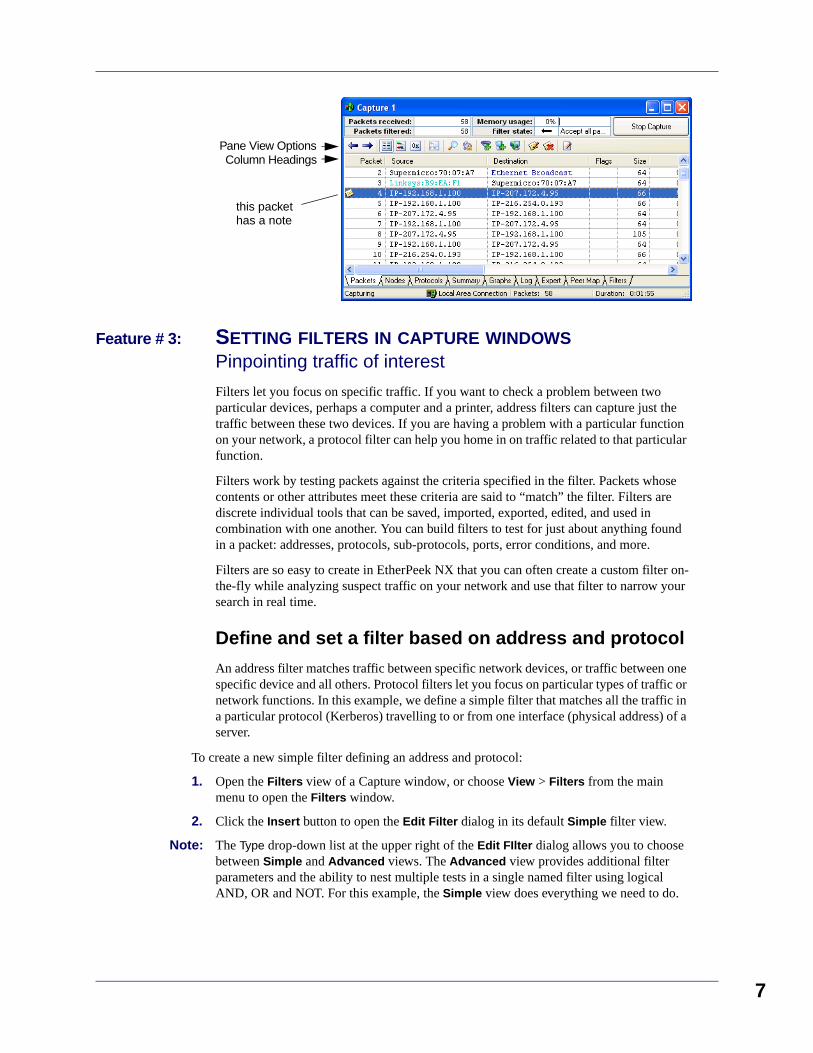
The Packets view is the heart of a Capture window. The view has three optional panes: Packet List (a table showing all packets, each on a single line), Decode (showing a decode of the packet selected in the Packet List) and Hex (raw hex and ASCII contents of the selected packet). You can display any or all of these panes simultaneously by using the buttons in the Capture window toolbar.
The statistics and information displayed in other views is based on the packets in the Packets view. Similarly, Select operations performed in other views actually take effect in the Packets view. The Select features, in combination with the Hide Selected Packets, Hide Unselected Packets, and Unhide All Packets commands from the Edit menu, are powerful tools for sophisticated analysis.
The default Packet List shows data for each packet in the following columns: Packet (showing the sequential number assigned at capture, plus a Note icon if you have made a note on the packet), Source address, Destination address, a Flags column (showing packets flagged as errors, trigger packets, and so forth), packet Size (length in bytes), packet Protocol, the Relative Time of packet capture (relative to EtherPeek NX program start), a Summary column showing additional information provided about the packet by any enabled Analysis Modules, and an Expert column, logging information provided by the Expert Analysis features.
Many other columns are also available. To add to or change the mix of columns, click in the column headings to open the Packet List Options dialog. To change column order, use drag and drop.
Start Capture button
Progress section
View Tabs
Window Title
View section
Status bar
Capture status Current Adapter Packets Duration
Decode Previous
Decode Next
Show Packet List
Show Decode ViewShow Hex View
Zoom Pane
Make Filter
Insert Into Name Table
Resolve Names
Edit Note
Delete Note
Properties
Toggle Orientation
Feature # 3: SETTING FILTERS IN CAPTURE WINDOWSPinpointing traffic of interest
Filters let you focus on specific traffic. If you want to check a problem between two particular devices, perhaps a computer and a printer, address filters can capture just the traffic between these two devices. If you are having a problem with a particular function on your network, a protocol filter can help you home in on traffic related to that particular function.
Filters work by testing packets against the criteria specified in the filter. Packets whose contents or other attributes meet these criteria are said to “match” the filter. Filters are discrete individual tools that can be saved, imported, exported, edited, and used in combination with one another. You can build filters to test for just about anything found in a packet: addresses, protocols, sub-protocols, ports, error conditions, and more.
Filters are so easy to create in EtherPeek NX that you can often create a custom filter on-the-fly while analyzing suspect traffic on your network and use that filter to narrow your search in real time.
Define and set a filter based on address and protocol
An address filter matches traffic between specific network devices, or traffic between one specific device and all others. Protocol filters let you focus on particular types of traffic or network functions. In this example, we define a simple filter that matches all the traffic in a particular protocol (Kerberos) travelling to or from one interface (physical address) of a server.
To create a new simple filter defining an address and protocol:
1. Open the Filters view of a Capture window, or choose View > Filters from the main menu to open the Filters window.
2. Click the Insert button to open the Edit Filter dialog in its default Simple filter view.
Note: The Type drop-down list at the upper right of the Edit FIlter dialog allows you to choose between Simple and Advanced views. The Advanced view provides additional filter parameters and the ability to nest multiple tests in a single named filter using logical AND, OR and NOT. For this example, the Simple view does everything we need to do.
Pane View OptionsColumn Headings
this packet has a note
7

EtherPeek Quick Tour
8
3. Enter a name in the Filter field. This will appear in all filter lists.
4. Click in the Color control to choose a color for the filter, or accept the default (black).
5. Optionally, enter a comment in the Comment field. You can sort filter lists by the Filter or the Comment column.
6. Check Address filter to enable the address section of the filter.
7. Choose Physical from the address Type drop-down list to define the type of addresses to be entered. (Your other choices are: IP, IPv6, AppleTalk, DECnet, or IPX.)
8. In Address 1, enter the physical address (MAC address) of the server NIC. Physical addresses are entered in pairs of hexadecimal characters (0-9, a-f) separated by colon characters. If this address is already entered in the Name Table, you can click the button to the right of the field and choose the entry from there.
9. Under Address 2, click the radio button labelled Any address.
10. Click the button in the center of the Address filter section and choose Both directions from the drop-down list.
11. Check Protocol filter to enable the definition of that aspect of the filter.
12. Click the Protocol… button to open the Protocol Filter dialog.
13. Choose ProtoSpecs from the drop-down list at the top to choose that method of defining your protocol.
14. Navigate the nested hierarchy of protocols to select Kerberos (Ethernet Type 2 > IP > TCP > Kerberos), then click OK to accept your selection and close the Protocol Filter dialog, returning to the Edit Filter dialog.
Note: Most IP stacks are implemented as Ethernet Type 2. If your network uses versions of IP implemented under 802.3 instead, choose IEEE 802.3 > SNAP > IP > TCP > Kerberos.
15. Click OK to accept your changes and close the Edit Filter dialog. The new filter will appear in all filter lists.
16. To activate the new filter in your Capture window, open its Filters view, and check the checkbox beside the new filter’s name. To capture only traffic matching the filter -- in this case, Kerberos traffic moving to or from the physical address or your server, click the

Accept Matching button in the Filters view. The filter takes effect immediately, even if capture is already under way.
To match all the traffic on any of the interfaces of a multi-homed server, you could create a separate simple filter matching each interface. When capturing from a segment that could have traffic to or from any of these interfaces, enable these filters and click Accept Matching. A packet matching any of the enabled filters is considered a match, and accepted into the capture buffer.
Make Filter
An easy way to create a new filter is to use the Make Filter command, available as the Make Filter button in many windows, or from the context menu (right-click) where applicable. The Make Filter command creates a filter based on the selected packet or statistics item. Make Filter can also be used in the Name Table to create a filter based on the selected named node, protocol, or port. It can also be used in the Packet Decode window (or the decode panes of the Packets view of a Capture window or Packet File window) to create a filter based on the selected data item.
When you use the Make Filter command, an unnamed filter is created matching the parameters of the selected packet, node, protocol, conversation, or packet decode item. An Edit Filter dialog will open with the parameters for your selection already loaded. Use this dialog to make any additional changes, and save the filter under a new name.
If multiple items are selected, the Make Filter command will attempt to create a filter for each one.
Feature # 4: VIEWING DECODED PACKETSNetwork traffic, decoded in detail
Some network problems are revealed more quickly by looking at the detailed information contained in individual packets. Protocol decoders and the Packet Decode window allow you to open packets and look inside, pinpoint sources of problems, track down faulty hardware, and learn about and examine protocol structure and compliance.
Accept MatchingReject Matching Disable All
9

EtherPeek Quick Tour
10
Packet decode window
A Packet Decode window (or the decode pane of the Packets view) presents the detailed structure and contents of a single packet. EtherPeek NX can decode thousands of protocols and sub-protocols, and can display the individual elements of Ethernet packets, along with their meanings, expressed in plain English. This example demonstrates some of the features of packet decodes.
To view the decode of a packet:
1. Open the Decode and Hex panes of the Packets view of a Capture window or Packet File window. Alternatively, you can double-click on any packet in the Packets view to open it in a separate Packet Decode window.
2. Notice the items in green at the top of the Decode view. This section includes information on the Flags, Status, Packet Length, and Timestamp of the packet. If packet slicing was in effect when this packet was captured, the Slice Length will also be shown here.
3. Notice the body of the Decode view. The information is laid out in the same order as it appears in the packet itself. Each protocol is nested or framed within the higher level protocols. Each line shows the ASCII representation of the packet data for a particular field within the packet and the interpretation of that data, based on the protocol. A quick glance at this section often reveals the source of trouble. Problems like a misconfigured client, or incompatible versions of the same protocol from different vendors can be easily understood when you can see and compare the packets themselves.
4. Notice the Hex view at the bottom of the packet decode window. This view shows the raw hex contents of the packet on the left, with the offset of the first character in each line ()optionally) shown at the far left. In alignment with this, line for line, the ASCII version of the raw packet data is shown on the right.
Figure 4.1 Parts of a Packet Decode window
5. When you highlight an item in one part of the window, the same bytes of the packet are highlighted in all the other views or panes as well. The highlight matches in the Decode, Hex, and ASCII panes.
6. Click the Decode Previous or Decode Next buttons at the top of the window to step through the packets shown in the Packet List of the active Capture window or Packet File window.
Information addedby EtherPeek NX
Hexadecimal
Hex
Decodeview
view
Offsets ASCII
Window navigationDecoder options
Windowheader

Feature # 5: EXPERT VIEW AND EXPERT EVENTFINDER Expert analysis of peer-to-peer communications
The Expert view provides expert analysis of delay, throughput and a wide variety of network events and potential problems in a conversation-centered view of traffic in a Capture window or Packet File window.
The Expert EventFinder not only helps identify key events, but it also helps you understand the meaning, the typical causes, and the typical solutions to the problems it uncovers. Detailed information is only a click away.
Using the Expert view
To see the Expert view in action:
1. Open a new Capture window and capture a sample of packets.
2. Click the Expert tab to open the Expert view.
3. Watch the Events column for a conversation with some number of events. Alternatively, you can watch the LED lights at the far left of the Conversations pane. The colors of the LEDs indicate the presence and severity of events within a particular conversation.
4. Stop capture when you have a sample containing identified events.
5. Scroll in the Conversations pane (the upper pane) of the Expert view and select a conversation or flow with one or more events.
6. Expand the view of that flow by clicking on the + (plus) sign at the left margin.
7. Expand the descriptions of the individual events encountered, by clicking on the + (plus) sign at the left margin.
8. Select an individual event.
9. Right-click on the event and choose EventFinder Setting from the context menu to open the Expert EventFinder Settings dialog with this particular class of event highlighted.
10. Notice that the Expert EventFinder Settings dialog tells you not only what sensitivity or setting value was used to flag this event as significant, but it also provides a more complete Description of the event and identifies Possible Causes and Possible Remedies.
11. Close the Expert EventFinder Settings dialog, but do not close the Expert view.
11

EtherPeek Quick Tour
12
The Expert view makes it easy to get to the source of trouble. When the Expert view identifies an event as significant, you have a variety of ways to get to the packets involved. You can select all the packets in a conversation or an individual packet or group of packets with a particular event. Where a diagnosis is based on a change or an unexpected response, you can select the pair of packets that allowed the diagnosis.
To review all the packets in a conversation diagnosed with one or more events:
1. In the Conversations pane (the upper pane) of the Expert view, select a conversation with one or more events.
2. Click the Express Select button in the Expert view header section.
3. In the Selection Results dialog which appears, choose Hide Unselected, and click OK.
4. In the resulting Packets view, scroll to the Expert column. Notice that individual packets have entries here, provided by the Expert Analysis function.
5. You can scroll through the Expert column entries to choose a packet to open (by double-clicking on its entry in the Packets view), or
To see the pair(s) of packets associated with a problem diagnosis:
1. In the supplemental information panes area at the bottom of the Expert view, click the Event Log tab to open the Event Log.
2. Click in the header of the Event column to sort by that column. You can sort the Event Log by any of its columns. The Event column of the Event Log shows the same information as is provided in the Expert column of the Packets view.
3. Each log entry is a single packet. Select one or more log entries containing a reference to a second packet, such as (see packet 503). Events related to transmission retries, response times, rate changes, and so forth may reference a second packet.
4. Right-click on the entry or entries and choose Select Related Packets > Selected Entries + “See” or “From Pkt” from the context menu.
5. From the Selection Results dialog which appears, you have a number of options for displaying decodes of the packets selected.
Expert EventFinder
The Expert EventFinder scans traffic in a Capture window or Packet File window, looking for key events. The EventFinder’s 91 separate events cover anomalies, sub-optimal performance and other significant events at all layers of the network from application to physical. The Expert monitors Client/Server delay and throughput as well.
You can enable and disable each test individually. In addition, many of the events have user-defined settings and thresholds, allowing you to fine-tune the Expert system to precisely fit your needs. You can save and reload Expert EventFinder settings for use in particular environments.
In addition, the Expert EventFinder Settings window shows the Description, Possible Causes, and Possible Remedies for each event it can diagnose.

Feature # 6: PEER MAPVisualizing traffic patterns
The Peer Map view is a powerful tool for visualizing network traffic in a Packet File window or Capture window. The Peer Map uses line weight and line color to show the volume and protocol of traffic between nodes. The nodes themselves can be color-coded for protocol and size-coded for traffic volume and can show icons for node type, based on Name Table entries.
The Peer Map displays only the packets visible in the Packets view. Hiding and unhiding packets in the Packets view can be used to alter the Peer Map. In addition, the Peer Map view contains its own tools to control the display of nodes and types of network traffic. This lets you quickly create a picture of all the traffic in a particular protocol, for example, or all the nodes sending or receiving multicast traffic.
The Peer Map displays the nodes around an elongated ellipse. Communications are shown by a line connecting each two peers. The color of the line denotes the protocol, its thickness the volume of traffic. When you drag nodes to new positions, the lines rubber-band.
Enable All
Disable All
Restore Default
Restore All Defaults
Invert Selections
Load Expert Settings
Save Expert SettingsLock-in “MyExpertProfile.exp” for New Captures
13

EtherPeek Quick Tour
14
To use the Peer Map:
1. Open a Capture window and begin capturing traffic.
2. Click the Peer Map tab to open the Peer Map view.
3. In the Display Options section at the right of the Peer Map view, choose IP Map from the Map Type drop-down list.
4. Notice that only nodes using the IP protocol are displayed.
5. Change the Traffic Type setting, using the drop-down list, from the default All to Unicast or Multicast. Notice how the Peer Map changes to display only the nodes sending or receiving these types of traffic.
6. Restore the Traffic Type setting to All.
7. Go to the Protocols section and deselect some of the protocols shown there. Notice that the lines indicating traffic between nodes in the Peer Map disappear as their protocol is disabled (unchecked) in the Protocols settings pane.
Feature # 7: PERFORMANCE VIEWSStreamline monitor and capture
It’s important to balance the need to perform real-time monitoring with post capture analysis. The Performance view of the Monitor Options or Capture Options dialog allows you to specify the processing required for the task at hand by selectively enabling or disabling individual program functions. At the bottom of the Performance view is a spectral band labeled Faster at the left and Slower at the right. As you enable and disable program functions, an indicator moves along this band to give you a rough estimate of the relative impact of various combinations of features on the performance of Monitor statistics or the particular Capture window.
To change the performance settings:
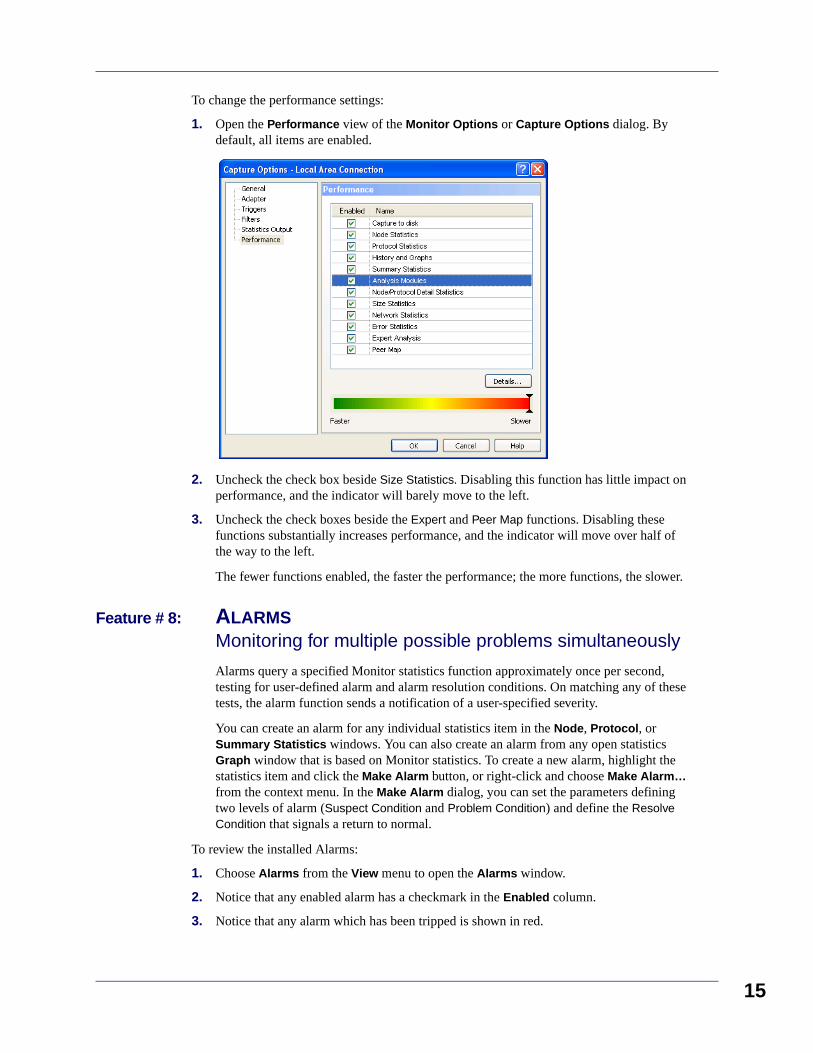
1. Open the Performance view of the Monitor Options or Capture Options dialog. By default, all items are enabled.
2. Uncheck the check box beside Size Statistics. Disabling this function has little impact on performance, and the indicator will barely move to the left.
3. Uncheck the check boxes beside the Expert and Peer Map functions. Disabling these functions substantially increases performance, and the indicator will move over half of the way to the left.
The fewer functions enabled, the faster the performance; the more functions, the slower.
Feature # 8: ALARMSMonitoring for multiple possible problems simultaneously
Alarms query a specified Monitor statistics function approximately once per second, testing for user-defined alarm and alarm resolution conditions. On matching any of these tests, the alarm function sends a notification of a user-specified severity.
You can create an alarm for any individual statistics item in the Node, Protocol, or Summary Statistics windows. You can also create an alarm from any open statistics Graph window that is based on Monitor statistics. To create a new alarm, highlight the statistics item and click the Make Alarm button, or right-click and choose Make Alarm… from the context menu. In the Make Alarm dialog, you can set the parameters defining two levels of alarm (Suspect Condition and Problem Condition) and define the Resolve Condition that signals a return to normal.
To review the installed Alarms:
1. Choose Alarms from the View menu to open the Alarms window.
2. Notice that any enabled alarm has a checkmark in the Enabled column.
3. Notice that any alarm which has been tripped is shown in red.
15

EtherPeek Quick Tour
16
4. To edit any alarm, highlight it and click the Edit button at the left of the Alarms window to open the Edit Alarm dialog for that alarm.
Predefined alarms
EtherPeek NX includes two sets of ready-made alarms for your convenience, located in the Alarms directory where you installed EtherPeek NX. The set of alarms loaded on installation is stored in a file called Default Alarms.alm. A second, larger set of alarms is included in a file called Additional Alarms.alm. The default set of alarms covers the most frequently encountered network problem conditions. The additional alarms generally include normal network conditions which you may want to monitor for particular purposes. You can load these or any other saved set of alarms using the Import button in the Alarms window.
Feature # 9: OUTPUT FROM STATISTICSBuilding a history of your network's performance
You can periodically save statistics from open Capture windows or open Monitor statistics windows to any of a variety of Statistics Report formats. Each report format includes a particular selection of statistics, and saves data in XML HTML *.csv (comma separated values text in ASCII encoding), or *.txt (tab-delimited text in UTF-8 encoding) file formats. Alternatively you can choose the CSV Row Report to append each new output from Summary Statistics to the same set of *.csv files.
EditDuplicate
Delete
Graph
Notifications sent
Triggered conditions
Disabled alarmsgrayed out
shown in red
ImportExport Enable All
Disable All

To periodically output current statistics:
1. Open the Statistics Output view of the dialog appropriate to the source of the statistics you wish to output; Monitor Options (for Monitor statistics) or Capture Options (for a particular Capture window). The Statistics Output views are identical, and only the source of statistics is different.
2. Check the checkbox in the upper left to enable saving statistics. Use the combo boxes at right to set the frequency with which you want to update the statistics files. With the exceptions noted below, each new report is written over the previous report, replacing it.
3. Choose the type of statistics to be output and the file format to be used from the Report type drop-down list. A description of the selected report type is shown in the lower part of the Statistics Output view.
4. In Report folder, enter the location to which these periodic reports should be saved, You can click the … ellipsis button to navigate to the location.
5. Check Reset statistics after output to return statistics counts to zero after each report is written. This allows you to create a series of reports, always starting at zero.
6. Check Align save to time interval to synchronize the output of reports to the nearest whole unit of time. For example, if your interval is set to some number of Hours, output will occur on the hour when this option is checked.
7. Check Create new file set to create a series of statistics output reports, rather than a single report which is overwritten (or, in the case of the CSV Row Report only, appended to). When this item is checked, reports are written to new file folders, created at an interval you specify in the New File Set Schedule dialog, available by clicking the Set Schedule button.
8. Check Log output to send a notice sent to the log file when a statistics report is updated.
9. Click OK to enable your choices.
17

EtherPeek Quick Tour
18
There's more!There are many more features to explore with EtherPeek NX, but not enough space here to document them all. We suggest you look at these additional features:
Name Table and name resolver options
The Name Table lets you assign your own symbolic names to addresses, ports and protocols. It is easy to create and update Name Table entries in EtherPeek NX. You can also save and restore (export and import) the contents of the Name Table. This allows you to keep separate Name Tables for different network segments or office locations.
Providing names in place of logical or physical addresses makes the task of identifying packets of interest much simpler.
EtherPeek NX can scan all traffic, searching for logical and symbolic names in the contents of passing packets. You can control how and whether EtherPeek NX adds these passively discovered names to the Name Table, and tell it how to automatically age these entries, deleting those that remain unused after a certain time.
Analysis Modules
Analysis Modules are external modules that provide expert analysis features to the program. An Analysis Module tests network traffic and provides detailed summaries and counts of key parameters of one specific type of traffic, posting its results in the Summary Statistics window and/or in the Summary column of the Packets view of Capture windows and Packet File windows.
The Analysis Modules shipped with EtherPeek NX cover a wide range of the most common protocols and network applications. You can enable and disable Analysis Modules individually. In addition, many Analysis Modules have user-configurable options, which can be used to further refine the data you collect about your network.
Triggers
Automate the start and stop of capture using triggers. Any filter can be specified as a trigger criterion. You can also set a trigger to start or stop packet capture based on time and date settings, so you can focus captures with pinpoint accuracy. Look for trigger options in the Triggers view of the Capture Options dialog.
ProtoSpecs™ and protocol definitions
WildPackets' ProtoSpecs technology offers a very fine level of protocol layer detail by identifying the top-level “parent” protocol and breaking-out each subprotocol layer in a hierarchical view. Look for ProtoSpecs in EtherPeek NX's Capture windows, Filters and Protocol Statistics windows. Display protocol information based on a total of the subprotocols under the parent protocol, or by each subprotocol broken-out by individual layers.
EtherPeek NX provides a definition of what a protocol abbreviation stands for and a concise description of how a protocol is used. This on-line help mechanism will assist you in determining the purpose of previously unseen packets on the network as well as help to increase your knowledge of LAN/WAN protocols. To view the definition for any particular protocol or subprotocol from any packet list view or Protocol Statistics window, click on your selection and then choose the Protocol Info command from the context menu.

Selecting, hiding and unhiding packets
The statistical, Expert, and Peer Map views of Capture windows and Packet File windows are recalculated and redrawn each time there is a change in the visible packets in the Packets view. By selecting, hiding and unhiding packets, a user can perform sophisticated analysis on captured traffic quickly and easily.
The Select… command from the Edit menu brings up the Select dialog that allows you to apply existing filters to captured packets, to select based on string content or packet length, or to select based on Analysis Modules. You can select either all packets matching your criteria or all those not matching.
Demonstration version of EtherPeek NXThe demonstration version of EtherPeek NX differs from the full-featured version in the following ways:
● Each Capture window is limited to 30 seconds of capture and no more than 250 packets.
● Only 5 Capture windows can be opened per launch.
● Only the first 250 packets of a saved file will be loaded into Packet File windows.
● Monitor statistics are captured for only 5 minutes.
● Printing and Saving are disabled.
● Does not open packet files created by other products.
● Send is limited to 100 packets.
System RequirementsThe recommended configurations for systems running EtherPeek NX are:
● 1.7 GHz processor (600 MHz minimum)
● 512 MB RAM or higher (256 MB minimum)
● Windows XP or Windows 2000
● Microsoft Internet Explorer 5.5 or later required
Please see the Readme file for additional information about any special requirements for particular operating systems. Please see the installation instructions shipped with your hardware and software for additional information regarding network drivers, program file locations and uninstall instructions.
Additional product informationPlease check our web site at www.wildpackets.com for product demos, literature, technical references, FAQs, system requirements and more.
AiroPeek NX™ - Expert 802.11 Wireless LAN network analyzer
AiroPeek™ - 802.11 Wireless LAN protocol analyzer
EtherPeek NX™ - Expert 10/100/1000 Ethernet network analyzer
EtherPeek™ - 10/100/1000 Ethernet protocol analyzer
EtherPeek™ for Macintosh - Ethernet packet analyzer
19

EtherPeek Quick Tour
20
GigaPeek NX™ - Expert Gigabit Ethernet network analyzer
iNetTools™ - Menu-driven testing tools for Internet and IP-based networks
NetDoppler™ - Performance and application analysis tool
NetSense™ - Post-capture expert network analyzer
PacketGrabber™ - Remote packet capture application
PacketScrubber™ - Selective trace file data removal tool
ProConvert™ - Packet trace conversion tool
RFGrabber™ - Distributed WLAN analysis probe for AiroPeek NX
RMONGrabber™ - RMON capture module for EtherPeek NX
EtherPeek NX Product Maintenance
EtherPeek NX is available with two levels of maintenance. Standard Maintenance is available for twelve or twenty-four months and can be purchased with your product on our Web site. Premium Maintenance is available for twelve months and can be purchased by contacting [email protected].
WildPackets Academy
WildPackets Academy offers a structured educational curriculum centered on practical applications of protocol analysis techniques. Introductory courses in the basic concepts of protocol analysis provide the foundation for a full range of advanced offerings in specialized topics. See www.wildpackets.com/services for a full course catalog, current public course scheduling, web-delivered courses, and on-site course delivery information.
Network Analysis Courses
WP-100 Foundations of Network Protocol Analysis
WP-101 Network Troubleshooting Methods
WP-102 Emerging Ethernet Technologies: VoIP, Full Duplex, Gigabit, and Switching
WP-103 TCP/IP Protocol Analysis Methods
WP-104 Advanced TCP/IP Protocol Analysis
WP-105 AppleTalk, AppleShare IP, and Mac OS/X Network Analysis
WP-106 Wireless LAN Administration

WildPackets, Inc. 1340 Treat Blvd.,Suite 500
Walnut Creek, CA 94597925-937-3200
www.wildpackets.com
About WildPackets, Inc.
Since 1990, WildPackets has built affordable and easy to use network analysis tools. Our customers rely on WildPackets tools to help them design, maintain, troubleshoot, and optimize their networks. For information about our company, its products and partners, please see our website at www.wildpackets.com. See the WildPackets Academy site, www.wildpackets.com/services, for information on courses and Professional Services offerings. WildPackets' Network Analysis Expert (NAX) Certification Program details can be found at www.nax2000.com.
20030829-E-EPNX2.1_QT