banca ifis' strategic guidelines 2017-2019
TRANSCRIPT

1
A bigger bank with bigger opportunities.Strategic guidelines for the next 3 years (2017-2019).
March 2017

2
1- Present: vision and mission
2- Past: 2016 results achieved
3- Future: the next 3 years
- growth- challenges- opportunities
AGENDA

3
1- TODAY
Vision and Mission

4
VISION
We are convinced that only a bank that is beneficial to the economy in which it operates, whilst, at the same time, knows how to obtain the right amount of profit from its actions, has the dignity to look forward and plan its future. What is fundamental in the way we operate are the three pillars on which we base our work and all our business lines: control of risk-adjusted profitability, of liquidity and of capitalabsorption.
Becoming the benchmark in providing financial support to micro, small and medium-sized Italian companies, also on an international level. Enable the highest possible number of debtors to return to being financially credible. Making the most of the Bank's capital and liquidity to allow businesses and households, even in difficulty, to optimize their financial resources. Providing value to the savings of individuals and companies thanks to transparent and reliable product offering.
MISSION
OUR VISION AND MISSION

5
Short term finance
Medium term finance
Long term finance
Restructuring finance
Tax receivables
NPL
SavingsF= Field, W=web,PH= phone
OUR PRESENCE
F W
F
F
F
F
F PH
W PH
Corporate Individuals
Target customers Commercial Channels

6
OUR ORGANIZATION
Banca IFIS Spa
Interbanca Spa
IFIS Factoring Srl
(Factoring – Art. 106 )
IFIS RentalServices Srl(Equipment Finance –
operating leasing)
IFIS Leasing Spa(Transportation leasing e
equipment finance – Art. 106 )
100%100% 100%
IFIS Finance Sp. Z. zoo
100%99,993%

7
2- PAST:
2016 Results achieved

8
HIGHLIGHTS
(Million Euro)
Loans
Equity
Funding
Net Profit
5.928,2
1.218,8
7.037,7
687,9
(3.437,1 at 31/12/2015) +72,5%
(573,5 at 31/12/2015) +112,5%
(6.150,5 at 31/12/2015) +14,4%
(162,0 at 31/12/2015) +324,7%
GROUP KPIs 12 months 2016
12 months 2015
Cost of credit SME’s 80 b.p. 89 b.p.
EPS 12,94 3,05
EPS Adjusted* 1,69 1,49
Book value/share 22,81 10,81
* 2016 adj for Interbanca acquisition; 2015 adj for gain on bond portfolio sale

9
(Million Euro)
** Contribution only for the month of December
53,5%
47,5%
4,3%0,9%
-0,4%-5,8%-10,0%
0,0%
10,0%
20,0%
30,0%
40,0%
50,0%
60,0%
TradeRec.
NPL Area Tax receiv. CorporateBanking
Leasing G&S
2016 Breakdown by segment
*Includes 1 month of IFIS Factoring
Data Trade
receivableCorporate banking
Leasing Area NPLTax
receivableG&S
2016 174,4* 3,0** -1,2** 154,7 14,0 -19,0
2015 158,7 na na 52,7 20,3 172,6
% Change 9,9% na na 193,7% -31,2% -111,0%
326,0 (404,3 in 12 months 2015)
+16,5% LFL Banca IFIS old perimeter
-19,4% change 12 months 2016/2015
NET BANKING INCOME (NBI)
(excluding gain from bond portfolio sale in 2015)

10
NBI Provisions Operatingcosts
PPA Taxes Minorities Net profit
326,0
26,6202,5
33,2
623,6
32,5687,9
N* Normalized
(Million Euro)
687,9 (162,0 at 2015)
+324,7% % change 2016/2015
Personnel 20162016Norm
2015
65,9 56,6 48,3
Otherexpenses
20162016Norm
2015
Expenses 126,3 106,3 78,8
Cost/income 51,9% 45,8%*
2016* 2015
Tax rate 33,4% 34,0%
NET PROFIT
0,1

11
(Million Euro)
(*) Net bad loans/Net Loans to customers (within Trade receivables) **Ratio without parent company La Scogliera minority
Net Profit/ for the period
Total Assets (Eu bn)
Net equity
CET 1 Ratio**
RWA (Eu bn)
Net Loans to customers (Eu bn)
AFS+HTM (Eu bn)
Tot. Funds and deposits (Eu bn)
NPL ratio *
NPL Coverage ratio*
2014 2015
96 162
2,8 3,4
8,3 7,0
5,1 3,2 438 573
7,7 6,2
14,0% 15,8%
1,3% 1,1%
2,8 3,3
86,4% 87,9%
2016
688
5,9
0
15,7%
7,0
8,7
1.219
7,0
1,0%
88,5%
2014 2015 2016
3 YRs OF CONSISTENT AND SOLID GROWTH

12
3- Future:
The next 3 years:- growth- challenges- opportunities

13
Objectives
Abundance of retail funding
Collateral for the Eurosystem
Focus on diversification of funding
Business model suitable to deliver consistent and sustainable growth
Activities with high risk adjusted returns
Like for like improvement in all banking sectors
Preservation of capital
Elevated level of solvency
Capital buffer for future growth opportunities
Solidity
Liquidity
Profitability
THE PILLARS OF THE 3 YRs STRATEGIC PLAN

14
Governance & Services
Trade receivable
Corporate Banking
Leasing
Financial Leasing
Call center
Internal Agents
Collection Companies
Legal factory
Legal small ticket
M/L Loans
Structured Finance
Workout & Recovery
Operative Leasing
Italy
International
Pharma
Pharmacy
BUSINESS UNITS AND SEGMENTS

15
(Million Euro)
* Contribution only for the month of December for Interbanca segments
data Tradereceiv.
Corporate banking
Leasing Area NPL Tax receiv. G&S Total
2016 174,4* 2,9* -1,2* 154,7 14,0 -19,0 326,0
2015 158,7 na na 52,7 20,3 172,7 404,3
% Change +9,9% 193,7% -31,2% -111,0% -19,4%
Data adjusted
Tradereceiv.
Corporate banking
Leasing Area NPL Tax receiv. G&S Total
2016 148,5 2,9 -1,2 148,3 13,3 +14,1 326,0
New adjusted segment data due tochange in Internal Funding Rates as reference for 2017-2019 business plan
NEW INTERNAL FUNDING RATES: NBI ADJUSTED

16
(Million Euro)
* Contribution only for the month of December
NBI Adj 2016 IFR+ 12 months performance
381,2
40,0%
0,0%
11,8%
38,9%
3,5%5,8%
Trade Rec. CorporateBank
Leasing NPL TaX Rec G&S
**11 months GE Capital + 1 month Banca IFIS
Data adjIFR+12 month
Tradereceiv.
Corporate banking
Leasing Area NPL Tax receiv. G&S Total
Consolidated numbers
174,4 2,9* -1,2* 154,7 14,0 -19,0 326,0
2016 adj IFR+12 months
152,6** 0** 44,9** 148,3 13,3 22,1 381,2
BREAKDOWN 2016 NBI ADJUSTED BY BUSINESS

17
NBI 381,2 in 2016 CAGR 16-19: 24%-26%
GROUP NBI
Expected growth within all segments
Reversal of PPA: significant impact in the coming yrs
Strong contribution to total profitability in NPL area
Interbanca Group in break-even from 2017
Profitability of core business more than double in the next 3 years

18
NBI 152,6 in 2016 CAGR 16-19: 9%-11%
Clients CAGR 2016-2019
Over 20%
Cost of credit
80-120 bp
TurnoverCAGR 2016-1019
8%-10%
NBI/LOANS restated for 2016 5,2%
NBI/Loans2016-1019
4,5%-5%
LoansCAGR 2016-1019
+10%/15%
TRADE RECEIVABLES: A RESILIENT SEGMENT
○ Increase the customer base
○ Grow the retention rate
○ Diversify the financial tools to support companies
○ Increase the sales people and credit managers in the field
○ Strong web & digitalized processes
○ Leverage from cross selling

19
New loansCAGR 16-19 +50%/60%
Cost of credit
on new loans10bp/20bp
NBI 0,0 in 2016. Positive impact from reversal of
PPA. Profitable from 2017. Expected 80-90 mioEuro in 2019.
CORPORATE BANKING: A ROBUST CLIENT LOYALTY SEGMENT
○ Focus on M/L term lending introducing new products and new markets
○ Focus on additional clients in structured finance and new segments
○ Active portfolio management to recover corporate deteriorated assets
○ Run off of the W&R portfolio
○ Leverage from cross selling
LoansCAGR 16-19+10%/15%
W&R = workout & recovery subsegment
60-70 mio EuroEstimated
reversal of PPA
20
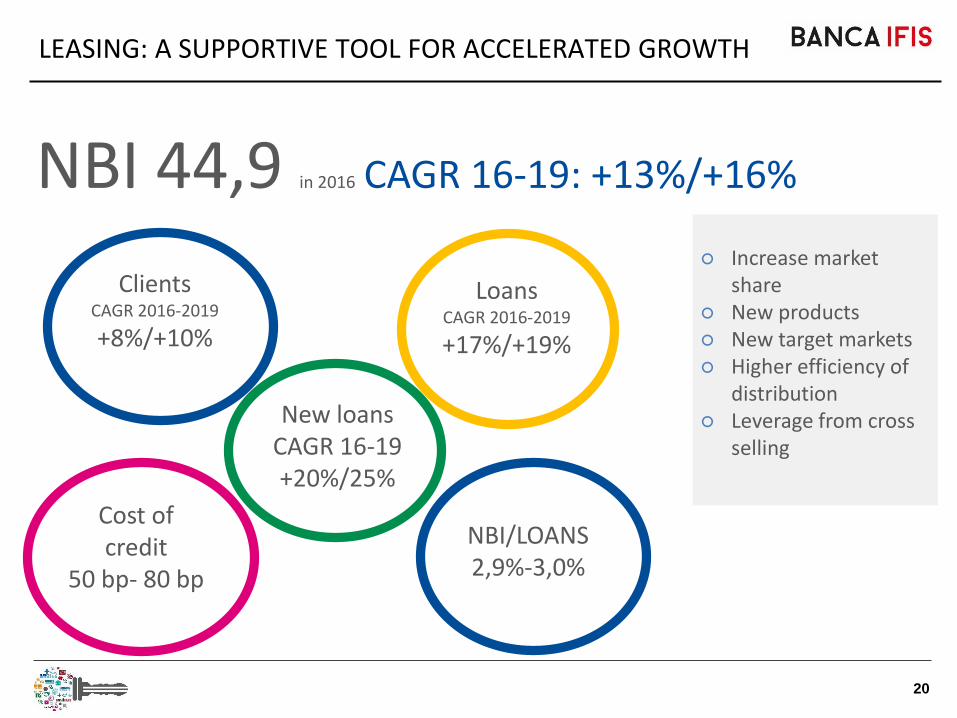
NBI 44,9 in 2016 CAGR 16-19: +13%/+16%
Cost of credit
50 bp- 80 bp
LEASING: A SUPPORTIVE TOOL FOR ACCELERATED GROWTH
NBI/LOANS2,9%-3,0%
○ Increase market share
○ New products○ New target markets○ Higher efficiency of
distribution○ Leverage from cross
selling
Clients CAGR 2016-2019
+8%/+10%
LoansCAGR 2016-2019
+17%/+19%
New loansCAGR 16-19 +20%/25%

21
New portfolio acquisition2017-2019 10-15 bn
Euro
Recovery rate
Over 20%
LoansCAGR 2016-2019
35%/40%
NBI 148,3 in 2016
CAGR 16-19: +25%/+30%
NPL: THE STRONGEST AND SOLID DRIVER OF PROFITABILITY
○ Strong contribution in gross collection arise from the Legal Factory department
○ The disposal of long tail consumer portfolios will strongly positively impact on profit
○ Economies of scale in acquiring and managing large numbers of credits
○ Leadership in unsecured retail
○ New focus on corporate and secured market

22
TAX RECEIVABLES: NICE TO HAVE SEGMENT
NBI 13,3 in 2016
CAGR 16-19: +5%/+10%
MDI/Loans
7%/ 10% bp
LoansCAGR 2016-2019
+25%/30%
(Million Euro)
○ Maintain leadership in the existingmarket
○ New segment areas
○ Maintain profitability

23
27,4%
11,7%8,6%
44,0%
2,1%
6,2%
Trade Rec. CorporateBanking
Leasing NPL Tax Rec G&S
(Million Euro)
EXPECTED BREAKDOWN 2019 NBI BY SEGMENT
2016
2019
40,0%
0,0%
11,8%
38,9%
3,5%5,8%
Trade Rec. CorporateBank
Leasing NPL TaX Rec G&S

24
BUSINESS MODEL SUITABLE TO INCREASE PROFITS
NET PROFIT adj 89 in 2016
CAGR 16-19: 40%-45%
Cost/Income below 50%
Reversal of PPA: significant impact in the coming yrs
Excellent credit quality*: Cost of risk around 100 bpNet NPL/Loans around 1%Coverage 85%/90%
* Total lending to SMEs, not including NPL segment
(Million Euro)

25
FOCUS ON DIVERSIED FUNDING
Retail deposit:
TLTRO:
Moderate growth of the total depositsDevelopment of the on-line bank with additional services and products
700 mln euro for the next 4 yrs. Expected interest rates - 40bp
Bonds: Ready to take advantage in the market
Rolling existing operationsSecuritization:
81% 72%
19% 28%
0%
20%
40%
60%
80%
100%
120%
2016 2019
Funding above and belowbail-in threshold

26* Not including the effects from the consolidation of the parent company La Scogliera Spa
Total capital ratio*in 2016 15,7%
Total capital ratio*in 2019 17%-18%
CAPITAL RATIOS: STRONGER THAN EVER
RWA growing according to the lending activity forecastedStrong decrease in fiscal assets
Organic increase in capital according to the profitability of the bank

27
OUR CHALLENGES FOR THE NEXT 3 YRs
ROE: over 15% in 2019
EPS: over 4,5 euro
Digitalized bank: substantial investments in technology
Customer experience: the new heart of the banking innovation
Book value per share: over 30 euro
Management team integrated with a unique company culture
Strong, solid and simplified processes to mantain our rate of growth

28
OUR OPPORTUNITIES FOR THE NEXT 3 YRs
Unexpected times
Excess capital in 2019according to the present business plan
5 bn euro of potential new assets*
* Not including the effects from the consolidation of the parent company La Scogliera

This Presentation may contain written and oral “forward-looking statements”, which includes all statements that do not relate solely
to historical or current facts and which are therefore inherently uncertain. All forward-looking statements rely on a number of
assumptions, expectations, projections and provisional data concerning future events and are subject to a number of uncertainties
and other factors, many of which are outside the control of Banca IFIS. (the “Company”). There are a variety of factors that may
cause actual results and performance to be materially different from the explicit or implicit contents of any forward-looking
statements and thus, such forward-looking statements are not a reliable indicator of future performance. The Company undertakes
no obligation to publicly update or revise any forward-looking statements, whether as a result of new information, future events or
otherwise, except as may be required by applicable law. The information and opinions contained in this Presentation are provided
as at the date hereof and are subject to change without notice. Neither this Presentation nor any part of it nor the fact of its
distribution may form the basis of, or be relied on or in connection with, any contract or investment decision.
The information, statements and opinions contained in this Presentation are for information purposes only and do not constitute a
public offer under any applicable legislation or an offer to sell or solicitation of an offer to purchase or subscribe for securities or
financial instruments or any advice or recommendation with respect to such securities or other financial instruments. None of the
securities referred to herein have been, or will be, registered under the U.S. Securities Act of 1933, as amended, or the securities
laws of any state or other jurisdiction of the United States or in Australia, Canada or Japan or any other jurisdiction where such an
offer or solicitation would be unlawful (the “Other Countries”), and there will be no public offer of any such securities in the United
States. This Presentation does not constitute or form a part of any offer or solicitation to purchase or subscribe for securities in the
United States or the Other Countries.
Pursuant the consolidated law on financial intermediation of 24 February 1998 (article 154-bis, paragraph 2) Mariacristina Taormina,
in her capacity as manager responsible for the preparation of the Company’s financial reports, declares that the accounting
information contained in this Presentation reflects the Banca IFIS’s documented results, financial accounts and accounting records.
Neither the Company nor any member of Banca IFIS nor any of its or their respective representatives, directors or employees accept
any liability whatsoever in connection with this Presentation or any of its contents or in relation to any loss arising from its use or
from any reliance placed upon it.
Mariacristina Taormina, in her capacity as manager responsible for the preparation of the Company’s financial reports, pursuant to
the consolidated law on financial intermediation of 24 February 1998 (article 154-bis, paragraph 2) and limited to the historical
accounting data presented in the document, declares that the accounting information reflects the documented results, financial
accounts and accounting records.