behavioral/cognitive … · 0.68, respectively, with the wais, third edition (wais-iii;...
TRANSCRIPT

Behavioral/Cognitive
Using IQ Discrepancy Scores To Examine the NeuralCorrelates of Specific Cognitive Abilities
Amy Margolis,1,2 Ravi Bansal,1,2 Xuejun Hao,1,2 Molly Algermissen,1 Cole Erickson,1,2 Kristin W. Klahr,1,2
Jack A. Naglieri,3 and Bradley S. Peterson1,2
1Center for Developmental Neuropsychiatry, Department of Psychiatry, Columbia University College of Physicians and Surgeons, New York, New York10032, 2New York State Psychiatric Institute, New York, New York 10032, and 3University of Virginia, Charlottesville, Virginia 22904
The underlying neural determinants of general intelligence have been studied intensively, and seem to derive from the anatomical andfunctional characteristics of a frontoparietal network. Little is known, however, about the underlying neural correlates of domain-specificcognitive abilities, the other factors hypothesized to explain individual performance on intelligence tests. Previous preliminary studieshave suggested that spatially distinct neural structures do not support domain-specific cognitive abilities. To test whether differencesbetween abilities that affect performance on verbal and performance tasks derive instead from the morphological features of a singleanatomical network, we assessed in two independent samples of healthy human participants (N � 83 and N � 58; age range, 5–57 years)the correlation of cortical thickness with the magnitude of the verbal intelligence quotient (VIQ)-performance intelligence quotient (PIQ)discrepancy. We operationalized the VIQ-PIQ discrepancy by regressing VIQ onto PIQ (VIQ-regressed-on-PIQ score), and by regressingPIQ onto VIQ (PIQ-regressed-on-VIQ score). In both samples, a progressively thinner cortical mantle in anterior and posterior regionsbilaterally was associated with progressively greater (more positive) VIQ-regressed-on-PIQ scores. A progressively thicker corticalmantle in anterior and posterior regions bilaterally was associated with progressively greater (more positive) PIQ-regressed-on-VIQscores. Variation in cortical thickness in these regions accounted for a large portion of the overall variance in magnitude of the VIQ-PIQdiscrepancy. The degree of hemispheric asymmetry in cortical thickness accounted for a much smaller but statistically significant portionof variance in VIQ-PIQ discrepancy.
IntroductionFor over a century, psychologists have been interested in measur-ing individual intelligence. Modern intelligence quotient (IQ)tests are based either on a general model of intelligence(Wechsler, 2008) or on a multidimensional model of intelligence(Naglieri and Das, 1997). Neuroimaging studies have begun toinvestigate the neural determinants of intelligence. Most havefocused on identifying the neural correlates of general intelli-gence ( g) using the Wechsler scales of intelligence. The constructof general intelligence is validated by the positive intercorrelationof subtest scores in IQ tests, sometimes referred to as the “positivemanifold” (Carroll, 1993; Colom and Thompson, 2011), and isthought to derive from the overall connectivity of multimodalassociation regions in the brain (Shaw et al., 2006; Jung andHaier, 2007; Narr et al., 2007; Karama et al., 2009). Lesion studies,however, demonstrate dissociable cognitive skills that are betterexplained by multidimensional models of intelligence. The neu-
ral determinants of these multiple dimensions, however, remainunknown.
Models of intelligence derive in large part from factor analy-ses, a mathematical technique that reduces correlational data to asmaller number of unobservable latent factors. The intercorrela-tion of performance on IQ subtests, shared variance, accounts for50% of the total variance in performance. Roughly 70% of thisshared variance represents g. The remaining 30% of variance iscaptured by factors representing domain-specific abilities (DSAs;Watkins, 2006). These DSAs vary with the differing IQ tests in-cluded in a factor analysis (Flanagan et al., 2000).
The few studies examining the neural correlates of DSAs haveproduced equivocal results (Andreasen et al., 1993; Gray et al.,2003; Witelson et al., 2006; Luders et al., 2007; Lange et al., 2010).In one study, g-adjusted verbal IQ (VIQ) and performance IQ(PIQ) scores did not correlate with cortical thickness (CT;Karama et al., 2011), suggesting that DSAs do not derive fromspatially discrete, independent neural systems. The current studywas designed to examine the neural systems that support intra-individual discrepancies in verbal- and performance-specificabilities. Following the methods used in recent studies (Karamaet al., 2011), we regressed VIQ onto PIQ (VIQ-regressed-on-PIQscore) and PIQ onto VIQ (PIQ-regressed-on-VIQ score) andcorrelated the residual scores with CT. The shared variance be-tween VIQ and PIQ represents variance associated with g, and theresidual represents variance associated with domain-specific cog-nitive abilities and task-specific skills. The residual scores that we
Received Feb. 19, 2013; revised June 21, 2013; accepted July 16, 2013.Author contributions: A.M. and B.S.P. designed research; A.M. and K.W.K. performed research; A.M., R.B., X.H.,
C.E., and B.S.P. analyzed data; A.M., M.A., C.E., J.A.N., and B.S.P. wrote the paper.This research was supported by National Institute of Mental Health Grants 2T32 MH16434, MH089582, K02
74677, MH068318, and MH59139 to B.S.P.; and by the Laura Lemle Family Foundation and The NVLD Project.The authors declare no competing financial interests.Correspondence should be addressed to Bradley S. Peterson, NYSPI, 1051 Riverside Drive, Unit 74, New York, NY
10032. E-mail: [email protected]:10.1523/JNEUROSCI.0775-13.2013
Copyright © 2013 the authors 0270-6474/13/3314135-11$15.00/0
The Journal of Neuroscience, August 28, 2013 • 33(35):14135–14145 • 14135

calculated index intraindividual variability in performance acrossVIQ- and PIQ-associated tasks. No other study, to our knowl-edge, has identified the neural correlates of the VIQ-PIQdiscrepancy.
The VIQ-PIQ discrepancy may correlate with a single networkof brain regions or with multiple networks. As prior studies didnot identify discrete neural correlates of g-adjusted VIQ and PIQ,we did not expect the VIQ-PIQ discrepancy to depend on varia-tion in multiple networks. We hypothesized instead that a singleneural system underlies the imbalance between verbal and per-ceptual scores, and therefore that the VIQ-regressed-on-PIQ andPIQ-regressed-on-VIQ scores would correlate with CT in a singlenetwork of brain regions. A discrete network could explain dis-crepancies among DSAs by mediating competition betweenthem, similar to explanations for the competition observed be-tween memory systems in animals and humans (Packard, 2009).Moreover, detecting significant correlations in regions other thanthose associated with g would suggest that a neural system distinctfrom g governs the VIQ-PIQ discrepancy.
Materials and MethodsThe Institutional Review Board at New York State Psychiatric Instituteapproved the studies from which these data are drawn. All parents gaveconsent for children to participate. Children gave their assent to partici-pate. All participants were paid for their participation.
ParticipantsTwo independent samples of healthy control individuals were includedin this study. For both, we recruited healthy adults and children selectedrandomly from a telemarketing database. Recruitment methods for thesestudies have been reported previously (Goh et al., 2011). All participantswere recruited as controls for imaging studies of adult and childhoodneuropsychiatric disorders. Introductory letters were sent and then fol-lowed by screening telephone calls. A detailed clinical interview was per-formed that included the Kiddie-Schedule for Affective Disorders andSchizophrenia for children (Kaufman et al., 1997) and the StructuredClinical Interview for the Diagnostic and Statistical Manual of MentalDisorders, fourth edition, Axis I Disorders (Spitzer et al., 1992) for adults.Two independent clinicians reviewed each file and rated each partici-pant. Individuals with a current or past history of a psychiatric or neu-rological disorder were excluded.
Sample 1. This sample included 83 participants with a Full Scale IQ(FSIQ) of �80, who ranged in age from 5 to 54 years (mean age, 19.38years; SD, 11.98 years). The sample was similarly distributed across gen-der (females, 40%) and was predominantly right handed (94%). Chil-dren under 18 years of age comprised 60% of the sample (Table 1).
Sample 2. This sample included 58 participants with an FSIQ of �80,who ranged in age from 7 to 57 years (mean age, 21.70 years; SD, 13.21years). The sample was similarly distributed across gender (females,50%) and was right handed (100%). Children under 18 years of agecomprised 45% of the sample (Table 1).
Neuropsychological assessmentBecause healthy participants were recruited as controls for several differ-ent studies across two university settings, intelligence testing was per-formed using different instruments depending on the research studyprotocol. Intelligence testing was performed in close temporal proximityto magnetic resonance imaging (MRI) scanning.
Sample 1. The majority of participants completed the Wechsler Abbre-viated Scale of Intelligence (WASI; Wechsler, 1999) using the four-subtest format (n � 67). Sixteen children completed the WechslerIntelligence Scale for Children, third edition (WISC-III; Wechsler, 1991).FSIQ correlations between the WASI and longer forms have been estab-lished at 0.87– 0.92.
Sample 2. Fifteen children completed the WISC-III; abbreviated IQindexes were estimated using established methods that correlate scores of�0.90 with scores from the full administration (Kaufman et al., 1996).
The WISC-III four-subtest administration included Vocabulary and In-formation subtests to estimate VIQ, Block Design and Object Assemblyto estimate PIQ, and the sum of these four tests to estimate Full Scale IQ.Thirty adults completed the Wechsler Adult Intelligence Scale (WAIS)-Revised (Wechsler, 1981). Three children and two adults completed theWASI. Eight children completed the Kaufmann Brief Test of Intelligence(K-BIT; Kaufman and Kaufman, 1985). The K-BIT included Vocabularyfor VIQ and Matrices for PIQ. Correlations of the K-BIT with WISC-IIIhave been established at 0.89 (Canivez et al., 2005).
Although different instruments were used to calculate VIQ, PIQ,and FSIQ (in part, because of the wide age range of participants and,in part, because of differing study protocols), all instruments havebeen shown to correlate highly with one another and to test similardomains of cognitive function. Performance measures of the WASI(Block Design and Matrix Reasoning) correlate 0.60 and 0.54, respec-tively, with Perceptual Organization in the WISC-III, and 0.73 and0.68, respectively, with the WAIS, third edition (WAIS-III; Kam-phaus, 2005). Verbal measures of the WASI (Vocabulary and Similar-ities) are included in the WISC-III and WAIS-III, and correlate 0.87and 0.66, respectively, with the WISC-III and 0.90 and 0.75 with theWAIS-III Verbal Comprehension factor (Kamphaus, 2005). We notethat if all participants had been administered the same IQ test, mea-surement variance would have been reduced and our findings wouldlikely have been stronger. That the findings were so strong and repro-ducible across datasets, despite the inclusion of some participantswho were administered different IQ tests, is a testament to the robust-ness of our findings.
Residual scoresTo create the VIQ-regressed-on-PIQ score, we regressed VIQ onto PIQwith an intercept of zero and saved the residual. To create the PIQ-regressed-on-VIQ score, we regressed PIQ onto VIQ with an intercept ofzero and saved the residual.
Standardized difference scoresWe assessed the correlation of CT with the VIQ-PIQ discrepancy scorebecause discrepancy scores, as opposed to residual scores, are used fre-quently in clinical practice. Subtracting two standardized scorescreates a difference score; the difference score will have an SE ofdifference (SEDiff) that is different from, and smaller than, the SD of theinstrument. The SEDiff score is the SD of the difference score. SEDiffdepends on the reliability of the scores being compared, in this case theIQ indices VIQ and PIQ. VIQ and PIQ have different reliabilities for eachIQ instrument included in our study. Only a standardized discrepancyscore makes discrepancy scores comparable across instruments. Thisstandardized discrepancy score (z-score) is created using the unique
Table 1. Demographic data for all subjects separated by sample
Sample 1 Sample 2
Children Adultsa Children Adultsa
Male Female Male Female Male Female Male Female
Subjects (No.) 27 23 23 10 12 14 17 15Subjects (%) 32.5 27.7 27.7 12.1 20.6 24.1 29.2 25.9Average age (years) 11.6 11.5 33.8 25.5 10.9 9.8 29.2 32.9Youngest (years) 5.8 5.9 18.4 18.9 8.2 7.3 18.3 21.2Oldest (years) 17.9 17.5 54.4 37.77 15.1 15.6 53.7 57.2Min VIQ 75 73 92 95 91 85 110 91Max VIQ 139 149 141 150 135 129 150 150Average VIQ 107.5 109.2 121.1 115.4 112.3 108.3 133.8 120.7Min PIQ 86 85 96 93 104 86 92 104Max PIQ 135 144 137 128 150 140 150 146Average PIQ 108.7 112.8 119 105 121.6 113.4 118.8 121.6Min FSIQ 80 86 86 100 103 90 107 96Max FSIQ 134 142 137 144 143 131 150 150Average FSIQ 108.7 112 119 113 118.8 111.9 130.1 123.7
Min, Minimum; Max, maximum.aOver 18 years of age.
14136 • J. Neurosci., August 28, 2013 • 33(35):14135–14145 Margolis et al. • IQ Discrepancy Scores and Cognitive Abilities

SEDiff for each instrument (Anastasi and Urbina, 1997). The reliabilityof the VIQ and PIQ index scores in the WASI varies with age, and there-fore the SEDiff was calculated for each group, under and over 18 years ofage. For these reasons, we calculated standardized scores separately foreach group of participants who completed a particular instrument andthen correlated these standardized difference scores (VIQ-PIQ)z withcortical thickness.
IQ score distributionsThe mean VIQ scores (112.7 in sample 1; 119.8 in sample 2) and PIQ scores(112.2 in sample 1; 118.8 in sample 2) in both samples were higher than in thestandardization sample, wherein the mean was 100. Nevertheless, the meanVIQ-regressed-on-PIQ and PIQ-regressed-on-VIQ scores were essentiallyzero, and the distribution of the range of scores was close to the normaldistribution. In samples 1 and 2, respectively, the correlations of VIQ withPIQ were 0.461 and 0.309; the correlations of (VIQ-PIQ)z with VIQ were0.683 and 0.635; the correlations of (VIQ-PIQ)z with PIQ were �0.334 and�0.539; the correlations of VIQ-regressed-on-PIQ with VIQ were 0.684 and0.639; the correlations of VIQ-regressed-on-PIQ with PIQ were �0.333 and�0.535; the correlations of PIQ-regressed-on-VIQ with VIQ were �0.672and �0.626; and the correlations of PIQ-regressed-on-VIQ with PIQ were0.347 and 0.549.
Image acquisitionSample 1. Anatomical images were acquired on a 3 tesla whole-bodyscanner (Signa, General Electric) with a body transmitter coil and aneight-channel head receiver coil. High-resolution, T1-weighted brainimages were acquired using a fast spoiled gradient recall sequence [inver-sion time, 500 ms; repetition time (TR), 4.7 ms; echo time (TE), 1.3 ms;field of view (FOV), 24 cm; image matrix, 256 � 256; acceleration factor,2; 160 slices; slice thickness, 1 mm] encoded for sagittal slice reconstruc-tion, providing voxel dimensions of 0.9375 � 0.9375 � 1.0 mm.
Sample 2. Anatomical images were acquired using a 1.5 tesla scanner(Signa; General Electric) for each participant. Head positioning was stan-dardized using cantho-meatal landmarks. Images were acquired using athree-dimensional spoiled gradient recall sequence with the followingparameters: TR, 24 ms; TE, 5 ms; 45° flip angle; matrix size 256 � 192;two excitations; FOV, 30 cm; 124 contiguous sagittal slices that were 1.2mm thick without skip and reformatted with voxel dimensions 1.17 �1.17 � 1.2 mm.
Image processingImages were processed on Sun Ultra 10 workstations using ANALYZE8.0 Biomedical Imaging Resource (Mayo Foundation, Rochester, MN)and software developed in-house; technicians were blind to subject char-acteristics and hemisphere (images were randomly flipped in the trans-verse plane before preprocessing). We resliced the MRI dataset to correctfor any residual head rotation, tilt, or flexion/extension before perform-ing morphometric analyses.
We removed inhomogeneities in image intensity before isolating ce-rebral tissue (Sled et al., 1998). Inter-rater reliabilities, calculated as in-traclass correlation coefficients using a two-way random-effects model,were all �0.98 (Arndt et al., 1991).
Preprocessing. We corrected large-scale variations in image intensityusing an algorithm developed at the Montreal Neurological Institute(Sled et al., 1998). Extracerebral tissues were removed using an auto-mated tool for brain extraction (Shattuck and Leahy, 2002) thatsmoothes image intensity with an anisotropic filter, detects three-dimensional (3-D) edges using a Marr-Hildreth edge detector (Marr andHildreth, 1980), and selects as the brain the largest connected componentwith a closed boundary. We manually removed connecting dura on eachslice in sagittal view and checked it in orthogonal views. The brainstemwas transected at the pontomedullary junction.
Cortical gray matter segmentation. We sampled bilaterally gray-scalevalues of “pure” representations of cortical gray matter and white matterat four standard locations (frontal, temporal, occipital, and parietallobes) using an 8 � 8 � 64 pixel array, which is sufficiently large toprovide statistical stability but small enough to avoid including othertissue types, which can create partial volume effects. We averaged thesefour values for each tissue type, and computed a threshold value halfway
between the mean gray and white matter values for a slice in the imagingvolume. We used these threshold values on a slice-by-slice basis to pro-vide an initial rough classification of cortical gray and white matterthroughout the cerebrum. To provide the most accurate segmentationpossible of the cortical mantle, we hand edited the classification in thecoronal and transverse views. The intraclass correlation coefficient mea-suring the reliability of cortical gray matter volumes using a two-wayrandom-effects model (Shrout and Fleiss, 1979) was 0.98.
Choice of template brain. To select a template brain that was mostrepresentative of our cohort, we identified a brain that was as represen-tative as possible of the demographics of the sample (i.e., demographicdata were closest to the mean as possible in terms of age, weight, andheight). We then coregistered the brains of the remaining participants tothis preliminary template. We determined point correspondences on thesurfaces of their cortices and computed the distances of the correspond-ing points on the cerebral surface of the other participants from thesurface of the template brain. The brain for which all points acrossthe surface were closest (in terms of least squares) to the average of thecomputed distances was selected as the final template brain. We thenperformed a second coregistration of all brains to this most representa-tive template. A single representative brain serves as a better templatethan does an averaged brain because a single brain has well defined tissueinterfaces. Averaging images for a template blurs these boundaries andincreases registration errors, which are important when distinguishingsubtle effects across populations.
Sulcal overlay. We overlaid onto the statistical maps of our templatebrain the sulcal boundaries previously identified on the InternationalConsortium for Brain Mapping (ICBM) high-resolution, single-participant template (http://www.loni.ucla.edu/ICBM/Downloads/Downloads_ICBMtemplate.shtml; Mazziotta et al., 2001) to aid visualidentification of the locations of findings on the surface of the brain. Wemapped the sulcal boundaries and 3-D labels of cortical gyri from theICBM template onto the cortical surface of our template brain using ourhigh-dimensional, nonrigid warping algorithm (see above).
Cortical thicknessFor detailed descriptions of our procedures for surface morphologies,and related validation studies, see previous studies (Bansal et al., 2005).In short, random flips were reversed to provide their original correctorientation. Isolated brains were coregistered to the selected templatebrain (Plessen et al., 2006) using a similarity transformation, followed bya high-dimensional, nonrigid warping algorithm based on the dynamicsof fluid flow. We removed the cortical mantle from each coregisteredbrain. We then used a three-dimensional morphological operator to dis-tance transform this brain without the cortex from the coregistered brainof the same participant that contained the cortex (Rosenfeld and Pfaltz,1968; Haralick and Shapiro, 1991). Thus, we calculated CT as the smallestdistance of each point on the external cortical surface from the outermostsurface of the white matter in the coregistered brain. Because the brainand its local features, such as CT, were scaled during the similarity trans-formation of that brain to the template brain, these thickness values,measured in template space, inherently accounted for generalized scalingeffects within the cerebrum.
Cortical asymmetryTo compare CTs across the right hemisphere with those across the lefthemisphere, the right hemisphere of each brain was normalized to thetemplate left hemisphere using a two-step process. First, the right hemi-sphere of each brain was flipped to create a mirror image so that it overlaythe left hemisphere of the same brain. The right hemisphere was thenwarped to the left hemisphere by a high-dimensional, nonrigid warpingalgorithm based on the dynamics of fluid flow. Second, we used thedeformation field that mapped the left hemisphere on the template lefthemisphere to warp the right hemisphere to the template left hemi-sphere. This two-step process established correspondences across allpoints on the right hemisphere and those across the left hemisphere ofthe template brain, thereby allowing us to compute variations in CT atparticular voxels in each hemisphere. We then assessed the correlationbetween the VIQ-regressed-on-PIQ score and the left–right CT differ-
Margolis et al. • IQ Discrepancy Scores and Cognitive Abilities J. Neurosci., August 28, 2013 • 33(35):14135–14145 • 14137

ence at each voxel, as well as the PIQ-regressed-on-VIQ score and theleft–right CT difference at each voxel.
Statistical analysisWe used multivariate linear regression at each point on the referencesurface to examine associations of the VIQ-regressed-on-PIQ and PIQ-regressed-on-VIQ scores with CT. In addition to the main effects, weconsidered for inclusion in the model the two-way interactions of age (inyears) and sex (male, female) with VIQ-regressed-on-PIQ and PIQ-regressed-on-VIQ scores by assessing their significance in the followinglinear regressions:
CTi � �0 � �1 � age � �2 � sex � �3 � VIQ � regressed
� on � PIQ score � �4 � VIQ � regressed � on � PIQ score
� sex (1)
CTi � �0 � �1 � age � �2 � sex � �3 � PIQ � regressed
� on � VIQ score � �4 � PIQ � regressed � on � VIQ score
� sex (2)
CTi � �0 � �1 � age � �2 � sex � �3 � VIQ � regressed
� on � PIQ score � �4 � VIQ � regressed � on � PIQ score
� age (3)
CTi � �0 � �1 � age � �2 � sex � �3 � PIQ � regressed
� on � VIQ score � �4 � PIQ � regressed � on � VIQ score
� age, (4)
where CTi is the set of CT measurements for all i participants.The models were hierarchically well formulated (all lower-order com-
ponent terms were included in the model, regardless of statistical signif-icance). We used the false detection rate (FDR; Benjamini and Hochberg,1995) to account for the multiple correlations computed across the cor-tical surface. We computed the correlation of CTi with VIQ-regressed-on-PIQ score, and CTi with PIQ-regressed-on-VIQ score. We evaluatedthe p values of these correlations using Student’s t tests. Statistical mapswere generated to display color-coded p values across the entire surface ofthe cortex. Statistical maps were also generated for the interactions of sex
Figure 1. Significance maps showing correlations of cortical thickness (CT) with VIQ-regressed-on-PIQ scores. Maps of correlation of VIQ-regressed-on-PIQ scores with CT, corrected for multiplecomparisons using FDR. At each point on the cerebral surface, the statistical significance (probability values) of the correlation of the VIQ-regressed-on-PIQ score with CT is color coded. Warm colors(yellow, orange, red) represent a positive correlation (thicker cortex as the residual score increases), and cooler colors (blue and purple) represent a negative correlation (thinner cortex as the residualscore increases). The color bar indicates the color coding of p values for testing of statistical significance at each point on the surface of the brain. Top, Maps of sample 1, N � 83. Bottom, Maps ofsample 2, N�58. CG, Cingulate gyrus; CUN, cuneus; FG, fusiform gyrus; GR, gyrus rectus; IFG, inferior frontal gyrus; IOG, inferior occipital gyrus; IP, inferior parietal lobule; ITG, inferior temporal gyrus,LG, lingual gyrus; MFG, middle frontal gyrus; MOG, middle occipital gyrus; MTG, middle temporal gyrus; OFG, orbital frontal gyrus; PG, precentral gyrus; PreCu, precuneus; SFG, superior frontal gyrus;SMG, supramarginal gyrus; SOG, superior occipital gyrus; SPG, superior parietal gyrus; STG, superior temporal gyrus.
14138 • J. Neurosci., August 28, 2013 • 33(35):14135–14145 Margolis et al. • IQ Discrepancy Scores and Cognitive Abilities

with VIQ-regressed-on-PIQ score, age with VIQ-regressed-on-PIQscore, sex with PIQ-regressed-on-VIQ score, and age with PIQ-regressed-on-VIQ score. As none of these interactions were statisticallysignificant, they were removed from the final statistical model.
To assess hemispheric asymmetry, the differences between left andright CTs were regressed first on age (in years), sex (male, female), andVIQ-regressed-on-PIQ residual score, and then, in a separate analysis,the differences between left and right CTs were regressed on age, sex, andPIQ-regressed-on-VIQ residual score. The statistically significant resultswere color encoded and displayed on the surface of the template lefthemisphere, with warm colors (red and yellow) representing positivecorrelations (increased thickness) and cold colors (blue and purple) rep-resenting inverse correlations (reduced thickness) of thickness differ-ences with VIQ-regressed-on-PIQ and PIQ-regressed-on-VIQ residualscores.
ResultsWe imaged 141 individuals, 83 (50 children, 33 adults) in sample1 and 58 (26 children, 32 adults) in the sample 2. The mean FSIQscores in the two samples were somewhat higher than the mean inthe standardization sample (113 in sample 1; 121.7 in sample 2;
100 in standardization sample), but the ranges of the VIQ-regressed-on-PIQ and the PIQ-regressed-on-VIQ residual scoreswere normally distributed around a mean of zero in each sample.The VIQ-regressed-on-PIQ score and the PIQ-regressed-on-VIQ score correlated only weakly with FSIQ (r 2 � 0.305 and�0.291, respectively; p values �0.005). The proportion of partic-ipants who had at least 1 SD of difference (15 points) betweenVIQ and PIQ (34% in sample 1; 40% in sample 2) was similar torates in normative samples (e.g., 26% in the WAIS-IV standard-ization sample; Wechsler, 2008). Similar to normative samples,approximately half of the participants who had at least 1 SD ofdifference between VIQ and PIQ had a VIQ greater than PIQ(57% in sample 1; 48% in sample 2), and half had a PIQ greaterthan VIQ (43% in sample 1; 52% in sample 2).
In both samples, CT correlated inversely with the magnitudeof the VIQ-regressed-on-PIQ residual score and positively withthe PIQ-regressed-on-VIQ residual score in both the right andleft hemispheres within the anterior-most surface of the frontallobe and within the occipital lobes (Figs. 1, 2). Specifically, ante-
Figure 2. Significance maps showing correlations of cortical thickness (CT) with PIQ-regressed-on-VIQ scores. Maps of correlation of PIQ-regressed-on-VIQ scores with CT, corrected for multiplecomparisons using FDR. At each point on the cerebral surface, the statistical significance (probability values) of the correlation of the PIQ-regressed-on-VIQ score with CT is color coded. Warm colors(yellow, orange, red) represent a positive correlation (thicker cortex as the residual score increases), and cooler colors (blue and purple) represent a negative correlation (thinner cortex as the residualscore increases). The color bar indicates the color coding of p values for the testing of statistical significance at each point on the surface of the brain. Top, Maps of sample 1, N � 83. Bottom, Mapsof sample 2, N � 58. CG, Cingulate gyrus; CUN, cuneus; FG, fusiform gyrus; GR, gyrus rectus; IFG, inferior frontal gyrus; IOG, inferior occipital gyrus; IP, inferior parietal lobule; ITG, inferior temporalgyrus, LG, lingual gyrus; MFG, middle frontal gyrus; MOG, middle occipital gyrus; MTG, middle temporal gyrus; OFG, orbital frontal gyrus; PG, precentral gyrus; PreCu, precuneus; SFG, superior frontalgyrus; SMG, supramarginal gyrus; SOG, superior occipital gyrus; SPG, superior parietal gyrus; STG, superior temporal gyrus.
Margolis et al. • IQ Discrepancy Scores and Cognitive Abilities J. Neurosci., August 28, 2013 • 33(35):14135–14145 • 14139
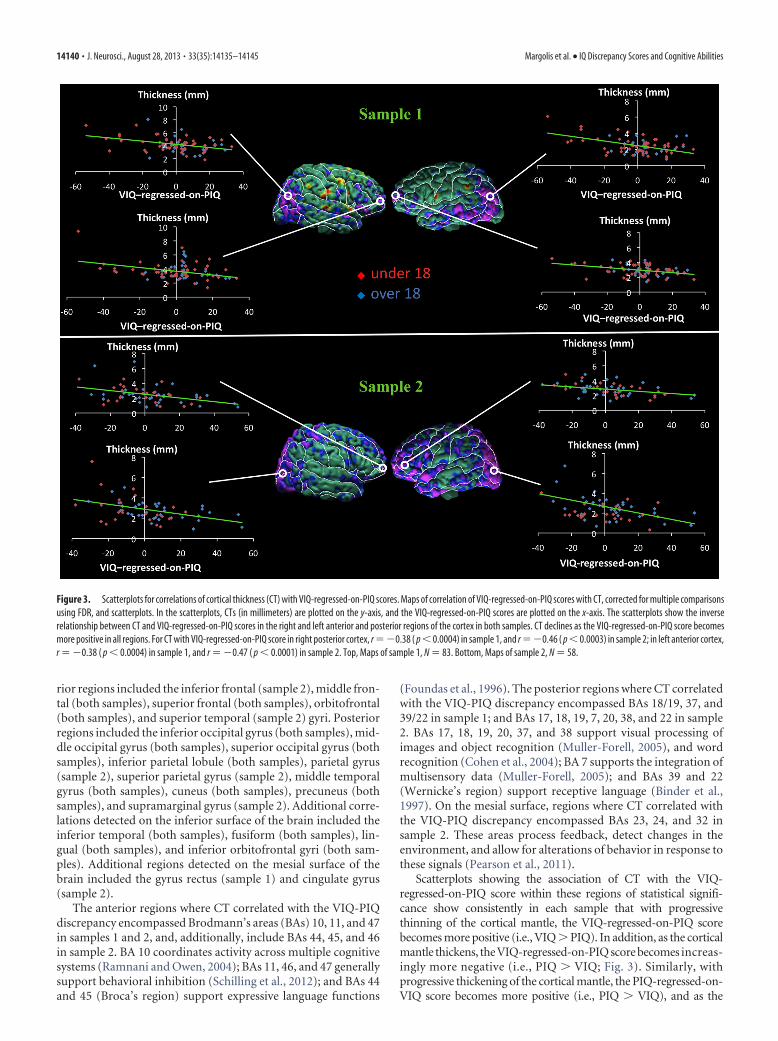
rior regions included the inferior frontal (sample 2), middle fron-tal (both samples), superior frontal (both samples), orbitofrontal(both samples), and superior temporal (sample 2) gyri. Posteriorregions included the inferior occipital gyrus (both samples), mid-dle occipital gyrus (both samples), superior occipital gyrus (bothsamples), inferior parietal lobule (both samples), parietal gyrus(sample 2), superior parietal gyrus (sample 2), middle temporalgyrus (both samples), cuneus (both samples), precuneus (bothsamples), and supramarginal gyrus (sample 2). Additional corre-lations detected on the inferior surface of the brain included theinferior temporal (both samples), fusiform (both samples), lin-gual (both samples), and inferior orbitofrontal gyri (both sam-ples). Additional regions detected on the mesial surface of thebrain included the gyrus rectus (sample 1) and cingulate gyrus(sample 2).
The anterior regions where CT correlated with the VIQ-PIQdiscrepancy encompassed Brodmann’s areas (BAs) 10, 11, and 47in samples 1 and 2, and, additionally, include BAs 44, 45, and 46in sample 2. BA 10 coordinates activity across multiple cognitivesystems (Ramnani and Owen, 2004); BAs 11, 46, and 47 generallysupport behavioral inhibition (Schilling et al., 2012); and BAs 44and 45 (Broca’s region) support expressive language functions
(Foundas et al., 1996). The posterior regions where CT correlatedwith the VIQ-PIQ discrepancy encompassed BAs 18/19, 37, and39/22 in sample 1; and BAs 17, 18, 19, 7, 20, 38, and 22 in sample2. BAs 17, 18, 19, 20, 37, and 38 support visual processing ofimages and object recognition (Muller-Forell, 2005), and wordrecognition (Cohen et al., 2004); BA 7 supports the integration ofmultisensory data (Muller-Forell, 2005); and BAs 39 and 22(Wernicke’s region) support receptive language (Binder et al.,1997). On the mesial surface, regions where CT correlated withthe VIQ-PIQ discrepancy encompassed BAs 23, 24, and 32 insample 2. These areas process feedback, detect changes in theenvironment, and allow for alterations of behavior in response tothese signals (Pearson et al., 2011).
Scatterplots showing the association of CT with the VIQ-regressed-on-PIQ score within these regions of statistical signifi-cance show consistently in each sample that with progressivethinning of the cortical mantle, the VIQ-regressed-on-PIQ scorebecomes more positive (i.e., VIQ � PIQ). In addition, as the corticalmantle thickens, the VIQ-regressed-on-PIQ score becomes increas-ingly more negative (i.e., PIQ � VIQ; Fig. 3). Similarly, withprogressive thickening of the cortical mantle, the PIQ-regressed-on-VIQ score becomes more positive (i.e., PIQ � VIQ), and as the
Figure 3. Scatterplots for correlations of cortical thickness (CT) with VIQ-regressed-on-PIQ scores. Maps of correlation of VIQ-regressed-on-PIQ scores with CT, corrected for multiple comparisonsusing FDR, and scatterplots. In the scatterplots, CTs (in millimeters) are plotted on the y-axis, and the VIQ-regressed-on-PIQ scores are plotted on the x-axis. The scatterplots show the inverserelationship between CT and VIQ-regressed-on-PIQ scores in the right and left anterior and posterior regions of the cortex in both samples. CT declines as the VIQ-regressed-on-PIQ score becomesmore positive in all regions. For CT with VIQ-regressed-on-PIQ score in right posterior cortex, r ��0.38 ( p � 0.0004) in sample 1, and r ��0.46 ( p � 0.0003) in sample 2; in left anterior cortex,r � �0.38 ( p � 0.0004) in sample 1, and r � �0.47 ( p � 0.0001) in sample 2. Top, Maps of sample 1, N � 83. Bottom, Maps of sample 2, N � 58.
14140 • J. Neurosci., August 28, 2013 • 33(35):14135–14145 Margolis et al. • IQ Discrepancy Scores and Cognitive Abilities

cortical mantle thins, the PIQ-regressed-on-VIQ score becomes in-creasingly more negative (i.e., VIQ � PIQ; Fig. 4). Neither the VIQ-regressed-on-PIQ nor the PIQ-regressed-on-VIQ score interactedwith age or sex in regions identified in the main effect in the regres-sion model in either sample.
We compared the regions identified as correlating with VIQ-PIQ discrepancy in both the 1.5 T and 3 T samples with theregions previously identified as correlating with general intelli-gence. First, we compared our findings to the regions identified ina metareview of 37 studies of the neural correlates of generalintelligence (Jung and Haier, 2007). The two networks have thefollowing areas in common: BAs 10, 47, 18, and 19. Regions weidentified as correlating with the VIQ-PIQ discrepancy but notwith general intelligence are BAs 11 and 22. Regions that correlatewith general intelligence but not with VIQ-PIQ discrepancy areBAs 6, 9, 32, 45, 46, 40, and 21. Second, we compared our findingsto the regions identified as neural correlates of FSIQ within thesame 1.5 T sample as in our present study (Goh et al., 2011) andidentified only BAs 10 and 11.
The VIQ-PIQ discrepancy has long been considered a putativebehavioral marker of psychiatric disorders, including speech-language impairment (Rice et al., 2005), autism spectrum disor-
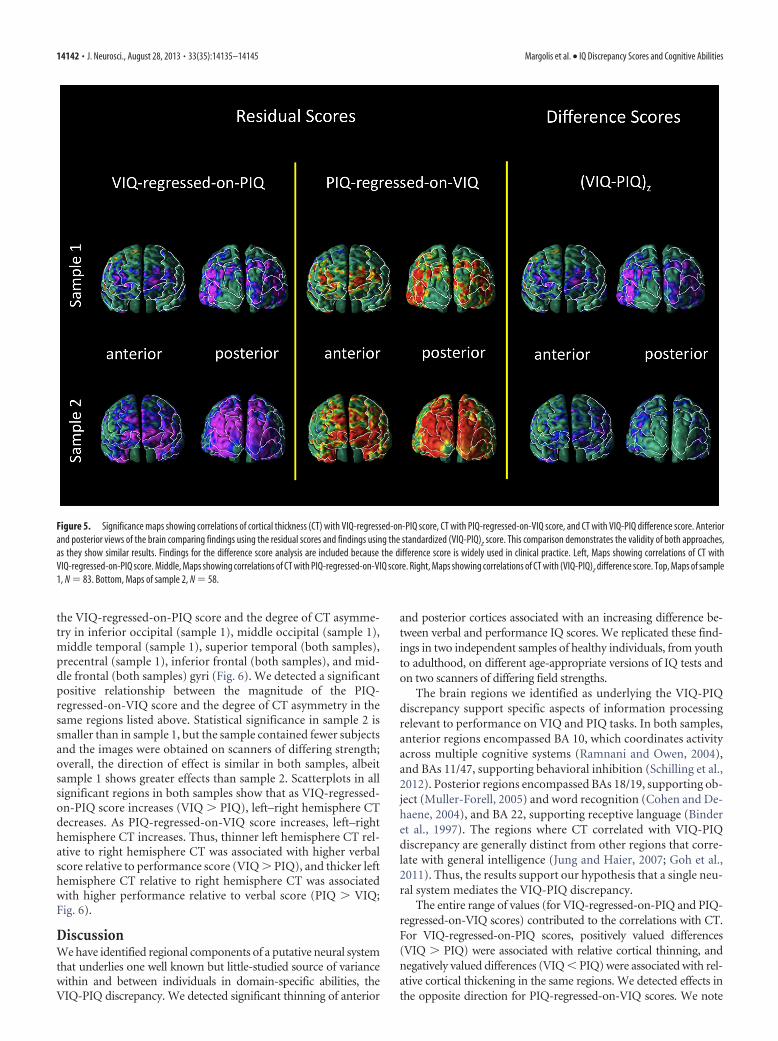
ders (Mayes, 2003; Charman, 2011), and nonverbal learningdisability (Grodzinsky et al., 2010). Clinicians rely on the VIQ-PIQ difference score, not residual scores, to estimate the discrep-ancy between abilities. We therefore compared the regionsidentified as correlating with VIQ-regressed-on-PIQ and PIQ-regressed-on-VIQ residual scores with the regions identified ascorrelating with the VIQ-PIQ difference score (Fig. 5). This com-parison demonstrated similar results for residual and differencescores within the anterior-most surface of the frontal lobe andwithin the occipital lobes, although the residual scores demon-strated stronger effects. The similarity across the type of measuresindicates the validity of both residual scores and difference scores.
We also assessed whether the VIQ-regressed-on-PIQ andPIQ-regressed-on-VIQ scores correlate with measures of ana-tomical asymmetry in CT. To measure asymmetry in CT at eachpoint along the cerebral surface of each participant, we estab-lished correspondences across all points on the surface of theright hemisphere with those on the surface of the left hemisphereand mapped these to the surface of the template brain, therebyallowing us to calculate asymmetry at each point as the CT in theleft hemisphere minus the CT in the right hemisphere. We de-tected a significant inverse relationship between the magnitude of
Figure 4. Scatterplots for correlations of cortical thickness (CT) with PIQ-regressed-on-VIQ scores. Maps of correlation of PIQ-regressed-on-VIQ with CT, corrected for multiple comparisons usingFDR, and scatterplots. In the scatterplots, CTs (in millimeters) are plotted on the y-axis, and the PIQ-regressed-on-VIQ scores are plotted on the x-axis. The scatterplots show the positive relationshipbetween CT and PIQ-regressed-on-VIQ scores in the right and left anterior and posterior regions of the cortex in both samples. CT increases as the PIQ-regressed-on-VIQ score becomes more positivein all regions. For CT with PIQ-regressed-on-VIQ in right posterior cortex, r � 0.35 ( p � 0.0012) in sample 1, and r � 0.48 ( p � 0.0002) in sample 2; in left anterior cortex, r � 0.34 ( p � 0.0015)in sample 1, and r � 0.42 ( p � 0.0009) in sample 2. Top, Maps of sample 1, N � 83. Bottom, Maps of sample 2, N � 58.
Margolis et al. • IQ Discrepancy Scores and Cognitive Abilities J. Neurosci., August 28, 2013 • 33(35):14135–14145 • 14141
the VIQ-regressed-on-PIQ score and the degree of CT asymme-try in inferior occipital (sample 1), middle occipital (sample 1),middle temporal (sample 1), superior temporal (both samples),precentral (sample 1), inferior frontal (both samples), and mid-dle frontal (both samples) gyri (Fig. 6). We detected a significantpositive relationship between the magnitude of the PIQ-regressed-on-VIQ score and the degree of CT asymmetry in thesame regions listed above. Statistical significance in sample 2 issmaller than in sample 1, but the sample contained fewer subjectsand the images were obtained on scanners of differing strength;overall, the direction of effect is similar in both samples, albeitsample 1 shows greater effects than sample 2. Scatterplots in allsignificant regions in both samples show that as VIQ-regressed-on-PIQ score increases (VIQ � PIQ), left–right hemisphere CTdecreases. As PIQ-regressed-on-VIQ score increases, left–righthemisphere CT increases. Thus, thinner left hemisphere CT rel-ative to right hemisphere CT was associated with higher verbalscore relative to performance score (VIQ � PIQ), and thicker lefthemisphere CT relative to right hemisphere CT was associatedwith higher performance relative to verbal score (PIQ � VIQ;Fig. 6).
DiscussionWe have identified regional components of a putative neural systemthat underlies one well known but little-studied source of variancewithin and between individuals in domain-specific abilities, theVIQ-PIQ discrepancy. We detected significant thinning of anterior
and posterior cortices associated with an increasing difference be-tween verbal and performance IQ scores. We replicated these find-ings in two independent samples of healthy individuals, from youthto adulthood, on different age-appropriate versions of IQ tests andon two scanners of differing field strengths.
The brain regions we identified as underlying the VIQ-PIQdiscrepancy support specific aspects of information processingrelevant to performance on VIQ and PIQ tasks. In both samples,anterior regions encompassed BA 10, which coordinates activityacross multiple cognitive systems (Ramnani and Owen, 2004),and BAs 11/47, supporting behavioral inhibition (Schilling et al.,2012). Posterior regions encompassed BAs 18/19, supporting ob-ject (Muller-Forell, 2005) and word recognition (Cohen and De-haene, 2004), and BA 22, supporting receptive language (Binderet al., 1997). The regions where CT correlated with VIQ-PIQdiscrepancy are generally distinct from other regions that corre-late with general intelligence (Jung and Haier, 2007; Goh et al.,2011). Thus, the results support our hypothesis that a single neu-ral system mediates the VIQ-PIQ discrepancy.
The entire range of values (for VIQ-regressed-on-PIQ and PIQ-regressed-on-VIQ scores) contributed to the correlations with CT.For VIQ-regressed-on-PIQ scores, positively valued differences(VIQ � PIQ) were associated with relative cortical thinning, andnegatively valued differences (VIQ � PIQ) were associated with rel-ative cortical thickening in the same regions. We detected effects inthe opposite direction for PIQ-regressed-on-VIQ scores. We note
Figure 5. Significance maps showing correlations of cortical thickness (CT) with VIQ-regressed-on-PIQ score, CT with PIQ-regressed-on-VIQ score, and CT with VIQ-PIQ difference score. Anteriorand posterior views of the brain comparing findings using the residual scores and findings using the standardized (VIQ-PIQ)z score. This comparison demonstrates the validity of both approaches,as they show similar results. Findings for the difference score analysis are included because the difference score is widely used in clinical practice. Left, Maps showing correlations of CT withVIQ-regressed-on-PIQ score. Middle, Maps showing correlations of CT with PIQ-regressed-on-VIQ score. Right, Maps showing correlations of CT with (VIQ-PIQ)z difference score. Top, Maps of sample1, N � 83. Bottom, Maps of sample 2, N � 58.
14142 • J. Neurosci., August 28, 2013 • 33(35):14135–14145 Margolis et al. • IQ Discrepancy Scores and Cognitive Abilities

the opposing effects at each voxel in which thinning of the corticalmantle is associated with better performance on VIQ relative to PIQtasks, and thickening of the cortical mantle at the same location isassociated with better performance on PIQ relative to VIQ tasks.
The neural system we identified seems to operate like a CT rheo-stat that either improves or degrades performance of one domain-specific ability relative to the other as CT deviates either upwards ordownwards from the population mean: when the cortical mantle isthin in an individual relative to the average CT of the populationsample, VIQ is higher than PIQ; when the cortical mantle is thick,PIQ is higher than VIQ. In this model, the DSAs (measured withVIQ and PIQ) derive from two independent and distributed neuralsystems that compete, at least in part, for access to the limited capac-ity system, so that what access one system gains, the other loses, in azero-sum game. The DSAs presumably rely on other circuits andbrain regions in addition to the system that we have identified, butour system is presumably where the circuits that support these inde-pendent abilities physically interface with one another.
Alternatively, the opposing effects on performance of thinningand thickening at each voxel could arise if two relatively independentmorphological features are present within the brain tissue imagedwithin each voxel, and if those two features relate in opposing ways
to abilities that affect VIQ and PIQ scores. A smaller size of onefeature (e.g., the thickness of one cortical layer or size of one cell type)would support better performance on VIQ tasks, and a larger size ofanother feature (a different cortical layer or a second cell type) wouldsupport better performance on PIQ tasks. Because CT at each voxelis a summation of the sizes of all the morphological elements withinthat voxel, these two morphological features and their differentialassociations with VIQ and PIQ tasks also would sum within eachvoxel, giving rise to the following four possible combinations of fea-tures that relate to the VIQ-PIQ discrepancy: (1) both morphologi-cal features are small (and thus one is contributing to higher VIQscores and the other to lower PIQ scores): the cortical mantle is thinand VIQ is high relative to PIQ; (2) both features are large: the cor-tical mantle is thick, and PIQ is high relative to VIQ; (3) VIQ-relatedfeatures are large and PIQ-related features are small: VIQ equals PIQand both are low, and CT has an intermediate value nearer the pop-ulation average; and (4) VIQ-related features are small and PIQ-related features are large: VIQ equals PIQ and both are high, and CThas an intermediate value near the population average. These com-binations of morphological features and their relation to the VIQ-PIQ discrepancy can account for the linear relationship between theresidual scores and CT that we detected. Therefore, the VIQ-PIQ
Figure 6. Correlations and scatterplots of VIQ-regressed-on-PIQ and PIQ-regressed-on-VIQ scores with asymmetry in cortical thickness (CT). Maps of correlation of VIQ-regressed-on-PIQ andPIQ-regressed-on-VIQ scores with asymmetry in CT (left hemisphere CT minus right hemisphere CT), corrected for multiple comparisons using FDR. Asymmetry correlated inversely with themagnitude of the VIQ-regressed-on-PIQ score in inferior occipital (sample 1), middle occipital (sample 1), middle temporal (sample 1), superior temporal (both samples), precentral (sample 1),inferior frontal (both samples) and middle frontal (both samples) gyri (Fig. 6). We detected a significant positive relationship between the magnitude of the PIQ-regressed-on-VIQ score and thedegree of CT asymmetry in the same regions listed above. Top, Maps of sample 1, N � 83. Bottom, Maps of sample 2, N � 58.
Margolis et al. • IQ Discrepancy Scores and Cognitive Abilities J. Neurosci., August 28, 2013 • 33(35):14135–14145 • 14143

discrepancy could derive from differences in morphology in twopreviously unidentified, independent systems supporting DSAs.
Most neuroimaging studies measure intelligence with theWechsler scales and interpret findings in terms of verbal andperformance scales. To the extent that verbal and performancescores share common requirements, they both measure generalability. In addition to this shared variance, however, each scorerepresents unique variance associated with a domain-specificability and variance in task-specific skills (Colom and Thompson,2011). The constructs that these sources of variance representhave long been debated. Some IQ theorists argue that VIQ mea-sures achievement, not ability, because performance on many ofthe IQ test items, such as vocabulary, depends on acquiredknowledge (Naglieri and Bornstein, 2003). These theorists iden-tify PIQ as simultaneous processing, the ability to understand theinter-relationships of variables as assessed, for example, with ma-trix tests (Kaufman and Kaufman, 1985; Naglieri and Das, 1997).Therefore, the VIQ-PIQ discrepancy can be interpreted as a dif-ference between achievement and simultaneous processing.Achievement presumably represents experience and learning,whereas simultaneous processing involves a more innate matu-rational ability. Our findings are consistent with the known dif-ferences in the neurobiological bases for these two cognitiveprocesses. The association of cortical thinning with higherachievement relative to simultaneous processing scores suggeststhat achievement may benefit from consolidative processes likesynaptic or dendritic pruning. The association of cortical thick-ening with higher simultaneous processing relative to achieve-ment scores suggests that simultaneous processing may benefitfrom greater plasticity within the cortical mantle, which presum-ably requires greater dendritic and axonal arborization, andgreater connectivity within and across cortical layers.
Lesion studies have demonstrated that unilateral damage to ahemisphere, depending on the location of the lesion, produces lossof a skill and a discrepancy between verbal and spatial ability (War-rington et al., 1986; Glascher et al., 2009), which at first considerationcould imply a discrepancy with our findings of bilateral representa-tion in the neural correlates of VIQ-PIQ discrepancy. Although le-sion studies identify regions that are necessary for performing aparticular cognitive skill, being necessary for a skill is not synony-mous with being sufficient for it, as other regions may neverthelesscontribute to performance measures. Human imaging studies aremore likely than lesion studies to identify regions that support skills,even if not absolutely necessary for their performance. Moreover,persons with unilateral lesions often recover function through neu-roplastic responses in the opposite hemisphere, suggesting the im-portance of bilateral contributions to verbal and spatial skills(Vigneau et al., 2011). Additionally, various stimulation studies sug-gest that verbal and spatial skills are represented bilaterally in thebrain (Pascual-Leone et al., 1994; Binder et al., 1996; Knecht et al.,2002). Finally, differences in conclusions from morphometric andlesion studies likely relate to fundamental differences in the measuresand methods used to localize the effects of interest. CT, for instance,is a feature only of gray matter, which supports primarily local pro-cessing, whereas naturalistic lesions often affect more prominentlywhite matter, which supports communication across brain regions.
In addition to bilateral correlations, we detected evidence inboth samples for a less robust correlation of hemispheric asym-metry in CT with VIQ-PIQ discrepancy. A thinner left cortexrelative to right was associated with higher VIQ relative to PIQ,and a thicker left cortex relative to right was associated withhigher PIQ relative to VIQ. These findings are generally consis-tent with the hemisphere-specific findings from naturalistic hu-
man lesion studies (Glascher et al., 2009), and they are consistentwith our primary finding that higher VIQ relative to PIQ is asso-ciated with cortical thinning and higher PIQ relative to VIQ isassociated with cortical thickening.
Studies of patient populations suggest that the VIQ-PIQ dis-crepancy may be under genetic control. The VIQ-PIQ discrep-ancy in autism defines a particular phenotype that is linked to twogenes, one of which is also implicated in speech-language impair-ment (Chapman et al., 2011). The presence of the VIQ-PIQ dis-crepancy in Prader-Willi syndrome depends on the diseasegenotype (either a deletion or uniparental disomy) and is associ-ated with higher risk for associated autism spectrum behaviors(Copet et al., 2010).
Our study has limitations. To evaluate whether our resultsvary as a function of overall IQ would require a sufficiently largesample to assess these correlates separately in groups of peoplewith low, medium, or high FSIQ. To assess the histological cor-relates of our findings would require a large postmortem study.Our participant samples spanned a wide range of ages, whichpotentially could add variability to the correlations that we as-sessed. Age did not interact with VIQ-PIQ discrepancy, however,suggesting that the association of VIQ-PIQ discrepancy with CTis consistent across ages. The inclusion of participants across ageand developmental stages can be viewed as a relative strength ofour study, as it increases the generalizability of our findings. Thecontributions of even the youngest children in our samples to thecorrelations of CT with VIQ-PIQ discrepancy (Figs. 3, 4) suggestthat the morphological and cellular determinants of the discrep-ancies in these cognitive domains may be present early in life.
ReferencesAnastasi A, Urbina S (1997) Psychological testing. Upper Saddle River, NJ:
Prentice Hall.Andreasen NC, Flaum M, Swayze V 2nd, O’Leary DS, Alliger R, Cohen G,
Ehrhardt J, Yuh WT (1993) Intelligence and brain structure in normalindividuals. Am J Psychiatry 150:130 –134. Medline
Arndt S, Cohen G, Alliger RJ, Swayze VW 2nd, Andreasen NC (1991) Prob-lems with ratio and proportion measures of imaged cerebral structures.Psychiatry Res 40:79 – 89. Medline
Bansal R, Staib LH, Whiteman R, Wang YM, Peterson BS (2005) ROC-based assessments of 3D cortical surface-matching algorithms. Neuroim-age 24:150 –162. CrossRef Medline
Benjamini Y, Hochberg Y (1995) Controlling the false discovery rate: apractical and powerful approach to multiple testing. J R Stat Soc B 57:289 –300.
Binder JR, Swanson SJ, Hammeke TA, Morris GL, Mueller WM, Fischer M,Benbadis S, Frost JA, Rao SM, Haughton VM (1996) Determination oflanguage dominance using functional MRI: a comparison with the Wadatest. Neurology 46:978 –984. CrossRef Medline
Binder JR, Frost JA, Hammeke TA, Cox RW, Rao SM, Prieto T (1997) Hu-man brain language areas identified by functional magnetic resonanceimaging. J Neurosci 17:353–362. Medline
Canivez GL, Neitzel R, Martin BE (2005) Construct validity of the KaufmanBrief Intelligence Test, Wechsler Intelligence Scale for Children-third edi-tion, and Adjustment Scales for Children and Adolescents. J PsychoeducAssess 23:15–34. CrossRef
Carroll JB (1993) Human cognitive abilities: a survey of factor-analyticstudies. Cambridge, UK: Cambridge UP.
Chapman NH, Estes A, Munson J, Bernier R, Webb SJ, Rothstein JH, Min-shew NJ, Dawson G, Schellenberg GD, Wijsman EM (2011) Genome-scan for IQ discrepancy in autism: evidence for loci on chromosomes 10and 16. Hum Genet 129:59 –70. CrossRef Medline
Charman T, Pickles A, Simonoff E, Chandler S, Loucas T, Baird G (2011) IQin children with autism spectrum disorders: data from the Special Needsand Autism Project (SNAP). Psychol Med 41:619 – 627. CrossRef Medline
Cohen L, Dehaene S (2004) Specialization within the ventral stream: thecase for the visual word form area. Neuroimage 22:466 – 476. CrossRefMedline
14144 • J. Neurosci., August 28, 2013 • 33(35):14135–14145 Margolis et al. • IQ Discrepancy Scores and Cognitive Abilities

Cohen L, Jobert A, Le Bihan D, Dehaene S (2004) Distinct unimodal andmultimodal regions for word processing in the left temporal cortex. Neu-roimage 23:1256 –1270. CrossRef Medline
Colom R, Thompson PM (2011) Understanding human intelligence byimaging the brain. In: The Wiley-Blackwell handbook of individualdifferences (Chamorro-Premuzic T, von Stumm S, Furnham A, eds),pp 330 –352. Hoboken, NJ: Wiley-Blackwell.
Copet P, Jauregi J, Laurier V, Ehlinger V, Arnaud C, Cobo AM, Molinas C,Tauber M, Thuilleaux D (2010) Cognitive profile in a large French co-hort of adults with Prader-Willi syndrome: differences between geno-types. J Intellect Disabil Res 54:204 –215. CrossRef Medline
Flanagan D, McGrew KS, Ortiz SO (2000) The Wechsler Intelligence Scalesand Gf-Gc theory. Boston: Allyn & Bacon.
Foundas AL, Leonard CM, Gilmore RL, Fennell EB, Heilman KM (1996)Pars triangularis asymmetry and language dominance. Proc Natl Acad SciU S A 93:719 –722. CrossRef Medline
Glascher J, Tranel D, Paul LK, Rudrauf D, Rorden C, Hornaday A, GrabowskiT, Damasio H, Adolphs R (2009) Lesion mapping of cognitive abilitieslinked to intelligence. Neuron 61:681– 691. CrossRef Medline
Goh S, Bansal R, Xu D, Hao X, Liu J, Peterson BS (2011) Neuroanatomicalcorrelates of intellectual ability across the life span. Dev Cogn Neurosci1:305–312. CrossRef Medline
Gray JR, Chabris CF, Braver TS (2003) Neural mechanisms of general fluidintelligence. Nat Neurosci 6:316 –322. CrossRef Medline
Grodzinsky GM, Forbes PW, Bernstein JH (2010) A practice-based ap-proach to group identification in nonverbal learning disorders. ChildNeuropsychol 16:433– 460. CrossRef Medline
Haralick RM, Shapiro LG (1991) Computer and robot vision. Boston:Addison-Wesley.
Jung RE, Haier RJ (2007) The Parieto-Frontal Integration Theory (P-FIT)of intelligence: converging neuroimaging evidence. Behav Brain Sci 30:135–154. CrossRef Medline
Kamphaus RW (2005) Clinical assessment of child and adolescent intelli-gence. New York: Springer.
Karama S, Ad-Dab’bagh Y, Haier RJ, Deary IJ, Lyttelton OC, Lepage C, EvansAC (2009) Positive association between cognitive ability and corticalthickness in a representative US sample of healthy 6 to 18 year-olds.Intelligence 37:145–155. CrossRef Medline
Karama S, Colom R, Johnson W, Deary IJ, Haier R, Waber DP, Lepage C,Ganjavi H, Jung R, Evans AC (2011) Cortical thickness correlates ofspecific cognitive performance accounted for by the general factor ofintelligence in healthy children aged 6 to 18. Neuroimage 55:1443–1453.CrossRef Medline
Kaufman AS, Kaufman NL (1985) Kaufman Brief Intelligence Test. San An-tonio, TX: Pearson.
Kaufman A, Kaufman J, Balgopaland R, McLean JE (1996) Comparison ofthree WISC-III short forms: weighing psychometric, clinical, and practi-cal factors. J Clin Child Psychol 25:97–105. CrossRef
Kaufman J, Birmaher B, Brent D, Rao U, Flynn C, Moreci P, Williamson D,Ryan N (1997) Schedule for Affective Disorders and Schizophrenia forSchool-Age Children-Present and Lifetime Version (K-SADS-PL): initialreliability and validity data. J Am Acad Child Adolesc Psychiatry 36:980 –988. CrossRef Medline
Knecht S, Floel A, Drager B, Breitenstein C, Sommer J, Henningsen H, Rin-gelstein EB, Pascual-Leone A (2002) Degree of language lateralizationdetermines susceptibility to unilateral brain lesions. Nat Neurosci 5:695–699. CrossRef Medline
Lange N, Froimowitz MP, Bigler ED, Lainhart JE (2010) Associations be-tween IQ, total and regional brain volumes, and demography in a largenormative sample of healthy children and adolescents. Dev Neuropsychol35:296 –317. CrossRef Medline
Luders E, Narr KL, Bilder RM, Thompson PM, Szeszko PR, Hamilton L, TogaAW (2007) Positive correlations between corpus callosum thicknessand intelligence. Neuroimage 37:1457–1464. CrossRef Medline
Marr D, Hildreth E (1980) Theory of edge detection. Proc R Soc Lond B BiolSci 207:187–217. CrossRef Medline
Mayes SD, Calhoun SL (2003) Ability profiles in children with autism: in-fluence of age and IQ. Autism 7:65– 80. CrossRef Medline
Mazziotta J, Toga A, Evans A, Fox P, Lancaster J, Zilles K, Woods R, Paus T,Simpson G, Pike B, Holmes C, Collins L, Thompson P, MacDonald D,Iacoboni M, Schormann T, Amunts K, Palomero-Gallagher N, Geyer S,Parsons L, et al. (2001) A probabilistic atlas and reference system for the
human brain: International Consortium for Brain Mapping (ICBM). Phi-los Trans R Soc Lond B Biol Sci 356:1293–1322. CrossRef Medline
Muller-Forell WS (2005) Imaging of orbital and visual pathway pathology.New York: Springer.
Naglieri JA, Bornstein BT (2003) Intelligence and achievement: just howcorrelated are they? J Psychoeduc Assess 21:244 –260. CrossRef
Naglieri JA, Das JP (1997) Cognitive assessment system interpretive hand-book. Rolling Meadows, IL: Riverside Publishing.
Narr KL, Woods RP, Thompson PM, Szeszko P, Robinson D, Dimtcheva T,Gurbani M, Toga AW, Bilder RM (2007) Relationships between IQ andregional cortical gray matter thickness in healthy adults. Cereb Cortex17:2163–2171. CrossRef Medline
Packard MG (2009) Anxiety, cognition, and habit: a multiple memory sys-tems perspective. Brain Res 1293:121–128. CrossRef Medline
Pascual-Leone A, Gomez-Tortosa E, Grafman J, Alway D, Nichelli P, HallettM (1994) Induction of visual extinction by rapid-rate transcranial mag-netic stimulation of parietal lobe. Neurology 44:494 – 498. CrossRefMedline
Pearson JM, Heilbronner SR, Barack DL, Hayden BY, Platt ML (2011) Pos-terior cingulate cortex: adapting behavior to a changing world. TrendsCogn Sci 15:143–151. CrossRef Medline
Plessen KJ, Bansal R, Zhu H, Whiteman R, Amat J, Quackenbush GA, MartinL, Durkin K, Blair C, Royal J, Hugdahl K, Peterson BS (2006) Hip-pocampus and amygdala morphology in attention-deficit/hyperactivitydisorder. Arch Gen Psychiatry 63:795– 807. CrossRef Medline
Ramnani N, Owen AM (2004) Anterior prefrontal cortex: insights intofunction from anatomy and neuroimaging. Nat Rev Neurosci 5:184 –194.CrossRef Medline
Rice ML, Warren SF, Betz SK (2005) Language symptoms of developmentallanguage disorders: an overview of autism, Down syndrome, fragile X,specific language impairment, and Williams syndrome. Appl Psycholin-guist 26:7–27. CrossRef
Rosenfeld A, Pfaltz JL (1968) Distance functions on digital pictures. PatternRecognit 1:33– 61.
Schilling C, Kuhn S, Romanowski A, Schubert F, Kathmann N, Gallinat J(2012) Cortical thickness correlates with impulsiveness in healthy adults.Neuroimage 59:824 – 830. CrossRef Medline
Shattuck DW, Leahy RM (2002) BrainSuite: an automated cortical surfaceidentification tool. Med Image Anal 6:129 –142. CrossRef Medline
Shaw P, Greenstein D, Lerch J, Clasen L, Lenroot R, Gogtay N, Evans A,Rapoport J, Giedd J (2006) Intellectual ability and cortical developmentin children and adolescents. Nature 440:676 – 679. CrossRef Medline
Shrout PE, Fleiss JL (1979) Intraclass correlations: uses in assessing raterreliability. Psychol Bull 86:420 – 428. CrossRef Medline
Sled JG, Zijdenbos AP, Evans AC (1998) A nonparametric method for au-tomatic correction of intensity nonuniformity in MRI data. IEEE TransMed Imaging 17:87–97. CrossRef Medline
Spitzer RL, Williams JB, Gibbon M, First MB (1992) The structured clinicalinterview for DSM-III-R (SCID). I: history, rationale, and description.Arch Gen Psychiatry 49:624 – 629. CrossRef Medline
Vigneau M, Beaucousin V, Herve PY, Jobard G, Petit L, Crivello F, Mellet E,Zago L, Mazoyer B, Tzourio-Mazoyer N (2011) What is right-hemisphere contribution to phonological, lexico-semantic, and sentenceprocessing? Insights from a meta-analysis. Neuroimage 54:577–593.CrossRef Medline
Warrington EK, James M, Maciejewski C (1986) The WAIS as a lateralizingand localizing diagnostic instrument: a study of 656 patients with unilat-eral cerebral lesions. Neuropsychologia 24:223–239. CrossRef Medline
Watkins MW (2006) Orthogonal higher order structure of the WechslerIntelligence Scale for Children—fourth edition. Psychol Assess 18:123–125. CrossRef Medline
Wechsler D (1981) Wechsler adult intelligence scale, revised. San Antonio:The Psychological Corporation.
Wechsler D (1991) Wechsler intelligence scale for children, third edition.San Antonio: The Psychological Corporation.
Wechsler D (1999) Wechsler abbreviated scale of intelligence. San Antonio:The Psychological Corporation.
Wechsler D (2008) Wechsler adult intelligence scale, fourth edition: techni-cal manual. San Antonio: The Pscyhological Corporation.
Witelson SF, Beresh H, Kigar DL (2006) Intelligence and brain size in 100postmortem brains: sex, lateralization and age factors. Brain 129:386 –398. CrossRef Medline
Margolis et al. • IQ Discrepancy Scores and Cognitive Abilities J. Neurosci., August 28, 2013 • 33(35):14135–14145 • 14145