brazilian agribusiness at a glance - embrapa labex korea
TRANSCRIPT


© 2010 by Ministry of Agriculture, Livestock and Food Supply.All rights reserved. It is authorized the partial or total reproduction of this material, on condition that the source is identified,without sale purpose or any commercial end.The copyright responsibility of the texts and images of this work belongs to the author.
First edition - comprehensive: 2010Printed: 10.000 issues
Information, production, distribution:Ministry of Agriculture, Livestock and Food SupplySecretariat of Agribusiness International RelationsDepartment of Agribusiness International Promotion
Esplanada dos Ministérios, Bloco D, 3º andar, sala 300CE P: 70043-900, Brasília – DFPhones: + 55 61 3218-2510 / 3225-4497Fax: + 55 61 [email protected]
Technical Elaboration:Eduardo Sampaio MarquesMaurício Pinheiro Fleury CuradoTelma Cristina Ikeda GondoFabrício Bentes Simões
Editorial Coordination: Department of Social Communication
Printed in Brazil
Catalogação na FonteBiblioteca Nacional de Agricultura – BINAGRI
Brazil. Ministry of Agriculture, Livestock and Food Supply.Brazil and agribusiness : at a glance / Ministry of Agriculture, Livestock and Food Supply. Secretariat of Agribusiness International Relations. – 1st ed. comprehensive. – Brasília : Mapa/ACS, 2010.
67 p. : il.
ISBN 978-85-7991-034-0
1. Agribusiness - Brazil. 2. Exportation. I. Secretariat of Agribusiness International Relations. II. Title.
AGRIS E70CDU 339.56

Ministry of agriculture, livestock and food supplysecretariat of agribusiness international relations
Missionto promote the sustainable
development and the agribusinesscompetitiveness in benefit of the
Brazilian society.
Brazilian agribusiness at a glance
BraZil - Brasilia 2010

Brazil is a strategic partner when it comes to agribusiness products supply. At the same time, Brazilian agricultural commodities are recognized for their intrinsic technology and competitiveness. There are, still, some boundaries to surpass and opportunities to show, information and interest being vital for so.
In a time when natural resources, food security and renewable energy are being largely debated, this publication aims at providing brief information on Brazilian agricultural products, the country’s capacity to produce and supply and, furthermore, its care in using sustainable procedures, in order to guarantee food, work and resources for our future generations.
The content of this material came from several lectures given by authorities and technicians of this Ministry in different places and occasions. Due to the high demand of hardcopies after each presentation, we consider that the information can be relevant to your acquaintance.
We hope this information can be useful as a way of making you interested in getting to know more about Brazil and its agricultural production.
Should you need further information, please contact us at: [email protected].
We will be delighted in hearing from you.
Wagner RossiMinister of Agriculture, Livestock and Food Supply

Summary
COuNTry OVErVIEW ...........................................................................6
GLOBaL DyNamICS ............................................................................10
TOP PrODuCTS HIGHLIGHTS ...............................................................18
Grain .................................................................................................21
meat..................................................................................................33
Sugarcane ..........................................................................................38
Coffee ...............................................................................................45
milk ...................................................................................................48
Fruits ..................................................................................................50
SuSTaINaBILITy: aGrICuLTurE & ENVIrONmENT ...................................54
FOrEIGN INVESTmENT OPPOrTuNITIES ................................................60

COuNTry OVErVIEW

7
COUNTRY OVERVIEW
• Area: 8,514,000 km² (5th largest)• Population: 191.3 million (5th biggest population)• GDP: US$ 1.6 trillion (8th biggest economy)• Per capita income: US$ 8 thousand• 2009 exports: US$159 billion• 2009 imports: US$136 billion
Brazil’s Profi le

BRAZ
ILIAN
AGRIB
USIN
ESS
AT A
GLAN
CE
8
AMAZON
49.3%CAATINGA
9.9%
CERRADO
23.9%PANTANAL
1,7%
PAMPA
2.0%
ATLANTICFOREST
13,0%
BraZILIaN TErrITOry
BraZILIaN BIOmES
Amazon Biome 420
Crops 77
Pastures 173
Planted Forests 6
Brazil 851
sources: Ministry of agriculture; Ministry of environment - 2006
Brazil’s continental dimensions gather different biomes (*), protected by national legistation.
agriculture and livestock areas make up around 30% of Brazil’s territory, mainly concentrated in the southern and central regions of the country.
(*) any of several major life zones of interrelated plants and animals determined by the climate.
In million ha

9
COUNTRY OVERVIEWagricultural production started primarily in the southern region and, later on, expanded to other areas towards the middle-west of the country.
High levels of productivity as a result of investments in tropical technology allow coexistence of expansion of food and energy production, along with environmental protection.
1970
1980
1990
1960
aGrIBuSINESS EXPaNSION

GLOBaL DyNamICS

11
GLOBAL DYNAMICS
Main Products Production ExportsNumber of
Markets
Exports
US$ Billion
Sugar 1st 1st 124 8.378
Coffee 1st 1st 81 3.762
Orange Juice 1st 1st 75 1.619
Soybean 2nd 2nd 46 11.413
Beef 2nd 1st 142 4.118
Tobacco 2nd 1st 100 2.992
Ethanol 2nd 1st 48 1.338
Broiler 3rd 1st 146 5.307
Corn 4th 3rd 49 1.259
Pork 4th 4th 81 1.225
sources: usda, Ministry of agriculture
2009 ranking: Brazilian Production and Exports
Brazil plays a leading role as a global supplier of agribusiness products, exporting for more than 180 markets.
Diversifi ed product range ensures food security for the world.

BRAZ
ILIAN
AGRIB
USIN
ESS
AT A
GLAN
CE
12
Total: uS$ 64.8 billion
Brazilian agribusiness Exports main Products
source: Ministry of development, industry and foreign trade – 2009 elaboration: Ministry of agriculture
Brazil exports a great deal of agricultural products, including traditional goods, such as coffee and sugar, besides recently introduced ones, such as corn and ethanol.
Soybean & Products26.6%
Meat18.2%
Sugar & Ethanol15.0%
Coffee6.6%
Tobacco & Products4.6%
Orange Juice2.5%
Corn1.9%
Leather1.8%
Others22.7%

13
GLOBAL DYNAMICS
Total: uS$ 64.8 billion
Brazilian agribusiness Exports main Destinations
source: Ministry of development, industry and foreign trade – 2009 elaboration: Ministry of agriculture
Brazil’s diversifi ed product portfolio enables strategic partnerships around the world.
Besides the capacity to assure food security, Brazilian agribusiness has recently been seen as an opportunity for foreign investment.
EU-2729.3%
China13.8%
USA7.0%
Russia4.3%
India2.8%
Japan2.8%
Hong Kong2.6%
Venezuela2.4%
Saudi Arabia2.3%
South Korea2.0%
Others30.6%
BRAZ
ILIAN
AGRIB
USIN
ESS
AT A
GLAN
CE
14
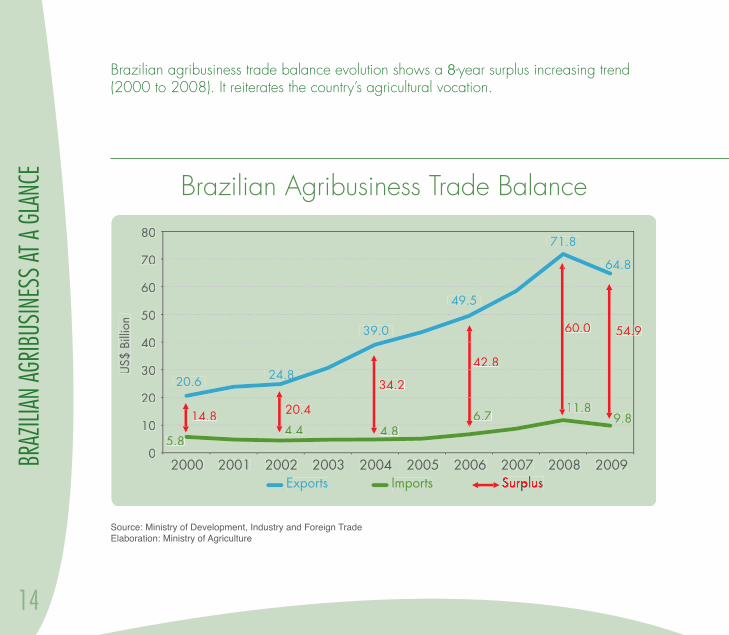
source: Ministry of development, industry and foreign tradeelaboration: Ministry of agriculture
Brazilian agribusiness Trade Balance
20.6 24.8
39.0
49.5
71.8
64.8
4.4
11.8 9.8
0
10
20
30
40
50
60
70
80
2000 2001 2002 2003 2004 2005 2006 2007 2008 2009
20.4
US$
Bill
ion
5.8 5.8 4.8
6.7
Exports Imports Surplus Surplus Surplus
54.9 54.9 60.0
42.8
34.2
14.8
Brazilian agribusiness trade balance evolution shows a 8-year surplus increasing trend (2000 to 2008). It reiterates the country’s agricultural vocation.

15
GLOBAL DYNAMICS
source: Ministry of development, industry and foreign trade elaboration: Ministry of agriculture
Brazilian Trade Balance
The positive results of the Brazilian trade balance rely on agriculture. Solid institutional framework and resilient economy mitigate risk of agribusiness commodities exports setback.
25.5
-29.3
1980 1982 1984 1986 1988 1990 19941992 1996 1998 2000 2002 2004 2006 2008
54.8
0-10
-30-20
-50-40
10203040506070
US$
Bill
ion
-29.3
TOTAL
AGRIBUSINESS
OTHERS

BRAZ
ILIAN
AGRIB
USIN
ESS
AT A
GLAN
CE
16
Domestic Consumption and Exports
Domestic Consumption Exports
0% 10% 20% 30% 40% 50% 60% 70% 80% 90% 100%0% 10% 20% 30% 40% 50% 60% 70% 80% 90% 100%
Ethanol
Sugar
Coffee
Beef
Broiler
Soybean
Corn
Cotton
sources: Ministry of agriculture, Brazilian institute of geography and statistics - 2009
roughly 70% of the Brazilian agricultural production aims the national market. Domestic demand ensures critical mass for market predictability, enabling expansion planning.


TOP PrODuCTS HIGHLIGHTS

19
TOP PRODUCTS HIGHLIGHTS
Total: uS$ 170 billion
major agricultural Products in Brazil Production – Gross Value
Beef21%
Soybean16%
Sugarcane10%Corn
7%
Milk7%
Broiler6%
Coffee5%
Rice4%
Beans3%
Others21%
source: Brazilian confederation of agriculture and livestock – June 2009
Brazilian agricultural production has been reaching successive records in gross value. Worldwide leading products such as beef, soybean, sugar, broiler and coffee account for the majority of the production value.

BRAZ
ILIAN
AGRIB
USIN
ESS
AT A
GLAN
CE
20
agriculture area2007/2008 Harvest
0
20
40
60
80
100
120
140
160
180
200
2.3 7.0 14.3 21.6
172.3
Coffee SugarcaneCorn
SoybeanPasture
Mill
ion
ha
0
20
40
60
80
100
120
140
160
180
200200
2.32.3 7.07.0 14.314.3 21.621.621.6
172.3172.3
Coffee SugarcaneCorn
SoybeanPasture
Mill
ion
ha
sources: Ministry of agriculture, Brazilian institute of geography and statistics (pasture – 2006)
Pasture lands occupy nearly 70% of the total area dedicated to agricultural production.
Pasture productivity is still low – 1 head per hectare. Improvements on cattle raising enable agriculture growth over these areas.

Grain

BRAZ
ILIAN
AGRIB
USIN
ESS
AT A
GLAN
CE
22
Grain - Production and area
Harvested Area Growth: 27% = 1.3% / year
Growth: 145% = 4.8% / year
Prod
uctio
n M
illio
n to
ns/M
illio
n ha
57.9 68.3
81.1 78.4 82.4
100.3
123.2 122.5
114.7
131.7 135.2
143.7 141.6
37.9
19910
20
40
60
80
100
120
140
160
1992 1993 1994 1995 1996 1997 1998 1999 2000 2001 2002 2003 2004 2005 2006 2007 2008 2009 2010(E)
35.6 38.5 36.6 36.9 37.843.9 49.1 46.2 47.7 48.1
Growth: 27% = 1.3% / year
Harvested Area Production
source: national company of food supply
Increase in grain production over the last 20 years has been a result of high levels of productivity. Grain volume has increased by 2.5 in the period, while the harvested area has grown less than 30%. Productivity in the area, therefore, doubled.

23
TOP PRODUCTS HIGHLIGHTS
Product Area
(1,000 ha)% of Total Grain Area
1,000 Tons
Soybean 21,743 42% 57,166
Corn 14,171 38% 51,004
Bean 4,147 3% 3,491
Rice 2,909 9% 12,602
Wheat 2,396 4% 5,884
Cotton 843 2% 1,891
source: national company of food supply - 2009
main Grains
Grain crops’ increasing productivity allows supply of domestic market while Brazil stands out as a big exporter of soybean, corn and cotton.

BRAZ
ILIAN
AGRIB
USIN
ESS
AT A
GLAN
CE
24
Grain Productivity Evolution Index
source: national company of food supply
Grain productivity has been increasing in Brazil over the years, as a result of technology use and best practices dissemination.
0
50
100
150
200
250
300
350
400
1990
/91
1991
/92
1992
/93
1993
/94
1994
/95
1995
/96
1996
/97
1997
/98
1998
/99
1999
/00
2000
/01
2001
/02
2002
/03
2003
/04
2004
/05
2005
/06
2006
/07
2007
/08
2008
/09
2009
/10(
E)
Cotton Rice Bean Soybean Corn
Inde
x


BRAZ
ILIAN
AGRIB
USIN
ESS
AT A
GLAN
CE
26
In 2008/2009 harvest, Brazilian cotton producers reached the highest productivity in the world, making a high-quality, competitive product that stands out from the top 5 global producers. That was a cornerstone to recover its leading position in this market.
Cotton Productivity
0
150
300
450
600
750
900
1050
1200
1350
1500
Kg/ha
758
14431310
911
523
WorldBrazil
ChinaUSA
Indiasource: usda - 2008/09elaboration: Ministry of agriculture

27
TOP PRODUCTS HIGHLIGHTS
Soybean – Production and area
Mill
ion
tons
/Mill
ion
ha
10
-
20
30
40
50
60
70
80
1991
/92
1993
/94
1992
/93
1994
/95
1995
/96
1996
/97
1997
/98
1998
/99
1999
/2000
2000
/01
2001
/02
2002
/03
2003
/04
2004
/05
2005
/06
2006
/07
2007
/08
2008
/09
2009
/10(E)
Harvested Area Production
source: national company of food supply
Soybean is the major agricultural crop in Brazil. Its production increase has been a result of high levels of productivity. Over the last 20 years, soybean volume has increased by 3.5, fi lling up domestic consumption and enabling Brazil’s leverage to second biggest world exporter position.

BRAZ
ILIAN
AGRIB
USIN
ESS
AT A
GLAN
CE
28
Total: uS$ 17.2 billion
Soybean Exports – Grain, meal and Oilmain Destinations
EU-2739.9%
China39.2%
Iran5.1%
Thailand4.3%
Japan1.5%
India1.6%
Taiwan1.3%
Others9.5%
although China and the European union were the destinations for 79% of soybean and its products’ exports in 2009, dozens of other markets also imported from Brazil, since these products compound both animal and human diets.
source: Ministry of development, industry and foreign trade – 2009 elaboration: Ministry of agriculture

29
TOP PRODUCTS HIGHLIGHTSSince 2006, private representatives of the soybean segment declared “moratorium“ to the soybean produced in the amazon Biome - a comprehensive commitment prohibiting to buy or sell the product of such region. Satellite monitoring controls the origin of the product and ensures the rain Forest protection.
sources: Ministry of agriculture, Brazilian institute of geography and statistics
AMAZON BIOME
Since the “moratorium”, soybean area
decreased to 0.27% of the Amazon Biome.
“Soybean is no longer an issue for the Amazon Biome deforestation”.
Minister of Environment of Brazil

BRAZ
ILIAN
AGRIB
USIN
ESS
AT A
GLAN
CE
30
0%
5%
10%
15%
20%
25%
30%
35%
40%
45%
-
10
20
30
40
50
60
Mill
ion
tons
1991
/92
1990
/91
1993
/94
1992
/93
1994
/95
1995
/96
1996
/97
1997
/98
1998
/99
1999
/2000
2000
/01
2001
/02
2002
/03
2003
/04
2004
/05
2005
/06
2006
/07
2007
/08
2008
/09
2009
/10(E)
2nd harvest share of total productionMain harvest2nd harvest
Corn – Double Cropping
The increasing production of corn from double cropping, planted after the soybean summer crop, reduces fi xed costs, boosts the growth of the meat industry in Brazil and, at the same time, allows Brazil to become a relevant exporter in these segments.
source: national company of food supply

31
TOP PRODUCTS HIGHLIGHTS
Scale, mechanization. Two crops in the same year without irrigation.
Double CroppingCorn after Soybean
Sowing corn(2nd harvest)
Harvestingsoybean
No tillage(environmentally friendly)

BRAZ
ILIAN
AGRIB
USIN
ESS
AT A
GLAN
CE
32
Total: uS$ 1.3 billion
source: Ministry of development, industry and foreign trade – 2009 elaboration: Ministry of agriculture
Iran22.5%
Malaysia10.3%
Colombia10.1%
Taiwan9.6%
South Korea7.9%
Saudi Arabia7.8%
Morocco5.4%
EU-274.0%
Others22.4%
Corn Exportsmain Destinations

meat

BRAZ
ILIAN
AGRIB
USIN
ESS
AT A
GLAN
CE
34
The combined expansion of the meat production and industrialization in Brazil leveraged the country to the #1 position in exports worldwide, while keeping up with the domestic market, which presents a high and growing per capita consumption (more than 80kg/inhabitant/year).
meat Production Evolution
sources: aBiec, aBef, uBa, aBipecselaboration: Ministry of agriculture
0
2
4
6
8
10
12
1994 1995 1996 1997 1998 1999 2000 2001 2002 2003 2004 2005 2006 2007 2008 2009
Beef Broiler Pork
Mill
ion
tons Beef: +83% (1994-09)
Broiler: +216% (1994-09)
Pork: + 140% (1994-09)

35
TOP PRODUCTS HIGHLIGHTS
Beef* Exportsmain Destinations
Total: uS$ 3.0 billion
Brazil is the worldwide leading supplier of both beef and Halal beef. Brazilian beef is recognized as the “green beef”, once cattle is raised free, in vast pastures. Vegetal feeding avoids harmful illnesses to human beings, such as the mad Cow Disease.
Russia30.1%
Iran11.1%
Hong Kong10.5%
EU-279.8%
Egypt6.6%
Venezuela5.5%
Algeria4.7%
Others21.7%
* In naturasource: Ministry of development, industry and foreign trade – 2009 elaboration: Ministry of agriculture

BRAZ
ILIAN
AGRIB
USIN
ESS
AT A
GLAN
CE
36
Broiler* Exportsmain Destinations
Saudi Arabia15.4%
Japan12.8%
Hong Kong12.2%
UAE6.5%EU-27
6.5%Venezuela
6.0%
Kuwait5.6%
Iraq4.0%
Others30.9%
Total: uS$ 4.8 billion
Brazilian chicken is present in the meals of consumers of most markets in the world. The integration of the productive chain, from egg to tailored cuts, make the Brazilian chicken products competitive and adaptable to each and every market niche. Brazil is the biggest world exporter of both broiler and Halal broiler.
* In naturasource: Ministry of development, industry and foreign trade – 2009 elaboration: Ministry of agriculture

37
TOP PRODUCTS HIGHLIGHTS
Russia50.6%
Hong Kong14.5%
Ukraine9.5%
Singapore6.3%
Argentina4.5%
Angola3.8%
Other10.8%
Total: uS$ 1.1 billion
Pork* Exportsmain Destinations
The Brazilian integrated pork productive system results in high quality goods, according to the world’s most rigid standards.
* In naturasource: Ministry of development, industry and foreign trade – 2009 elaborated by Mynistry of agriculture

Sugarcane

39
TOP PRODUCTS HIGHLIGHTS
Sugar and Ethanol: Production and area
Sugarcane can be transformed in sugar and ethanol, besides other sub-products, such as fertilizer and electricity (from bagasse). In Brazil, production of food, fuel and energy can increase substantially, coexisting with all other food crops and environmental preservation.
sources: Ministry of agriculture, national company of food supply
35 20
18
16
14
10
8
12
6
4
2
0
30
25
20
15
10
11.5
7.4
31.3
27.6
5
1991
/92
1992
/93
1993
/94
1994
/95
1995
/96
1996
/97
1997
/98
1998
/99
1999
/00
2000
/01
2001
/02
2002
/03
2003
/04
2004
/05
2005
/06
2006
/07
2007
/08
2008
/09
0
Prod
uctio
n
Harvested area (m
illion ha)
Ethanol (million m3)Sugar (million tons)Harvested area
SugarGrowth 2002-09: 93.2% (8.6% p.y.)
EthanolGrowth 2002-09: 142.4% (11.7% p.y.)
Harvested AreaGrowth 2002-09: 44.5% (5.4% p.y.) 4.3
8.9

BRAZ
ILIAN
AGRIB
USIN
ESS
AT A
GLAN
CE
40
Total: uS$ 8.3 billion
Sugar Exportsmain Destinations
India17.5%
Russia10.4%
UAE7.1%
Nigeria4.9%
Bangladesh4.8%Algeria
4.0%Saudi Arabia4.0%
Canada3.6%
Others43.7%
Brazil is the #1 exporter of sugar, accounting for almost half of the world’s market.
source: Ministry of development, industry and foreign trade – 2009 elaboration: Ministry of agriculture

41
TOP PRODUCTS HIGHLIGHTSBrazil leads the exports of ethanol, although 90% of its production is consumed domestically. The use of ethanol as fuel reduces the emission of pollutants.
source: Ministry of development, industry and foreign trade – 2009 elaboration: Ministry of agriculture
Ethanol Exports main Destinations
EU-2728.7%
Jamaica11.4%
South Korea10.4%
USA10.1%
India9.4%
Japan8.1%
Others21.9%
Total: uS$ 1.3 billion

BRAZ
ILIAN
AGRIB
USIN
ESS
AT A
GLAN
CE
42
Energy mix
almost half of the sources of the Brazilian energy matrix are renewable, sugarcane being the second most important one.
source: Ministry of energy and Mining – 2009elaboration: Ministry of agriculture
Oil and Oil Products
38%
Oil and Oil Products
35%
Sugarcane18%
Biomass14%
Hydraulic and Electricity
15%
Natural Gas9%
Coal5%
Uranium1%
Oil and Oil oducts
Oil and Oil Products
35%
Coal24%
Natural Gas21%
Hydraulic and Electricity2%
Uranium6%
Biomass11%
Share of renewable energy in the total primary energy: 47%
WorldBrazil

43
TOP PRODUCTS HIGHLIGHTS
Flex-fuel Cars – Evolution
0
50
1.0
1.5
2.0
2.5
3.0
3.5
0
50
1.0
1.5
2.0
2.5
3.0
3.5
2004 20052006
20072008
2009
GASOLINE
FLEX FUEL
ETHANOL
DIESEL3.193.222.98
2.612.532.31
Mill
ion
units
source: anfaveaelaboration: Ministry of agriculture
Flex-fuel technology allows the use of gasoline, ethanol or its mixture at any proportion. Currently, more than 10 million cars in Brazil have fl ex-fuel engines. Ethanol is also being used as fuel for Formula Indy competition cars, as well as trucks and airplanes.


Cof fee

BRAZ
ILIAN
AGRIB
USIN
ESS
AT A
GLAN
CE
46
4.0
39.1
2.1
3.4
50
Million ha
Mill
ion
sack
s
45
40
35
25
20
15
10
5
0
1990
/91
1991
/92
1992
/93
1993
/94
1994
/95
1995
/96
1996
/97
1997
/98
1998
/99
1999
/00
2000
/01
2001
/02
2002
/03
2003
/04
2004
/05
2005
/06
2006
/07
2007
/08
2008
/09
2009
/10(E
)
30
3.5
3.0
2.5
2.0
1.5
1.0
0.5
0.0
31.0
Area Production
Coffee: Production and area
Brazil is the world’s leading exporter of coffee. Over the last 20 years, investment on technology has increased production by 26%, while area has decreased by 38%.
sources: usda , embrapa and national food supply company (as of 1996)elaboration: Ministry of agriculture

47
TOP PRODUCTS HIGHLIGHTS
Total: uS$ 3.7 billion
Coffee Exportsmain Destinations
EU-2757.1%
USA19.2%
Japan7.7%
Canada1.6%
Argentina1.5%
Syria1.4%
Others11.5%
Brazil exports mainly arabic coffee. Europe is its main market. yet, under different brands and presentations, the Brazilian coffee can be savored by consumers all over the world.
source: Ministry of development, industry and foreign trade – 2009 elaboration: Ministry of agriculture

milk

49
TOP PRODUCTS HIGHLIGHTS
Mill
ion
tons
+ 99 % (1990-08)
1991
30
25
20
15
10
5
01990 1992 1993 1994 1995 1996 1997 1998 1999 2000 2001 2002 2003 2004 2005 2006 2007 2008
milk Production
source: Milk national forum – Brazilian confederation of agriculture and livestock
The increasing milk production in Brazil made the country self-suffi cient and exporter of dairy products.

Frui ts

51
TOP PRODUCTS HIGHLIGHTS
FruitsBrazil’s Production and ranking in the World
0
2
4
6
8
10
12
14
16
18
201st
1st
4th
4th
15th7th 11th 3rd
Mill
ion
tons
OrangeBanana Coconut Papaya Grape
AppleMangoTagerine
0
2
4
6
8
10
12
14
16
18
201st
1st
4th
4th
15th7th 11th 3rd
OrangeBanana Coconut Papaya Grape
AppleMangoTagerine
Brazilian climate diversity allows the production of several types of fruits in distinctive regions of the country. It is also possible to produce in different seasons of the year.
source: iBraf - 2009elaboration: Ministry of agriculture

BRAZ
ILIAN
AGRIB
USIN
ESS
AT A
GLAN
CE
52
PAPAYA
PEAR
GRAPE
PAPAYA
AVOCADO
PINEAPPLE
BANANA
PERSIMMON
CASHEW NUTS
COCONUT
CUPUAÇU
FIGS
STONE FRUITS
GUAVA
KIWI
ORANGE AND TANGERINE
LIME
APPLE
MANGO
PASSION FRUIT
MELLON AND WATERMERLON
BLUEBERRY
STRAWBERRY
AÇAI
Fruits – Production map


SuSTaINaBILITy aGrICuLTurE & ENVIrONmENT

55
SUSTAINABILITY AGRICULTURE & ENVIRONMENTBrazil is a big exporter of wood, wood products and celulosis. It has leadership in the hardwood pulp market.
Wood and paper industries in Brazil are based on planted forests.
source: aBrafelaboration: Ministry of agriculture
(Mill
ion
ha)
5.0
6.3
0
1
2
3
4
5
6
7
8
9
10
2004 2005 2006 2007 2008 2009
Forestry Planted area

BRAZ
ILIAN
AGRIB
USIN
ESS
AT A
GLAN
CE
56
• Brazil has the largest extension of arable lands of the world;
• Brazil contains the greatest diversity of ecosystems and unique biodiversity;
• Brazilian legislation protects preserved areas of all biomes.
Legal restrictions to Land utilization
Region Legal ReserveLand Available for
economical use
Amazon Forest 80% 20%
Savannas neighboring Amazon 35% 65%
Other areas 20% 80%
Moreover, it is mandatory to preserve river banks, areas around lagoons, lakes or water reservoirs, peaks, among others.

amazon rain Forest Our Greatest Treasure

BRAZ
ILIAN
AGRIB
USIN
ESS
AT A
GLAN
CE
58
No tillage system is a way of growing crops without disturbing the soil through ploughing. It has increased fast in Brazil and is largely used in grain production.
• reduces labor and machinery requirements
• saves fuel
• reduces soil erosion
• improves water retention and quality
• reduces release of carbon gases
• long - term productivity improvements
GrainPlanted area
No Tillage Systemmain advantages
No tillage69%
Conventional31%
source: national company of food supply – 2008/09
59
SUSTAINABILITY AGRICULTURE & ENVIRONMENT
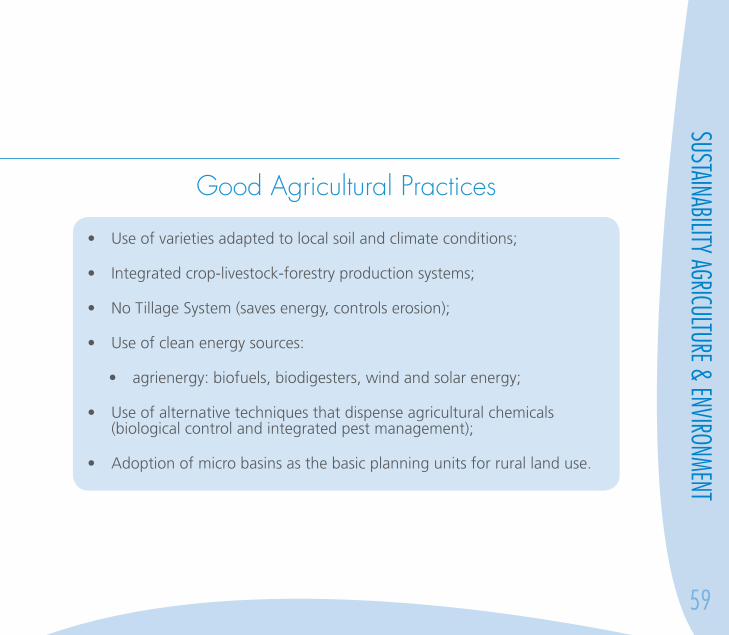
Good agricultural Practices
• Use of varieties adapted to local soil and climate conditions;
• Integrated crop-livestock-forestry production systems;
• No Tillage System (saves energy, controls erosion);
• Use of clean energy sources:
• agrienergy: biofuels, biodigesters, wind and solar energy;
• Use of alternative techniques that dispense agricultural chemicals (biological control and integrated pest management);
• Adoption of micro basins as the basic planning units for rural land use.

FOrEIGN INVESTmENT OPPOrTuNITIES

61
FOREIGN INVESTMENT OPPORTUNITIES
Global Trends
World population growth with increasing per capita income
Increasing demand for higher-quality, better, protein-intensive food (i.e.meat)
Continuous need of food production increase
Shortage of new lands for agricultural production
Challenges to food security

BRAZ
ILIAN
AGRIB
USIN
ESS
AT A
GLAN
CE
62
Brazilian agribusinessCompetitive advantages
• Strong, thriving economy & institutional framework;
• Leadership in tropical technology;
• Abundance of natural resources (land, water, solar energy);
• Farming vocation combined with business entrepreneurship.

63
FOREIGN INVESTMENT OPPORTUNITIES
Producer Support Estimate(Public Support to Farmers)
OECD shows that Brazilian governmental subsidies to farmers are among the smallests vis-a-vis other countries. Brazil’s competitiveness in the international arena is due to a combination of the country’s natural resources, investments on r&D and private entrepreneurship initiatives.
source: organization for economic cooperation and development
1%5% 6%
9%14%12%14%
21%26%
30%
50%
NewZeland Brazil
MexicoRussia
OECDJapan
AustraliaChina
USACanada
EU

BRAZ
ILIAN
AGRIB
USIN
ESS
AT A
GLAN
CE
64
Strong, Thriving Economy &Institutional Framework
New social and economic paradigms, with:
• Social inclusion and income distribution;
• Upgrowth of the middle class, ensuring solid and diversifi ed domestic demand;
• Investment enhancement;
• Stable, consolidated democracy, legal and institutional framework;
• Infrastructure long-term investment program with strategic actions;
• Sustainable growth based on macroeconomic prudential policies;
• Infl ation under control (effi cient infl ation target regime);
• Robust fi scal rules (primary surplus & continuous reduction of public defi cit);
• Low external vulnerability.

65
FOREIGN INVESTMENT OPPORTUNITIES
Source: Exame Infrastructure Yearbood 2009-2010Produced by: Ministry of Finance
7.5
5.2
2.5
1.2
2.2
0.5
Investment in US$ billion
Santo AntônioHydroeletric
Power Plant (PPP)*
New Trans-NortheasternRailway (PPP)
São Francisco RiverInterchange
(Public)
Port of Açu(Private) Oil
Platforms (PPP)
Angra 3Nuclear Power Plant (PPP)Comperj (PPP)
Port of Santos(PPP)
Metropolitan São PauloRodoanel
(South Portion)(Public)São Paulo
Subway (PPP)
BR 101 Highway(Northeast andSouth Portions)
(Public)
North-SouthRailway
(South Portion)
North-SouthRailway
(North Portion)(PPP)
To be concluded in 2010Estimated conclusion in the coming yearsPPP = Public-Private Partnership*Includes public-private partnerships and concessions
East-WestRailway
Cacimbas-CatuGas Pipeline
(PPP)
TucuruiLock
(Public)Belo MonteHydroeletricPower Plant
Jirau HydroeletricPower Plant (PPP)*
Bullet Train12.8
2.8
3.6 20.0
10.7 4.7
2.9
1.1
7.0
3.4
10.6
1.7
2.0
accelerated Growth ProgrammeInfrastructure to Come

BRAZ
ILIAN
AGRIB
USIN
ESS
AT A
GLAN
CE
66
Leadership in Tropical Technology
• Continuous & persistent public and private investments on R&D;
• Opened partnerships with other countries;
• Expressive results on productivity;
• Effi cient use of natural resources.

67
FOREIGN INVESTMENT OPPORTUNITIES
Foreign Investment in agribusiness
The agribusiness productive chains offer several possibilities for foreign investors:
• Direct Investment on Projects (Transportation, Storage, Harbourage);
• Contract Farming (Payment in Products );
• Capital Markets (Stocks, Investment Funds );
• Partnerships and Joint Ventures.
Production
Machinery and Equipments
Infrastructure
Logistics
Food Processing
Distribution

