chapter 4 project evaluation - city of laredo
TRANSCRIPT
Chapter 4 Project Evaluation
Wilbur Smith Associates 4-1
Preparation of a Metropolitan Transportation Plan for the Laredo MPO area requires a detailed understanding of the study area’s growth potential and traffic flow characteristics. Based on community objectives and future transportation needs, an evaluation is needed to analyze alternative transportation networks. In addition to traffic service, factors such as maximum utilization of the existing transportation system, community acceptance, and conformance with community goals were all considered in evaluating transportation plan alternatives.
PROJECT SELECTION CRITERIA Project selection criteria was developed by the MPO and used to assist in determining the short term, long-range and unfunded needs sections of the plan for state-sponsored projects. Local projects for the City of Laredo and Webb County were also reviewed.
The MPO Technical Advisory Committee reviewed and modified the project selection criteria at its regular meeting in September 2004. The MPO Policy Committee formally approved the project selection criteria on September 9, 2004. The project selection criteria include the following six categories:
1. Demonstrated Need – Does the project documentation clearly demonstrate existing or future need for this project? Does the project significantly improve LOS along the facility or adjacent facilities?
Demonstrated Need is evaluated based on an improvement in Level-of-Service (LOS) on existing or parallel facility.
Current Congestion (existing or parallel facility) Criteria Points LOS A 0 LOS B 25 LOS C 50 LOS D 75 LOS E/F 100 Future Congestion (existing or parallel facility) Criteria Points LOS A 0 LOS B 25 LOS C 50 LOS D 75 LOS E/F 100
2. Cost Reasonableness - Does the proposed cost for the project seem reasonable when
compared to comparable projects undertaken in the City, County or Region? Are the cost estimates in line with TxDOT or County estimates for similar projects?
Chapter 4 Project Evaluation
Wilbur Smith Associates 4-2
Cost Reasonableness is evaluated using the cost of project divided by the future VMT multiplied by the project length (Cost per Vehicle Mile). For new construction the 2030 VMT will be used.
Criteria Points $0-$75 75 $75-$125 50 $125-$500 25 >$500 0
3. Modal Impacts - Does this project help or assist bicycle mobility? Does the project
improve accessibility or safety for bicyclists? Does this project improve mobility or access for pedestrians? Is pedestrian safety enhanced with this project? Does this project assist with transit access?
Modal Impacts are evaluated by assigning points to projects that provide bicycle, pedestrian, transit, airport, and/or rail access.
Criteria Points Bicycle Access 20 Sidewalks 20 Transit Access 20 Airport Access 20 Rail Access 20
4. Environmental/Socioeconomic Impacts - Does this project impact the community’s
environment positively, or is there the potential for negative environmental impacts? Does the project have community support, and is it a priority for the community?
Environmental/Socioeconomic Impacts are evaluated by assigning points to projects based on the need for wetland mitigation and/or acquisition of additional Right-of-way.
Criteria Points Negative -10 Positive 10 Public Acceptance 20 ROW Cost as a Percent of Total Implementation Cost: Criteria Points 0% of total cost 25 1-25% of total cost 20 26-50% of total cost 15 51-75% of total cost 10 76-100% of total cost 0
Chapter 4 Project Evaluation
Wilbur Smith Associates 4-3
5. Project Readiness - Is this project likely to be implemented within this 3-year TIP period? Has sufficient engineering work occurred on this project to ensure timely implementation? Has the right-of-way for the project been secured?
Project Readiness is evaluated by assigning points to projects based on the likelihood of implementation and on what stage the project is at in the planning and development process.
Criteria Points ROW Purchased 10 PE Completed 10 Plans Completed 10
6. Special Circumstances – Additional factors considered important to the project which include safety, economic impacts, and system continuity and connectivity. Safety - Will implementation of the project improve safety for vehicles, bicyclists or pedestrians? Will accidents be reduced with this project? Does this project reduce the likelihood of accidents or remove unsafe driving/biking/walking conditions? Economic Impacts – Does the project support economic development and international trade in the community? System Continuity and Connectivity - Does the project provide for connecting sections of an existing or planned street that are presently discontinuous?
Special Circumstances are evaluated by assigning points for safety, economic
impacts, and system continuity and connectivity.
Criteria Points Safety 30 Economic Impacts 15 System Continuity 15
Each of these criteria, as well as the results of the analysis, are discussed in the following sections. TRANSPORTATION IMPROVEMENT NEEDS The first step in identifying projects to be included in the MTP is projecting traffic demands and needs. Using TxDOT’s travel demand model for the Laredo MPO Boundary, projected capacity deficiencies were identified along the existing roadway system. Projected future deficiencies were determined by conducting a capacity/level-of-service analysis of the roadway system. Roadway capacity is defined as the maximum number of vehicles that can be accommodated on a roadway facility during a particular time period under prevailing roadway, traffic, and control conditions. Roadway capacity is determined by several contributing factors, including the functional class of the roadway, type and intensity of adjacent development, and the number of
Chapter 4 Project Evaluation
Wilbur Smith Associates 4-4
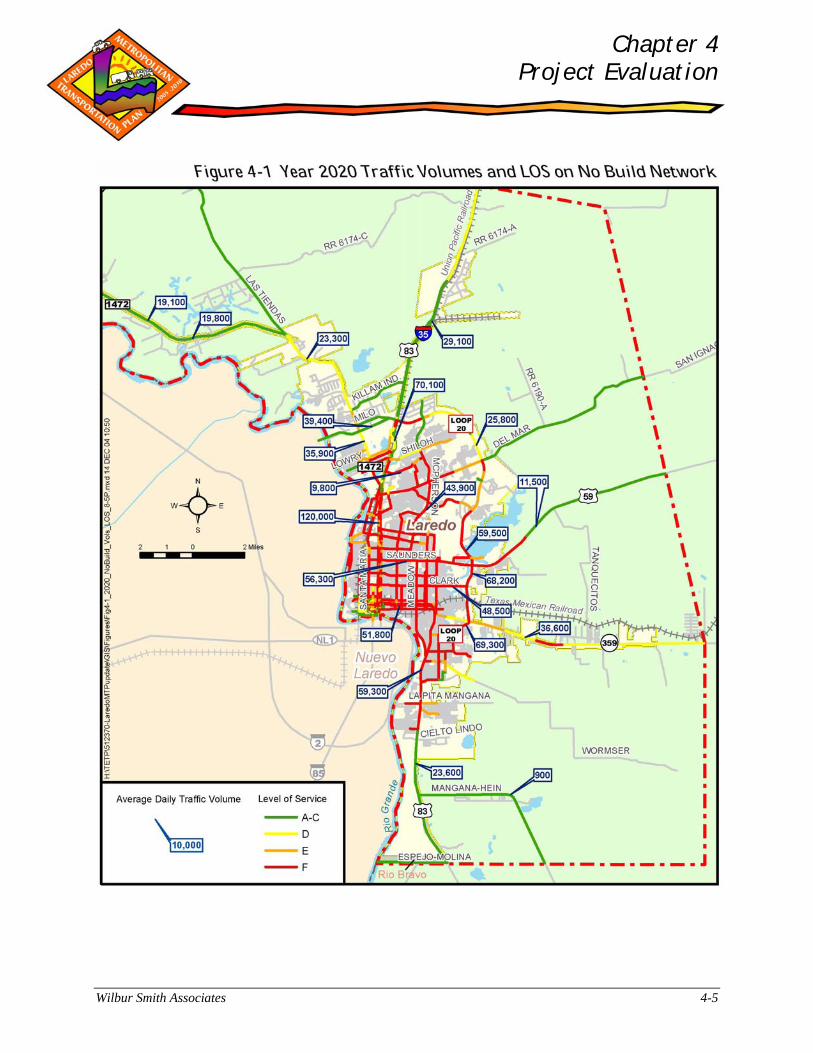
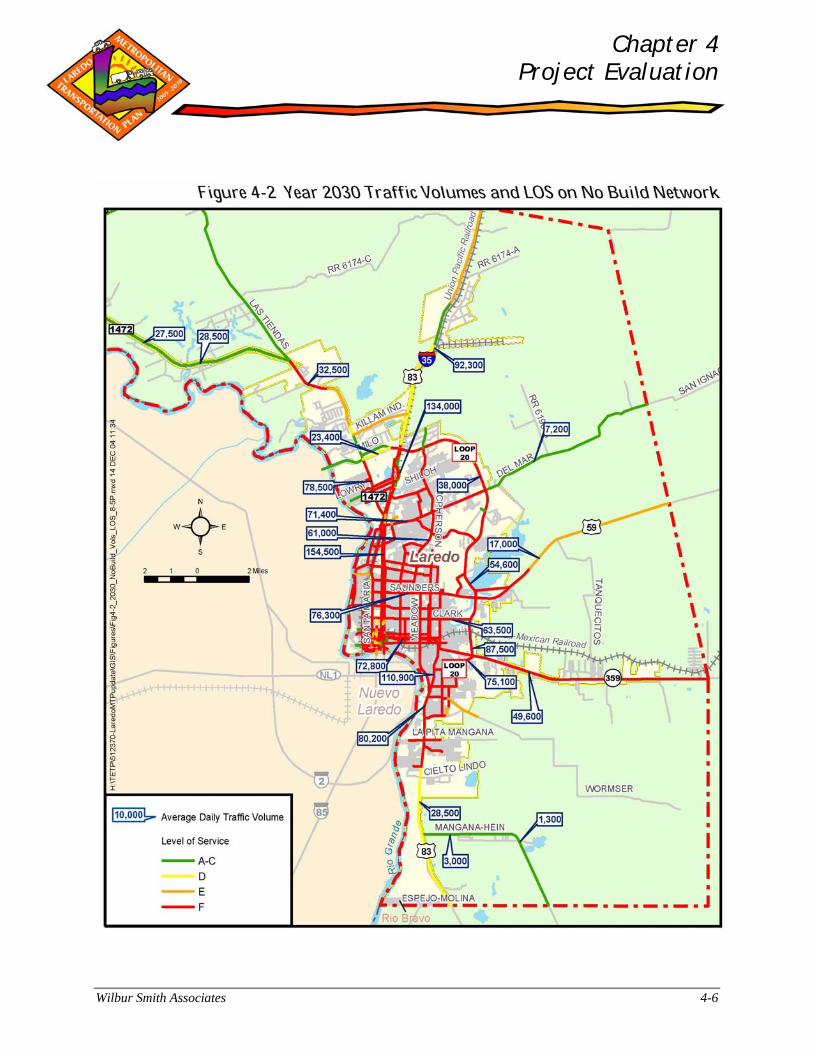
travel lanes. Other contributing factors of roadway capacity include intersection spacing, efficiency of signalized intersections, traffic composition, traffic controls and regulations. An important result of a capacity analysis is the determination of level-of-service. Level-of-Service (LOS) is a qualitative measure of operating conditions at a location and is directly related to the volume-to-capacity ratio along roadways. LOS is given a letter designation ranging from A to F (free flow to heavily congested), with LOS D considered in most urban areas as the limit of acceptable operation. For example, LOS can be related to the grading scale of a report card: A – Excellent, B – Good, C – Average, D – Acceptable, E – Needs improvement, and F – Failing. LOS criteria used to evaluate projected future traffic deficiencies were identified previously in Chapter 2. In determining the transportation improvement needs for the Laredo MPO area, a base network of the existing roadway system operational in 2003 was developed. All added capacity and regionally significant roadway projects completed by the end of 2003 were added to the updated base network. Plus, a model assignment was conducted to determine the traffic volume and LOS distributions throughout the MPO study area. The base 2003 network was then utilized to establish a “No-Build” network, where traffic loadings based on year 2020 and 2030 demographic data were projected onto the existing 2003 network. These 2020 and 2030 “No-Build” alternatives analyzed how future traffic volumes were distributed on the existing network if no transportation improvements were implemented during that time period. The 2020 and 2030 No-Build networks also provided a baseline for comparisons between networks with project implementation and the no-build network. Projected future year 2020 and 2030 daily traffic volume assignments and LOS on the No Build networks are shown in Figure 4-1 and Figure 4-2, respectively. The traffic volume and LOS distributions for each network are based on trip assignments that are described as part of the travel model forecasting process in Chapter 3: Travel Demand Modeling and Demographics. The trip assignments utilize data inputs provided by the Laredo MPO that are originally based on demographic data for the 2030 forecast years. If no roadway improvement projects are implemented over the course of the next 25 years, most major roadway corridors within the MPO boundary are projected to operate at unacceptable LOS conditions by year 2030, as illustrated in Figure 4-2. The majority of the roadways in Laredo deteriorate to unacceptable LOS, including US 83, Saunders (US 59), Guadalupe, Chihuahua, and IH 35. Clearly, a need for transportation improvements throughout the Laredo MPO area has been identified. ALTERNATIVE IMPROVEMENTS With the analysis of the existing and no build networks complete, the next step was evaluate numerous additional projects for inclusion in the MTP update. As per the Laredo MPO Public Involvement Process, a project nomination form was published in the newspaper in early
Chapter 4 Project Evaluation
Wilbur Smith Associates 4-5
Chapter 4 Project Evaluation
Wilbur Smith Associates 4-6
Chapter 4 Project Evaluation
Wilbur Smith Associates 4-7
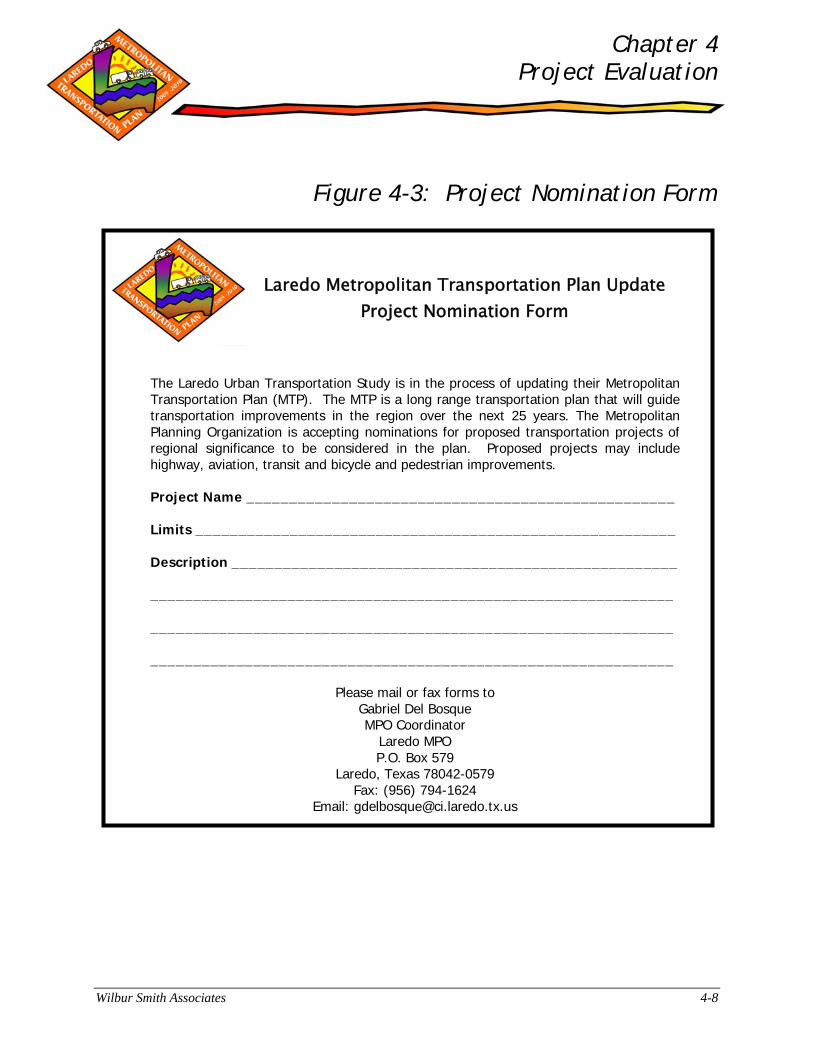
September 2004 to invite the public to nominate projects for inclusion in the MTP. The published nomination form is shown in Figure 4-3. In addition, the Laredo MPO Policy Committee, Laredo MPO Technical Committee, TxDOT staff, City of Laredo staff, and El Metro provided input in nominating projects for potential inclusion into the MTP. Projects from the Transportation Improvement Program (TIP), Unified Transportation Program (UTP), and the City of Laredo’s Capital Improvement Program (CIP) were all reviewed to develop a complete list of potential projects. Approximately 85 projects were identified for evaluation. EVALUATION OF ALTERNATIVES The project selection criteria approved by the MPO Policy Committee, as discussed previously in this chapter, were used to evaluate the alternative transportation improvements for inclusion into the Laredo MTP Update. The project selection criteria were grouped into six categories, including Demonstrated Need, Cost Reasonableness, Modal Impacts, Environmental/Social Impacts, Project Readiness, and Special Circumstances. DEMONSTRATED NEED - The Demonstrated Need category included an analysis existing traffic volumes, existing level-of-service, future traffic volumes, and future level-of-service. The resulting LOS analyses would help to determine which road projects provide a better benefit to surrounding traffic flow conditions. The more effective projects will eventually help to develop a fully integrated and continuous transportation system to serve the future population of the Laredo MPO area. Using existing year 2003 traffic assignments and future traffic assignments for 2030 no build network, a project matrix was developed to include all evaluated transportation improvement alternatives. The matrix contained several attributes of each project, including the project length and cost, the assigned volumes from the model analysis, and the corresponding LOS value for the project. The volume and LOS data were typically based on the highest assigned values within the limits of the project and for both the existing and future no-build conditions. For new location facilities, traffic volume and LOS data for parallel facilities were used, as the new location facilities would provide a traffic operations benefit to the parallel facilities. The resulting project matrix is included in Appendix B. The change in traffic conditions between the existing and no-build networks helped to rate the need for implementing a particular transportation improvement. Nearly half of the projects were rated with LOS F conditions for both the existing and future time periods and received the maximum score of 200 points for the Demonstrated Need criteria. Another 13 projects received 175 points with LOS E conditions in the existing time period and LOS F in the future time period. COST REASONABLENESS - Cost estimates for the projects discussed in this chapter are based on averages for current roadway construction and are intended for planning purposes only. These order-of-magnitude construction cost estimates will be refined as the projects are staged through the Transportation Improvement Program (TIP) for implementation. The majority of the cost estimates used in this analysis were provided by the Texas Department of
Chapter 4 Project Evaluation
Wilbur Smith Associates 4-8
Laredo Metropolitan Transportation Plan Update Project Nomination Form
The Laredo Urban Transportation Study is in the process of updating their Metropolitan Transportation Plan (MTP). The MTP is a long range transportation plan that will guide transportation improvements in the region over the next 25 years. The Metropolitan Planning Organization is accepting nominations for proposed transportation projects of regional significance to be considered in the plan. Proposed projects may include highway, aviation, transit and bicycle and pedestrian improvements. Project Name __________________________________________________ Limits ________________________________________________________ Description ____________________________________________________ _____________________________________________________________ _____________________________________________________________ _____________________________________________________________
Please mail or fax forms to Gabriel Del Bosque MPO Coordinator
Laredo MPO P.O. Box 579
Laredo, Texas 78042-0579 Fax: (956) 794-1624
Email: [email protected]
Figure 4-3: Project Nomination Form
Chapter 4 Project Evaluation
Wilbur Smith Associates 4-9
Transportation, City of Laredo, or Webb County for projects in the TIP, UTP, or CIP. Additional order-of-magnitude cost estimates for other nominated projects were developed by WSA using an analysis of fiscal 1995-97 average road construction costs from the Texas Comptroller of Public Accounts and TxDOT for types of various roadway construction adjusted to year 2004 value. All estimated costs are in terms of year 2004 cost values and are to be used only for the purposes of comparing the relative cost of a project against other projects. The construction cost estimates for recommended improvements are summarized in the project matrix in Appendix A. Cost reasonableness was calculated by determining the cost per vehicle-mile traveled and using it as a cost-benefit comparison value to compare potential alternatives against each other. Projects with a lower cost per VMT value were assumed to provide more benefits to the public at a lower implementation cost. Cost per VMT values ranged from about $3 per VMT to over $1,600 per VMT. Most projects had cost per VMT values between $20 and $150. The lowest cost per VMT projects (less than $5 per VMT) were access management projects, which are relatively low cost projects which provide travel benefits. The project matrix included in Appendix A identifies cost per VMT values for each project. MODAL IMPACTS - Each project was also reviewed for potential modal impacts. Modal impacts included whether or not a nominated project included bicycle, pedestrian, transit, rail, or airport access improvements. Most nominated projects did not include bicycle facilities, while most of the arterial street projects within the City of Laredo city limits do include sidewalks. However, even though most roadway projects do not include bicycle facilities, bicycle only projects do receive separate transportation enhancement funding, as discussed in Chapter 6. Projects located along Loop 20 received 20 points, as improvements to Loop 20 would provide improved access to the Laredo International Airport. ENVIRONMENTAL/SOCIAL IMPACTS – Environmental/Social impacts included public acceptance of the project, positive or negative environmental impacts, and ROW Cost as a percent of total cost. All nominated projects were perceived to have public support, as the projects were nominated by public citizens or agency representatives, with the exception of a few projects such as the Outer Loop, Loop 20, and FM 1472 raised median projects. These three projects, while they do have some support from citizens, they also have some opposition, so they did not receive points for public support. During the 45 day public comment period, citizens were provided the opportunity to again voice their acceptance of nominated projects. In addition, projects were given points depending upon the amount of additional right-of-way (ROW) that will be required to implement a project. The purchase of right-of-way typically impacts adjacent businesses or residences, so less amount of additional right-of-way needed to implement a project received higher scores than projects requiring a larger percentage of ROW. Twenty-eight of the evaluated projects do not include any additional right-of-way to implement, so they received a full 25 points. For the remaining evaluated projects, ROW cost as a percent of total construction cost ranged from two percent to 70 percent.
Chapter 4 Project Evaluation
Wilbur Smith Associates 4-10
PROJECT READINESS – Projects received additional points depending on the stage in the implementation process and how quickly they could be implemented. Projects already included in the MPO’s three year Transportation Improvement Program (TIP) typically received between 20 and 30 points, as these projects have completed the preliminary engineering process and design plans are complete. In addition, some of the TIP projects have already acquired all of the needed right-of-way to complete the project. Other project not in the TIP typically received between 0 and 20 points, depending upon their stage in the process. SPECIAL CIRCUMSTANCES – Projects also received additional points if they had special circumstances that provided additional public benefit. Some projects, such as the railroad and intersection grade separation projects, as well as the raised median projects, received an additional 30 points for safety. In addition, major new location projects, such as the Outer Loop and Cuatro Vientos, received an additional 15 points for system continuity, as they provide important roadway connections through some of the undeveloped portions of Laredo and provide relief to parallel corridors such as US 83. EVALUATION SUMMARY All nominated transportation projects went through a selection process based on the project evaluation criteria and the data documented in Appendix A. Each project was placed in either a short-term or long-term financially constrained time period or a financially unconstrained time period based on this data and the project funding levels during those time periods. Chapter 5 discusses the financial plan and level of available funding, while Chapter 6 identifies the selected projects as part of the recommended project listing for the Laredo MTP update. ENVIRONMENTAL JUSTICE CONSIDERATIONS Executive Order 12898, Federal Actions to Address Environmental Justice in Minority Populations and Low Income Populations, requires “federal agencies to achieve environmental justice by identifying and addressing disproportionately high and adverse human health and environmental effects, including the interrelated social and economic effects of their programs, policies, and activities on minority populations and low income populations in the United States” (FHWA Actions to Address Environmental Justice in Minority Populations and Low-Income Populations).
In accordance with federal and state requirements, individuals who fall into identified environmental justice and Title VI population groups within the study area are identified in this section for consideration in the evaluation of transportation improvement options. Population groups identified in this section include minority and low income groups.
As discussed in Chapter 1, throughout the development of the plan, several public involvement activities were undertaken to allow all groups the opportunity to participate in the plan and provide input. These activities included the publication of the nomination form in the local newspaper 90 days prior to the adoption of the plan and televised meetings on the local public access network. All MPO meetings were advertised in both Spanish and English.
Chapter 4 Project Evaluation
Wilbur Smith Associates 4-11
Minority Populations
This section involves assessing the minority population within the study area. Minority populations are defined in accordance with Executive Order 12898, U.S. Department of Transportation’s (DOT) Order DOT 5610.2 and Federal Highway Administration’s DOT Order 6640.23 Actions to Address Environmental Justice in Minority Populations and Low-income Populations. Minority is defined as:
Black (having origins in any of the black racial groups of Africa); Hispanic (of Mexican, Puerto Rican, Cuban, Central or South American, or other Spanish
culture or origin, regardless of race); Asian American (having origins in any of the original peoples of the Far East, Southeast
Asia, the Indian subcontinent, or the Pacific Islands); or American Indian and Alaskan Native (having origins in any of the original people of
North America and who maintains cultural identification through tribal affiliation or community recognition).
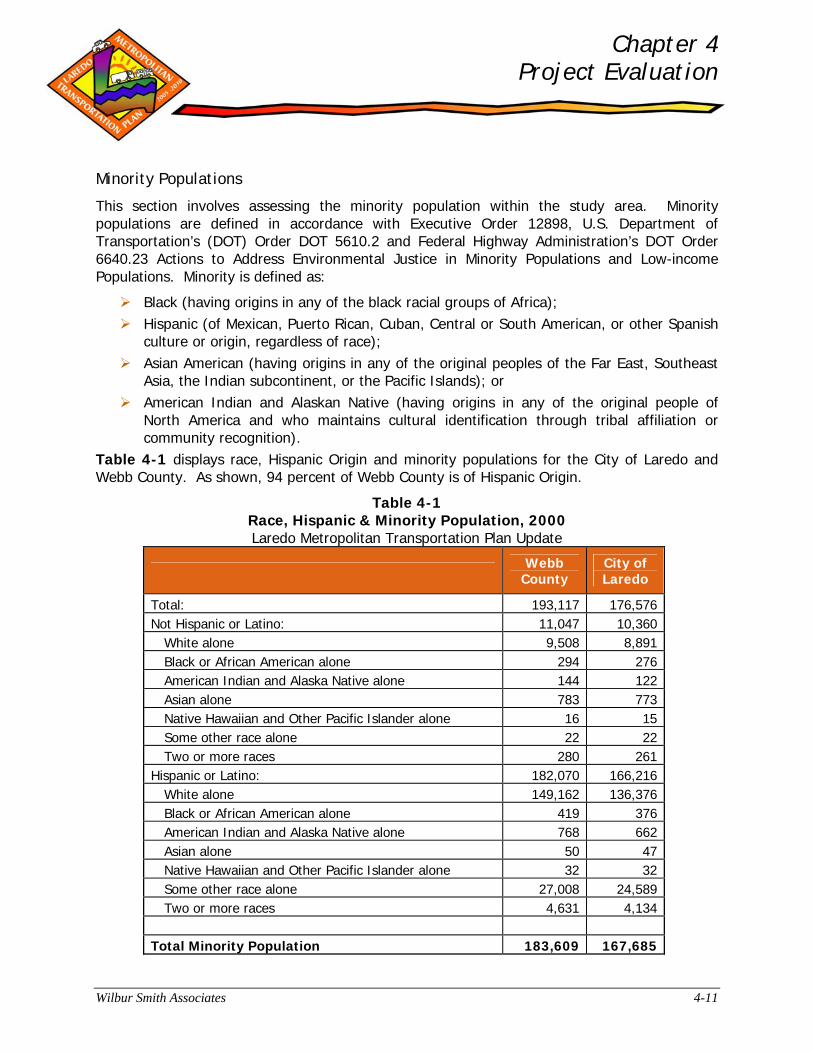
Table 4-1 displays race, Hispanic Origin and minority populations for the City of Laredo and Webb County. As shown, 94 percent of Webb County is of Hispanic Origin.
Table 4-1 Race, Hispanic & Minority Population, 2000 Laredo Metropolitan Transportation Plan Update
Webb County
City of Laredo
Total: 193,117 176,576Not Hispanic or Latino: 11,047 10,360
White alone 9,508 8,891Black or African American alone 294 276American Indian and Alaska Native alone 144 122Asian alone 783 773Native Hawaiian and Other Pacific Islander alone 16 15Some other race alone 22 22Two or more races 280 261
Hispanic or Latino: 182,070 166,216White alone 149,162 136,376Black or African American alone 419 376American Indian and Alaska Native alone 768 662Asian alone 50 47Native Hawaiian and Other Pacific Islander alone 32 32Some other race alone 27,008 24,589Two or more races 4,631 4,134
Total Minority Population 183,609 167,685
Chapter 4 Project Evaluation
Wilbur Smith Associates 4-12
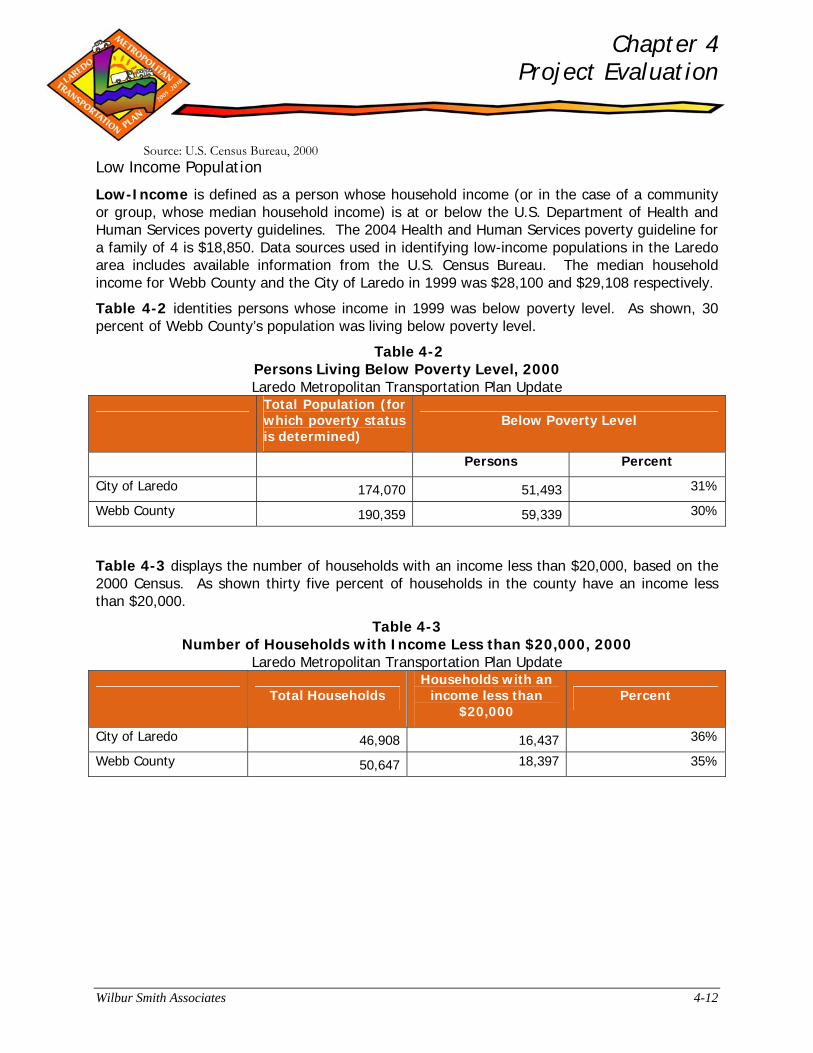
Source: U.S. Census Bureau, 2000 Low Income Population
Low-Income is defined as a person whose household income (or in the case of a community or group, whose median household income) is at or below the U.S. Department of Health and Human Services poverty guidelines. The 2004 Health and Human Services poverty guideline for a family of 4 is $18,850. Data sources used in identifying low-income populations in the Laredo area includes available information from the U.S. Census Bureau. The median household income for Webb County and the City of Laredo in 1999 was $28,100 and $29,108 respectively.
Table 4-2 identities persons whose income in 1999 was below poverty level. As shown, 30 percent of Webb County’s population was living below poverty level.
Table 4-2 Persons Living Below Poverty Level, 2000 Laredo Metropolitan Transportation Plan Update
Total Population (for which poverty status is determined)
Below Poverty Level
Persons Percent
City of Laredo 174,070 51,493 31%
Webb County 190,359 59,339 30%
Table 4-3 displays the number of households with an income less than $20,000, based on the 2000 Census. As shown thirty five percent of households in the county have an income less than $20,000.
Table 4-3 Number of Households with Income Less than $20,000, 2000
Laredo Metropolitan Transportation Plan Update
Total Households Households with an
income less than $20,000
Percent
City of Laredo 46,908 16,437 36%
Webb County 50,647 18,397 35%