comparison of different types of factorial kriging … of different types of factorial kriging maps...
TRANSCRIPT

Comparison of different types of Factorial Kriging maps in an
environmental case study
Batista, A. C.11, Ferreira da Silva, E. 1, Sousa, A. J. 2 and Cardoso Fonseca, E. 1
1 Departamento de Geociências, Universidade de Aveiro, Campus de Santiago, 3810-190 Aveiro, 2
CVRM / Centro de Geo-sistemas, Instituto Superior Técnico, Av. Rovisco Pais, 1049-001 Lisboa,
PORTUGAL
Key words: Factorial kriging, external drift, environmental geochemistry
Abstract
The main objective of this paper is to study the influence of different external drifts in
the Factorial Kriging maps, and to find out if the type of external drift influences the
resulting maps.
This study was conducted in a 336 km2 area, covering the Águeda municipality
(Central Portugal). This municipality is characterised by high east west geological
and land use asymmetry. The west side has a considerably higher geological and
land use variability. The main settlements and industries are located in this side.
However hydrologically this asymmetry doesn�t exist. Taking into account that
information, nine elements were analysed on a 1095 stream sediment samples set
by atomic absorption: Cu, Pb, Zn, Ni, and Cr mainly related with anthropogenic
activities, and Mn, Fe and Cd mainly related with geology.
An initial statistical study was undertaken involving the determination of the basic
statistical parameters, as well as a PCA analysis, in order to identify the main
relations between variables. The variographic study, upon which the Factorial
Kriging was based, included the adjustment of the theoretical variograms to the
experimental variograms by a semi-automatic process, limited to the estimation of
parameters such as sills and ranges chosen by the authors. This variographic study
was done on the normalised data set.
From this study three types of Factorial kriging maps were produced: 1- from the
classical Factorial Kriging, 2- Factorial Kriging with external drift � where the drift is
1 E-mail: [email protected], Fax: +351 234 401559
related with the lithological information (the sample co-ordinates on the second axis
resulting from the PCA analysis) and 3- Factorial Kriging with external drift - where
the drift is based on the sample codification according to the land use. These maps
were compared with the kriging map of the initial values of each variable.
The main conclusions that rise from this study are: 1- the introduction of secondary
information, in the Factorial Kriging maps, allows a better definition of the
anomalous areas; 2- the type of external drift influences the resulting maps, since
the external drift has to be highly correlated with the variables that are being
studied.
1. Introduction
Factorial Kriging (Sandjivy, 1984; Wackernagel, 1995) has been used in several
areas by several authors (Sousa, 1988, 1994; Wackernagel and Sanguinetti, 1993;
Jimenez-Espinosa et al.; 1993, Barata et al, 1997, Wen et al, 1997; Nunes et al,
2000, Batista et al, 2001a), b)) as it is an important technique of multivariate
estimation. The characterisation of each of the structures (given by the variogram) in
which each regionalized variable, at several scales, can be decomposed is done by
Factorial Kriging, leading to different types of mapping (Batista, 1998; Batista et al,
2001b))
In order to improve the cartography of the different spatial components of a
regionalized variable (primary variable), we can introduced the information given by
an external, complementary variable (secondary variable) (Wackernagel, 1995), as
long as: (a) the variables are correlated and (b) the second variable is known in all
the domain.
Taking all this information in consideration a new methodology to estimate the
spatial components was created (Batista, 1998, Batista et al, 2001b)): the Factorial
Kriging with External Drift.
The Factorial Kriging system was modified in order that the estimation of the
spatial components includes the same relation between the two variables (primary
and second variable). The estimation variance has therefor to be minimised, for
each structure u, taking into consideration two restrictions: (1) ��
�
n
i
ui
10�

(Wackernagel, 1995), since the spatial components have, by definition, null
expectation and (2) (Wackernagel, 1995, pag. 193). )()( 01
xsxs i
n
i
ui ��
�
�
� �E ( )Z x a b s� �0 1
z x*( )0 �
�ii
n
�
�1
� �E Z x*( )
�
�
���
j
ji
xsxs
xsxxC
0
21
)()(
0
()( ��
This second restriction comes from the relation between the primary variable
( as a particular realisation of the random function) and secondary variable
( ):
z( )x
)
)
0
i
s xi( )
(xi i .
Given an external drift, the primary variable can be estimated by a linear
combination of the available data:
�ii
niz x
�
�1
( )
where the weights depend on the external drift function , cf. (Wackernagel,
1995):
s xi(
is x s x� 0 ( () )
and
a b s x( )0 0 1� �
As a result it emerges the following kriging system (Batista et al, 2001b)):
�����
�
�����
�
����
�
�
�
�
�
�
n
j
uj
n
j
uj
n
ji
ui
uj xxC
1
1
10 n1,...,ifor ,)()
�
�
�

where Cu (xi � x0) is the elementary covariance between the value on xi sampling
point and x0 the point to be estimated and, Ns the number of spatial structures,
. )()(x C 00
0i xxCx i
N
u
us
��� ��
2. Case Study: Águeda Region
Águeda municipality, with an area nearly 334.3Km2, is located in the central-
Northeast of Portugal, more specifically in the sub-area of the Low-Vouga. This
municipality belongs to the district of Aveiro. This municipality is limited by the
Caramulo Mountain to south and east, by the Vouga River valley and Arestal
Mountain to north, and by the morphologic unit named Ria de Aveiro to west. The
industry is very diversified and mainly related to electroplating, foundries, metal
processing and manufacturing industries.
Some studies published in 1996 estimated that there are a total of 600 industries
in this region. Nearly 20% of these are electroplating industries. In the east part of
Águeda we have one abandoned Cu, Pb and Zn mine (Talhadas mine) with some
problems connected to tailing deposits and acid mine drainage.
2.1 Geology
The geological mapping of the Águeda area was done by Ávila Martins (1962),
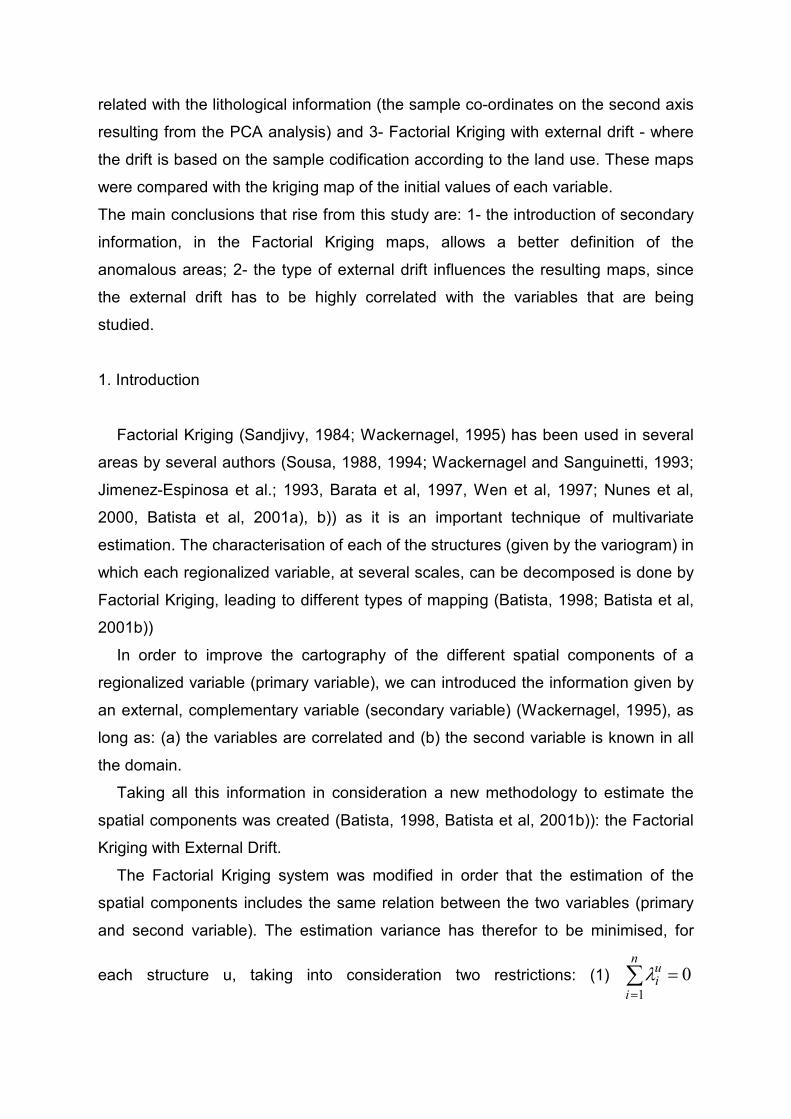
Godinho (1974) and Mendia de Castro (1986). Figure 1 shows the simplified
geological map of Águeda municipality where it is possible to clearly identify an
east-west asymmetry.
The east part is characterised by the presence of schist from the �Complexo
Xisto-Grauváquico�. The west part is mainly characterised by the presence of
Triassic sandstone (Palain, 1976), Cretaceous sandstone (Barbosa, 1981), Plio-
Plistocenic alluvium terraces (Mendia de Castro, 1986).
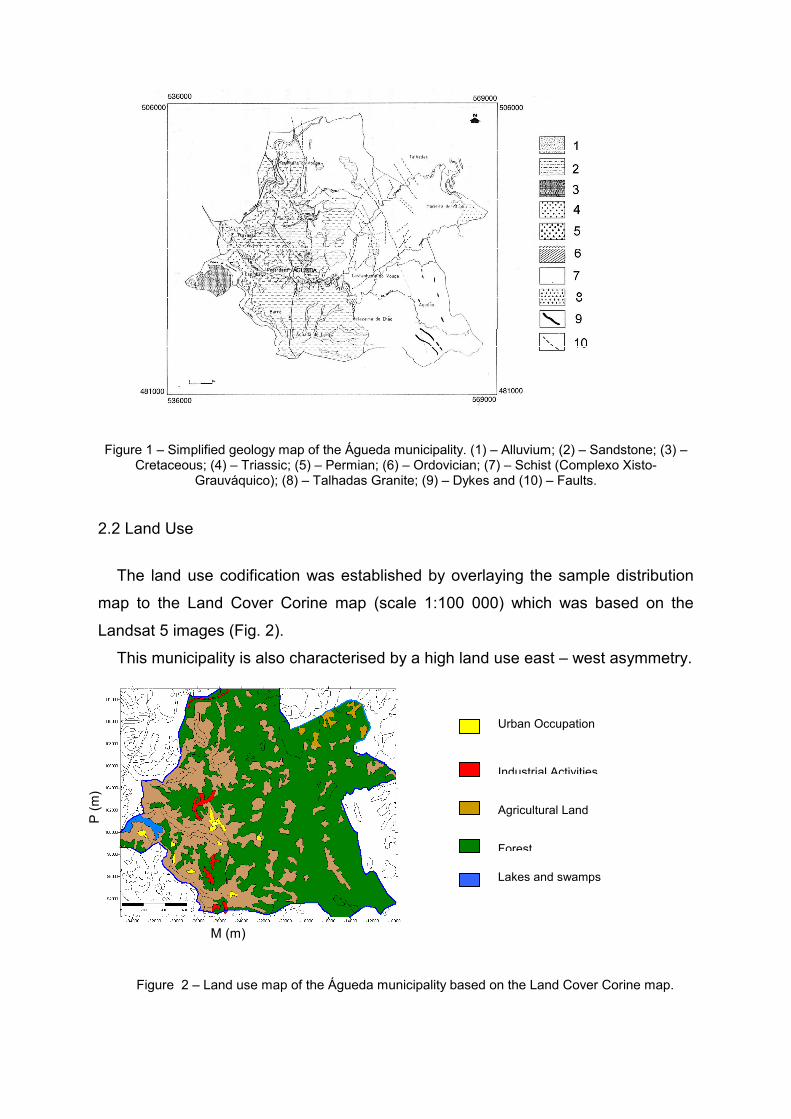
Figure 1 � Simplified geology map of the Águeda municipality. (1) � Alluvium; (2) � Sandstone; (3) � Cretaceous; (4) � Triassic; (5) � Permian; (6) � Ordovician; (7) � Schist (Complexo Xisto-
Grauváquico); (8) � Talhadas Granite; (9) � Dykes and (10) � Faults.
2.2 Land Use
The land use codification was established by overlaying the sample distribution
map to the Land Cover Corine map (scale 1:100 000) which was based on the
Landsat 5 images (Fig. 2).
This municipality is also characterised by a high land use east � west asymmetry.
Urban Occupation
Industrial Activities
P (m
)
Agricultural Land
Forest
Lakes and swamps
M (m)
Figure 2 � Land use map of the Águeda municipality based on the Land Cover Corine map.
2.3 Sampling and Analysis
A total of 1095 stream sediment samples were collected in the area. The stream
sediment samples were initially homogenised and oven-dried at 600C for 24 hours.
One portion of the dried sample was removed, sieved and the < 80 mesh fraction
was retained for chemical analysis. The Cu, Pb, Zn, Fe, Mn, Co, Ni and Cr concentrations were determined by flame
atomic absorption spectrophotometry technique (AAS), following a hot HCl-HNO3-
HF attack (Lecomte & Sondag 1980).
The precision of the analytical results was estimated by replicate analysis (Garrett
1973). Analytical precision, defined as the percent relative variation at the 95%
confidence level, ranged from 4 to 13%, for Cu, Pb, Zn, Fe, Mn, Co, Ni and Cr
considering the P0.05 significance level.
2.4 Results
2.4.1 Preliminary Analysis
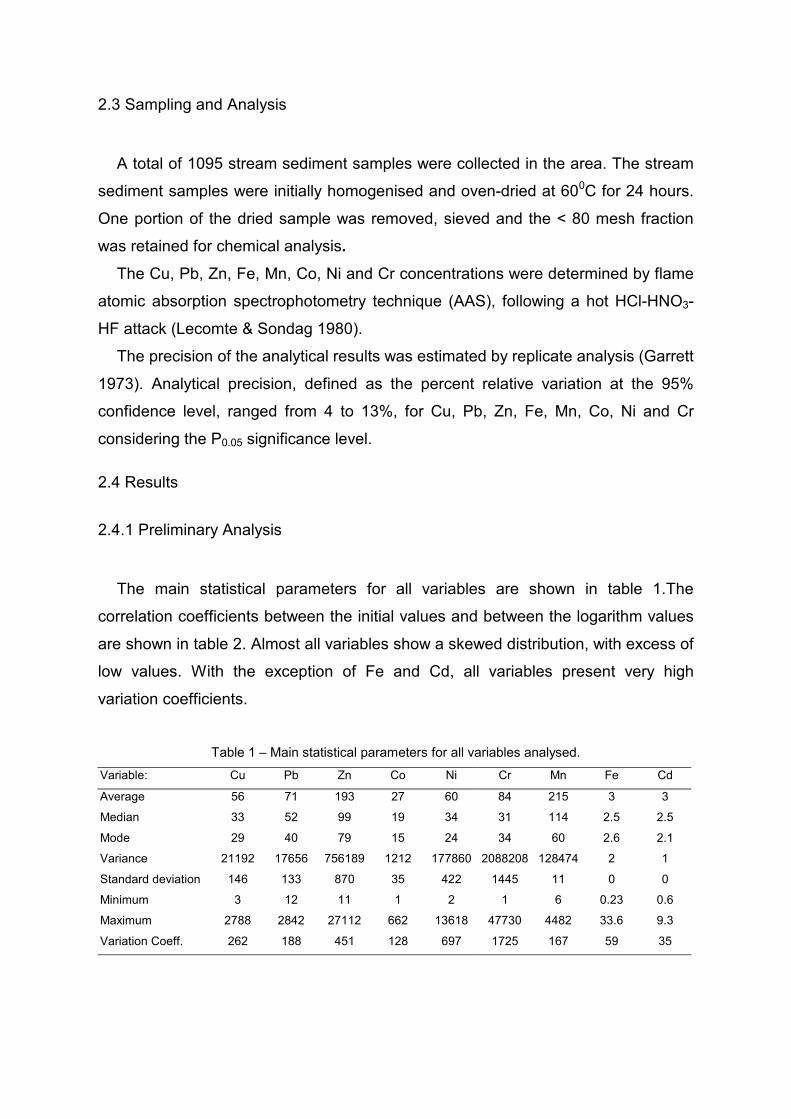
The main statistical parameters for all variables are shown in table 1.The
correlation coefficients between the initial values and between the logarithm values
are shown in table 2. Almost all variables show a skewed distribution, with excess of
low values. With the exception of Fe and Cd, all variables present very high
variation coefficients.
Table 1 � Main statistical parameters for all variables analysed.
Variable: Cu Pb Zn Co Ni Cr Mn Fe Cd
Average 56 71 193 27 60 84 215 3 3
Median 33 52 99 19 34 31 114 2.5 2.5
Mode 29 40 79 15 24 34 60 2.6 2.1
Variance 21192 17656 756189 1212 177860 2088208 128474 2 1
Standard deviation 146 133 870 35 422 1445 11 0 0
Minimum 3 12 11 1 2 1 6 0.23 0.6
Maximum 2788 2842 27112 662 13618 47730 4482 33.6 9.3
Variation Coeff. 262 188 451 128 697 1725 167 59 35
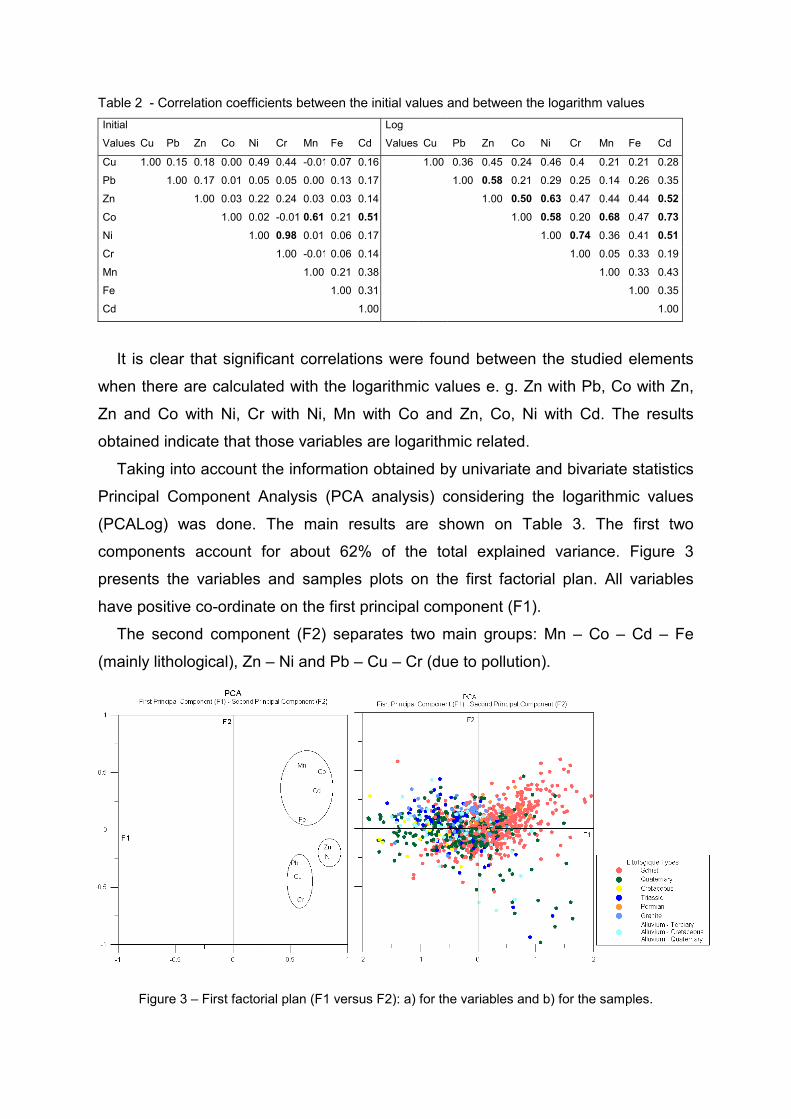
Table 2 - Correlation coefficients between the initial values and between the logarithm values Initial
Values
Cu
Pb
Zn
Co
Ni
Cr
Mn
Fe
Cd
Log
Values
Cu
Pb
Zn
Co
Ni
Cr
Mn
Fe
Cd
Cu 1.00 0.15 0.18 0.00 0.49 0.44 -0.01 0.07 0.16 1.00 0.36 0.45 0.24 0.46 0.4 0.21 0.21 0.28
Pb 1.00 0.17 0.01 0.05 0.05 0.00 0.13 0.17 1.00 0.58 0.21 0.29 0.25 0.14 0.26 0.35
Zn 1.00 0.03 0.22 0.24 0.03 0.03 0.14 1.00 0.50 0.63 0.47 0.44 0.44 0.52Co 1.00 0.02 -0.01 0.61 0.21 0.51 1.00 0.58 0.20 0.68 0.47 0.73Ni 1.00 0.98 0.01 0.06 0.17 1.00 0.74 0.36 0.41 0.51Cr 1.00 -0.01 0.06 0.14 1.00 0.05 0.33 0.19
Mn 1.00 0.21 0.38 1.00 0.33 0.43
Fe 1.00 0.31 1.00 0.35
Cd 1.00 1.00
It is clear that significant correlations were found between the studied elements
when there are calculated with the logarithmic values e. g. Zn with Pb, Co with Zn,
Zn and Co with Ni, Cr with Ni, Mn with Co and Zn, Co, Ni with Cd. The results
obtained indicate that those variables are logarithmic related.
Taking into account the information obtained by univariate and bivariate statistics
Principal Component Analysis (PCA analysis) considering the logarithmic values
(PCALog) was done. The main results are shown on Table 3. The first two
components account for about 62% of the total explained variance. Figure 3
presents the variables and samples plots on the first factorial plan. All variables
have positive co-ordinate on the first principal component (F1).
The second component (F2) separates two main groups: Mn � Co � Cd � Fe
(mainly lithological), Zn � Ni and Pb � Cu � Cr (due to pollution).
a) b)
Figure 3 � First factorial plan (F1 versus F2): a) for the variables and b) for the samples.

Table 3 � Eigen values and percentage of explained variance for the first
3 principal components. Scores of all variables in those components. F1 - Axis 1 F2 � Axis 2 F3 � Axis 3
Eigenvalue 4.21 1.39 0.93
Percentage 46.76 15.45 10.44
Cu 0.57 -0.40 -0.17
Pb 0.54 -0.29 -0.69 Zn 0.83 -0.14 -0.23
Co 0.78 0.51 0.11
Ni 0.83 -0.23 0.35
Cr 0.59 -0.61 0.43
Mn 0.60 0.57 0.02
Fe 0.61 0.10 0.21
Cd 0.73 0.34 -0.14
The PCALog results show that the second principal component best separates
the main lithologies present in the area (after a 25º rotation of the samples co-
ordinates).
2.4.2. Variography
A variographic study of all the variables was conducted in order to determine the
variables spatial structure. From all analysed variables, only three of them are
presented:
a) Cu and Pb - characterising anthropogenic pollution i) related with
industrial activities and ii) related with the Talhadas mine, located in the
NE part of the study area.
b) Zn � related to anthropogenic pollution either industrial either from urban
activities.
The variogram parameters upon which the Factorial Kriging was based are
shown, for the chosen variables, in Table 4. These variables have different
directional spatial behaviour, since Cu and Pb have an anisotropic behaviour and Zn
has an isotropic behaviour.
Those parameters were calculated with the standardised data (subtracted the
average to each value and divided by the standard deviation).

A semi-automatic process was used for fitting the theoretical variograms to the
experimental variograms, limited to the estimation of the sills and ranges chosen by
the authors.
Table 4 � Variogram parameters for the chosen variables. Variogram parameters C0 C1 A1 (m)
Cu � Spherical Model 0.14 0.532 90º - 3360; 0º - 1680
Pb - Spherical Model 0.308 0.715 90º - 3360; 0º - 1680
Zn - Spherical Model 0.14 0.88 2160
* C0 - is the nugget effect; C1 - is the sill of the first structure and A1 - is the range of the first structure.
2.4.3. Two Types of External Drift
By using different types of external drifts into the Factorial Kriging maps, we tried
to evaluate the influence of the choice of the external drift.
For that purpose two external variables were chosen:
a) The sample�s co-ordinates on the second axis resulting from the PCA
analysis (PCALog). These co-ordinates were calculated on the second
axis after a 25º sample�s rotation (clock wise). This rotation to the co-
ordinates was done since that way the separation of the main lithologies,
by the second axis, was clearer.
b) The sample�s co-ordinates on a discriminant axis. The grouping variable
for this discrimination was the land use codification. This codification was
done by overlaying the sampling map and the Corine Land Cover map.
The main land use codes are shown in table 5.
Table 5 � Main land use codes.
Codes Number of samples Description
1 16 Urban Occupation
2 6 Industrial Activities
3 437 Agricultural Land
4 636 Forest
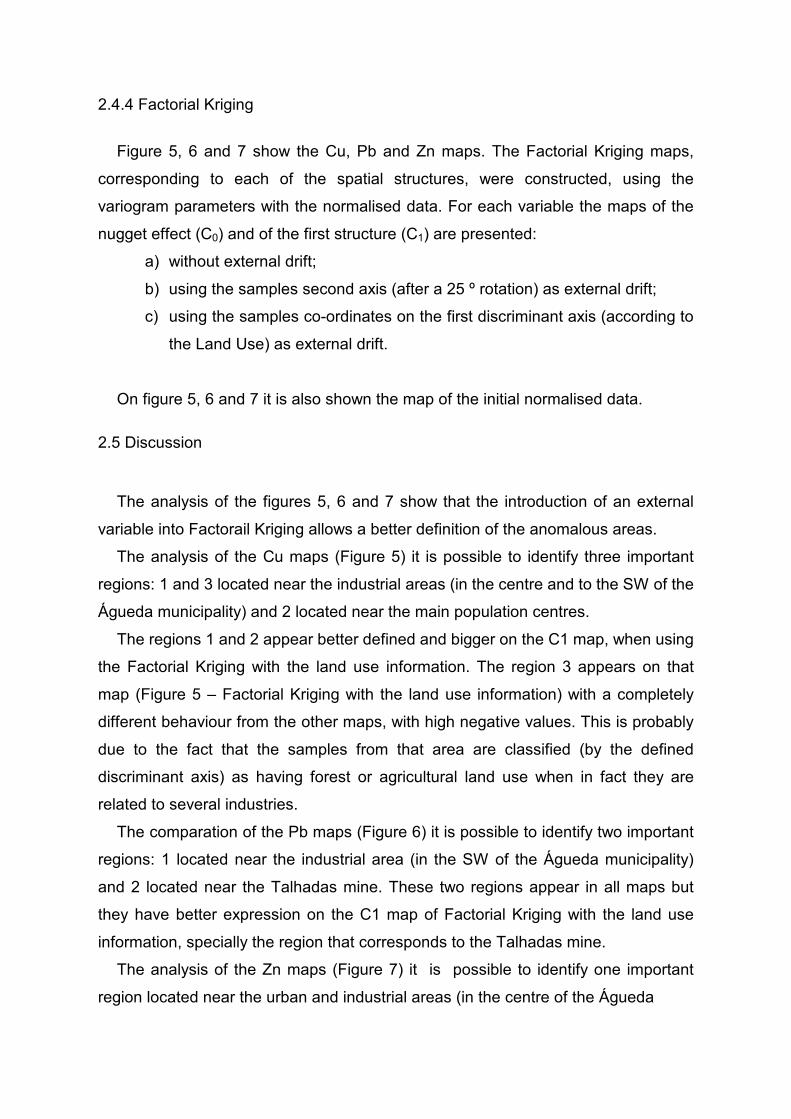
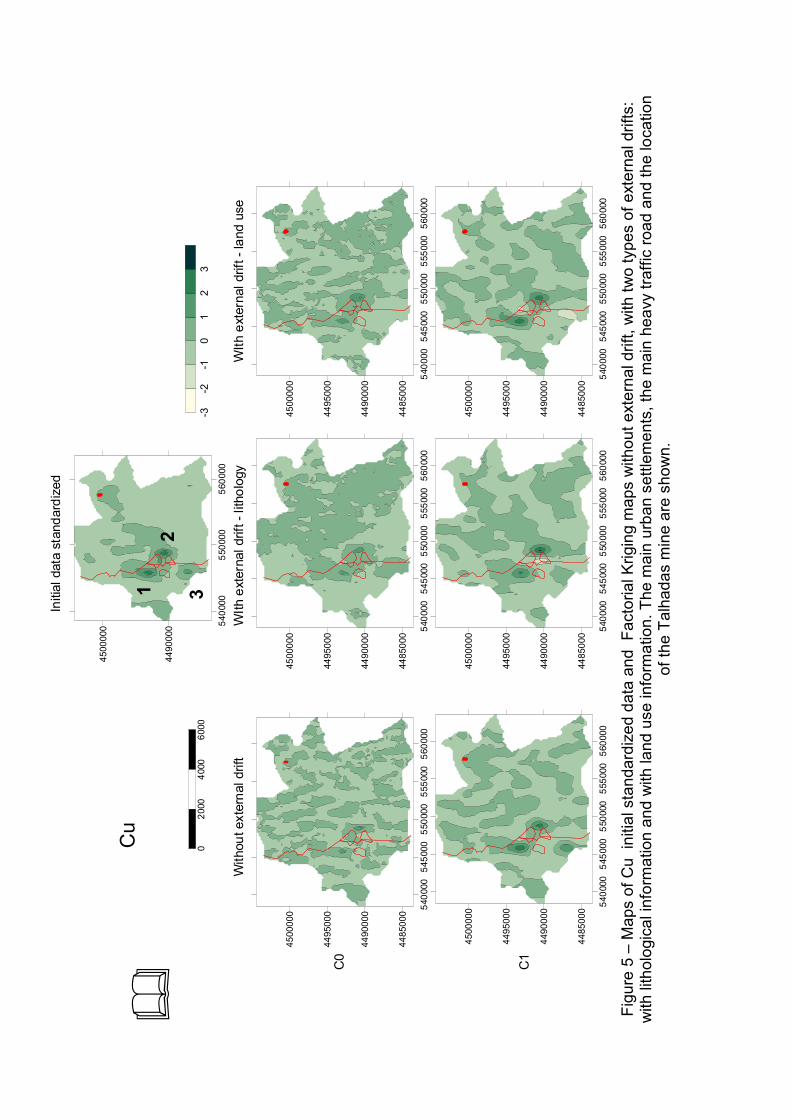
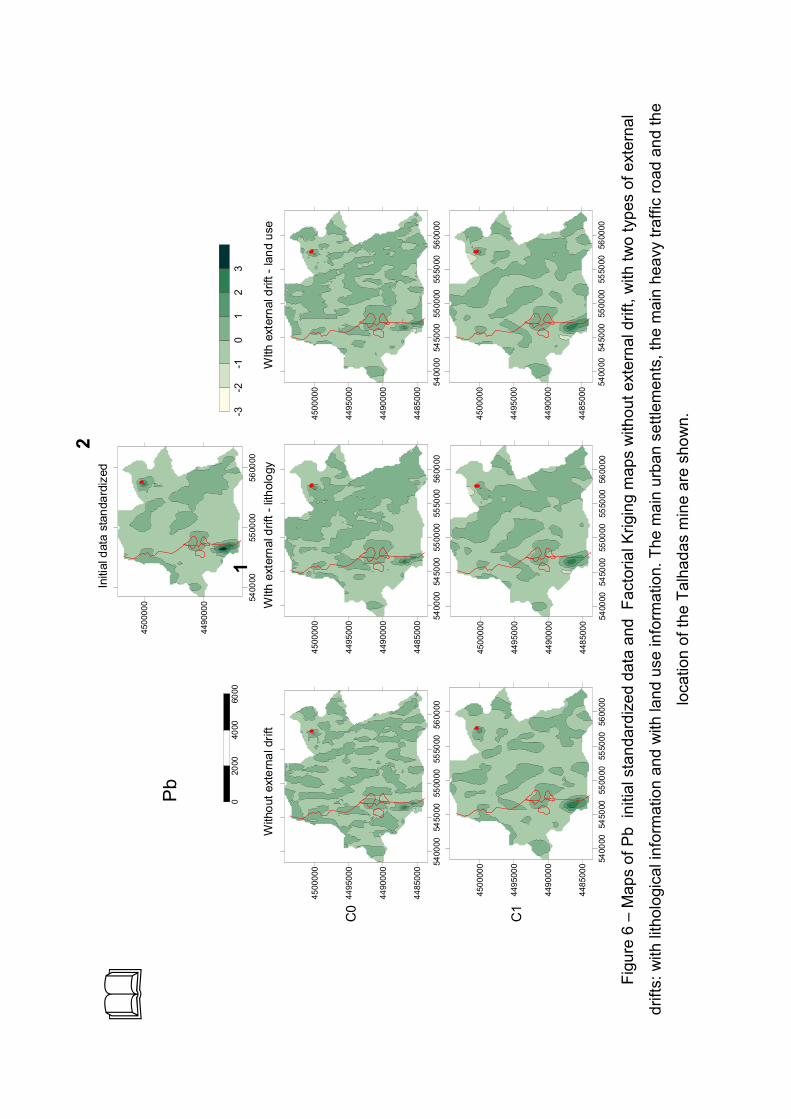
2.4.4 Factorial Kriging
Figure 5, 6 and 7 show the Cu, Pb and Zn maps. The Factorial Kriging maps,
corresponding to each of the spatial structures, were constructed, using the
variogram parameters with the normalised data. For each variable the maps of the
nugget effect (C0) and of the first structure (C1) are presented:
a) without external drift;
b) using the samples second axis (after a 25 º rotation) as external drift;
c) using the samples co-ordinates on the first discriminant axis (according to
the Land Use) as external drift.
On figure 5, 6 and 7 it is also shown the map of the initial normalised data.
2.5 Discussion
The analysis of the figures 5, 6 and 7 show that the introduction of an external
variable into Factorail Kriging allows a better definition of the anomalous areas.
The analysis of the Cu maps (Figure 5) it is possible to identify three important
regions: 1 and 3 located near the industrial areas (in the centre and to the SW of the
Águeda municipality) and 2 located near the main population centres.
The regions 1 and 2 appear better defined and bigger on the C1 map, when using
the Factorial Kriging with the land use information. The region 3 appears on that
map (Figure 5 � Factorial Kriging with the land use information) with a completely
different behaviour from the other maps, with high negative values. This is probably
due to the fact that the samples from that area are classified (by the defined
discriminant axis) as having forest or agricultural land use when in fact they are
related to several industries.
The comparation of the Pb maps (Figure 6) it is possible to identify two important
regions: 1 located near the industrial area (in the SW of the Águeda municipality)
and 2 located near the Talhadas mine. These two regions appear in all maps but
they have better expression on the C1 map of Factorial Kriging with the land use
information, specially the region that corresponds to the Talhadas mine.
The analysis of the Zn maps (Figure 7) it is possible to identify one important
region located near the urban and industrial areas (in the centre of the Águeda
�
5400
0055
0000
5600
00
4490
000
4500
000
5400
0054
5000
5500
0055
5000
5600
00
4485
000
4490
000
4495
000
4500
000
5400
0054
5000
5500
0055
5000
5600
00
4485
000
4490
000
4495
000
4500
000
5400
0054
5000
5500
0055
5000
5600
00
4485
000
4490
000
4495
000
4500
000 54
0000
5450
0055
0000
5550
0056
0000
4485
000
4490
000
4495
000
4500
000
5400
0054
5000
5500
0055
5000
5600
00
4485
000
4490
000
4495
000
4500
000 54
0000
5450
0055
0000
5550
0056
0000
4485
000
4490
000
4495
000
4500
000
With
out e
xter
nal d
rift
WIth
ext
erna
l drif
t - li
thol
ogy
WIth
ext
erna
l drif
t - la
nd u
se
020
0040
0060
00-3
-2-1
01
23
Initi
al d
ata
stan
dard
ized
C0
C1
Cu
12
3 Fi
gure
5 �
Map
s of
Cu
initi
al s
tand
ardi
zed
data
and
Fac
toria
l Krig
ing
map
s w
ithou
t ext
erna
l drif
t, w
ith tw
o ty
pes
of e
xter
nal d
rifts
: w
ith li
thol
ogic
al in
form
atio
n an
d w
ith la
nd u
se in
form
atio
n. T
he m
ain
urba
n se
ttlem
ents
, the
mai
n he
avy
traffi
c ro
ad a
nd th
e lo
catio
n of
the
Talh
adas
min
e ar
e sh
own.
2
With
out e
xter
nal d
rift
WIth
ext
erna
l drif
t - li
thol
ogy
WIth
ext
erna
l drif
t - la
nd u
se54
0000
5500
0056
0000
4490
000
4500
000
5400
0054
5000
5500
0055
5000
5600
00
4485
000
4490
000
4495
000
4500
000
5400
0054
5000
5500
0055
5000
5600
00
4485
000
4490
000
4495
000
4500
000 54
0000
5450
0055
0000
5550
0056
0000
4485
000
4490
000
4495
000
4500
000
5400
0054
5000
5500
0055
5000
5600
00
4485
000
4490
000
4495
000
4500
000
5400
0054
5000
5500
0055
5000
5600
00
4485
000
4490
000
4495
000
4500
000
5400
0054
5000
5500
0055
5000
5600
00
4485
000
4490
000
4495
000
4500
000
020
0040
0060
00-3
-2-1
01
23
C0
C1
Initi
al d
ata
stan
dard
ized
Pb
1
�
Figu
re 6
� M
aps
of P
b in
itial
sta
ndar
dize
d da
ta a
nd F
acto
rial K
rigin
g m
aps
with
out e
xter
nal d
rift,
with
two
type
s of
ext
erna
l
drift
s: w
ith li
thol
ogic
al in
form
atio
n an
d w
ith la
nd u
se in
form
atio
n. T
he m
ain
urba
n se
ttlem
ents
, the
mai
n he
avy
traffi
c ro
ad a
nd th
e
loca
tion
of th
e Ta
lhad
as m
ine
are
show
n.
�
With
out e
xter
nal d
rift
WIth
ext
erna
l drif
t - li
thol
ogy
WIth
ext
erna
l drif
t - la
nd u
se
5400
0054
5000
5500
0055
5000
5600
00
4485
000
4490
000
4495
000
4500
000
4505
000
5400
0054
5000
5500
0055
5000
5600
00
4485
000
4490
000
4495
000
4500
000
5400
0055
0000
5600
00
4490
000
4500
000
C0
C1
Initi
al d
ata
stan
dard
ized
Zn
-3-2
-10
12
30
2000
4000
6000
5400
0054
5000
5500
0055
5000
5600
00
4485
000
4490
000
4495
000
4500
000
5400
0054
5000
5500
0055
5000
5600
00
4485
000
4490
000
4495
000
4500
000
5400
0054
5000
5500
0055
5000
5600
00
4485
000
4490
000
4495
000
4500
000
4505
000
5400
0054
5000
5500
0055
5000
5600
00
4485
000
4490
000
4495
000
4500
000
Figu
re 7
� M
aps
of Z
n in
itial
sta
ndar
dize
d da
ta a
nd F
acto
rial K
rigin
g m
aps
with
out e
xter
nal d
rift,
with
two
type
s of
ext
erna
l
drift
s: w
ith li
thol
ogic
al in
form
atio
n an
d w
ith la
nd u
se in
form
atio
n. T
he m
ain
urba
n se
ttlem
ents
, the
mai
n he
avy
traffi
c ro
ad a
nd th
e
loca
tion
of th
e Ta
lhad
as m
ine
are
show
n

municipality). This region appears in all maps but it is on the Factorial Kriging map
with the land use information that it appears more extended and better defined.
The C0 maps of Factorial Kriging using the lithological information, for all
variables, reflect the geological asymmetry present in this municipality.
3. Conclusions
The identified anomalies for Cu, Pb and Zn appear associated with the urban or
industrial areas. The anomalies related to the industrial activities area mainly due to
the electroplating and metal processing industries. The anomalies related to urban
areas are explained by the presence of small, family enterprises.
The C0 maps of Factorial Kriging using the lithological information, for all variables,
reflect the geological asymmetry present in this municipality.
The Factorial Kriging maps using the land use information as an external drift show
the anomalous areas more extended and better defined probably due to the fact that
the samples from those areas are classified (by the defined discriminant axis) as
having forest or agricultural land use when in fact they are related to several
industries.
The results show that the type of external drift affects the Factorial Kriging maps.
The correlation between the type of external drift and the different variables is
important for the enhancement of the anomalous areas.
4. Acknowledgements
The first author would like to thank the Fundação para a Ciência e a
Tecnologia (FCT) the concession of a pos-PhD scholarship.

REFERENCES
Ávila Martins, J., 1962, Contribuição para o conhecimento geológico da região do
Caramulo. Memória nº 35. Separata da Revista da Faculdade de Ciências de
Lisboa, 2º série, C, Vol. IX, Fasc. 2º; 123-228 p.
Barata, M.T., Nunes, M.C., Sousa, A.J., Muge, F. & Albuquerque, T., 1997
Geostatistical Estimation of Forest Cover Areas using Remote Sensing Data.
E.Y. Baafi & N.A. Schofield (Eds.), Geostatistics Wollongong �96, 1244- 1256
p., Kluwer Academic Publishers.
Barbosa, B. P., 1981, Notícia Explicativa da Folha 16 �C de Vagos. Carta
Geológica de Portugal na escala 1: 50000. Direcção Geral de Geologia e
Minas. Serviços Geológicos de Portugal; 60 p.
Batista, A C., 1998 Decomposição Estrutural de Variáveis Regionalizadas.
Aplicação à Cartografia Geoquímica. PhD thesis, Instituto Superior Técnico,
Lisboa.
Batista, A. C.; Ferreira da Silva, E. A.; Sousa, A. J. & Cardoso Fonseca, E., 2001a)
Factorial Kriging Applied to the study of industrial contaminated soils, in
Monestiez P., Allard D. and Froidevaux R., Eds, geoENV III, Geostatistics for
Environmental Applications, Kluwer Academic Publ.
Batista, A.C.; Sousa, A. J.; Batista, M. J. & Viegas, L., 2001b), Factorial Kriging With
External Drift: A Case Study on the Penedono Region, Portugal., Journal of
Applied Geochemistry, Vol 16 (7-8), 921-929 p.
Garrett, R. G., 1973, The determination of sampling and analitycal errors in
exploration geochemistry. Econ. Geology, 68, 282-283 p.
Godinho, M. M., 1974, Sobre o pluttanometamorfismo da região de Guardão
(Caramulo-Portugal). Memórias e Notícias Mus. Lab. Min. Geol. Univ.
Coímbra, 78, 37-77 p.
Goovaerts, P., 1997, Geostatistics for Natural Resources Evaluation, Oxford
University Press, Oxford.
Jimenez-Espinosa, R., Sousa, A. J., Chica-Olmo, M., 1993, Identification of
Geochemical Anomalies Using Principal Components Analysis and Factorial
Analysis., Journal of Geochemical Exploration, nº 46, 245-256 p.
Lecomte, P. and Sondag, F., 1980, Regional geochemical reconnaissance in the
Belgian Ardennes, secondary dispersion patterns in stream sediments.
Mineralium Deposita, 15 1); 47-60 p.
Mendia de Castro, 1986, Carta litológico-geotectónica do Copncelho de Águeda.
Notícia Explicativa.Ministério do Plano e da Administração do Território.
Direcção-Geral da Administração Autárquica, 25 pp.
Nunes, M.C., Sousa, A.J, Muge, F.H., 2000, The Use of Remote Sensing Imagery
to Update Forest Cover. Proceedings do 6th International Geoestatistics
Congress, Capetown, South Africa.
Palain, C., 1976, Une série détritique terrigéne les �Grés de Silves�: Trias e Lias
inferiéur du Portugal. Serviços Geológicos de Portugal (D.G.G.M.), Memória
nº25.
Sousa, A. J., 1988, Análise de Dados e Geoestatística Multivariada. Aplicação à
Tipologia de Minérios Complexos, Tese de doutoramento, Instituto Superior
Técnico, Lisboa, pp. 152.
Sousa, A. J., 1994, Contribuição da Krigagem Factorial para a Cartografia
Geoquímica., Geo-sistemas, C. V. R. M., Lisboa, nº 3, 133-142 p.
Warckernagel, H., 1995, Multivariate Geostatistics., Springer, Berlin, pp. 256.
Warckernagel, H., Sangurinetti, H., 1993, Gold prospection with Factorial Cokriging
in the Limousin, France, Sudies in Mathematical Geology, Oxford University
Press.
Wen, R., Sinding-Larsen, R., 1997, Image Filtering by Factorial Kriging. Math.
Geology, Vol. 29, No 4, 433-468 p.