components of human experience in virtual environments
TRANSCRIPT

Computers in
Computers in Human Behavior 24 (2008) 1–15
www.elsevier.com/locate/comphumbeh
Human Behavior
Components of human experiencein virtual environments
Jari Takatalo a,*, Gote Nyman a, Leif Laaksonen b
a Department of Psychology, University of Helsinki, P.O. Box 9, University of Helsinki, 00014 Helsinki, Finlandb CSC-Finnish IT Centre for Science, P.O. Box 405, CSC-Scientific Computing Ltd., Espoo 02101, Finland
Available online 26 January 2007
Abstract
Framework is presented for measuring human experience in virtual environment (VE). Humanexperience is defined as the content of direct observation or participation in an event. Both psycho-logical and emotional properties are integrated into this ongoing person–environment interaction togive an experience meaning and value and to enhance its quality and intensity. The sense of presence,i.e., being in the VE is in the center of psychological study of a human experience in VEs. The ‘Bigthree’ structure of physical presence consists of perceptual, attentional and cognitive components.However, it is considered to ignore, e.g., emotional and ecological aspects in developing a holistichuman experience. In this study, components of physical presence are integrated with three differentmeasures of interaction and a set of motivational and cognitive-affective components. These compo-nents are integral in the theory of optimal experience, i.e., flow, which has been studied in varioushuman activities. The results show, how these different experiential components relate each otherin VE. It is also shown how common patterns can be found from various experiences and profiledto better understand human–computer interaction.� 2006 Elsevier Ltd. All rights reserved.
Keywords: Virtual environments; Experience; Sense of physical presence; Flow theory
0747-5632/$ - see front matter � 2006 Elsevier Ltd. All rights reserved.
doi:10.1016/j.chb.2006.11.003
* Corresponding author. Tel.: +358 50 33 00 911.E-mail address: [email protected] (J. Takatalo).

2 J. Takatalo et al. / Computers in Human Behavior 24 (2008) 1–15
1. Introduction
1.1. Human experience
The online edition of the Visual Thesaurus (Visual Thesaurus, 2004) defines the wordexperience with the following key points: (1) experience has two meanings: it can be some-thing one has gone trough and gained knowledge of or it can be the content of directobservation or participation in an event, (2) experience may have both mental and bodilystates, and (3) it is closely related to feelings and emotional sensations. Direct observationor participation in an event requires ongoing interaction between person and an environ-ment. The experienced content of this interaction is affected by the memory and knowl-edge based on previous experiences (Glenberg, 1997). This interpretation process givesan experience meaning and value (Dewey, 1934). The process also causes emotionalchanges in bodily states, which are felt as feelings. These ‘somatic markers’ provided bythe body have an effect on perceptions, cognitions and behavior. This way the mind ofthe perceiver is linked to the body of the perceiver (Damasio, 1994). These bodily statesalso deepen the quality and intensity of the experience itself (Dewey, 1934).
All subjective experiences are quantifiable only by the person experiencing them (Schue-mie, van der Straaten, Krijn, & van der Mast, 2001). But, since almost all experiences arisefrom the interaction between a man and his environment there are common patterns invarious experiences (Dewey, 1934). The investigation of these patterns in restricted envi-ronments such as 3D, interactive virtual environments (VEs), is likely to expand knowl-edge concerning both subjective experiences and interactive VEs.
1.2. Human experience in VEs
There are special features in VEs that have an affect on human experience. VEs arecapable of producing a sense of physical presence, which is defined, e.g., as the user’s feel-ing of ‘‘being there’’ in a mediated environment (IJsselsteijn, deRidder, Freeman, &Avons, 2000). It is also defined as the illusion of non-mediation in which the user no longerperceives the display medium (Lobard & Ditton, 1997). Thus, sense of presence is in thecenter of the psychological research in VEs (Schubert, Friedmann, & Regenbrecht,1999). It is also used as a global measure to explain human experience in other media(Freeman, Avons, Meddis, Pearson, & IJsselsteijn, 2000).
Interaction is acknowledged as one of the prime causes of presence in VEs by manyauthors (e.g., Draper, Kaber, & Usher, 1998; Lobard & Ditton, 1997; Steuer, 1992). Espe-cially, ecological view (Flach & Holden, 1998; Zahorik & Jenison, 1998) emphasizes therole of functionality in generating presence experience. In this perspective presence is morerelated to the functionality of the VE than to its appearance (Flach & Holden, 1998). Someauthors also emphasize the role of emotions in presence experience (e.g., Huang & Alessi,1999).
In real life presence and interactivity are difficult to define and measure. However, mea-sures concerning how the well-defined VEs is perceived and how its functionality is eval-uated have a clear role in the psychology of the virtual. As a holistic human experience isstudied ‘‘it is not just what the organism perceives, but how it takes what it perceives’’(Fodor & Pylyshyn, 1981, p.189). To study human experience from this viewpoint severalother psychological and emotional components need to be examined. The theory of
J. Takatalo et al. / Computers in Human Behavior 24 (2008) 1–15 3
optimal experience, i.e., flow (Csikszentmihalyi, 1975) provides a variety of componentsforming the human experience.
1.3. Optimal experience – flow
In the process of flow, the cognitive appraisal of the situation concerns balance betweena person’s perceived skills and the challenges provided by the narrowed stimulus field of aparticular situation. Flow has been studied among different cultures and socio-economicclasses (Csikszentmihalyi, 1990) and it has been found to be a useful framework whenstudying a variety of human activities (Ghani & Deshpande, 1994). Human–computerinteractions have such special characteristics that make them suitable to be described byusing the flow construct (Csikszentmihalyi, 1990).
According to Csikszentmihalyi (1975, 1990) in this dynamic state, individual’s attentionis fully concentrated on the task at hand, elevating cognitive processing capacity beyondnormal level and making intellectual performance easier and more pleasant. Such tasksshould also provide a clear goal and instant feedback to the actor as well as increasethe actor’s sense of control or lack the sense of worry of losing it. Although, a clear goalis needed, Csikszentmihalyi (1975) stresses that doing has a central role in the process.
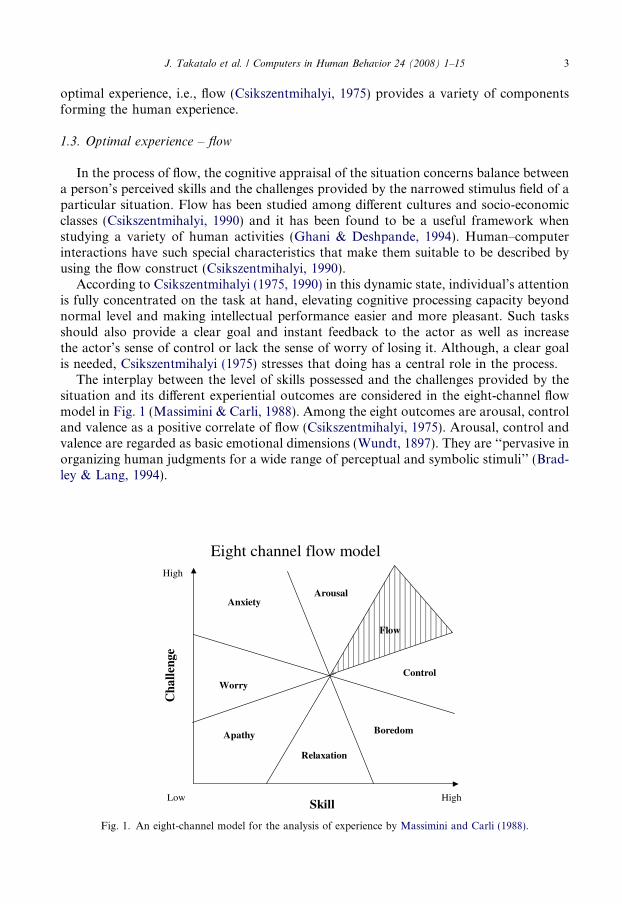
The interplay between the level of skills possessed and the challenges provided by thesituation and its different experiential outcomes are considered in the eight-channel flowmodel in Fig. 1 (Massimini & Carli, 1988). Among the eight outcomes are arousal, controland valence as a positive correlate of flow (Csikszentmihalyi, 1975). Arousal, control andvalence are regarded as basic emotional dimensions (Wundt, 1897). They are ‘‘pervasive inorganizing human judgments for a wide range of perceptual and symbolic stimuli’’ (Brad-ley & Lang, 1994).
Eight channel flow model
Skill
Cha
lleng
e
Low High
High
Apathy Boredom
Relaxation
Control
ArousalAnxiety
Worry
Flow
Fig. 1. An eight-channel model for the analysis of experience by Massimini and Carli (1988).

4 J. Takatalo et al. / Computers in Human Behavior 24 (2008) 1–15
The eight-channel flow model also shares similarities with functional theories ofemotion (e.g., Ellsworth & Smith, 1988; Frijda, 2000; Lazarus, 1991). These theories con-sider two different levels of situational appraisals. First, the situation is evaluated in termsof goals and concerns at a given time to the perceiver (Lazarus, 1991). Secondly, a varietyof contextual appraisal components, e.g., pleasantness and sense of control, are combinedand evaluated to determine which emotion is detached to a particular situation (Ellsworth& Smith, 1988).
1.4. Presence and flow
Previously the two concepts have been studied interdependently in an interculturalinteraction in real life (Fontaine, 1992). (Tele)presence has been assumed to be a specialtype of flow experience that occurs during teleoperations (Draper et al., 1998). However,there are only few studies, in which presence and flow have been examined together inmediated environments. In Novak, Hoffman, and Yung (2000) structural model of userexperience in WWW, presence was measured with an eight item Self-reported TelepresenceScale (Kim & Biocca, 1997) and interactivity was measured only in terms of its speed.However, the components used in Novak et al. (2000) study to measure flow integrateda great deal of information from previous flow studies. Thus, their measure of flow couldbe considered quite comprehensive. The two studies of Gaggioli, Bassi, and Della Fave(2003) (no results available in January 2005) measured presence with Independent Televi-sion Commission-Sense of Presence Inventory (ITC-SOPI) by Lessiter, Freeman, Keogh,and Davidoff (2001) and flow with Flow Questionnaire (Csikszentmihalyi, 1975; DelleFave & Massimini, 1988).
In Novak et al. (2000) study challenge and arousal formed one higher order constructand skill and control formed another. They found, that greater skill, challenge and(tele)presence correspond directly to a greater flow. A significant relationship was alsofound between interactive speed and flow. Interactive speed was also positively relatedto challenges, which affected the focus of attention. Novak et al. (2000) concluded thata better measurement of presence as well as interactivity is needed to fully investigatethe relationship between the concepts.
1.5. Framework for a human experience in VEs
The purpose of this study was to find a way to profile patterns of various experiencesreceived from the VE by using different components of both physical presence and flow.These included the ‘Big three’ (Laarni, 2003) physical presence components: the realnessof the VE (presence as realism), the ability of the VE to induce a sense of spatial awarenessto the user (presence as transportation) and the users psychological immersion, i.e., atten-tion to the VE instead of the real world (presence as immersion). These components havebeen extracted in two factor analytical studies (Lessiter et al., 2001; Schubert, Friedmann,& Regenbrecht, 2001). According to Schuemie et al. (2001) Igroup Presence Questionnaire(IPQ) by Schubert et al. (2001) and ITC-SOPI by Lessiter et al. (2001) the two question-naires introduced in these studies, are considered valid and reliable in the context of mea-suring the presence construct. Physical presence components were thought to coverperceptual and attentional aspects of being in the VE.

J. Takatalo et al. / Computers in Human Behavior 24 (2008) 1–15 5
Other components included were measures of skill, challenge, personal relevance, threedifferent aspects of interaction as well as arousal and control. These cognitive-emotionaland motivational components were thought to deepen the understanding concerning thequality, intensity, value and meaning of the VE experience to the user. Also simple feelingscales measuring positive and negative feelings from the VE exposure were used. Positivefeelings were valence, pleasant, impressed, playfulness, social richness of the medium (partof media richness) and sense of being there. Negative feelings were VE distracted andanxiety. These scales were used as a frame of reference for the framework composed ofpresence and flow components.
2. Methods
2.1. Technology used
The study was conducted in the Experimental Virtual Environment (EVE), hosted bythe Helsinki University of Technology (http://eve.hut.fi). EVE is a CAVE�-type system,in which three 3 · 3 m walls surround the user. The participants were able to interact withthe 3D-environment by a radio mouse, which was equipped with a six degrees of freedomtracking device. Before entering the EVE, all the participants were familiarized with theinstructions of how to use the radio mouse. The software used was a modified versionof the HCNav by Laakso (2001). The participants heard the few sounds used troughEVE’s 3D-audio system. For a more comprehensive description of the software and hard-ware used, see Laakso (2001) and Jalkanen (2000).
2.2. Participants
An e-mail invitation to the test was sent to the psychology and cognitive sciencestudents in the University of Helsinki and to the staff list of the CSC-Finnish IT Centrefor Science. The mail included an encouragement to forward it to all that might be inter-ested in VEs. The resulting amount of participants in the study was 68 (43 males (63.2%)and 25 (36.8%) females). The age of the participants ranged from 18 to 45 (M = 28.15years, SD = 5.50).
2.3. Task and procedure
The procedure started with a rehearsing period. Participants were instructed, if neces-sary, in finding an effective way to move around the EVE. The actual task was to go intothe virtual five-bedroom house and explore it to find objects that do not belong into anormal house. In the house, there was no collision detection, thus the participants wereable to walk trough walls and furniture. However, they were not encouraged to do so.There was only one ‘‘wrong’’ object at the time and when it was found the participantswere instructed to collide it. The collision made an object disappear and produced a weaksound. At the same time another object turned up somewhere else in the house. There werea total of 11 objects in EVE. The idea of the task was to provide the participants mean-ingful activity in a virtual world for approximately 15 min. The whole procedure inEVE took 20–25 min. Afterwards the participants were asked to fill in the EVE – Experi-ence Questionnaire (EVEQ).

6 J. Takatalo et al. / Computers in Human Behavior 24 (2008) 1–15
2.4. EVE – Experience questionnaire (EVEQ)
The items of the EVEQ were collected from the various questionnaires published indifferent articles (Fontaine, 1992; Havlena & Holbrook, 1986; Ghani & Deshpande,1994; Kim & Biocca, 1997; McQuarrie & Munson, 1992; Novak et al., 2000; Usoh,Catena, Arman, & Slater, 2000; Webster & Martocchio, 1992; Witmer & Singer, 1998).Some of the items were collected from the various WWW pages. The IPQ (Schubertet al., 2001) was found from the http://www.igroup.org/pq/ipq/ and Television question-naire (TQ) (Lombard et al., 2000) from http://astro.temple.edu/~lombard/P2qstnre.docSome of the items were created in this study. Because the ITC-SOPI (Lessiter et al.,2001) is not available publicly in the WWW, permission to use it was asked from theauthors and some of its items were used in this study.
All the items were translated from English or Germany into Finnish. Those items havingthe same semantic meaning but different grammatical form were combined into one item.The aim of the combination was to reduce items but keep those measuring different aspectsof the same phenomena. Most of the items from different questionnaires were transformedinto a seven-point Likert-scale (1 = Strongly Disagree to 7 = Strongly Agree). Also seven-point semantic differentials were used. In the final version the different items were blended.
2.5. Construction of the scales
Altogether, 124 EVEQ – variables were reduced into 19 uni-dimensional scales(Table 1). All the scales were formed in a principal factors analysis (PFA). Since the desir-able subject to variable ratio in a factor analysis is 1:5 (Tabachnick & Fidell, 1996) a PFAwas conducted for the part of the data and the factor scores with Bartlett’s method werecomputed. The small amount of subjects restricted the maximum amount of variables inone PFA to 13.
Because of the formation method, the criterions to include a variable into a PFA werecritical. The variables were first grouped according to their usage in previous studies. Thefit of a variable to the semantic meaning of the rest of the group was considered important.The fit of a group of variables to a PFA was measured with Kaiser–Meyer–Olkin (KMO)measure of sampling adequacy and Bartlett’s test of sphericity. KMO measures for all thefactors were well above the critical threshold of 0.50. Also in every case the Bartlett’s testwas significant (p < 0.001). Only those variables loading above 0.30 to the first factor werekept in a scale (Tabachnick & Fidell, 1996). Factors explained 45–60% of the total vari-ance and in most of the cases the second highest factor in the solution had an eigenvalueless than 1.0. The internal reliability of the formed scales was measured by using the Cron-bach’s alpha. For more detailed description of EVEQ and scales used the reader is referredto Takatalo (2002).
3. Results
3.1. Three experiential dimensions
The relationship between the 11 presence, interaction and flow scales was explored in as ofa second order principal factor analysis (Table 2). Varimax rotation was used to rotate thesolution. The critical cut-off level to include a variable into a factor was 0.30 as recommended

Table 1A short description, alphas and number of items of the 19 scales used in this study
Scale Alpha Number ofitems
Scales for physical presence, interaction and flow
Spatial (presence as transportation, spatial awareness, in side a place) 0.84 9Attention (presence as immersion, concentration to the VE in stead of the real
world, loss of time)0.90 11
Real (presence as realness, VE was live and vivid) 0.83 6Action (active participant in VE, not passive, VE induced real motion feelings) 0.82 7Interaction SMR (evaluation of the VE interaction speed, mapping and range) 0.81 4Exploration (ability to explore the VE) 0.74 3Skill (perceived skill to use and act in VE) 0.91 11Challenge (perceived challenges provided by the VE) 0.84 6Personal relevance (involvement, importance, motivation and meaning) 0.87 7Control (sense of control over situation) 0.82 4Arousal (level of arousal evoked by the situation) 0.67 4
Simple scales for different feelings
Valence (ranging from negative to positive) 0.86 5Playful (creative, free, flexible, natural, live ) 0.85 9Being there (visited a virtual place in stead of being in a lab) 0.84 5Impressed (strong experience, VE was like magic, exciting) 0.87 9Pleasant (being and acting in VE was enjoy able and pleasant) 0.77 6Social richness (part of media richness, e.g., how warm, close and sensitive the
media is experienced)0.84 7
Anxiety (acting and being in VE evoked anxiety and frustration) 0.82 7VE distracted (interface awareness, VE was difficult – easy to use ) 0.61 4
Table 2Structure matrices, eigenvalues and explained variances of the three dimensions of virtual experience
Scale Factor
1 2 3
Factor 1: physical presence
Spatial 0.89 0.01 0.27Action 0.82 0.30 0.10Attention 0.72 0.08 0.17Real 0.71 0.22 0.13Arousal 0.52 0.28 0.16
Factor 2: situational involvement
Challenge 0.24 0.77 �0.09Personal relevance 0.08 0.58 0.03Interaction SMR 0.44 0.49 0.17
Factor 3: competence
Exploration 0.25 0.08 0.60Control 0.14 0.18 0.59Skill 0.07 �0.20 0.55
Eigen value of the factor 4.35 1.66 1.18Variance explained by each factor 39.52% 15.10% 10.75%
J. Takatalo et al. / Computers in Human Behavior 24 (2008) 1–15 7

8 J. Takatalo et al. / Computers in Human Behavior 24 (2008) 1–15
by Tabachnick and Fidell (1996). The factorability of the matrix was inspected with KMO(0.77) and the Bartlett’s test of sphericity (p < 0.001). Three factors with an eigenvaluegreater than 1.0 were extracted and factor scores with Bartlett’s method were computed.The factors were named as Physical presence, Situational involvement and Competence.Factor scores were used as scales to measure different user experiences. Internal reliabilities(Cronbach’s alpha) for the scales were, respectively, 0.87, 0.67 and 0.61.
3.2. Experiential groups of participants
To study various patterns of experiences among the participants, they were groupedaccording to 11 scales forming the above three dimensions. The groups were formed ina hierarchical cluster analysis using the Squared Euclidean distance measure. The stan-dardized z-score of each variable was used in the analysis to eliminate the bias of the,e.g., differences in standard deviations and different type of scales used in the questionnaire(semantic differentials and seven-point Likert-scales) (Hair, Anderson, Tatham, & Black,1995).
The agglomeration schedule of the Ward’s linkage supported a three clusters solution.However, a five clusters solution provided a richer depiction of the studied phenomena,serving the purposes of this study better. This type of an explorative use of the cluster anal-ysis is supported by, e.g., Hair et al. (1995). Also significant differences (ANOVA) betweenthe group means in all given scales justified the extracted solution (Table 3). The groupsdid not differentiate in any background variables (age, sex, education, computer userelated questions or VR related questions).
3.3. Experiential content of the different groups
High and steady profiles in three experiential dimensions were associated with higherscores in positive simple scales and lower in negative ones. Although, Groups 1 and 5had differences in simple scale radars, their experiential content was considered positiveas compared to the ‘middle’ groups, Groups 2, 3 and 4 (Fig. 2). Group 5 scored abovesample mean in all three dimensions. Group 1 did not score above the group mean inCompetence, but its profile in three dimensions can be regarded relatively high and steady.Characteristics for the ‘middle’ groups were high scores in one of the dimensions and lowscores in other two. The simple scale radars of these groups were also incoherent. Thesewere indications of problems during the visit in VE.
To further inspect the differences between the positive and problem groups, Groups 1and 5 were contrasted to each ‘middle’ group and Group 3 to Groups 2 and 4. Contrastssuggested that Group 2 was competent but not physically present (t(63) = 7.14, p < 0.001)or situationally involved (t(63) = 3.84, p < 0.001). Group 4 was situationally involved butnot competent (t(63) = 4.71, p < 0.001) or physically present (t(63) = 9.67, p < 0.001).Group 3 scored lower in Physical presence (t(63) = 2.73, p < 0.01), Situational involve-ment (t(63) = 5.03, p < 0.001) and Competence (t(63) = 6.20, p < 0.001) as contrasted toGroups 1 and 5. However, it scored higher in Physical presence (t(63) = 4.30, p < 0.001)but lower in Situational involvement (t(63) = 3.30, p < 0.01) and Competence(t(63) = 4.01, p < 0.001) than the other ‘middle’ groups 2 and 4.
The simple scale scores indicated that the quality of the experience was negative amongthe competent members of the Group 2. Although, they were not distracted by VE as
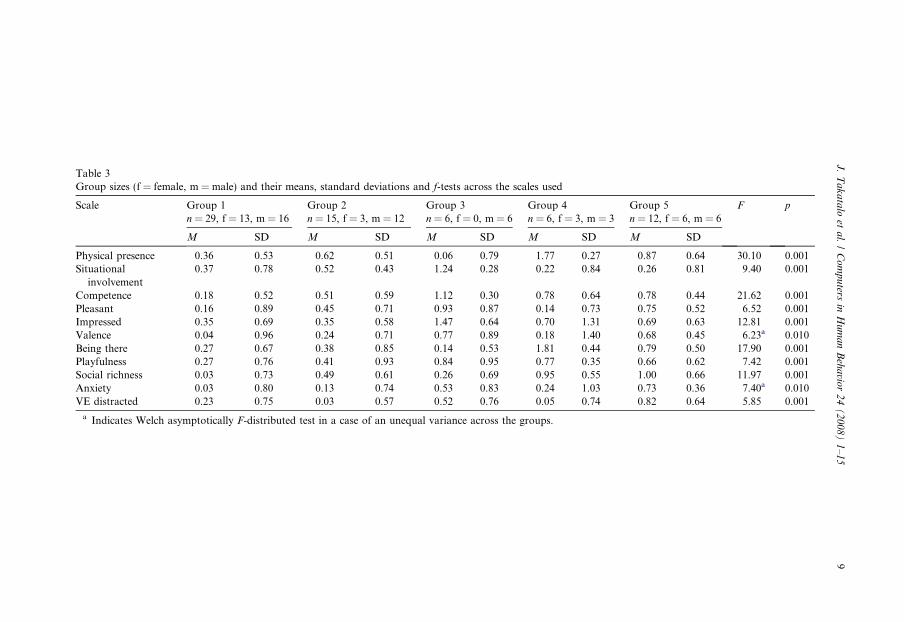
Table 3Group sizes (f = female, m = male) and their means, standard deviations and f-tests across the scales used
Scale Group 1 Group 2 Group 3 Group 4 Group 5 F p
n = 29, f = 13, m = 16 n = 15, f = 3, m = 12 n = 6, f = 0, m = 6 n = 6, f = 3, m = 3 n = 12, f = 6, m = 6
M SD M SD M SD M SD M SD
Physical presence 0.36 0.53 �0.62 0.51 �0.06 0.79 �1.77 0.27 0.87 0.64 30.10 0.001Situational
involvement0.37 0.78 �0.52 0.43 �1.24 0.28 0.22 0.84 0.26 0.81 9.40 0.001
Competence �0.18 0.52 0.51 0.59 �1.12 0.30 �0.78 0.64 0.78 0.44 21.62 0.001Pleasant 0.16 0.89 �0.45 0.71 �0.93 0.87 �0.14 0.73 0.75 0.52 6.52 0.001Impressed 0.35 0.69 �0.35 0.58 �1.47 0.64 �0.70 1.31 0.69 0.63 12.81 0.001Valence 0.04 0.96 �0.24 0.71 �0.77 0.89 �0.18 1.40 0.68 0.45 6.23a 0.010Being there 0.27 0.67 �0.38 0.85 �0.14 0.53 �1.81 0.44 0.79 0.50 17.90 0.001Playfulness 0.27 0.76 �0.41 0.93 �0.84 0.95 �0.77 0.35 0.66 0.62 7.42 0.001Social richness 0.03 0.73 �0.49 0.61 �0.26 0.69 �0.95 0.55 1.00 0.66 11.97 0.001Anxiety �0.03 0.80 0.13 0.74 0.53 0.83 0.24 1.03 �0.73 0.36 7.40a 0.010VE distracted 0.23 0.75 �0.03 0.57 0.52 0.76 0.05 0.74 �0.82 0.64 5.85 0.001
a Indicates Welch asymptotically F-distributed test in a case of an unequal variance across the groups.
J.
Ta
ka
talo
eta
l./
Co
mp
uters
inH
um
an
Beh
avio
r2
4(
20
08
)1
–1
59

0
1
2
3
PLAYFULL
VALENCE
ANXIETY
PLEASANT
SOCIALRICHNESS
IMPRESSED
BEING THERE
VEDIS- TRACTED
0
1
2
PLAYFULL
VALENCE
ANXIETY
PLEASANT
SOCIALRICHNESS
IMPRESSED
BEING THERE
VEDIS- TRACTED
0
1
2
3 3
PLAYFULL
VALENCE
ANXIETY
PLEASANT
SOCIALRICHNESS
IMPRESSED
BEINGTHERE
VEDIS- TRACTED
0
1
2
3
PLAYFULL
VALENCE
ANXIETY
PLEASANT
SOCIALRICHNESS
IMPRESSED
BEING THERE
VEDIS-TRACTED
0
1
2
3
PLAYFULL
VALENCE
ANXIETY
PLEASANT
SOCIALRICHNESS
IMPRESSED
BEINGTHERE
VEDIS- TRACTED
-2
-1.5
-1
-0.5
0
0.5
1
1.5
PHYSICALPRESENCE SITUATIONAL INVOLVEMENT COMPETENCE
1 2 3 4 5
Fig. 2. Mean profiles of the three experiential dimensions and eight simple scales among the five groups.
10 J. Takatalo et al. / Computers in Human Behavior 24 (2008) 1–15
compared to the members of positive groups 1 and 5, their experience was less pleasant(t(63) = 3.75, p < 0.001), more negative in valence (t(24.77) = 2.79, p = 0.01) and moreanxious (t(20.68) = 2.44, p < 0.05). The members of the Group 2 did not feel of being there(t(63) = 4.44, p < 0.001), playfulness (t(63) = 3.67, p < 0.001) or social richness(t(63) = 4.81, p < 0.001). Nor were they impressed by the VE (t(63) = 3.87, p < 0.001).
The experience of the situationally involved members in Group 4 was as pleasant, posi-tive in valence and low in anxiety as those of the Groups 1 and 5. The VE did not distractthem. Although, Group 4 had a positive experience in VE, the quality of their experiencewas not as rich as compared to those of Groups 1 and 5. Members of the Group 4 did notfeel of being there (t(63) = 7.95, p < 0.001), playfulness (t(63) = 3.61, p < 0.01) or socialrichness (t(63) = 5.00, p < 0.001). Neither were they impressed by the VE (t(63) = 3.78,p < 0.001).
The somewhat physically present Group 3 differentiated from Groups 1 and 5 in allsimple scales. Their experience was unpleasant (t(63) = 4.01, p < 0.001), more negativein valence (t(5.95) = 2.96, p < 0.05) and more anxious (t(5.73) = 2.59, p < 0.05). The mem-bers of the Group 3 did not feel of being there (t(63) = 2.28, p < 0.05), playfulness(t(63) = 3.82, p < 0.001), social richness (t(63) = 2.62, p < 0.001) and they were notimpressed (t(63) = 3.78, p < 0.001). Although, the experience of the Group 3 was negativeand poor as compared to Groups 1 and 5, they were more impressed (t(63) = 2.76,p < 0.01) and felt more of being there (t(63) = 3.04, p < 0.01) as compared to other ‘mid-dle’ groups (Groups 2 and 4).
4. Conclusions
A three dimensional framework to profile various experiences received from the VE wasformed and tested. This explorative framework provides a holistic method to measure userexperience by integrating perceptual, attentional, cognitive-affective and motivationalcomponents. The applied components have previously been used in studies measuringphysical presence and flow in mediated environments. Thus, the framework was named

J. Takatalo et al. / Computers in Human Behavior 24 (2008) 1–15 11
as Presence-Flow-framework (PFF). Based on the PFF, the various experiences of the 68participants were grouped into five experiential groups. These groups showed that com-mon patterns of various experiences could be found and study to understand more aboutthe effects of the VE to the users.
Participants having high and steady PFF-profile were considered to have feelings ofbeing in VE and being active in there, perceiving VE to be real in some level and attractingtheir attention as well as inducing their arousal. They regarded VE personally relevant andevaluated it challenging and giving feedback from their actions, thus involving them andmotivating them to act. All this was combined with the sense of control over situation aswell as skill to explore VE without constraints. The simple feeling scale scores verified thePFF-findings. These participants experienced VE as pleasant and playful, they did not feelany anxiety and they were more impressed than distracted by the VE. They also consideredVE as a media socially richer and felt that they visited a computer-generated place insteadof staying in a lab during the test. These participants experienced VE emotionally moreinvolving and had qualitatively rich and positive experience. Their experience includedaspects of both presence and flow.
To further analyze the causes and effects of the unsteady PFF-profiles of some of theparticipants is out of the scope of this study. It is concluded that being physically present,situationally involved or competent is not alone enough to create a positive and rich expe-rience in VE. The participants having unsteady profile lacked feelings of playfulness andbeing there. VE was not regarded as impressive or socially rich. In some cases the experi-ence was unpleasant, negative in valence and anxious. Some of these participants experi-enced, at least in some extent, physical presence but not flow. This indicates the role ofpresence as a prerequisite of flow in mediated environments (Novak et al., 2000).
4.1. Presence-flow-framework (PFF)
The three dimensions of the PFF were named as Physical presence, Situational involve-ment and Competence. The first dimension of the framework included perceptual experi-ences from the VE. The following two dimensions included cognitive evaluationprocesses concerning the content of the VE in terms of personal relevance, situationalopportunities for action and one’s personal abilities and capabilities while facing theseopportunities. Two latter factors extend the eight-channel flow model (Massimini & Carli,1988) by integrating the evaluation of the interactivity of the VE and personal relevanceinto it. Such interplay between different environmental appraisals in generating experiencesshares similarities with appraisal theories of emotion (Ellsworth & Smith, 1988; Lazarus,1991).
The framework also included two out of the three basic emotions: arousal and control.The third basic emotional component, Valence, was left out from the framework andreferred to the profiles of the framework. Although, an orthogonal rotation was used toextract the dimensions there was item cross-loadings between the factors, which are consid-ered while the content of the three dimensions is evaluated.
4.2. Physical presence
The first dimension included the ‘Big three’ (Laarni, 2003) physical presence components(Spatial, Attention, Real) consisting of items similar to those suggested by previous factor
12 J. Takatalo et al. / Computers in Human Behavior 24 (2008) 1–15
analytical studies (Lessiter et al., 2001; Schubert et al., 2001). Included was also a scale mea-suring the feeling of acting (Action). Some of the items forming both Spatial and Action inthis study were included into a Sense of Physical Space – factor in the Lessiter et al. (2001)study. The close relationship between these two bolsters the notion of coupling betweenperception and action as suggested by the ecological views (Flach & Holden, 1998; Zahorik& Jenison, 1998). However, these two cross-loaded on different factors: Spatial was morerelated to competences user possesses and Action to involving opportunities the situationprovides. This shows how different perceptual aspects of physical presence are related tocognitive-affective evaluation process of user interaction.
Also arousal loaded on this dimension. This supports the close relationship betweenarousal and attentional system of a person (Kahneman, 1973). As the used VE was highlyimmersive, it also supports findings, that the media form itself has an impact on the levelof arousal (Simons, Detenber, Roedma, & Reiss, 1999). Dillon, Keogh, Freeman, andDavidoff (2000) concluded, that in some circumstances presence and physical arousalmight be related. They also stressed that these two are sensitive to different aspects ofmediated experience.
4.3. Situational involvement
Second dimension consisted of scales concerning involving aspects of being and actingin VE. Included were situational evaluations in terms of personal relevance, challengesprovided by the environment and its interaction speed, mapping and range (SMR) assuggested by Steuer (1992). The relationship between these three was supported in Novaket al. (2000) study, which also presented a close relationship between challenge and arou-sal. In the present study arousal cross-loaded in Situational involvement-dimension andchallenge and interaction SMR cross-loaded on the Physical presence-dimension. Thisindicates a close relationship between physical presence, interactivity and challengesprovided by the situation. It also shows that arousal is affected by both the form as wellas the content of the VE. The role of the personal relevance in PFF should be examinedmore carefully in future studies.
4.4. Competence
Competence-dimension evaluated environment in terms of user’s potential in the situ-ation: perceived skills, sense of control and using those skills in the environment, i.e., toexplore it. The relationship between skills and control is consistent with previous studies(Ghani & Deshpande, 1994; Novak et al., 2000). Exploration, one form of interaction,cross-loaded on the Physical presence-dimension. This strengthens the relationshipbetween interactivity and presence. Novak et al. (2000) also found a positive relationshipbetween personal relevance (importance) and skill. However, in this study personal rele-vance did not cross-load to the Competence-dimension.
4.5. Future work
This study provided a new viewpoint to investigate a holistic human experience in VEs.Although, a larger sample would have ease the statistical analysis, the attempt to profileuser experiences presented here showed promising results. These results were bolstered

J. Takatalo et al. / Computers in Human Behavior 24 (2008) 1–15 13
by the previous presence and flow studies. To understand more about the causes andeffects of the dynamical process leading to different experiences in VEs needs more detailedexamination of the PFF-dimensions. The framework should also be tested with differentmedia forms and contents as well as context of use.
As the PFF is applied to different kinds of media and context of use it is likely to needmodification accordingly. More components and even a fourth or fifth dimensions areneeded. One extra dimension could be an emotional involvement-dimension includingfeeling scales such as valence. Because of the small sample-size these were introduced hereas the point of reference to the current framework. Also measures covering specific aspectsof presented content, e.g., social interaction should be included when necessary. The devel-opmental process of the PFF should also include alternative methods to confirm thePFF-findings. Such methods could be measures of immersive tendencies (Witmer &Singer, 1998), qualitative data from the interviews and objective measures, e.g., behavioraldata. The development of the framework for studying user experiences in VEs alsoincreases the knowledge on how different experiences are related to our attitudes, beliefs,interpretations, expectations, values, goals and in the end behaviors that are created in ahuman–computer interaction.
In the future, the limitless imagination of the mankind produces new devices with goodgraphics and audio. The added value of these devices depends greatly on how well they arecapable of capturing the essential psychological phenomena producing desirable experi-ences. Although, these devices differ greatly from the applications like EVE, the basicinteraction dynamics affecting the user experience are likely to be present. As the theoryand practice concerning the human experience in mediated environments develops, theimpact of these environments on our daily life can be better evaluated and designed tomeet the needs of the user.
Acknowledgements
This project was conducted in co-operation between the CSC-Finnish IT Center forScience, the Telecommunication software and Multimedia Laboratory (TML) of the Hel-sinki University of Technology and the Psychology of the Digital Life-group in Depart-ment of Psychology at the University of Helsinki. The authors would like to thankJyrki Hokkanen and Jarmo Pirhonen from CSC and Matti Grohn, Tommi Ilmonenand Mikko Laakso from TML, who helped us out with the technology. Special thanksto Jukka Hakkinen from the Nokia Research Center from the psychological insight andPertti Keskivaara from the Department of Psychology at the University of Helsinki fromthe help with the stats. The Finnish Cultural Foundation provided financial help for thearticle work.
References
Bradley, M. M., & Lang, P. J. (1994). Measuring emotions: the self-assessment mankind and the semanticdifferential. Journal of Behavior Therapy and Experimental Psychiatry, 25, 49–59.
Csikszentmihalyi, M. (1975). Beyond boredom and anxiety: Experiencing flow in work and play. San Fransisco:Jossey-Bass.
Csikszentmihalyi, M. (1990). Flow: The psychology of optimal experience. New York: Harper and Row.Damasio, A. (1994). Descartes’ error: Emotion, reason and the brain. New York: Grosset/Putnam.
14 J. Takatalo et al. / Computers in Human Behavior 24 (2008) 1–15
Delle Fave, A., & Massimini, F. (1988). Modernization and the changing contexts of flow in work and leisure. InM. Csikszentmihalyi & I. Csikszentmihalyi (Eds.), Optimal experience: Psychological studies of flow in
consciousness (pp. 193–213). New York: Cambridge University Press.Dewey, J. (1934). Art as experience. New York: Minton, Balch & Company.Dillon, C., Keogh, E., Freeman, J., & Davidoff, J. (2000). Aroused and immersed: the psychophysiology of
presence. Paper presented at the presence 2000 workshop, March 27–28, Delft, The Netherlands. RetrievedNovember 2000 from the WWW: http://www.presence-research.com.
Draper, J. V., Kaber, D. B., & Usher, J. M. (1998). Telepresence. Human Factors, 40, 354–375.Ellsworth, P. C., & Smith, C. A. (1988). From appraisal to emotion: differences among unpleasant feelings.
Motivation and Emotion, 12, 271–302.Flach, J. M., & Holden, J. G. (1998). The reality of experience: Gibson’s way. Presence: Teleoperators and Virtual
Environments, 7, 90–95.Fodor, J. A., & Pylyshyn, Z. W. (1981). How direct is visual perception? Some reflections on Gibson’s ‘‘ecological
approach’’. Cognition, 9, 139–196.Fontaine, G. (1992). The experience of a sense of presence in intercultural and international encounters. Presence:
Teleoperators and Virtual Environments, 1, 482–490.Freeman, J., Avons, S. E., Meddis, R., Pearson, D. E., & IJsselsteijn, W. (2000). Using behavioural realism to
estimate presence: a study of the utility of postural responses to motion-stimuli. Presence: Teleoperators and
Virtual Environments, 9, 149–164.Frijda, N. (2000). The psychologist point of view. In M. Lewis & J. M. Haviland-Jones (Eds.), Handbook of
emotions (pp. 59–74). New York: Guilford.Gaggioli, A., Bassi, M., & Della Fave, A. (2003). Quality of experience in virtual environments. In G. Riva, F.
Davide, & W. A. Ijsselsteijn (Eds.), Being there: Concepts, effects and measurement of user presence in synthetic
environments (pp. 4–14). Amsterdam: IOS Press.Ghani, J. A., & Deshpande, S. P. (1994). Task characteristics and the experience of optimal flow in human–
computer interaction. The Journal of Psychology, 128, 381–391.Glenberg, A. M. (1997). What memory is for. Behavioral and Brain Sciences, 20, 1–19.Hair, J. F., Anderson, R. E., Tatham, R. L., & Black, W. C. (1995). Multivariate data analysis with readings. New
Jersey: Prentice-Hall, Inc..Havlena, W. J., & Holbrook, M. B. (1986). The varieties of consumption experience: comparing two typologies of
emotion in consumer behavior. Journal of Consumer Research, 13, 394–404.Huang, M. P., & Alessi, N. E. (1999). Presence as an emotional experience. In J. D. Westwood, H. M. Hoffman,
R. A. Robb, & D. Stredney (Eds.), Medicine meets virtual reality: The Convergence of physical and
informational technologies options for a new era in healthcare (pp. 148–153). Amsterdam: IOS Press.IJsselsteijn, W., deRidder, H., Freeman, J., & Avons, S. E. (2000). Presence: concept, determinants and
measurement. In: Proceedings of the SPIE, human vision and electronic imaging V (pp. 3959–3976). Presentedat photonics west – human vision and electronic Imaging V, January 23–28, San Jose, USA.
Jalkanen, J. (2000). Building a spatially immersive display-HUTCAVE. Licenciate Thesis, Helsinki University ofTechnology, Espoo, Finland.
Kahneman, D. (1973). Attention and effort. Englewood Cliffs, NJ: Prentice-Hall.Kim, T., & Biocca, F. (1997). Telepresence via television: two dimensions of telepresence may have different
connections to memory and persuasion. Journal of Computer-Mediated Communication, 3(2).Laakso, M. (2001). Practical navigation in virtual architectural environments. Master’s Thesis, Helsinki
University of Technology, Espoo, Finland.Laarni, J. (2003). Measuring spatial presence. Presentation in seminar on perception and user interfaces, May 22,
University of Helsinki, Finland.Lazarus, R. S. (1991). Progress on a cognitive–motivational–relational theory of emotion. American Psychologist,
46, 819–833.Lessiter, J., Freeman, J., Keogh, E., & Davidoff, J. D. (2001). A cross-media presence questionnaire: the ITC-
sense of presence inventory. Presence: Teleoperators and Virtual Environments, 10, 282–297.Lobard, M., & Ditton, T. (1997). At the heart of it all: the concept of presence. Journal of Computer-Mediated
Communication, 3(2).Lombard, M., Ditton, T. B., Crane, D., Davis, B., Gil-Egui, G., Horvath, K. et al. (2000). Measuring presence: a
literature-based approach to the development of a standardized paper-and-pencil instrument. Paper presentedat the presence 2000 workshop, March 27–28, Delft, The Netherlands. Retrieved March 2001 from theWWW: http://nimbus.temple.edu/~mlombard/P2000.htm.
J. Takatalo et al. / Computers in Human Behavior 24 (2008) 1–15 15
Massimini, F., & Carli, M. (1988). The systematic assessment of flow in daily experience. In M. Csikszentmihalyi& I. Csikszentmihalyi (Eds.), Optimal experience: Psychological studies of flow in consciousness (pp. 288–306).New York: Cambridge University Press.
McQuarrie, E. F., & Munson, J. M. (1992). A revised product involvement inventory: improved usability andvalidity. Advances in Consumer Research, 19, 108–115.
Novak, T. P., Hoffman, D. L., & Yung, Y. F. (2000). Measuring the customer experience in online environments:a structural modeling approach. Marketing Science, 19, 22–44.
Schubert, T. W., Friedmann, F., & Regenbrecht, H. (1999). Embodied presence in virtual environments. In R.Paton & I. Neilson (Eds.), Visual representations and interpretations (pp. 268–278). London: Springer-Verlag.
Schubert, T. W., Friedmann, F., & Regenbrecht, H. (2001). The experience of presence: factor analytic insights.Presence: Teleoperators and virtual environments, 10, 266–281.
Schuemie, M. J., van der Straaten, P., Krijn, M., & van der Mast, C. A. P. G. (2001). Research on presence invirtual reality: a survey. CyberPsychology & Behavior, 4, 183–201.
Simons, R. F., Detenber, B. H., Roedma, T. M., & Reiss, J. E. (1999). Emotion-processing in three systems: themedium and the message. Psychophysiology, 36, 619–627.
Steuer, J. (1992). Defining virtual reality: dimensions determining telepresence. Journal of Communication, 42,72–92.
Tabachnick, B. G., & Fidell, L. S. (1996). Using multivariate statistics. New York: Harper Collins Publishers.Takatalo, J. (2002). Presence and flow in virtual environments: An explorative study. Master’s Thesis, University
of Helsinki, Helsinki, Finland. Available on WWW: http://eve.hut.fi.Usoh, M., Catena, E., Arman, S., & Slater, M. (2000). Using presence questionnaires in reality. Presence:
Teleoperators and Virtual Environments, 9, 497–503.Visual thesaurus is created by the Cognitive Science Laboratory at Princeton University. Available on WWW:
http://www.visualthesaurus.com/online/index.html (November 2004).Webster, J., & Martocchio, J. J. (1992). Microcomputer playfulness: development of a measure with workplace
implications. MIS Quarterly, 16, 201–226.Witmer, B. G., & Singer, M. J. (1998). Measuring presence in virtual environments: a presence questionnaire.
Presence: Teleoperators and Virtual Environments, 7, 225–240.Wundt, W. M. (1897). Outlines of psychology [C.H. Judd, Trans.]. Retrieved April 2002 from the WWW: http://
psychclassics.yorku.ca/Wundt/Outlines/.Zahorik, P., & Jenison, R. L. (1998). Presence as being-in-the-world. Presence: Teleoperators and Virtual
Environments, 7, 78–89.