d23 final report - aroma-ist.upc.edu
TRANSCRIPT

D23: Final Report Page i
AROMA
AROMA
AROMA IST-4-027567 D23
Final Report
Contractual Date of Delivery to the CEC: 31-12-2007
Actual Date of Delivery to the CEC: 11-01-2008
Editor(s): Fernando Casadevall (UPC)
Participant(s): UPC, KCL, PTIN, TI, TID, TEL, IST-TUL
Workpackage: WP1
Est. person months: 0.5
Security: PU
Nature: Report
Version: 1.0
Total number of pages: 116
Abstract: This deliverable constitutes the final report of the project IST-4-027567 AROMA. After its successful completion, the project presents this document that firstly summarizes the context, goal and the approach objective of the project. Then it presents a concise summary of the major goals and results, as well as highlights the most valuable lessons derived form the project work. A list of deliverables and publications is included in the annex. For more detailed technical results please consider the public deliverables, available at http://www.aroma-ist.upc.edu Keyword list: Co-operation with other Projects, Concertation Activities

D23: Final Report Page ii
DISCLAIMER
The work associated with this report has been carried out in accordance with the highest technical standards and the AROMA partners have endeavoured to achieve the degree of accuracy and reliability appropriate to the work in question. However since the partners have no control over the use to which the information contained within the report is to be put by any other party, any other such party shall be deemed to satisfied itself as to the suitability and reliability of the information in relation to any particular use, purpose or application. Under no circumstances will any of the partners, their servants, employees or agents accept any liability whatsoever arising out of any error or inaccuracy contained in this report (or any further consolidation, summary, publication or dissemination of the information contained within this report) and/or the connected work and disclaim all liability for any loss, damage, expenses, claims or infringement of third party rights.
D23: Final Report Page iii
DOCUMENT HISTORY
Date Version Status Comments
17-12-2007 1.0 Int Draft for comments
7-01-2008 2.0 Int Final version for comments and approval by the PCC members
11-01-2008 1.0 Apr Submission to the E.U.

D23: Final Report Page iv
Table of Contents
1. Overview of General Project Objectives .................................................................................. 1 2. - Contractor Involved ..................................................................................................................... 7 3. - Work Performed.......................................................................................................................... 8 4. - End Results ................................................................................................................................ 10
4.1 AROMA QOS Framework ................................................................................................ 10 4.1.1 Coordinated Access Resource Management (CARM) ........................................ 12 4.1.2 CARM examples ........................................................................................................ 14 4.1.3 Conclusions on QoS Resource Management issues .......................................... 18
4.2 Radio Resource Management (RRM) ............................................................................ 18 4.2.1 Introduction ................................................................................................................. 18 4.2.2 Common Radio Resource Management (CRRM)................................................ 19 4.2.3 Intrinsic RRM Strategies ........................................................................................... 32
4.3 Automated Tuning Mechanisms ...................................................................................... 45 4.3.1 Functional Architecture ............................................................................................. 45 4.3.2 Parameter Optimisation ............................................................................................ 47 4.3.3 Conclusions on Automated Tuning mechanisms.................................................. 52
4.4 Resource Management in The Transport Network Layer ........................................... 53 4.4.1 Framework of the Study............................................................................................ 54 4.4.2 Resource Management & QoS Framework .......................................................... 57 4.4.3 Conclusions on Transport Layer Network.............................................................. 59
4.5 Implementation issues in resource management: AROMA’s approach.................... 59 4.5.1 RRM implementation aspects.................................................................................. 60 4.5.2 CRRM implementation aspects ............................................................................... 60 4.5.3 CARM implementation aspects. .............................................................................. 63 4.5.4 Conclusions on implementation issues .................................................................. 67
4.6 AROMA Testbed ................................................................................................................ 67 4.6.1 AROMA Testbed Overview....................................................................................... 68 4.6.2 Innovative Issues ....................................................................................................... 70 4.6.3 Feasible Trials ............................................................................................................ 76 4.6.4 Testbed Conclusions ................................................................................................. 77
4.7 Techno-economic aspects of RRM techniques in Heterogeneous Networks .......... 78 4.7.1 Addressed Methodology........................................................................................... 78 4.7.2 Economic impacts and business models of RRM mechanisms for micro-cell and WLAN usage within the 3G networks ............................................................................. 80 4.7.3 Qualitative techno-economic analysis of long-term all IP mobile network architecture evolution ................................................................................................................ 81 4.7.4 Techno-economic evaluation of mobile TV service over MBMS ........................ 83 4.7.5 Techno-economic evaluation of fittingness factor CRRM algorithm.................. 86 4.7.6 Conclusions on Techno-economic evaluation....................................................... 88
5 Main conclusions reached........................................................................................................ 90 Annex 1.- List of Publications ......................................................................................................... 97 Annex 2.- Relation with the Standards........................................................................................ 102 Annex 3: Patents ............................................................................................................................ 103 Acronym List..................................................................................................................................... 104
D23: Final Report Page v
EXECUTIVE SUMMARY This report summarises the main achievements of the AROMA Project, an IST research and technological development project carried out between January 2006 and December 2007 by Universitat Politécnica de Catalunya (UPC); King’s College London (KCL); Portugal Telecom Inovaçao (PTIN); Telecom Italia Lab (TILAB); Telefónica Investigación y Desarrollo (TID), TeliaSonera (TEL); Instituto Tecnico Superior-Technical University of Lisbon (IST-TUL).
The most important technical achievements of the project cover many different aspects related to Radio Resource and QoS Management and Common Radio Resource Management (CRRM) including both wireless and wired part. Different algorithms related to Admission Control, Congestion Control as well as on Packet Scheduling procedures have been proposed and evaluated for the envisaged Radio Access Technologies. Moreover issues related to the end-to-end QoS architecture have been also studied and evaluated. Besides the technical evolutions, some economic analyses have been carried out too in order to provide some guideline methodology for the estimation of the potential economic impacts of the main investigated solutions.
The Performance evaluation of the proposed QoS architecture and RRM/CRRM techniques was completed by means of a set of laboratory tests carried out using a real time testbed (Demonstrator) developed in the project. This Demonstrator is a SW/HW flexible tool, which provides a realistic real time emulation of an evolved B3G radio access system able to manage multimedia IP based applications. Finally, significant dissemination policy, based on publications on high quality magazines and conferences, was carried out. Moreover, several standards contributions were also generated and presented to the pertinent 3GPP technical committees.

D23: Final Report Page 1
1. Overview of General Project Objectives The provision of beyond 3G (B3G) heterogeneous network topologies is conceptually a very attractive notion. Certainly, the accommodation of a variety of access technologies will enable a network operator to optimise their coverage enabling network operators to offer services in a cost efficient manner for particular environments. In this context, Radio Resource Management (RRM) and Common RRM (CRRM) strategies are responsible for an utmost efficient utilisation of the air interface resources in the Radio Access Network (RAN) and pool of RANs respectively. In addition to that, to cope with the growing demand in data services, the RAN architectures should also be evolved to accommodate future IP-based networks, which allow a common transport even in different access networks, simple resource management, and easy heterogeneous inter-working. Then, in the IP part within the RAN architectures mechanisms ought to be in place, which allow an optimum routing of incoming traffic to the appropriate RAN. In that sense, there are two main topics to be addressed: mobility management and QoS. However the focus should not only be on a standalone IP transport plane but also on the interactions between the IP QoS entities and the radio entities of the access network (load balancing, QoS-aware handover, QoS mapping). Then, the objective of the AROMA project is to devise and assess a set of specific resource management strategies and algorithms for both the access and core network part that guarantee the end-to-end QoS in the context of an all-IP heterogeneous network. In order to achieve the former main objective, the following partial objectives will be addressed in the project:
To identify, propose, simulate, assess and validate advanced Radio Resource Management (RRM) algorithms for GERAN and UMTS as well as novel radio concepts beyond 3G (B3G). The study includes :
• To propose and evaluate RRM solutions for both HSUPA and HSDPA • To study the suitability of MBMS on dedicated channels (point to point) or broadcast channels (point to
multipoint) • To propose, develop and assess cross Layer RRM design concepts • To consider the inclusion of GERAN Rel-5 QoS-classes and WLAN IEEE802.11e and 802.11n
To develop Advanced Common RRM (CRRM), covering among other:
• CRRM algorithms exploiting the non-homogeneous system conditions along time, space, service dimension, user category dimension, terminal capabilities dimension, etc.
• Load-sharing CRRM algorithms using GERAN and UTRA MBMS
• Delay analysis in inter-RAT handover for given QoS classes and corresponding impact on CRRM as well as on handover/reselection delays
• CRRM algorithms and Cross layer RRM algorithms based in IP-RAN.
To propose simulate, assess and validate innovative end-to-end QoS strategies considering both radio and core network aspects under a variety of conditions, at least including:
MPLS and lower-layer interaction for end-to-end support
IP-RAN traffic engineering strategies
Mobility issues
To develop mechanisms allowing an automated tuning of the CRRM/RRM algorithms and corresponding parameters via network management software
To carry out economic evaluation on the impacts of the novel solutions considered by the project. The economic analysis will take into account three different subjects:
D23: Final Report Page 2
to give evidence of the potential economic advantages of using specific RRM/CRRM algorithms addressed by AROMA project
to evaluate potential economic advantages to migrate and converge towards the all-IP architecture with heterogeneous radio technologies, in terms of CAPEX (CAPital EXpenditure) and OPEX (OPerational EXpenditure)
to provide economic scenarios, hypothesis and parameters that can be taken into account by RRM/CRRM algorithms in order to define also economic-driven radio resource management algorithms and strategies
In summary AROMA aims at providing tangible contributions, in terms of resource management, for the future all IP heterogeneous wireless systems, which will take into account 2G/2.5/3G (e.g. GERAN, UTRAN and 3.5G networks (e.g. HSDPA), including the newly emerging RAN technologies (e.g. WLAN, WIMAX) and services, for the 2010-2015 time frame. In order to accomplish these objectives, the project evolves around two main activities:
(1) Algorithmic development and simulation by means of advanced simulation tools, and (2) Demonstration of the technology by means of implementing real-time testbeds for proof of concepts.
It is a further purpose of the project to contribute actively to the different standardisation fora. Results obtained in AROMA are expected to be of significant momentum, the beneficiaries to which are service-providers, operators, manufacturers and end-users. Research Challenges To date little work has been devoted in providing solid and publicly available Common RRM strategies. This is due to the fact that RRM and CRRM algorithms are not subject to standardisation, leading to an increase in competitiveness among the manufacturers. Further, the same can be said about solid end-to-end QoS issues, in this case probably because different bodies are standardising the IP and the radio segments. Nevertheless, tackling this problem in depth is a must for the future success of mobile scenarios. It is the aim of the project to provide solid advances in this field, allowing for a truly optimised end-to-end heterogeneous network deployment. The research challenges setting the framework for AROMA can thus be summarised as follows: • The way in that the all-IP architecture in a heterogeneous environment will impact on the users’ experiences
must be investigated, focusing on the study, measurement and proposal of solutions that optimize IP-based applications and services. The provision of new multimedia services seem to be an highly important issue for both operators and manufacturers, in order to analyse their impact on the all-IP network and to optimise the mechanisms to the users, who are accessing to them through different radio access networks. But not only multimedia services should be considered. Also novel services in Europe such as PoC (Push to talk Over Cellular) can be included.
• Solutions for end to end QoS inside heterogeneous environments are still immature. Newer solutions will
embrace support for additional functionalities like: admission control based on the service view of the user profile, use of real-time measurements for improving the guarantees of end to end QoS, enhancement of the mobility support inside single technology domains (since this is the most common type of mobility) and support for mobility across different technology domains, admission Control extended to support multicast, end to end QoS control in inter-domain scenarios, etc.
• In order to support end-to-end QoS in a heterogeneous wired and wireless mobile environment the
interaction between the QoS management entities of the core network (CN) and the CRRM in the radio part is of prime importance. In the legacy IST-Project EVEREST, a policy-based architecture has been proposed with QoS mechanisms dealing with the CN and RAN parts. The CN part assumes all-IP architecture with QoS mechanisms based on the Bandwidth Broker1 (BB) concept. The BB is the main architecture element of the control plane of the DiffServ model proposed by Internet Engineering Task Force (IETF) for supporting end-to-end QoS in IP-based networks. On the other hand, a new concept named “Wireless QoS Broker2”
1 The BB is a logical entity responsible for resource allocation in an administrative domain and coordinates inter-domain and intra-domain resource
allocation. For the inter-domain resource allocation, the BB of the CN should be aware of the resource requirements and resource availabilities of the peer CNs. For the intra-domain resource allocation, the BB of the CN should be aware of the resource availabilities of its underlying RANs
D23: Final Report Page 3
(WQB) is introduced for managing the resources of the radio access part within the framework of B3G networks. One of the most relevant functionalities associated with the WQB entity is the Common Radio resource Management (CRRM), which allows the management of the pool of radio resources belonging to the set of available RATs. In that context, the identification of the relevant functionalities of the involved entities, their mutual interactions and the development of algorithms is vital for a proper functioning of a heterogeneous network topology. Special emphasis will also be on proposing and evaluating advanced mobility management, including routing and addressing, in the case of heterogeneous access networks. The rational research approach endeavours to encompass the Radio Access Network (e.g. Wireless QoS Broker, RRM for single novel RAT, CRRM algorithms), the Core Network (e.g. Bandwidth Broker concepts for the envisaged architectures, Intra-CN-domain DiffServ Signalling Protocols, etc.) and a coupled architecture between both (e.g. comparative study on architecture and signalling issues, etc.).
• Another objective is to define an advanced All-IP hierarchical end-to-end architecture and to investigate
issues related to the inter-working of the core network and access part. In particular, the role and the functionalities to be included in the Bandwidth Broker (BB) and Wireless QoS Broker (WQB) for controlling the resources, used in the core network and the wireless access part respectively, will be assessed. More specifically, the following topics will be addressed: how to connect the relevant elements in the two entities; what type of signalling to use; what kind mechanism and the update frequency of the information held in the BB and WQB; what information is required and how to obtain and distribute it; how to translate the parameters of CRRM into the BB parameters; how to guarantee the end-to-end QoS perspective and reaction in due time; how to support different types of scenarios with a broad range of different types of QoS requests and requirements. Moreover, deployment and implementation aspects of the entities in a heterogeneous network will be investigated. The migration from legacy stand-alone WLAN and cellular systems will also be considered. As a result, it is envisaged to provide an abstraction layer from WQB to BB that hides technology details, but supports various types of communications (unicast, multicast, broadcast, symmetric, asymmetric) and different QoS flavours. This will feed control algorithms that will provide the end-to-end QoS control perspective.
• Further, the project will pursue to define assess and validate Common RRM (CRRM) algorithms within and between mobile and wireless systems (e.g. GERAN, UMTS and IEEE 802 standards). The CRRM focus on the plethora of access technologies within these families of standards will be evaluated, specifically addressing how the QoS can be handled by advanced CRRM in this complex and heterogeneous network topology. The feasibility to consider open APIs3 to allow the definition of RRM/CRRM algorithms in network nodes by operators or third-part companies, and ulterior API’s specification in case will also be covered.
• The overall aims and objectives of the AROMA project have been identified taking into account both the
most important medium-term novel solutions for 3G networks coming from 3GPP Release 5 / Release 6 and the most accepted long-term views and guiding principles for the evolution of beyond 3G mobile and wireless networks. The evolution of RAN beyond Release 6 should be a major step in 3G evolved system to be deployable from around 2010-2015. It is expected that the evolved 3G systems will be optimized for TCP/IP4 traffic with respect to latency and enhanced data throughput, through features like HSDPA, HSUPA and MBMS. In that context, optimised RRM algorithms for these new technologies are the only key to successfully handle highly loaded networks as the envisaged ones. The role of these new RRM algorithms should be to maximize the exploitation of these new features in order to achieve better performances.
In this framework, another objective of the project is to define, assess and validate specific solutions for the
optimization of radio protocols for IP traffic, mainly with respect to latency and enhanced data throughput (i.e. header compression algorithms, RAB5 setting optimization, MAC6 scheduling algorithms, etc.).
Similarly, the evaluation of RAN sharing strategies based on the 3GPP release 6 framework for UMTS will
also be dealt with. The RRM will be investigated for a multi-operator core network (MOCN) sharing the same RAN. Studying the mixed services and mixed operators situation in the shared network while keeping
2 The WQB functional entity can be seen as the counterpart of the BB for the radio part of the access network. The WQB embraces common radio
resource management functions and allows for dynamic coordination of QoS provisioning among the available radio access networks and the IP core network.
3 API’s .- Application Interfaces 4 TCP/IP.- Transport Control Protocol/Internet Protocol 5 RAB.- Radio Access Bearer 6 MAC.- Multiple Access Controller
D23: Final Report Page 4
specific QoS levels. The UMTS RAN sharing will be compared with WLAN sharing, where more than one service provider utilizes the same WLAN infrastructure for all users.
• In addition different service models do also need to exist for different categories of mobile services. Person-
to-content, person-to-person, and machine-to-machine type of services could, for example, require different service models to enable faster, more flexible and more cost efficient service provisioning. Moreover, using policy and control frameworks, applying flow based charging concepts, establishing the IMS framework, and providing different sorts of open interfaces, will be important tools for mobile operators to control how third party providers can provide their services Furthermore, for each aforementioned and emerging technology, there is a need to establish a mapping between equivalent bearers. This mapping will ease the definition of the inter-working from the services point of view.
• In the coming years, the increasing number of mobile users and the consequently expansion of the UMTS
radio coverage will increase the complexity associated with manual network radio management. Particularly, the network optimization process could imply the tuning of a large set of radio parameters in thousands of cells in the UMTS Terrestrial Radio Access Network (UTRAN) for evaluating the effects of a radio parameter on the network performance. Therefore, it is important to consider a new RRM/CRRM level: the dynamic tuning of the RRM/CRRM parameters. One of the objectives of the AROMA project is to establish a new and advanced methodology for 3G network automatic planning and optimization, based on innovative approaches of network simulation and optimization, which will enable 3G mobile operators to maximize their coverage, quality and capacity resulting in large economic benefits. These self-aware networks would be able to learn from their current performance and to autonomously make changes in the configuration and/or location of their access nodes, based on the behaviour of past traffic. End users will also benefit from self-aware systems, in the sense that these future networks will be able to adapt themselves to the user demand and the changing usage patterns. In particular, automated fine tuning mechanisms for RRM parameters and end-to-end QoS management in heterogeneous networks will be developed. The network optimization can be considered as an added value research in parallel with RRM/CRRM research. Especially, the following study items could be considered:
1. Tuning a large number of soft RRM/CRRM parameter values, which can be easily accessed via network management software (network soft parameters optimization) and
2. Network layout and configuration optimization (hard parameters optimization). • Similarly, to increase the spectrum utility over the scarce resource air-interface, the two dimensional RRM
strategies are considered in a heterogeneous network consisting of different networks such as UMTS, GERAN, and WLAN. In horizontal direction, CRRM is considered as the mechanism to co-ordinate the resource pools from the different RRM in order to achieve an efficient resource usage over the overall air-interface. On the other hand, cross-layer RRM (XLRRM) is considered in the vertical direction, following two objectives: Specific service optimization (through XLRRM design, different layer RRM algorithms become interactive to each other, thus the radio resource can be dynamically optimized to improve it utility in terms of overall system QoS satisfaction) and specific scenario optimization (through cross-layer RRM design, the interactions will bring the whole heterogeneous network in each scenario in an optimum way to manage its overall radio resource according to its service distribution in the specific scenario).
• The evaluation of dynamic end-to-end QoS mechanisms requires highly sophisticated tools, composed of different RATs (e.g. UMTS, GERAN, WLAN, WIMAX) together with CN technologies (e.g. DiffServ). This makes it certainly a research challenge to set up such tools. Nevertheless, the legacy IST-Project EVEREST has paved the way for a successful development, from which innovative results will follow. For example, Wireless Microwave Access (WiMAX) is a number of interoperable profiles based on the IEEE802.16 standard. Presently, WiMAX is only for Fixed Wireless Access (FWA), but in the near future there will be WiMAX profiles based on IEEE802.16e which supports mobile or nomadic use. While it is yet uncertain whether WiMAX will gain or not the required momentum to constitute an alternative or a complement to existing cellular networks, it is clear that it needs to be considered in the framework of heterogeneous wireless networks. It is therefore of great importance to incorporate WiMAX in the CRRM algorithms and, consequently, upgrades on the already available simulation platforms will enable such studies. Similarly, setting up end-to-end evaluation capabilities is far from simple. Preliminary work in this direction already undertaken in IST-EVEREST will be further enhanced to support the evaluation of the concepts developed within AROMA.
• Another key objective is to demonstrate the benefits of the developed end-to-end QoS framework by means of a real time test-bed able to perform the proof of concept of the most relevant items developed within
D23: Final Report Page 5
AROMA. Some examples of highly demanding services will be considered and its behaviour analysed while applying different policies, mechanism and algorithms for the QoS management entities.
• Last but not least, it is also of prime importance to carry out economic evaluation on the impacts of the novel
solutions considered by the project. The economic analyses will take into account three different subjects: o Some of the solutions that were already identified and assessed only from the technical point of view by
the EVEREST project and that can be used and exploited also within the context of AROMA. o The overall novel all-IP architecture envisaged by the project. o Some of the new solutions that will be identified and assessed by AROMA.
In this respect, some of the challenges to be faced are:
o To evaluate potential economic advantages to migrate and converge towards the all-IP architecture with heterogeneous radio technologies, in terms of CAPEX (CAPital EXpenditure) and OPEX (OPerational EXpenditure);
o To give evidence of the potential advantages of using specific RRM/CRRM algorithms as well as the novel radio solutions (i.e. HSDPA, HSUPA and MBMS) in the addressed scenarios.
o To compare different business cases based on potential market demands and to provide economic scenarios, hypotheses and parameters that can be taken into account by RRM/CRRM algorithms in order to define also economic-driven radio resource management algorithms and strategies.
o To identify the most important economic quantities and parameters that should be considered to maximize the economic exploitation of the envisaged solution.
Relevance of the objectives The AROMA project is framed within the “Mobile and Wireless Systems and Platforms Beyond 3G” IST priority. As stated in the objectives of this IST priority, “to realise the vision of "Optimally Connected Anywhere, Anytime" supported by all system levels from access methods and networks to service platforms and services. Preparatory work has characterized Systems beyond 3G as a horizontal communication model, where different terrestrial access levels and technologies are combined to complement each other in an optimum way for different service requirements and radio environments.” In this respect, the AROMA research scope is fully aligned with what is known as heterogeneous all-IP wireless networks, since a diversity of technologies are considered for the radio access part (e.g. GERAN, UMTS, WLAN, WIMAX), and IP based technology is assumed for the core network part. The AROMA project further stresses that early preparatory work has only considered these combined and complementary scenarios at a very limited extent. Consequently, the goals of AROMA include:
Advanced resource management techniques allowing optimum usage of the scarce spectrum resource enabling dynamic spectrum allocation and contributing to the reduction of electromagnetic radiation
Further progress on the definition of advanced CRRM, where a pool of resources belonging to different
technologies are commonly considered and commonly optimised leading to an optimised usage of the different technologies according to a technology roadmap driven by the evolution of the wireless scenario;
Inter-working between access technologies and the IP based core network including advanced service
and composite network management.
Global roaming for all access technologies, with horizontal and vertical hand-over and seamless services provision, with negotiation capabilities including mobility, security and QoS based on end to end IP service architecture.
This project is clearly network operator-driven. They have identified the scenarios of interest to be considered at different time scales and for different network roll-out phases, providing a global framework for applying the benefits of optimised RRM/CRRM algorithms for heterogeneous networks. From the operator side, it is well understood that suitable approaches for RRM/CRRM fall well beyond a mere network deployment; they constitute an innovative research field with clear indications on how to manage radio resources in

D23: Final Report Page 6
heterogeneous networks accommodating traditional and novel services. In this respect, the operator-oriented approach adopted in AROMA ensures that the analysed scenarios are market-relevant and user-centric. Moreover, results coming from the project will provide a manufacturer-independent and complementary analysis of the RRM/CRRM strategies. This will allow the mobile operators to evaluate and compare solutions coming from the market with an available reference of the system performance. It is worth noting that the open nature of the algorithms developed within the project and its availability to the entire wireless community is expected to contribute to a better transition from the different evolutionary scenarios considered. Outputs from AROMA will constitute a valuable reference for operators, manufacturers and academia, facilitating further progress in this field for many years to come.
D23: Final Report Page 7
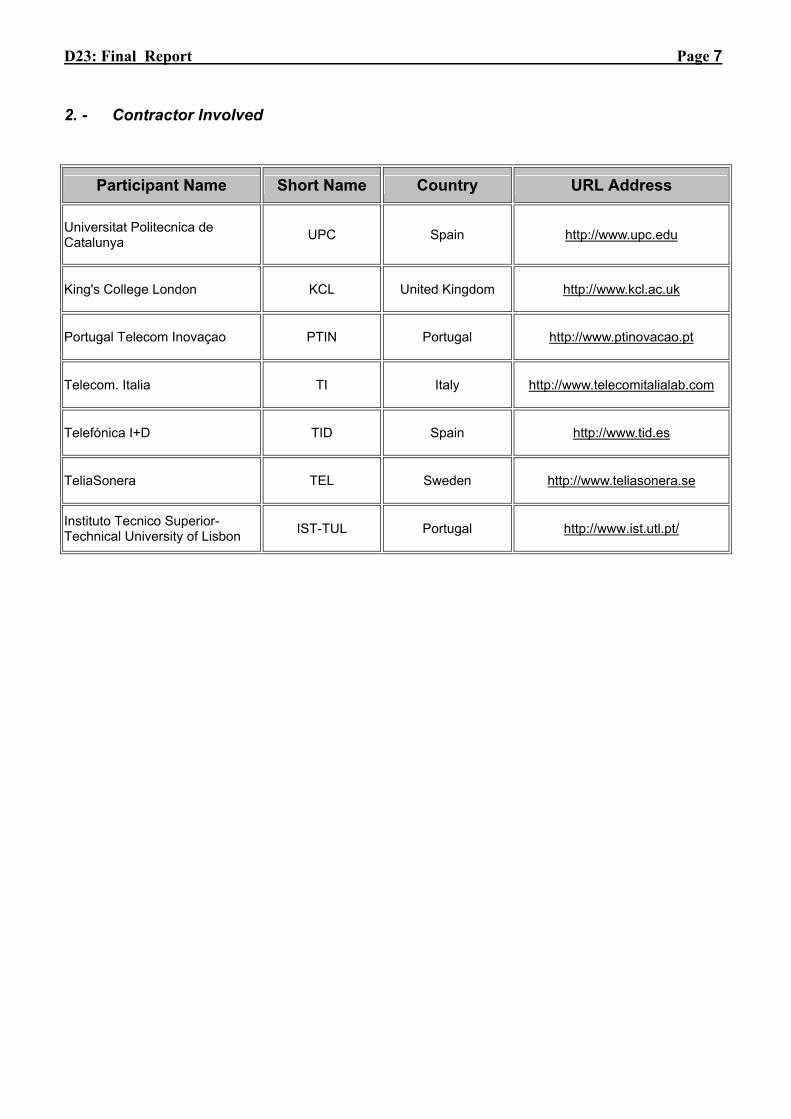
2. - Contractor Involved
Participant Name Short Name Country URL Address
Universitat Politecnica de Catalunya UPC Spain http://www.upc.edu
King's College London KCL United Kingdom http://www.kcl.ac.uk
Portugal Telecom Inovaçao PTIN Portugal http://www.ptinovacao.pt
Telecom. Italia TI Italy http://www.telecomitalialab.com
Telefónica I+D TID Spain http://www.tid.es
TeliaSonera TEL Sweden http://www.teliasonera.se
Instituto Tecnico Superior- Technical University of Lisbon IST-TUL Portugal http://www.ist.utl.pt/
D23: Final Report Page 8
3. - Work Performed The project has been developed taking into account the following main stages: 1. The relevant target scenarios have been developed. This includes the following consideration:
a. Communications environment, i.e. macrocell, microcell, indoor, etc., and user mobility b. Technologies deployed (GSM, GPRS, EDGE, UMTS, WLAN, WIMAX), their corresponding
capabilities and functionalities, as well as their corresponding network architectures and entities c. Service mix and service load (conversational, interactive, streaming, etc.)
2. Development of advanced resource and QoS management algorithms, with evaluation through
simulation. Focus has been placed on finding commonalities among the different scenarios considered, rather than trying to optimise algorithms and algorithmic parameters for a specific scenario. Thus, the goals of AROMA extends the mere analysis of different scenarios and will target the definition of generic end-to-end resource management criteria, facilitating their applicability in scenarios differing from those studied in detail within the project.
3. Techno-economic aspects: economical analyses and evaluation of the technical outputs of the project
Mobile communications will continue to be one of the most dynamic and profitable market sectors in current and future economics, although it also is one of the highest demanding economic sectors from the point of view of the required investments. In such a competitive and standard-centric industrial environment, the economical exploitation of the solutions directed towards the optimization of the network performances are of key importance. For this reason, it has been considered fundamental for the AROMA project to have the opportunity to also carry out techno-economic analyses and evaluations of the technical issues addressed by the project, investigating also the business impacts of these solutions.
4. Validation and demonstration of the proposed algorithms for the defined scenarios by means of a real
time testbed supporting IP-based mobile multimedia applications with end-to-end QoS capabilities. .
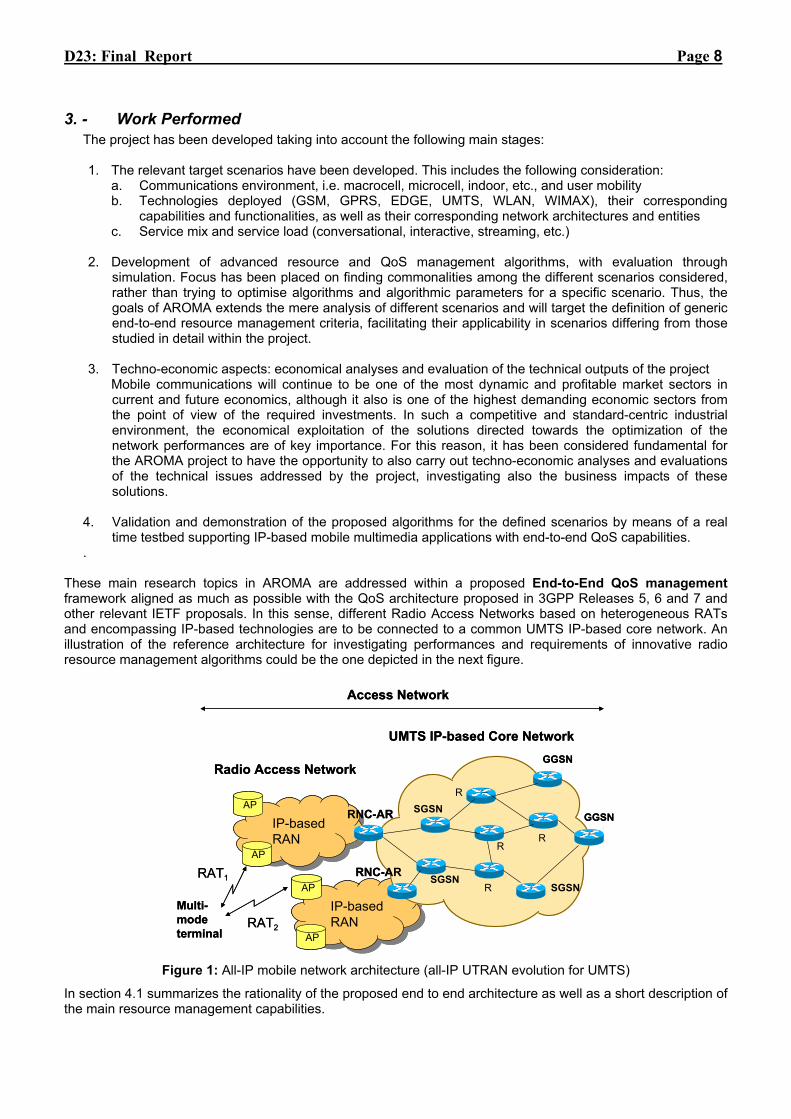
These main research topics in AROMA are addressed within a proposed End-to-End QoS management framework aligned as much as possible with the QoS architecture proposed in 3GPP Releases 5, 6 and 7 and other relevant IETF proposals. In this sense, different Radio Access Networks based on heterogeneous RATs and encompassing IP-based technologies are to be connected to a common UMTS IP-based core network. An illustration of the reference architecture for investigating performances and requirements of innovative radio resource management algorithms could be the one depicted in the next figure.
AP
RAT1
RNC-AR
Radio Access Network
RAT2
Multi-modeterminal
Access Network
SGSN
SGSNR
GGSN
GGSN
SGSN
RR
R
IP-basedRAN
RNC-ARAP
IP-basedRAN
AP
AP
UMTS IP-based Core Network
AP
RAT1
RNC-AR
Radio Access Network
RAT2
Multi-modeterminal
Access Network
SGSN
SGSNR
GGSN
GGSN
SGSN
RR
R
IP-basedRAN
RNC-ARAP
IP-basedRAN
AP
AP
UMTS IP-based Core Network
Figure 1: All-IP mobile network architecture (all-IP UTRAN evolution for UMTS)
In section 4.1 summarizes the rationality of the proposed end to end architecture as well as a short description of the main resource management capabilities.

D23: Final Report Page 9
Testbed The AROMA testbed is a tool designed for validating in the laboratory the benefits of the proposed RRM/CRRM algorithms and QoS Management techniques and to evaluate the e2e QoS experienced by a user that is immersed in a heterogeneous mobile environment with IP connectivity. The AROMA testbed must be considered as an upgrade of the legacy IST-EVEREST testbed, which is a real-time HW/SW platform currently emulating a heterogeneous radio access network that includes several Radio Access Technologies (RAT) emulation: UMTS Terrestrial Radio Access Network (UTRAN), GSM/EDGE Radio Access Network (GERAN), and Wireless Local Area Network (WLAN); the corresponding common core network (CN) based on Diffserv technology and supporting multimedia terminals with IP connectivity. The main new features incorporated in the AROMA testbed are:
• The Radio Access Technologies are enhanced by incorporating in the UTRAN emulator the High Speed Packet Access (HSPA) in both downlink and uplink.
• The Radio access part is also enhanced by the inclusion of an IP-RAN emulation model. • The IP Core Network (CN) is based on DiffServ technology and Multi-protocol Label Switching (MPLS).
Then the new entities incorporated in the IP part of the AROMA testbed are: o A new Bandwidth Broker (BB), which is going to replace the Everest one. o Three additional nodes to Core Network (CN) have been added to improve the mobility
management capabilities and/or to test MPLS technology. The functional architecture of the AROMA testbed is architecture depicted in figure 2. First of all, a cluster of PC’s, devoted to perform the emulation of the Heterogeneous Radio Access Network, could be identified. Next, a second group of PC’s implementing the several routers deal with the UMTS Core Network. Several individual PCs are used for implementing:
o The Traffic Switch (TS), mainly used to establish different configurations between RANs and the correspondent IR in the CN,
o The Advanced Graphical Management Tool (AGMT) developed to configure the initialization parameters, to control the execution flow, to collect logged data and to obtain statistics during the execution of a demonstration.
o The QoS management entities (Wireless QoS Broker: WQB, Master PDP: MPDP, and Bandwidth Broker: BB), or
o The User Equipment (UE), and Application Server.
Figure 2: General architecture of the AROMA Testbed
D23: Final Report Page 10
4. - End Results During the development of the AROMA project the following main results have been achieved:
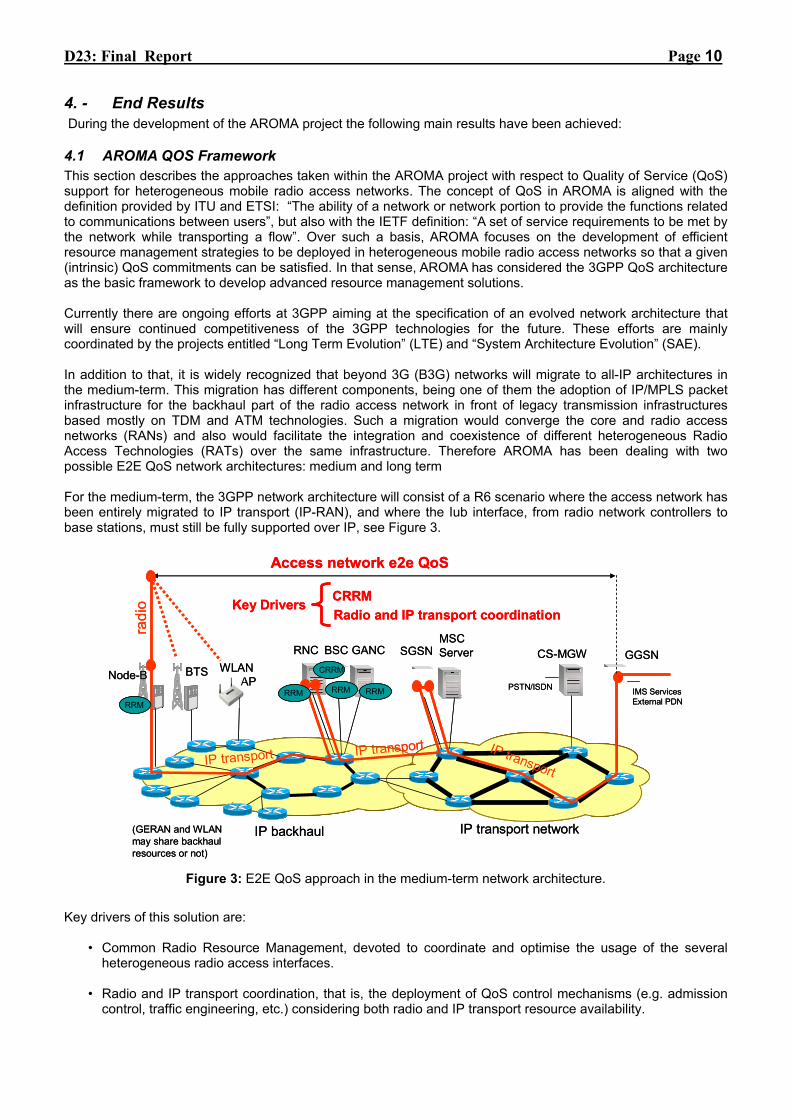
4.1 AROMA QOS Framework This section describes the approaches taken within the AROMA project with respect to Quality of Service (QoS) support for heterogeneous mobile radio access networks. The concept of QoS in AROMA is aligned with the definition provided by ITU and ETSI: “The ability of a network or network portion to provide the functions related to communications between users”, but also with the IETF definition: “A set of service requirements to be met by the network while transporting a flow”. Over such a basis, AROMA focuses on the development of efficient resource management strategies to be deployed in heterogeneous mobile radio access networks so that a given (intrinsic) QoS commitments can be satisfied. In that sense, AROMA has considered the 3GPP QoS architecture as the basic framework to develop advanced resource management solutions. Currently there are ongoing efforts at 3GPP aiming at the specification of an evolved network architecture that will ensure continued competitiveness of the 3GPP technologies for the future. These efforts are mainly coordinated by the projects entitled “Long Term Evolution” (LTE) and “System Architecture Evolution” (SAE). In addition to that, it is widely recognized that beyond 3G (B3G) networks will migrate to all-IP architectures in the medium-term. This migration has different components, being one of them the adoption of IP/MPLS packet infrastructure for the backhaul part of the radio access network in front of legacy transmission infrastructures based mostly on TDM and ATM technologies. Such a migration would converge the core and radio access networks (RANs) and also would facilitate the integration and coexistence of different heterogeneous Radio Access Technologies (RATs) over the same infrastructure. Therefore AROMA has been dealing with two possible E2E QoS network architectures: medium and long term For the medium-term, the 3GPP network architecture will consist of a R6 scenario where the access network has been entirely migrated to IP transport (IP-RAN), and where the Iub interface, from radio network controllers to base stations, must still be fully supported over IP, see Figure 3.
RNC SGSNBSCMSC ServerGANC
PSTN/ISDN
CS-MGW GGSN
IMS ServicesExternal PDN
WLAN APNode-B BTS
IP backhaul IP transport network
radi
o
IP transportIP transport IP transport
Access network e2e QoS
Key Drivers CRRMRadio and IP transport coordination
(GERAN and WLAN may share backhaulresources or not)
RRM RRM RRM
CRRM
RRM
RNC SGSNBSCMSC ServerGANC
PSTN/ISDN
CS-MGW GGSN
IMS ServicesExternal PDN
WLAN APNode-B BTS
IP backhaul IP transport network
radi
o
IP transportIP transport IP transport
Access network e2e QoS
Key Drivers CRRMRadio and IP transport coordination
(GERAN and WLAN may share backhaulresources or not)
RRMRRM RRMRRM RRMRRM
CRRMCRRM
RRMRRM
Figure 3: E2E QoS approach in the medium-term network architecture.
Key drivers of this solution are:
• Common Radio Resource Management, devoted to coordinate and optimise the usage of the several heterogeneous radio access interfaces.
• Radio and IP transport coordination, that is, the deployment of QoS control mechanisms (e.g. admission
control, traffic engineering, etc.) considering both radio and IP transport resource availability.

D23: Final Report Page 11
Notice that in the medium-term E2E scenario, the most critical part is the Radio Access Network (RAN). Managing QoS in the core network is viewed as a challenge, but large traffic volumes, statistical laws, DiffServ and sometimes the low marginal cost of over-dimensioning make it more manageable; however, managing QoS on a narrow n*2Mbit/s link to a multi-RAT base station site can be much more challenging. Furthermore without good QoS control the system will not provide low latency. On the other hand, in the long-term evolution scenario the Radio Network Layer (RNL) consists only of two types of nodes: the Access Gateway (aGW) and the Evolved UTRAN Node-B (eNB). The Iub interface, with its stringent delay constraints, is no longer needed, see Figure 4. Although the figure only reproduces network architecture for E-UTRAN, we assume that the IP-backhaul will also provide the transport for UTRAN, GERAN, WLAN and other non3GPP RATs.
RRMPSTN/ISDN
MGW
IMS ServicesExternal PDN
eNB
IP backhaul IP transport network
PDN GW
radio
IP transport/nativeIP transport
Access network e2e QoS
RRM
Key DriversMulti-cell RRM/CRRMIETF IP solutions for mobility and QoSRadio and IP transport coordination
Serving GWNo radio-relatedprocessing !
eNB
CRRMRRM
(?)
RNC/BSC
Legacy 3GPP networks
RRMRRMPSTN/ISDN
MGW
IMS ServicesExternal PDN
eNB
IP backhaul IP transport network
PDN GW
radio
IP transport/nativeIP transport
Access network e2e QoS
RRMRRM
Key DriversMulti-cell RRM/CRRMIETF IP solutions for mobility and QoSRadio and IP transport coordination
Serving GWNo radio-relatedprocessing !
eNB
CRRMCRRMRRM
(?)
RNC/BSC
Legacy 3GPP networks
Figure 4: E2E QoS approach in the long-term network architecture.
In this case, network architecture is more aligned to 3GPP Evolved-UTRAN, so that new solutions for QoS and mobility management as well as a new 4G radio interface can be introduced. In such long-term vision context, E2E QoS solutions should rely on the following key drivers:
• Multi-cell RRM. Current design trends towards flat network architectures make most RRM functionality to be
moved towards the edge of the network (i.e. evolved Node-B). However, coordination of those evolved Node-Bs in terms of overall network QoS performance remains a crucial aspect (e.g. admission control decisions not just relying on the status of a single node-B because of the potential movement of the terminal to another nodeB, support of fast handover mechanisms between nodeBs, etc.).
• Introduction of QoS and mobility solutions based on IETF protocols. • Radio and IP transport coordination, that is, the deployment of QoS control mechanisms (e.g. admission
control, traffic engineering, etc.) considering both radio and IP transport resource availability. Notice that in both medium-term and long-term scenarios AROMA has assumed that the IP-backhaul provides the transport for all the envisaged RATs. Transport resources in the RAN backhaul network can be either assigned independently to the different RATs or shared among them. Since a mobile network will always show a high degree of capillarity to inter-connect a lot of Access Points to the core network, the problem of achieving an efficient usage of resources in the transport network will persist in the long-term evolution.
D23: Final Report Page 12
4.1.1 Coordinated Access Resource Management (CARM) In AROMA, a resource management framework for IP-RANs that considers both radio and transport resource occupancy in its decision-making process has been developed. The framework is designed to handle potential bottleneck situations in the IP transport part of a RAN. This leads to a new paradigm where transport resources are considered not only at the network dimensioning stage but are included in an integrated resource management scheme. This new paradigm allows to dynamically capture within the resource management framework the transport network status (e.g. routing changes due to link failure/congestion, a radio cell exceeding its dimensioned transport capacity to the detriment of other cells, etc) so that proper decisions can be taken (e.g. mitigate transport limitations in the backhaul link of a base station (BS) by conveniently re-allocating to other BSs those connections that have less impact on the radio degradation). This resource management framework is referred to as CARM (Coordinated Access Resource Management).
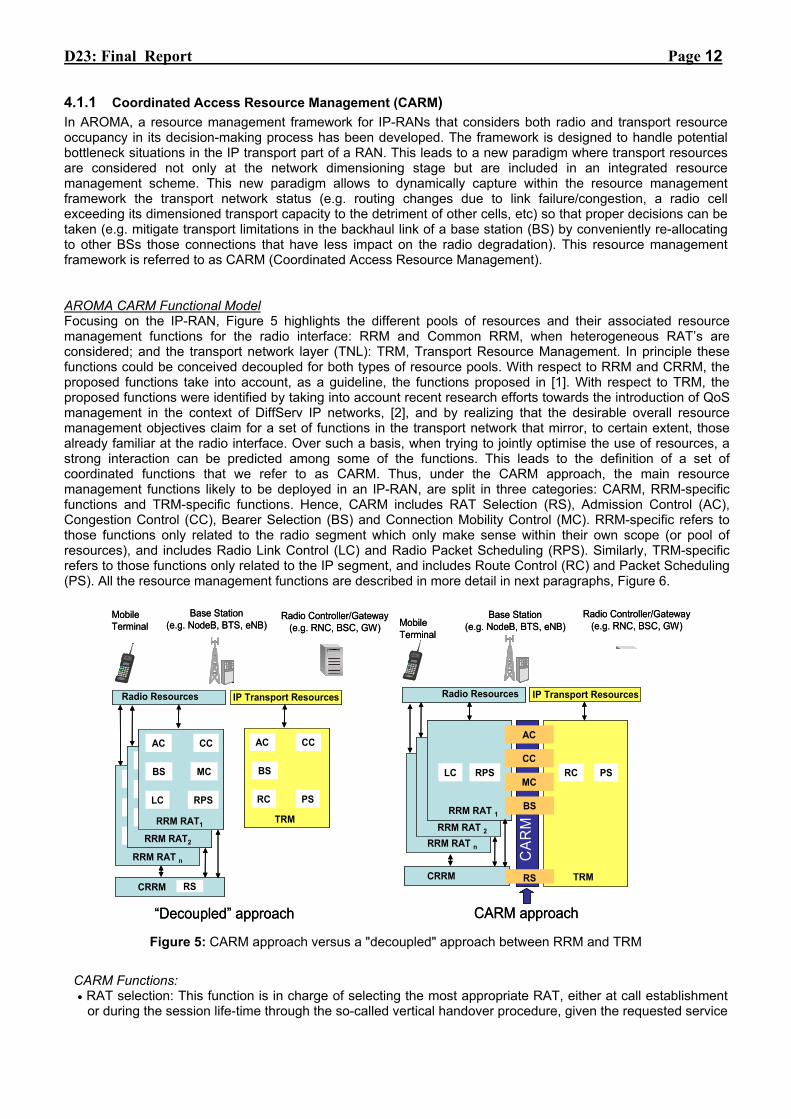
AROMA CARM Functional Model Focusing on the IP-RAN, Figure 5 highlights the different pools of resources and their associated resource management functions for the radio interface: RRM and Common RRM, when heterogeneous RAT’s are considered; and the transport network layer (TNL): TRM, Transport Resource Management. In principle these functions could be conceived decoupled for both types of resource pools. With respect to RRM and CRRM, the proposed functions take into account, as a guideline, the functions proposed in [1]. With respect to TRM, the proposed functions were identified by taking into account recent research efforts towards the introduction of QoS management in the context of DiffServ IP networks, [2], and by realizing that the desirable overall resource management objectives claim for a set of functions in the transport network that mirror, to certain extent, those already familiar at the radio interface. Over such a basis, when trying to jointly optimise the use of resources, a strong interaction can be predicted among some of the functions. This leads to the definition of a set of coordinated functions that we refer to as CARM. Thus, under the CARM approach, the main resource management functions likely to be deployed in an IP-RAN, are split in three categories: CARM, RRM-specific functions and TRM-specific functions. Hence, CARM includes RAT Selection (RS), Admission Control (AC), Congestion Control (CC), Bearer Selection (BS) and Connection Mobility Control (MC). RRM-specific refers to those functions only related to the radio segment which only make sense within their own scope (or pool of resources), and includes Radio Link Control (LC) and Radio Packet Scheduling (RPS). Similarly, TRM-specific refers to those functions only related to the IP segment, and includes Route Control (RC) and Packet Scheduling (PS). All the resource management functions are described in more detail in next paragraphs, Figure 6.
RRM RAT n
MC
RPSLC
AC CC
BS
Radio Controller/Gateway(e.g. RNC, BSC, GW)
Base Station(e.g. NodeB, BTS, eNB)
Mobile Terminal
Radio Resources IP Transport Resources
TRM
CC
PSRC
BS
AC
RRM RAT2
MC
RPSLC
AC CC
BS
RRM RAT1
MC
RPSLC
AC CC
BS
CRRM RS
RRM RAT n
RPSLC
RRM RAT 2
RPSLC
Radio Controller/Gateway(e.g. RNC, BSC, GW)
Base Station(e.g. NodeB, BTS, eNB)Mobile
Terminal
Radio Resources IP Transport Resources
TRM
PS
RRM RAT 1
RPSLC RCMC
CC
AC
BS
CRRM RS
CA
RM
“Decoupled” approach CARM approach
RRM RAT n
MC
RPSLC
AC CC
BS
RRM RAT n
MC
RPSLC
AC CC
BS
Radio Controller/Gateway(e.g. RNC, BSC, GW)
Base Station(e.g. NodeB, BTS, eNB)
Mobile Terminal
Radio Resources IP Transport Resources
TRM
CC
PSRC
BS
AC
RRM RAT2
MC
RPSLC
AC CC
BS
RRM RAT2
MC
RPSLC
AC CC
BS
RRM RAT1
MC
RPSLC
AC CC
BS
CRRM RS
RRM RAT n
RPSLC
RRM RAT n
RPSLC
RRM RAT 2
RPSLC
RRM RAT 2
RPSLC
Radio Controller/Gateway(e.g. RNC, BSC, GW)
Base Station(e.g. NodeB, BTS, eNB)Mobile
Terminal
Radio Resources IP Transport Resources
TRM
PS
RRM RAT 1
RPSLC
RRM RAT 1
RPSLC RCMC
CC
AC
BS
CRRM RS
CA
RM
“Decoupled” approach CARM approach Figure 5: CARM approach versus a "decoupled" approach between RRM and TRM
CARM Functions: • RAT selection: This function is in charge of selecting the most appropriate RAT, either at call establishment
or during the session life-time through the so-called vertical handover procedure, given the requested service

D23: Final Report Page 13
and QoS profile. The RAT selection decision could be influenced by many factors, including non-technical issues like the Operator’s policies or business model. It is considered a CARM function due to the need to take into account the link load at the transport layer before making a RAT selection. For example, the operator’s initial choice for a voice service request could be the GERAN RAT, but an overloaded GERAN IP-backhaul could redirect the RAT selection towards UTRAN.
• Bearer Selection: Bearer selection is in charge of selecting the required resources to support the requested QoS profile at the radio and transport bearer services. This implies the configuration of new radio and transport bearers given the requested QoS profile and selected RAT. It also includes dynamic mapping of requested QoS parameters to the transport QoS parameters.
• Admission Control: maintains information of available/allocated resources in both the radio and the IP transport network and performs resource reservation/allocation in response to new service requests, at call establishment or during vertical/horizontal handover, with a given QoS profile. From the radio point of view it takes into account, for example, the interference level and the availability of codes (in a WCDMA radio interface), and from the transport network it can take into account, for example, the current occupation of the bottleneck link.
• Congestion Control: It is in charge of taking the actions required to handle overload events in the radio or transport network side. This function will implement the Operator’s policy for congestion situations, for example, give priority to real-time/premium/business users over non-real-time/consumer users, etc, and take the necessary actions to reduce the duration of the congestion event. The methods used to handle congestion include a range of options, for the radio and for the transport part, which are operator/implementation dependant. Congestion Control needs coordinated actions from the radio and transport resource management. As an example, the possible actions range from changing the Transport Format Combination Set (TFCS, UTRAN specific) to some users in the RRM part, to setup alternative routes or enforce link-sharing strategies for packet scheduling in the transport part.
• Mobility Control (Cell Selection): This function is basically in charge of deciding the best cell to be connected in a handover process. Handover decisions can take into account measurements from the UE and the node-B and may take other inputs, such as neighbour cell load, traffic distribution, transport and hardware resources and Operator defined policies into account. We envisage that the transport resource availability could be checked before making a handover, since it is possible that a given cell with free radio resources can not accept a handover call due to a congested link in the transport network. It is also possible that transport resource availability can influence the decision about which is the optimum cell to direct the handover to.
RRM Specific Functions: • Radio Link Control: It is in charge of dynamically adjusting the radio link parameters of the mobile terminals
in order to preserve the QoS for established sessions. This function will typically include power control and link adaptation mechanisms. Power control aims at dynamically adjusting the power transmitted by all the terminals in a given cell. The required power for each user depends on several factors like radio-link propagation losses, amount of interference in the cell and type of service and mobility of the user. Link adaptation functions dynamically adjust modulation and coding to maximize the throughput given the radio channel conditions.
• Radio Packet Scheduling: This function is in charge of maximizing resource occupation by scheduling packets for established sessions taking into account several factors, like the QoS of the session, the interference level of the cell and the channel quality for the particular user. Radio Packet Scheduling is a short term strategy that tries to use free resources that could otherwise remain underutilized.
TRM Specific Functions: • TNL Route Control: This QoS management function is in charge of selecting the optimum routes in the
transport network to guarantee the efficient use of TNL resources and the QoS requested by the TNL IP bearers. This function will be applied when setting up new QoS IP bearers and it is also envisaged that this function should continuously monitor the link utilization and buffer occupancy of the transport network nodes in order to prevent congestion and maintain efficient use of network resources. The implementation of this function will relay on appropriate load balancing techniques, path establishment with QoS constraints (like Constraint Routing- Label Distribution Protocol, CR-LDP), as well as network resiliency mechanisms in case of link/node failures.
• TNL Packet Scheduling: This function is in charge of implementing, at the IP transport network nodes, the appropriate QoS queuing decisions so the different flows (or aggregates of flows) receive the right QoS treatment at every node. For that purpose the packets are marked at the ingress node with a mark that identifies them as belonging to a given QoS “Behaviour Aggregate” (assuming a DiffServ scheme, for

D23: Final Report Page 14
example). The implementation of TNL packet scheduling could range from simple priority queuing to the more sophisticated link-sharing techniques.
BearerSelection
Radio PacketScheduling
Congestion Control
Link Control
RRM functions TRM functions
TNL PacketForwarding
(Scheduling and queue management)
RouteControl
AdmissionControl
CARM functions
RAT Selection
Cell Selection
BearerSelection
Radio PacketScheduling
Congestion Control
Link Control
RRM functions TRM functions
TNL PacketForwarding
(Scheduling and queue management)
RouteControl
AdmissionControl
CARM functions
RAT Selection
Cell Selection
Figure 6: CARM functions
4.1.2 CARM examples As a proof of concept, in this section we include a couple of examples on Coordinated Cell Selection that show
that an increased efficiency in the use of resources can be obtained by allowing radio and transport layers coordination. In addition to this, in the next section 4.2.2 devoted to CRRM, also the RAT selection accounting for transport network considerations will be presented.
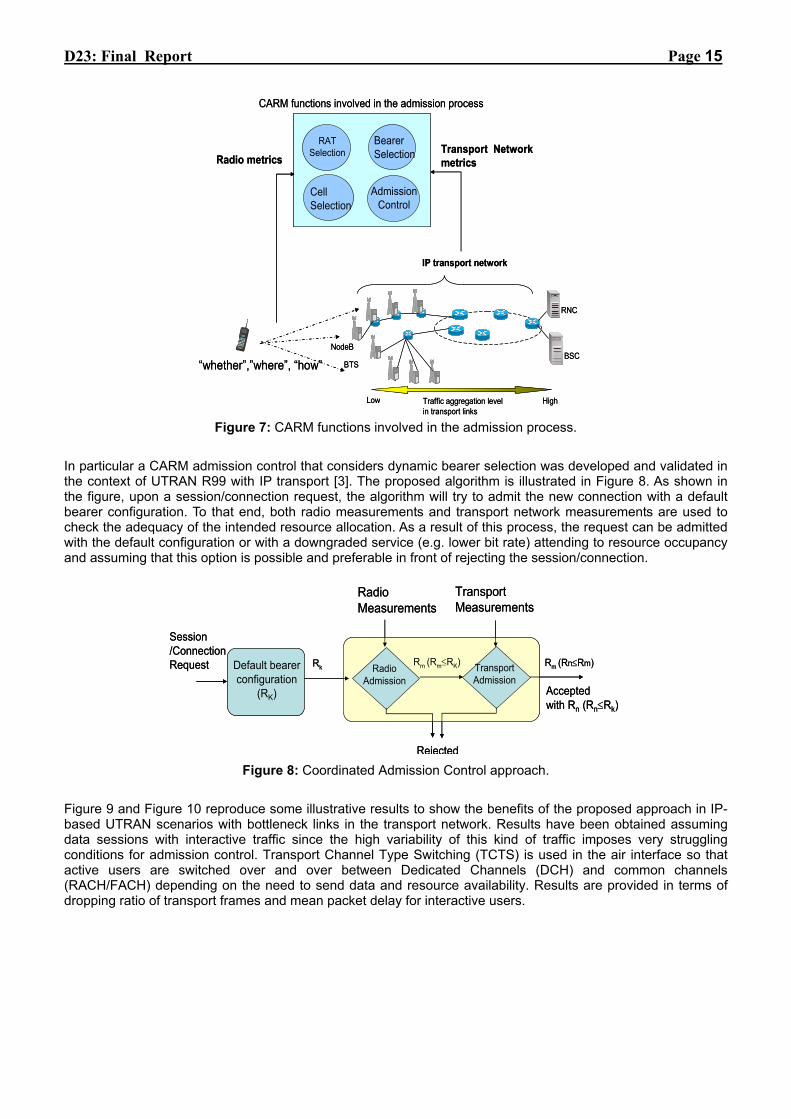
4.1.2.1 Coordinated Admission Control In an heterogeneous network environment offering flexible services, the admission control should consider, not only “whether” a particular QoS bearer request can be admitted or not, but also under which conditions, that is “how”, it can be admitted (by allowing only certain transport formats, for example, in the case of UTRAN) and in which RAT and radio BS, that is “where”, it could be admitted (assuming that there are several candidates of the same or different RAT). In the case of a coordinated admission control mechanism jointly involving radio and transport parts, this decision would be influenced by at least (1) the radio resource occupation in the candidate BSs and the (2) transport resource occupation in the path between the candidate BSs and their corresponding network controllers or access gateways. Figure 7 illustrates the scope of the admission process coordinating radio and IP segments in a heterogeneous RAT scenario. As shown in the figure, the whole admission control decision is eventually related to the CARM functions RAT selection, cell selection (within the Mobility Control function) and bearer selection (the first two functions related to "where" and the last one to "how" admit the connection).
D23: Final Report Page 15
RNC
BSCNodeB
RAT Selection
CellSelection
BearerSelection
AdmissionControl
Transport Networkmetrics
“whether”,”where”, “how”
Radio metrics
CARM functions involved in the admission process
IP transport network
Traffic aggregation levelin transport links
BTS
Low High
RNC
BSCNodeB
RAT Selection
CellSelection
BearerSelection
AdmissionControl
Transport Networkmetrics
“whether”,”where”, “how”
Radio metrics
CARM functions involved in the admission process
IP transport network
Traffic aggregation levelin transport links
BTS
Low High
Figure 7: CARM functions involved in the admission process.
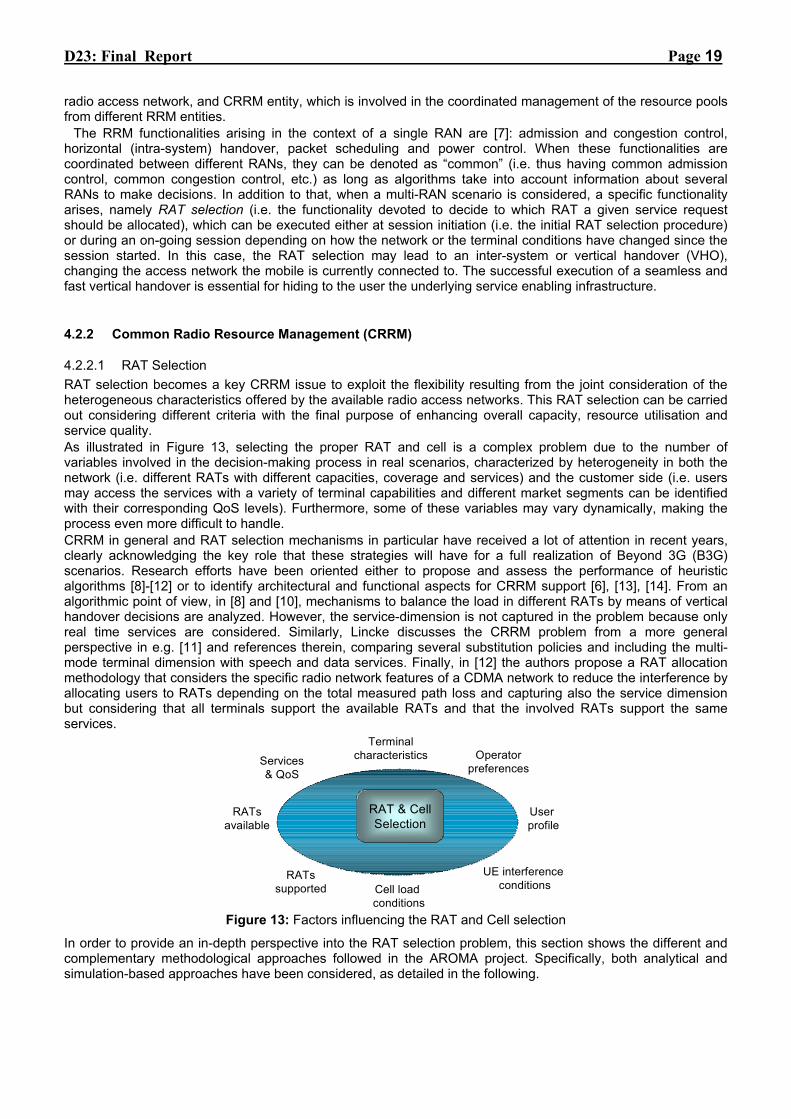
In particular a CARM admission control that considers dynamic bearer selection was developed and validated in the context of UTRAN R99 with IP transport [3]. The proposed algorithm is illustrated in Figure 8. As shown in the figure, upon a session/connection request, the algorithm will try to admit the new connection with a default bearer configuration. To that end, both radio measurements and transport network measurements are used to check the adequacy of the intended resource allocation. As a result of this process, the request can be admitted with the default configuration or with a downgraded service (e.g. lower bit rate) attending to resource occupancy and assuming that this option is possible and preferable in front of rejecting the session/connection.
Session/ConnectionRequest Default bearer
configuration(RK)
RadioAdmission
RadioMeasurements
Rk Rm (Rm≤RK) TransportAdmission
TransportMeasurements
Rejected
Acceptedwith Rn (Rn≤Rk)
Rm (Rn≤Rm)
Session/ConnectionRequest Default bearer
configuration(RK)
RadioAdmission
RadioMeasurements
Rk Rm (Rm≤RK) TransportAdmission
TransportMeasurements
Rejected
Acceptedwith Rn (Rn≤Rk)
Rm (Rn≤Rm)
Figure 8: Coordinated Admission Control approach.
Figure 9 and Figure 10 reproduce some illustrative results to show the benefits of the proposed approach in IP-based UTRAN scenarios with bottleneck links in the transport network. Results have been obtained assuming data sessions with interactive traffic since the high variability of this kind of traffic imposes very struggling conditions for admission control. Transport Channel Type Switching (TCTS) is used in the air interface so that active users are switched over and over between Dedicated Channels (DCH) and common channels (RACH/FACH) depending on the need to send data and resource availability. Results are provided in terms of dropping ratio of transport frames and mean packet delay for interactive users.

D23: Final Report Page 16
0
1
2
3
4
5
6
7
8
9
10
11
12
320 340 360 380 400 420
Interactive Users
No CACCAC ACAC BCAC C (aggressive)CAC C (conservative)
Tran
spor
tFra
mes
Dro
ppin
gR
atio
(%)
0
1
2
3
4
5
6
7
8
9
10
11
12
320 340 360 380 400 420
Interactive Users
No CACCAC ACAC BCAC C (aggressive)CAC C (conservative)
Tran
spor
tFra
mes
Dro
ppin
gR
atio
(%)
0,1
0,15
0,2
0,25
0,3
0,35
320 340 360 380 400 420Interactive Users
No CAC
CAC ACAC B
CAC C (aggressive)CAC C (conservative)
Mea
n In
tera
ctiv
ePa
cket
Del
ay(s
)
0,1
0,15
0,2
0,25
0,3
0,35
320 340 360 380 400 420Interactive Users
No CAC
CAC ACAC B
CAC C (aggressive)CAC C (conservative)
Mea
n In
tera
ctiv
ePa
cket
Del
ay(s
)
Figure 9: Transport Frames Dropping Ratio in the bottleneck link.
Figure 10: Mean packet delay for interactive traffic.
As main results, it can be stated that, in the scenario under evaluation, not considering transport load status into the admission process (i.e. only radio criteria is considered) can lead to unacceptable packet dropping (5-10%) even for low link utilisation (<30% for 320 users in a scenario with seven UTRAN cells) for web-like traffic. Over such a basis, three possible coordinated CAC strategies have been compared, namely:
• basic CAC denoted as CAC-A; • the admission process is moved at TCTS level, denoted as CAC B, and • keeping CAC decisions at TCTS level but exploiting bearer selection (i.e. the rate of the DCH channel
is adapted to transport load status), denoted as CAC C, From the figures, it can also be observed that it is possible to achieve packet dropping ratios below 1% with minimum QoS degradation of ongoing sessions in terms of mean packet delay when strategy CAC C is considered.
4.1.2.2 Coordinated Cell Selection In this example, a trunking gain in the utilization of transport resources can be achieved by allowing terminals to be connected to cells other than their best radio server in case of transport overload. However, it is clear that such potential trunking gain would come at the expense of a certain amount of radio degradation in terms of e.g., increased path loss per connection and higher interference level. Under this analysis, it is demonstrated the feasibility to achieve a given trunking gain while reducing the amount of radio degradation that we would have in case of using traditional cell selection schemes based only on radio metrics. To that end, in [4], a novel cell selection strategy that includes metrics related to transport resources occupancy in the cell selection decision is proposed and its performance analysed by means of a multidimensional Markov model. Analysis conducted in [4] focuses on homogeneous RAN deployment scenario with a single RAT. This scenario is claimed to be the most critical in terms of using information different than radio metrics to control the cell selection process because the selection of the non best cell from the radio perspective can lead to some degradation in terms of e.g., increased path loss per connection and higher interference level. The reference scenario assumes multiple cell coverage in some locations of the service area. Thus, some terminals may have more than one candidate cell to be connected to. Three different cell selection strategies have been analysed:
• Best Server Cell Selection (BS_CS): Under this strategy, terminals are always connected to their radio best-server cell (defined, in this study, as the cell with minimum path-loss). Radio resources are used in the most efficient way, but some new sessions can be blocked, due to transport saturation of the best-server, while still having spare transport capacity in some neighbouring cells. Hence, this strategy does not exploit any transport trunking gain. This strategy is mainly used as the reference for the next two strategies.
• Radio Prioritized Cell Selection (RP_CS): In this case, all the cells having a difference in path loss, with respect to the best-server cell, below a certain Path Loss Margin (PLM) are considered as candidate cells. Then, among the candidate cells whose transport is not saturated, the one showing minimum path-loss is selected. This mechanism clearly results in certain trunking gain in the use of the transport resources, but it comes at the expense of some radio degradation due to the potential selection of non-optimal cells. The

D23: Final Report Page 17
radio degradation is computed in this work in terms of the mean and the 99%-percentile of the observed carrier to interference ratio (CIR) in the active sessions not connected to their radio best-server. Notice that the RP_CS strategy is the one commonly used in legacy networks with cell redirection support (e.g. cell redirection mechanism in UMTS). Notice also that this strategy is unaware of transport occupancy unless a transport blocking condition arises in the target cell.
• Transport Prioritized Cell Selection (TP_CS): This strategy works like the RP_CS strategy while transport occupancy is below a certain threshold. However, above that threshold the candidate cells are prioritized according to their transport occupancy. The goal behind this approach is to postpone as much as possible the transport saturation by means of a rational distribution of the terminals with more than one candidate cell.
Assuming some simplifying hypothesis, like infinite population of users, single service, Poisson distribution of session arrivals and exponential session service time, the trunking gain -for a given transport blocking probability- can be obtained by solving the flow equations of a multi-dimensional Markov model. Details on the model can be found in [4] and in AROMA's deliverable D12, [5]. The analysis is focused on the coverage region of three sector cells (see Figure 11) served by the base stations BS1 (C1), BS2 (C2) and BS3 (C3) respectively. Transport constraints are considered by bounding the maximum number of connections in each BS attending to provisioned transport capacity. These transport constraints are referred to as Ci for BSi. It is assumed that users are uniformly distributed in the service area.
BS1 BS2
λ1
BS3
λ3
λ2
λ13 λ23λ123
λ12
BS1 BS2
λ1
BS3
λ3
λ2
λ13 λ23λ123
λ12
Figure 11: Regular cell deployment and regions within the PLM range
Attending to the considered scenario illustrated in Figure 11, the global rate of arriving sessions (λ) can be
decomposed into the following rates: λ=λ1+λ2+λ3+λ12+λ13+λ23+λ123, where the exact distribution of rates is found by numerical integration of the areas of overlapped coverage, that is, the dashed areas in Figure 11. An exponential power decay law has been assumed, i.e.: PR,i=PT·k·di -β. Where PR,i (i=1,2,3) is the power received from BSi at a terminal located at distance di from BSi, PT is the power transmitted by BSi (due to the symmetry of the scenario we assume that the three BS transmit the same power), k is a constant in the propagation model and β=3.5.
The trunking gain is defined here for both RP_CS and TP_CS strategies as the capacity increase compared to a BS_CS scheme. Notice that this capacity increase is mainly due to the possibility of using resources of cells other than the best radio server. Some illustrative results are reproduced in Figure 12 for the achieved trunking gain, mean path loss degradation and 99%-percentile path loss increase versus the path loss margin (PLM) parameter. In particular, a transport capacity equal to Ci=8 has been considered for the three cells (this can be a high number when focusing on high data rate services over cellular cells, e.g. 384 kbps in a UMTS cell). The curves are parameterized by the value of L, which accounts for the threshold referred to in the definition of the TP_CS strategy (L=n means that cell prioritisation according to transport occupancy is only performed within a candidate set when spare transport capacity is less than n connections; L=all means that transport prioritisation is always applied). As indicated in the figure, the CARM-based cell selection can achieve the same trunking gain with lower PLM than a cell selection only based on radio criteria (RP_CS). It is also evident that the TP_CS strategy with L=3 achieves almost the same trunking gain as the TP_CS with L=all but leads to less path-loss increase. This trunking gain comes at the expense of a slightly higher mean path loss increase (<0.2dB) due to connecting terminals to non best radio servers. However, worst-case situations are avoided and this is well reflected in the 2dB reduction of the 99-percentile of the path loss increase when using CARM cell selection.

D23: Final Report Page 18
0 1 2 3 4 5 6 7 8
99% percentile of path-loss increase [dB]
2
3
4
5
6
7
8
0 5 10 15 20 25 30 35
Trunking gain (%)
0 0.5 1 1.5 2 2.5
Mean path-loss increase [dB]
RP_CS
TP_CS (L=3)TP_CS (L=All)
Pat
h Lo
ss M
argi
n (d
B)
Figure 12: Comparison of TP_CS and RP_CS cell selection strategies
4.1.3 Conclusions on QoS Resource Management issues In this section the AROMA vision and proposals with respect to QoS resource management for heterogeneous wireless access networks has been summarized. One of the identified keys drivers for medium-term and long-term evolution of 3GPP IP-RAN is transport and radio resource management coordination. This concept has been addressed within the AROMA project in the so called CARM framework, including different coordinated functionalities between radio and transport part. Two examples on Coordinated admission Control and Coordinated Cell Selection have been included to prove the potential increase in the resource usage efficiency that can be achieved. As a general conclusion it can be said that a coordinated framework that includes both the radio and transport network layers in the resource management problem is appropriate from a general point of view and can bring particular benefits in terms of enhanced service provision in case that there exist bottlenecks in some transport links.
4.2 Radio Resource Management (RRM)
4.2.1 Introduction Nowadays wireless scenarios are characterized by the coexistence of a variety of wireless access technologies, with different protocol stacks and supporting applications and services with different Quality of Service (QoS) demands to be provided to terminals with different degrees of multi-mode capabilities to access the available networks. Each Radio Access Network (RAN) differs from the others by the air interface technology, cell-size, services supported, bit rate capabilities, coverage, mobility support, etc. Therefore, the heterogeneous characteristics offered by these networks allow exploiting the trunking gain resulting from the joint consideration of all the networks as a whole. As a result, the additional dimensions introduced by the multiplicity of radio access technologies (RATs) provide further flexibility in the way how radio resources can be managed and, consequently, overall improvements may follow with respect to the performances of the stand-alone systems. This challenge calls for the introduction of new radio resource management (RRM) algorithms operating from a common perspective that consider the overall amount of resources offered by the available RANs.
Common Radio Resource Management (CRRM) refers to the set of functions that are devoted to ensure an efficient use of the available radio resources in heterogeneous networks scenarios through a proper coordination between the different RANs [6] [7]. The functional model assumed in 3GPP for CRRM operation considers the total amount of resources available for an operator divided into radio resource pools [6]. Each pool consists of the resources in a set of cells, typically under the control of a RNC (Radio Network Controller) in UTRAN (UMTS Terrestrial Radio Access Network) or a BSC (Base Station Controller) in GERAN (GSM/EDGE Radio Access Network). The same functional model could also include a Generic Access Network Controller (GANC) if the resources of other access technologies like e.g. WLAN (Wireless Local Area Network) or WiMAX, were to be considered [8]. In any case, two types of entities are considered for the management of these radio resource pools [6]: RRM entity, which carries out the management of the resources in one radio resource pool of a certain
D23: Final Report Page 19
radio access network, and CRRM entity, which is involved in the coordinated management of the resource pools from different RRM entities.
The RRM functionalities arising in the context of a single RAN are [7]: admission and congestion control, horizontal (intra-system) handover, packet scheduling and power control. When these functionalities are coordinated between different RANs, they can be denoted as “common” (i.e. thus having common admission control, common congestion control, etc.) as long as algorithms take into account information about several RANs to make decisions. In addition to that, when a multi-RAN scenario is considered, a specific functionality arises, namely RAT selection (i.e. the functionality devoted to decide to which RAT a given service request should be allocated), which can be executed either at session initiation (i.e. the initial RAT selection procedure) or during an on-going session depending on how the network or the terminal conditions have changed since the session started. In this case, the RAT selection may lead to an inter-system or vertical handover (VHO), changing the access network the mobile is currently connected to. The successful execution of a seamless and fast vertical handover is essential for hiding to the user the underlying service enabling infrastructure.
4.2.2 Common Radio Resource Management (CRRM)
4.2.2.1 RAT Selection RAT selection becomes a key CRRM issue to exploit the flexibility resulting from the joint consideration of the heterogeneous characteristics offered by the available radio access networks. This RAT selection can be carried out considering different criteria with the final purpose of enhancing overall capacity, resource utilisation and service quality. As illustrated in Figure 13, selecting the proper RAT and cell is a complex problem due to the number of variables involved in the decision-making process in real scenarios, characterized by heterogeneity in both the network (i.e. different RATs with different capacities, coverage and services) and the customer side (i.e. users may access the services with a variety of terminal capabilities and different market segments can be identified with their corresponding QoS levels). Furthermore, some of these variables may vary dynamically, making the process even more difficult to handle. CRRM in general and RAT selection mechanisms in particular have received a lot of attention in recent years, clearly acknowledging the key role that these strategies will have for a full realization of Beyond 3G (B3G) scenarios. Research efforts have been oriented either to propose and assess the performance of heuristic algorithms [8]- [12] or to identify architectural and functional aspects for CRRM support [6], [13], [14]. From an algorithmic point of view, in [8] and [10], mechanisms to balance the load in different RATs by means of vertical handover decisions are analyzed. However, the service-dimension is not captured in the problem because only real time services are considered. Similarly, Lincke discusses the CRRM problem from a more general perspective in e.g. [11] and references therein, comparing several substitution policies and including the multi-mode terminal dimension with speech and data services. Finally, in [12] the authors propose a RAT allocation methodology that considers the specific radio network features of a CDMA network to reduce the interference by allocating users to RATs depending on the total measured path loss and capturing also the service dimension but considering that all terminals support the available RATs and that the involved RATs support the same services.
TerminalcharacteristicsServices
& QoS
RATsavailable
RATssupported Cell load
conditions
UE interferenceconditions
Userprofile
Operatorpreferences
RAT & CellSelection
Figure 13: Factors influencing the RAT and Cell selection
In order to provide an in-depth perspective into the RAT selection problem, this section shows the different and complementary methodological approaches followed in the AROMA project. Specifically, both analytical and simulation-based approaches have been considered, as detailed in the following.

D23: Final Report Page 20
Analytical approaches Analytical models can be regarded as a first step towards the objective of gaining insight in the RAT selection problem. In spite of the necessary simplifying assumptions, they can help in identifying the relevant parameters to be considered by the RAT selection algorithm. In the framework of the AROMA project [13], one of the first works in this line considers a generic CDMA/TDMA heterogeneous network with a single service and developed the criteria to decide the optimum traffic splitting that minimizes the uplink outage probability [15]. Two different functions are identified depending on the propagation loss statistical distribution, on the capacities of each RAT and on the corresponding sensitivity levels. From the analysis of these functions and their mathematical properties it is possible to decide the optimum number of users in TDMA and in CDMA. One of the main outcomes of the previous work is the identification of the relevant role played by the propagation loss distribution in the two access technologies, mainly because of the limited-interference nature of CDMA. As a result of that, in [16] an enhanced methodology has been proposed making use of the specific measured propagation loss, so that those terminals having the lowest propagation loss in a given moment were allocated to CDMA. This approach could be combined either with a simple load balancing approach in which the total load in the CDMA and TDMA RATs is kept at similar levels [8], or with an optimization mechanism like the one presented in [15]. In both cases significant outage probability reductions and consequent capacity increases are achieved. In order to introduce the service component in the RAT selection procedure, a flexible framework for evaluating generic RAT selection policies in CDMA/TDMA scenarios with two different services has been built by using a 4-dimensional Markov model, [17]. Given a total offered traffic to the network, the fractional traffic arriving to each RAT was dependant on the chosen RAT selection scheme which is fully embedded in the state transitions of the Markov chain. In this way, the model allows the evaluation of different RAT selection schemes accounting for different principles, ranging from the simplest ones like service-based selection or load balancing, up to more sophisticated schemes accounting for the amount of multi-mode terminals in the scenario or trying to minimize the resulting congestion probability in each RAT.
System-level simulations
Although the analytical models are very useful to get a first insight into the problem and to identify the relevant aspects in the RAT selection process, they usually require some simplifying assumptions in terms of traffic generation patterns, mobility, multi-cell structures and detailed procedures like measurement averaging, power control, scheduling, etc., so that it is difficult to assess the performance of RAT selection schemes in more realistic scenarios. Then, it is a usual approach to execute detailed dynamic system-level simulations, supported by link-level simulation results, to evaluate the performance of the considered algorithms under realistic conditions in multi-user, multi-cell and multi-service scenarios. The simulator must include an adequate modelling of the relevant aspects that have an impact over the performance of the strategies being evaluated. In the context of CRRM, these aspects include the traffic generation, the user mobility as well as the different network procedures in the radio interface like e.g. the power control in CDMA, the packet scheduling, the link adaptation, the measurement reporting, etc [18]. In the framework of the AROMA project, different RAT selection schemes have been evaluated by means of the available system-level simulators, taking into consideration the scenarios defined in the project [19] and including detailed characterization of UTRAN, considering both release 99 (R99) channels and High Speed Packet Access (HSPA), GERAN and WLAN technologies. The set of selected scenarios includes both theoretical and realistic scenarios, where the service mix, RAT and environment characterization as well as cell deployment are defined. In the next sub-sections, the main outcomes from the different CRRM strategies analysed in AROMA are presented.
4.2.2.2 CRRM based on radio quality and radio coverage A first set of strategies explored the inter-working mechanisms between GERAN and UTRAN specified by 3GPP, in order to identify useful CRRM strategies exclusively based on radio quality perceived by the users. More in detail, mechanisms related to segregating traffic between these two RATs by means of the parameters affecting inter-RAT cell reselection in idle mode and handover in connected mode were analyzed. More specifically, focusing on the idle mode, the main parameters governing the inter-RAT cell reselection from GERAN to UTRAN are the Qsearch_I and the FDD_Qoffset [20]. Similarly, the cell reselection from UTRAN to GERAN can be controlled by regulating the SsearchRAT_GSM and Qoffset1_sn parameters [20]. Simulation
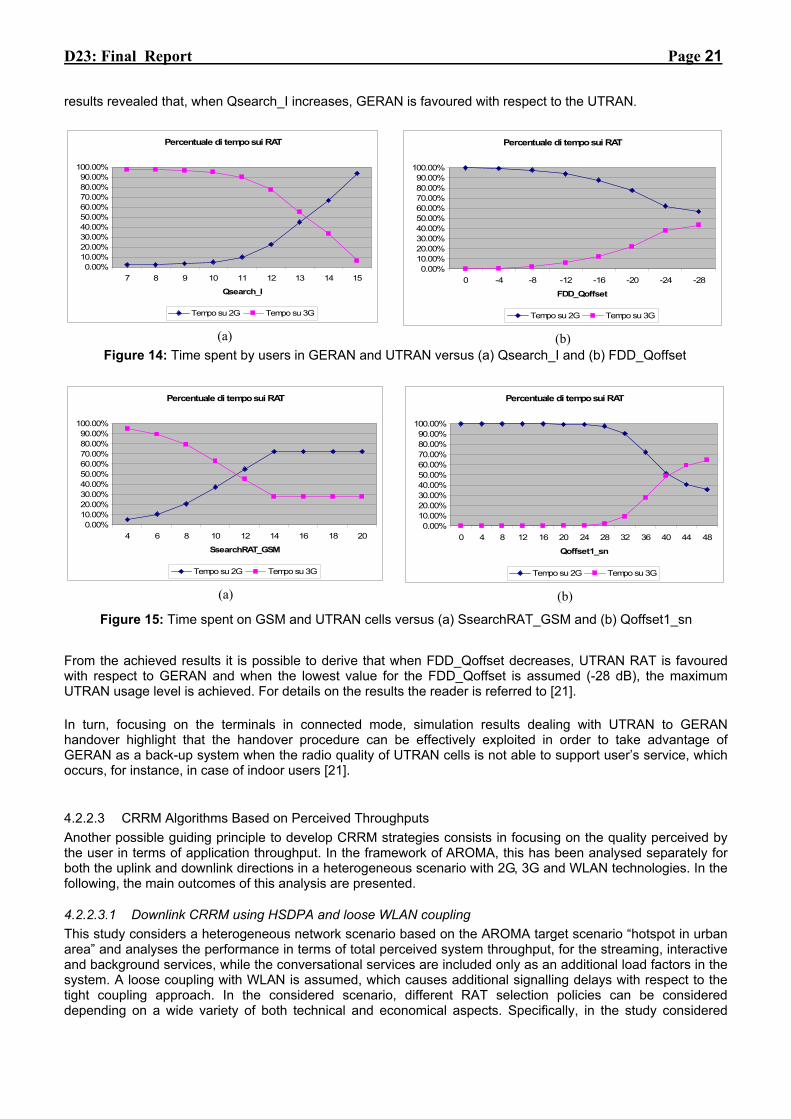
D23: Final Report Page 21
results revealed that, when Qsearch_I increases, GERAN is favoured with respect to the UTRAN.
Percentuale di tempo sui RAT
0.00%10.00%20.00%30.00%40.00%50.00%60.00%70.00%80.00%90.00%
100.00%
7 8 9 10 11 12 13 14 15
Qsearch_I
Tempo su 2G Tempo su 3G
(a)
Percentuale di tempo sui RAT
0.00%10.00%20.00%30.00%40.00%50.00%60.00%70.00%80.00%90.00%
100.00%
0 -4 -8 -12 -16 -20 -24 -28
FDD_Qoffset
Tempo su 2G Tempo su 3G
(b) Figure 14: Time spent by users in GERAN and UTRAN versus (a) Qsearch_I and (b) FDD_Qoffset
Percentuale di tempo sui RAT
0.00%10.00%20.00%30.00%40.00%50.00%60.00%70.00%80.00%90.00%
100.00%
4 6 8 10 12 14 16 18 20
SsearchRAT_GSM
Tempo su 2G Tempo su 3G
(a)
Percentuale di tempo sui RAT
0.00%10.00%20.00%30.00%40.00%50.00%60.00%70.00%80.00%90.00%
100.00%
0 4 8 12 16 20 24 28 32 36 40 44 48
Qoffset1_sn
Tempo su 2G Tempo su 3G
(b)
Figure 15: Time spent on GSM and UTRAN cells versus (a) SsearchRAT_GSM and (b) Qoffset1_sn
From the achieved results it is possible to derive that when FDD_Qoffset decreases, UTRAN RAT is favoured with respect to GERAN and when the lowest value for the FDD_Qoffset is assumed (-28 dB), the maximum UTRAN usage level is achieved. For details on the results the reader is referred to [21]. In turn, focusing on the terminals in connected mode, simulation results dealing with UTRAN to GERAN handover highlight that the handover procedure can be effectively exploited in order to take advantage of GERAN as a back-up system when the radio quality of UTRAN cells is not able to support user’s service, which occurs, for instance, in case of indoor users [21].
4.2.2.3 CRRM Algorithms Based on Perceived Throughputs Another possible guiding principle to develop CRRM strategies consists in focusing on the quality perceived by the user in terms of application throughput. In the framework of AROMA, this has been analysed separately for both the uplink and downlink directions in a heterogeneous scenario with 2G, 3G and WLAN technologies. In the following, the main outcomes of this analysis are presented.
4.2.2.3.1 Downlink CRRM using HSDPA and loose WLAN coupling This study considers a heterogeneous network scenario based on the AROMA target scenario “hotspot in urban area” and analyses the performance in terms of total perceived system throughput, for the streaming, interactive and background services, while the conversational services are included only as an additional load factors in the system. A loose coupling with WLAN is assumed, which causes additional signalling delays with respect to the tight coupling approach. In the considered scenario, different RAT selection policies can be considered depending on a wide variety of both technical and economical aspects. Specifically, in the study considered
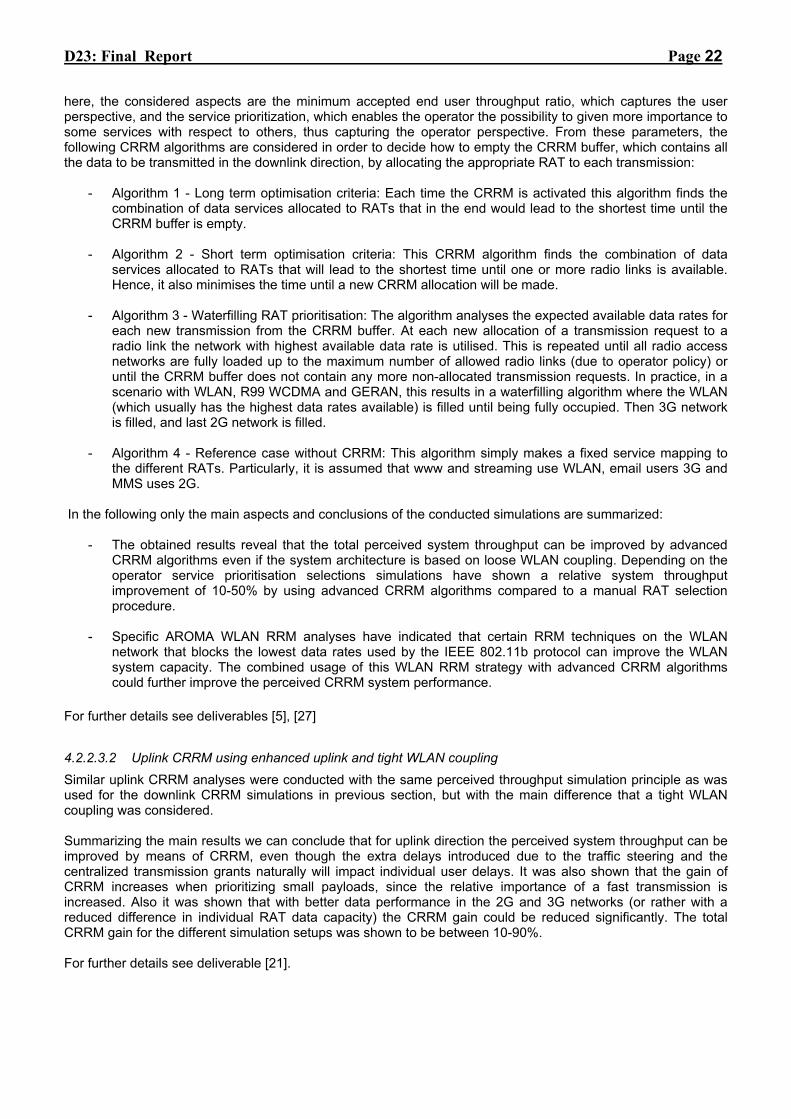
D23: Final Report Page 22
here, the considered aspects are the minimum accepted end user throughput ratio, which captures the user perspective, and the service prioritization, which enables the operator the possibility to given more importance to some services with respect to others, thus capturing the operator perspective. From these parameters, the following CRRM algorithms are considered in order to decide how to empty the CRRM buffer, which contains all the data to be transmitted in the downlink direction, by allocating the appropriate RAT to each transmission:
- Algorithm 1 - Long term optimisation criteria: Each time the CRRM is activated this algorithm finds the combination of data services allocated to RATs that in the end would lead to the shortest time until the CRRM buffer is empty.
- Algorithm 2 - Short term optimisation criteria: This CRRM algorithm finds the combination of data
services allocated to RATs that will lead to the shortest time until one or more radio links is available. Hence, it also minimises the time until a new CRRM allocation will be made.
- Algorithm 3 - Waterfilling RAT prioritisation: The algorithm analyses the expected available data rates for
each new transmission from the CRRM buffer. At each new allocation of a transmission request to a radio link the network with highest available data rate is utilised. This is repeated until all radio access networks are fully loaded up to the maximum number of allowed radio links (due to operator policy) or until the CRRM buffer does not contain any more non-allocated transmission requests. In practice, in a scenario with WLAN, R99 WCDMA and GERAN, this results in a waterfilling algorithm where the WLAN (which usually has the highest data rates available) is filled until being fully occupied. Then 3G network is filled, and last 2G network is filled.
- Algorithm 4 - Reference case without CRRM: This algorithm simply makes a fixed service mapping to
the different RATs. Particularly, it is assumed that www and streaming use WLAN, email users 3G and MMS uses 2G.
In the following only the main aspects and conclusions of the conducted simulations are summarized:
- The obtained results reveal that the total perceived system throughput can be improved by advanced CRRM algorithms even if the system architecture is based on loose WLAN coupling. Depending on the operator service prioritisation selections simulations have shown a relative system throughput improvement of 10-50% by using advanced CRRM algorithms compared to a manual RAT selection procedure.
- Specific AROMA WLAN RRM analyses have indicated that certain RRM techniques on the WLAN
network that blocks the lowest data rates used by the IEEE 802.11b protocol can improve the WLAN system capacity. The combined usage of this WLAN RRM strategy with advanced CRRM algorithms could further improve the perceived CRRM system performance.
For further details see deliverables [5], [27] 4.2.2.3.2 Uplink CRRM using enhanced uplink and tight WLAN coupling Similar uplink CRRM analyses were conducted with the same perceived throughput simulation principle as was used for the downlink CRRM simulations in previous section, but with the main difference that a tight WLAN coupling was considered. Summarizing the main results we can conclude that for uplink direction the perceived system throughput can be improved by means of CRRM, even though the extra delays introduced due to the traffic steering and the centralized transmission grants naturally will impact individual user delays. It was also shown that the gain of CRRM increases when prioritizing small payloads, since the relative importance of a fast transmission is increased. Also it was shown that with better data performance in the 2G and 3G networks (or rather with a reduced difference in individual RAT data capacity) the CRRM gain could be reduced significantly. The total CRRM gain for the different simulation setups was shown to be between 10-90%. For further details see deliverable [21].

D23: Final Report Page 23
4.2.2.4 CRRM based on a Cost Function Model Another relevant aspect to be considered when developing solutions to the RAT selection problem is to account for the different perspectives that different network players have over the network, namely the operator’s and user’s perspectives, which on the other hand, do not necessarily have to be related only with technical aspects but also subjective aspects such as how the user perceives a given service or economical aspects related with e.g. infrastructure deployment costs need also to be considered. In that sense, when operators and users look at the cellular network, they are sensitive to different parameters, meaning that, for a user the operator/network are seen as a service provider/infrastructure and therefore, for a user’s perspective service cost and quality are important. However, for a network operator, the same parameter can have opposite perspectives. These aspects are captured in the following framework, based on the definition of a Cost Function (CF) model. Specifically, for each RAT, a particular CF definition was identified, by using slightly different KPIs (Key Performance Indicators), i.e., each BS-RAT type has its own CF, supported on different and appropriate KPIs. One important issue, related to the computation of the CF model, is the different perspectives that different network players have over the network, which in this model are seen from the operators’ and users’ viewpoint, Table 1.
Table 1: Users and Operators CF Parameters.
Perspective KPIs User Operator Delay Service BS Average Blocking Service BS Average
Cost Service (Free, Flat, Volume or Time dependent)
BS
Throughput Service BS Average Service Availability
Number of RATs available -
Drop Rate Service VHO and HHO
User type - Mass Market, Premium
Interference - BS Level Load - BS
Channels - BS Occupied resources
When each of these groups “looks” to the network, they are sensitive to different parameters: for a user, the operator/network is seen as a service provider/infrastructure, therefore, e.g., service cost (being lower) and quality (being higher) are important; however, for an operator, the same parameter can have an opposite perspective, e.g., service cost should provide good revenue and simultaneously be competitive with other operators. Hence, in order to provide a more realistic balance in the overall network solution, the overall CF should combine both operator’s and user’s perspectives. Table 1 presents a list of KPIs identified for both perspectives [22]. One should note that not all KPIs have a correspondence to both perspectives, e.g., interference is clearly a very important parameter for an operator, but it does not carry any meaning for a typical user. Based on the previous concepts, the network total CF is divided into two sub-CFs, one being related to the operator and the other to users. Furthermore, the operator CF is also sub-divided, since different CFs are computed for each different RAT type. Each one of these sub CFs is weighted with different values, enabling the implementation and evaluation of different policies on CRRM and RRM algorithms over each type of RAT. See reference [23], [24] for details. The CF result applied to all BSs in a heterogeneous network environment offers to RRM and CRRM entities a good way to implement the Always Best Connected (ABC) concept [22], since each BS has a number associated to it, the cost value. Based on these values, the CRRM entity can sort a list of BSs reported/visible by each user, via the RRM entity. On the top of this list, it is expected to have the best BS (the lowest cost one) that potentially offers the best connection to a given user. Similar to BSs, each user has a cost value attached to him/her. This information is vital to take users’ interests into account, in the overall network management.
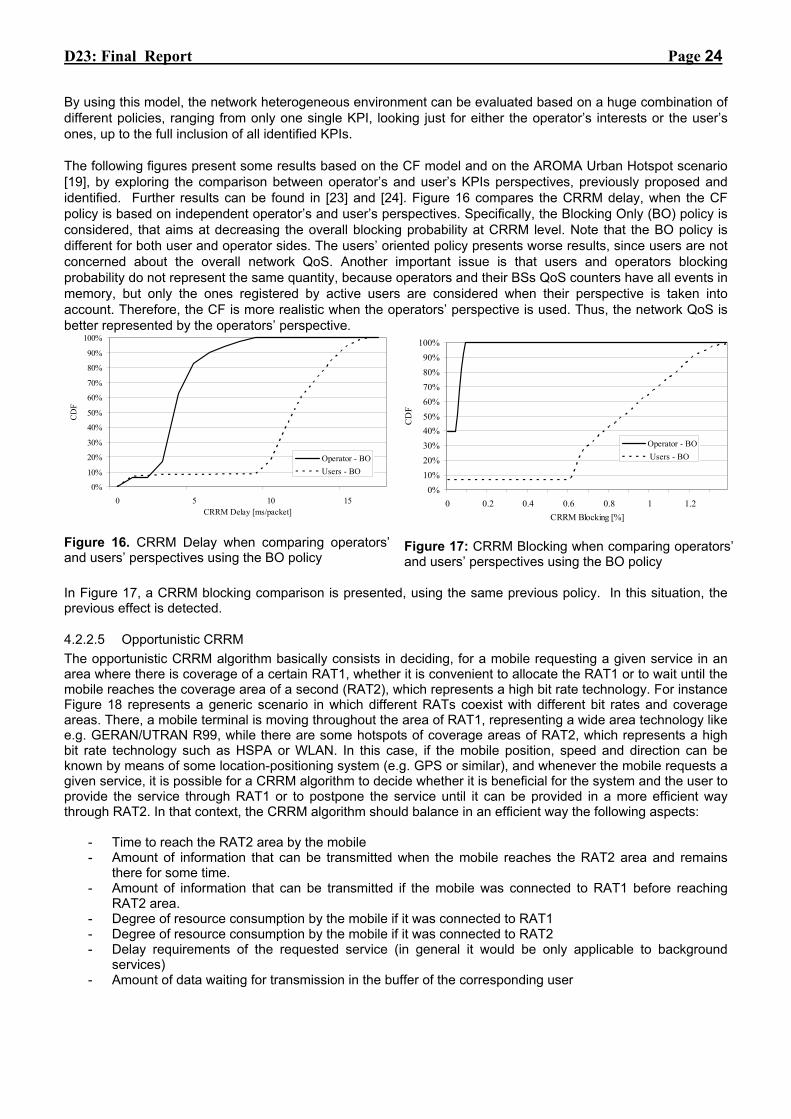
D23: Final Report Page 24
By using this model, the network heterogeneous environment can be evaluated based on a huge combination of different policies, ranging from only one single KPI, looking just for either the operator’s interests or the user’s ones, up to the full inclusion of all identified KPIs. The following figures present some results based on the CF model and on the AROMA Urban Hotspot scenario [19], by exploring the comparison between operator’s and user’s KPIs perspectives, previously proposed and identified. Further results can be found in [23] and [24]. Figure 16 compares the CRRM delay, when the CF policy is based on independent operator’s and user’s perspectives. Specifically, the Blocking Only (BO) policy is considered, that aims at decreasing the overall blocking probability at CRRM level. Note that the BO policy is different for both user and operator sides. The users’ oriented policy presents worse results, since users are not concerned about the overall network QoS. Another important issue is that users and operators blocking probability do not represent the same quantity, because operators and their BSs QoS counters have all events in memory, but only the ones registered by active users are considered when their perspective is taken into account. Therefore, the CF is more realistic when the operators’ perspective is used. Thus, the network QoS is better represented by the operators’ perspective.
0%
10%
20%
30%
40%
50%
60%
70%
80%
90%
100%
0 5 10 15CRRM Delay [ms/packet]
CD
F
Operator - BOUsers - BO
0%10%20%30%40%50%60%70%80%90%
100%
0 0.2 0.4 0.6 0.8 1 1.2CRRM Blocking [%]
CD
F
Operator - BO Users - BO
Figure 16. CRRM Delay when comparing operators’ and users’ perspectives using the BO policy
Figure 17: CRRM Blocking when comparing operators’ and users’ perspectives using the BO policy
In Figure 17, a CRRM blocking comparison is presented, using the same previous policy. In this situation, the previous effect is detected.
4.2.2.5 Opportunistic CRRM The opportunistic CRRM algorithm basically consists in deciding, for a mobile requesting a given service in an area where there is coverage of a certain RAT1, whether it is convenient to allocate the RAT1 or to wait until the mobile reaches the coverage area of a second (RAT2), which represents a high bit rate technology. For instance Figure 18 represents a generic scenario in which different RATs coexist with different bit rates and coverage areas. There, a mobile terminal is moving throughout the area of RAT1, representing a wide area technology like e.g. GERAN/UTRAN R99, while there are some hotspots of coverage areas of RAT2, which represents a high bit rate technology such as HSPA or WLAN. In this case, if the mobile position, speed and direction can be known by means of some location-positioning system (e.g. GPS or similar), and whenever the mobile requests a given service, it is possible for a CRRM algorithm to decide whether it is beneficial for the system and the user to provide the service through RAT1 or to postpone the service until it can be provided in a more efficient way through RAT2. In that context, the CRRM algorithm should balance in an efficient way the following aspects:
- Time to reach the RAT2 area by the mobile - Amount of information that can be transmitted when the mobile reaches the RAT2 area and remains
there for some time. - Amount of information that can be transmitted if the mobile was connected to RAT1 before reaching
RAT2 area. - Degree of resource consumption by the mobile if it was connected to RAT1 - Degree of resource consumption by the mobile if it was connected to RAT2 - Delay requirements of the requested service (in general it would be only applicable to background
services) - Amount of data waiting for transmission in the buffer of the corresponding user

D23: Final Report Page 25
Coverage area RAT#1
Coverage area RAT#2
DR2
v
Figure 18: Opportunistic CRRM concept.
Notice that the opportunistic concept should be applied if we envisage that the time needed to reach a “high speed area” is acceptable for the service and that, once there, we will have enough time to transmit the buffered information and that, from a resource consumption point of view the network can obtain some benefit in terms of e.g. lower blocking probability for users connected in the RAT1, higher throughput, etc. Therefore, from a service point of view, this algorithm will only be applicable for non real time services without stringent delay constraints, typically belonging to the background class. In that sense, ftp transfers of large volumes of data or peer-to-peer applications would be candidate applications to be used with this type of service The above algorithm has been evaluated by means of system level simulations under different conditions in a scenario where the high bit rate RAT is HSPA and the low bit rate RAT is UTRAN R99. Specifically, it is assumed that one of the cells of the scenario has HSPA capabilities, and thus the opportunistic CRRM algorithm can decide to wait for the arrival to the coverage area of this cell or to allocate a R99 channel in the current cell. Evaluations for both the uplink and the downlink transfer of different file sizes for the opportunistic users have been carried out. Uplink results Looking at the opportunistic transmission in the uplink direction it is observed that the opportunistic transmission is particularly useful when large amounts of data are about to be transferred. Moreover, the algorithm achieves an interference reduction which allows increasing the throughput of the users operating in R99. Improvements in around 15% are observed (see Figure 19). This improvement is achieved at the expense of a small degradation (around 6%) in the average delay experienced by users operating in opportunistic mode.
100 conv
1000000
1500000
2000000
2500000
3000000
3500000
4000000
50 60 70 80 90 100 110 120 130 140 150
Num users opportunistic
Thro
ughp
ut C
onve
rsat
iona
l (b/
s)
Opportunistic (s0)No Opportunistic (s0)Opportunistic (s6)No Opportunistic (s6)
Figure 19: Total throughput of conversational users for the case without shadowing (s0) and with a shadowing
of 6 dB (s6)
In addition to that the effect of the errors in the decision due to the uncertainties in the mobile trajectories has also been analysed. These uncertainties can arise from the shadowing variations as well as from the randomness associated with the mobility model. As a general result, the introduction of more randomness in the mobile trajectories leads to an increase in the delay degradation and a decrease in the throughput improvement.
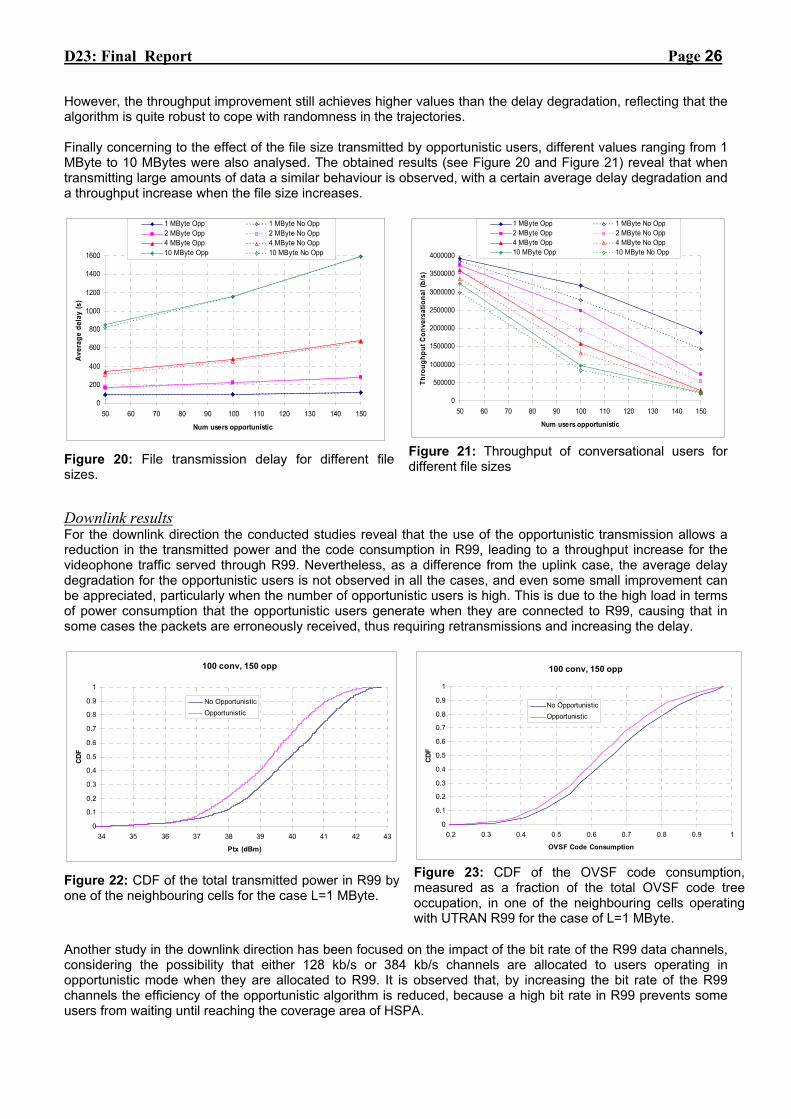
D23: Final Report Page 26
However, the throughput improvement still achieves higher values than the delay degradation, reflecting that the algorithm is quite robust to cope with randomness in the trajectories. Finally concerning to the effect of the file size transmitted by opportunistic users, different values ranging from 1 MByte to 10 MBytes were also analysed. The obtained results (see Figure 20 and Figure 21) reveal that when transmitting large amounts of data a similar behaviour is observed, with a certain average delay degradation and a throughput increase when the file size increases.
0
200
400
600
800
1000
1200
1400
1600
50 60 70 80 90 100 110 120 130 140 150
Num users opportunistic
Ave
rage
del
ay (s
)
1 MByte Opp 1 MByte No Opp2 MByte Opp 2 MByte No Opp4 MByte Opp 4 MByte No Opp10 MByte Opp 10 MByte No Opp
0
500000
1000000
1500000
2000000
2500000
3000000
3500000
4000000
50 60 70 80 90 100 110 120 130 140 150
Num users opportunisticTh
roug
hput
Con
vers
atio
nal (
b/s)
1 MByte Opp 1 MByte No Opp2 MByte Opp 2 MByte No Opp4 MByte Opp 4 MByte No Opp10 MByte Opp 10 MByte No Opp
Figure 20: File transmission delay for different file sizes.
Figure 21: Throughput of conversational users for different file sizes
Downlink results For the downlink direction the conducted studies reveal that the use of the opportunistic transmission allows a reduction in the transmitted power and the code consumption in R99, leading to a throughput increase for the videophone traffic served through R99. Nevertheless, as a difference from the uplink case, the average delay degradation for the opportunistic users is not observed in all the cases, and even some small improvement can be appreciated, particularly when the number of opportunistic users is high. This is due to the high load in terms of power consumption that the opportunistic users generate when they are connected to R99, causing that in some cases the packets are erroneously received, thus requiring retransmissions and increasing the delay.
100 conv, 150 opp
0
0.1
0.2
0.3
0.4
0.5
0.6
0.7
0.8
0.9
1
34 35 36 37 38 39 40 41 42 43
Ptx (dBm)
CDF
No OpportunisticOpportunistic
100 conv, 150 opp
0
0.1
0.2
0.3
0.4
0.5
0.6
0.7
0.8
0.9
1
0.2 0.3 0.4 0.5 0.6 0.7 0.8 0.9 1
OVSF Code Consumption
CDF
No OpportunisticOpportunistic
Figure 22: CDF of the total transmitted power in R99 by one of the neighbouring cells for the case L=1 MByte.
Figure 23: CDF of the OVSF code consumption, measured as a fraction of the total OVSF code tree occupation, in one of the neighbouring cells operating with UTRAN R99 for the case of L=1 MByte.
Another study in the downlink direction has been focused on the impact of the bit rate of the R99 data channels, considering the possibility that either 128 kb/s or 384 kb/s channels are allocated to users operating in opportunistic mode when they are allocated to R99. It is observed that, by increasing the bit rate of the R99 channels the efficiency of the opportunistic algorithm is reduced, because a high bit rate in R99 prevents some users from waiting until reaching the coverage area of HSPA.

D23: Final Report Page 27
4.2.2.6 Fittingness factor-based CRRM Following the previous studies related with coverage and different operator/user perspectives, and trying to combine the different obtained conclusions, a generic framework trying to capture all the effects influencing on the RAT selection decisions is presented. Specifically, in order to cope with the multi-dimensional heterogeneity reflected in Figure 13, the following main levels are identified in the RAT selection problem: 1) Capabilities. A user-to-RAT association may not be possible for limitations in e.g. the user terminal
capabilities (single-mode terminal) or the type of services supported by the RAT (e.g. videophone is not supported in 2G).
2) Technical suitability at the radio part. A user-to-RAT association may or may not be suitable depending on the matching between the user requirements in terms of QoS and the capabilities offered by the RAT (e.g. a business user may require bit rate capabilities feasible on HSDPA and not on GPRS or these capabilities can be realised in one technology or another depending on the RAT occupancy, etc.). There is a number of considerations, which can be split at two different levels:
a) Macroscopic. Radio considerations at cell level such as load level or, equivalently, amount of radio resources available.
b) Microscopic. Radio considerations at local level (i.e. user position) such as path loss, intercell interference level. This component will be relevant for the user-to-RAT association when the amount of radio resources required for providing the user with the required QoS significantly depends on the local conditions where the user is (e.g. power level required in WCDMA downlink).
3) Technical suitability at the transport part: A user-to-RAT association may or may not be suitable depending on the matching between the user requirements in terms of QoS and the capabilities offered by the transport network, mainly depending on the current load existing in the different links.
4) Operator/user preferences: Specific user-to-RAT associations may be preferred without any specific technical criterion but responding to more subjective and economic-related aspects (e.g. due to the investment carried out by an operator to deploy a given technology it can be preferred to serve the traffic through this technology so that investments can be recouped faster, the operator prefers to give some precedence of a service over another one depending on market strategies, etc.).
The above concepts can be captured in the so-called fittingness factor, which reflects the degree of adequacy of a given RAT to a given service requested by a given user. The fittingness factor is computed as the product of four different terms, which are:
Capabilities. This term in reflects the hard constraints posed by the capabilities of either the terminal or the technology. Technical suitability in the radio part: This term reflects the suitability of a given RAT to support the specific service requested by the i-th user with the a given customer profile. It accounts for a user-specific suitability according to the bit rate that can be allocated to the user depending on the existing load and the path loss experienced by the user. From a microscopic point of view, the definition of this term should take into consideration aspects such as the link adaptation mechanisms, for instance as the used in GERAN, which reduce the modulation and coding scheme (i.e. equivalently the bit rate) of users experiencing bad propagation conditions, or the transport format reduction considered in UTRAN. Similarly, from a macroscopic point of view, the definition should account for the multiplexing of users onto shared channels according to specific scheduling strategies, which reduces the effective data rate that can be achieved by the different transmissions. Network-centric suitability. This term intends to capture the suitability from an overall RAT perspective, then to provide further flexibility on the fittingness factor definition. For that purpose, this term can include tuneable parameters to allow the enforcement of specific operator policies arising from the trade-off between the degree of QoS to be provided to different types of traffic. Let define the non-flexible load in one RAT as the total load coming from non-flexible traffic, which is the traffic that can only be served through one specific RAT and therefore it does not provide flexibility to CRRM strategy. Then, the Network-centric suitability term is a function that reduces the fittingness factor of flexible traffic depending on the amount of non-flexible load. The idea is that if there is a high amount of non-flexible load in a given RAT, this RAT is made less attractive for flexible load, thus leaving room to non-flexible users. It is worth mentioning that the definition of the network-centric suitability can include tuneable parameters to allow the enforcement of specific operator policies arising from the trade-off between the degree of QoS to be provided to the non-flexible traffic with respect to the flexible traffic [25].

D23: Final Report Page 28
Transport network capabilities: This term will account for the bit rate available for this user/service/profile in the transport network of a given RAT j . It is defined in accordance with the Path Utilisation (PU) metric representing the bottleneck link utilisation in the Iub interface for a given path between a NodeB and its controller RNC. The fittingness factor should be computed separately for uplink and downlink of a given RAT. Then, a weighting between the two values can be carried out depending on the service characteristics [25]. When the fittingness factor is considered for RAT selection algorithm, two approaches different shall be taken into account depending on whether the selection is done at session set-up or during an on-going connection. Specifically, for a user requesting a given service s, the procedure would be: Session set-up case
Step 1.- Measure the fittingness factor for each candidate cell kj of the j-th detected RAT. Step 2.- Select the RAT J having the cell with the highest fittingness factor among all the candidate cells. In
case that two or more RATs have the same value of the fittingness factor, then select the less loaded RAT.
Step 3.- Try admission in the RAT J. Step 4.- If admission is not possible, try with the next RAT in decreasing order of fittingness factor, provided
that its fittingness factor is higher than 0. If no other RATs with fittingness factor higher than 0 exist, block the call.
On-going connection case
For on-going connections, the proposed criterion to execute a VHO algorithm based on the fittingness factor would be as follows, assuming that the terminal is connected to the RAT denoted as “servingRAT” and cell denoted as “servingCell”.
Step 1.- For each candidate cell and RAT, monitor the corresponding fittingness factor. Measures should be averaged during a period T.
Step 2.- If the fittingness factor of a given RAT in an specific cell a is greater than the fittingness factor of the current serving RAT and cell for a period TVHO then a vertical handover to the new RAT and/or cell should be triggered, provided that there are available resources for the user in this RAT and cell.
Results on the fittingness factor based CRRM The developed framework has been analyzed through exhaustive simulations in a variety of scenarios with different traffic mixes to reveal the ability to adapt to the conditions in each case. In the following some results are given to illustrate the benefits of the proposed framework. They consider a scenario with UTRAN R99 and GERAN cells with EDGE capabilities. Voice at 12.2 kb/s and videocall at 64 kb/s services are considered as representative of the conversational traffic class while a www browsing service with two different profiles, namely consumer (with bit rate up to 128 kb/s in UTRAN and low priority in GERAN) and business (with bit rate up to 384 kb/s and high priority in GERAN), have been selected as representative of the interactive traffic class. In order to illustrate how the fittingness factor algorithm affects the traffic splitting among the two RATs, Figure 24 plots the fraction of traffic served through GERAN for the voice, interactive consumer and business profiles when increasing the total load coming from videocall users (which are always served through UTRAN). For comparison purposes, the distribution according to the load balancing case (LB) is also shown, in which the less loaded RAT is selected at session set-up. It can be observed how LB does not make significant distinctions among the considered services, with the general trend that, by increasing the load of videocall users, more traffic of the other services should be derived to GERAN in order to keep similar load levels in the two RATs. On the contrary, the fittingness factor based algorithm is able to split the traffic according to the peculiarities of each service. In particular, most of the interactive business traffic is served through UTRAN, where this type of traffic can achieve a higher bit rate. Only in case that the videocall load is very high there is a certain interactive business traffic that should be moved to GERAN. In turn, when looking at the voice and interactive consumer users, as a result of the increase in videocall load, the algorithm tends to move to GERAN mainly the voice traffic, while it keeps a significant fraction of interactive consumer traffic still in UTRAN.

D23: Final Report Page 29
0
10
20
30
40
50
60
70
80
90
100
100 150 200 250 300 350 400
Users Videocall
% o
f Tra
ffic
serv
ed in
GER
AN
Voice (Fitt) Voice (LB)Interactive Consumer (Fitt) Interactive Consumer (LB)Interactive Business (Fitt) Interactive Business (LB)
0
0.2
0.4
0.6
0.8
1
1.2
0 100 200 300 400 500 600 700 800
Voice users
DL d
elay
(s)
Business (LB) Business (Fitt)
Consumer (LB) Consumer (Fitt)
Figure 24: Fraction of traffic served through GERAN as a function of the videocall users for the fittingness factor and the load balancing strategies
Figure 25: DL packet delay for interactive business and consumer users according to the fittingness factor and the load balancing case
The different traffic split impacts over the QoS observed by each service, as it is reflected in Figure 25, which compares the packet delay of the interactive consumer and business users with the fittingness factor based algorithm and with LB when increasing the load of voice users in the scenario. It is observed that the performance from a user point of view is better with the fittingness factor-based algorithm than with LB for the two user profiles. Although it is not plot here for the sake of brevity, the total throughput achieved in the scenario in this case is approximately the same for the two approaches, which reflects that the fittingness factor is able to improve the user QoS perception without degrading the overall capacity.
Business Users
0
0.1
0.20.3
0.40.5
0.6
0.7
0.8
0.9
1
100 150 200 250 300 350 400
Videocall users
DL
dela
y (s
)
Load Balancing Fittingness Setting 1 Fittingness Setting 2
Total Throughput
4
5
6
7
8
9
10
11
12
100 150 200 250 300 350 400
Videocall users
DL
Thro
ughp
ut (M
b/s)
Load Balancing Fittingness Setting 1 Fittingness Setting 2
Figure 26: DL packet delay of business interactive users
Figure 27: Total scenario DL throughput when increasing the videocall load
The impact of the videocall users, which are a non-flexible type of traffic, is plot in Figure 26 and Figure 27 in terms of packet delay and total throughput in the scenario. To illustrate the ability of the algorithm to reflect different operator criteria, two different settings have been considered in the network-centric suitability component. Setting 1 reflects the case in which the operator aims at improving the QoS of the interactive business users. In this case, as reflected in Figure 26, the delay for this traffic is the smallest one among the considered approaches, which is achieved by keeping as much as possible this traffic in UTRAN, even if videocall load is high. However, this improvement occurs at the expense of a reduction in the throughput of non-flexible traffic, because the interactive users leave less room in UTRAN. As a result, there is some reduction in the total throughput in the scenario, as shown in Figure 27. In turn, setting 2 reflects the situation in which the operator prefers to keep more capacity for the videocall traffic in UTRAN, which is ensured by allowing that some interactive business users are served through GERAN. Notice in Figure 26 and Figure 27 that, with this setting, the total throughput in the scenario is increased with respect to setting 1 at the expense of some delay degradation. Nevertheless, the delay is still much better than that achieved with LB. Finally, in order to illustrate how the fittingness factor based algorithm can be integrated in the CARM framework in order to cope with transport network limitations, results have been obtained in a UTRAN/GERAN co-site scenario in which there exists a bottleneck in the Iub interface of one UTRAN cell, namely BS3. Figure 28 plots
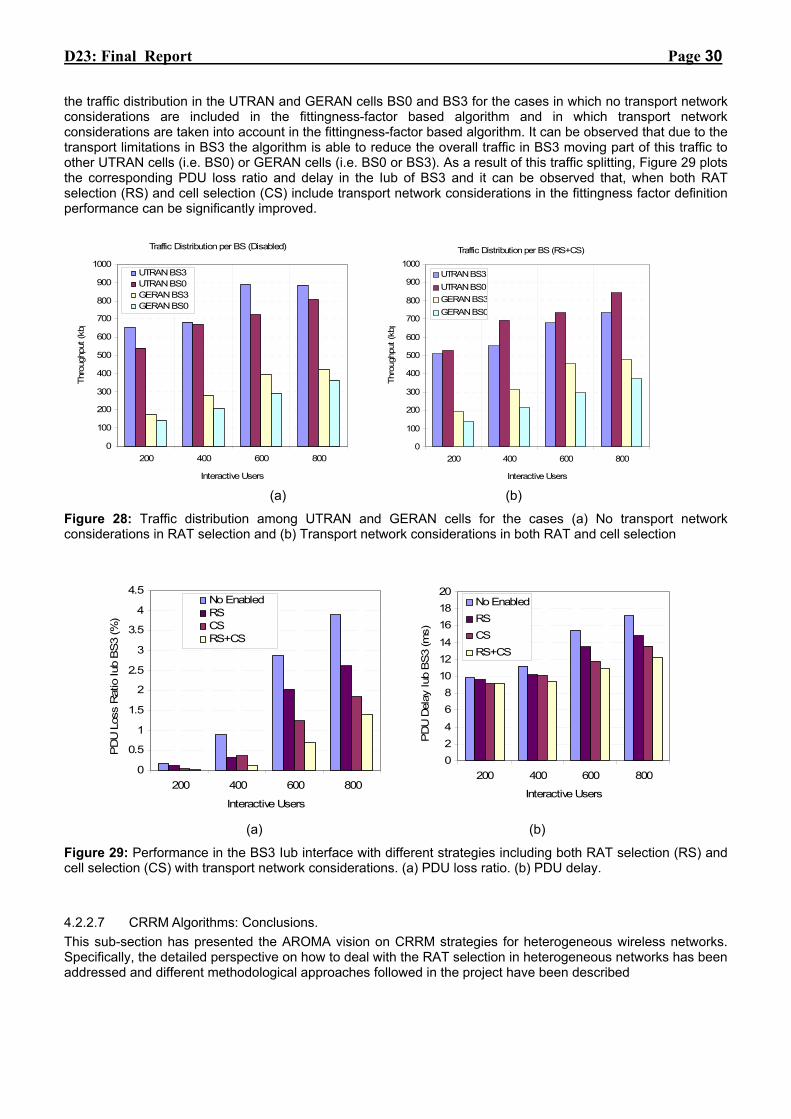
D23: Final Report Page 30
the traffic distribution in the UTRAN and GERAN cells BS0 and BS3 for the cases in which no transport network considerations are included in the fittingness-factor based algorithm and in which transport network considerations are taken into account in the fittingness-factor based algorithm. It can be observed that due to the transport limitations in BS3 the algorithm is able to reduce the overall traffic in BS3 moving part of this traffic to other UTRAN cells (i.e. BS0) or GERAN cells (i.e. BS0 or BS3). As a result of this traffic splitting, Figure 29 plots the corresponding PDU loss ratio and delay in the Iub of BS3 and it can be observed that, when both RAT selection (RS) and cell selection (CS) include transport network considerations in the fittingness factor definition performance can be significantly improved.
Traffic Distribution per BS (Disabled)
0
100
200
300
400
500
600
700
800
900
1000
200 400 600 800
Interactive Users
Thro
ughp
ut (k
bp
UTRAN BS3UTRAN BS0GERAN BS3GERAN BS0
Traffic Distribution per BS (RS+CS)
0
100
200
300
400
500
600
700
800
900
1000
200 400 600 800
Interactive Users
Thro
ughp
ut (k
bp
UTRAN BS3UTRAN BS0GERAN BS3GERAN BS0
(a) (b)
Figure 28: Traffic distribution among UTRAN and GERAN cells for the cases (a) No transport network considerations in RAT selection and (b) Transport network considerations in both RAT and cell selection
0
0.5
1
1.5
2
2.5
3
3.5
4
4.5
200 400 600 800
Interactive Users
PD
U L
oss
Rat
io Iu
b B
S3
(%)
No EnabledRSCSRS+CS
024
68
101214
161820
200 400 600 800
Interactive Users
PD
U D
elay
Iub
BS
3 (m
s)
No EnabledRSCSRS+CS
(a) (b)
Figure 29: Performance in the BS3 Iub interface with different strategies including both RAT selection (RS) and cell selection (CS) with transport network considerations. (a) PDU loss ratio. (b) PDU delay.
4.2.2.7 CRRM Algorithms: Conclusions. This sub-section has presented the AROMA vision on CRRM strategies for heterogeneous wireless networks. Specifically, the detailed perspective on how to deal with the RAT selection in heterogeneous networks has been addressed and different methodological approaches followed in the project have been described
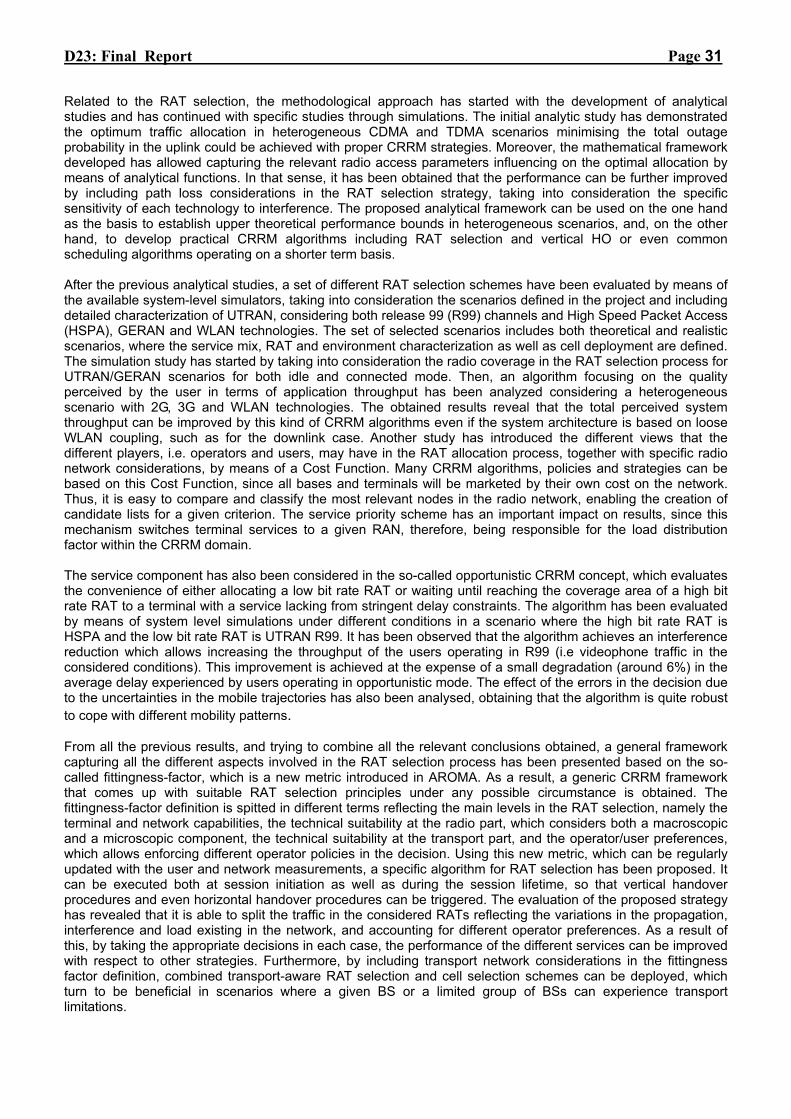
D23: Final Report Page 31
Related to the RAT selection, the methodological approach has started with the development of analytical studies and has continued with specific studies through simulations. The initial analytic study has demonstrated the optimum traffic allocation in heterogeneous CDMA and TDMA scenarios minimising the total outage probability in the uplink could be achieved with proper CRRM strategies. Moreover, the mathematical framework developed has allowed capturing the relevant radio access parameters influencing on the optimal allocation by means of analytical functions. In that sense, it has been obtained that the performance can be further improved by including path loss considerations in the RAT selection strategy, taking into consideration the specific sensitivity of each technology to interference. The proposed analytical framework can be used on the one hand as the basis to establish upper theoretical performance bounds in heterogeneous scenarios, and, on the other hand, to develop practical CRRM algorithms including RAT selection and vertical HO or even common scheduling algorithms operating on a shorter term basis. After the previous analytical studies, a set of different RAT selection schemes have been evaluated by means of the available system-level simulators, taking into consideration the scenarios defined in the project and including detailed characterization of UTRAN, considering both release 99 (R99) channels and High Speed Packet Access (HSPA), GERAN and WLAN technologies. The set of selected scenarios includes both theoretical and realistic scenarios, where the service mix, RAT and environment characterization as well as cell deployment are defined. The simulation study has started by taking into consideration the radio coverage in the RAT selection process for UTRAN/GERAN scenarios for both idle and connected mode. Then, an algorithm focusing on the quality perceived by the user in terms of application throughput has been analyzed considering a heterogeneous scenario with 2G, 3G and WLAN technologies. The obtained results reveal that the total perceived system throughput can be improved by this kind of CRRM algorithms even if the system architecture is based on loose WLAN coupling, such as for the downlink case. Another study has introduced the different views that the different players, i.e. operators and users, may have in the RAT allocation process, together with specific radio network considerations, by means of a Cost Function. Many CRRM algorithms, policies and strategies can be based on this Cost Function, since all bases and terminals will be marketed by their own cost on the network. Thus, it is easy to compare and classify the most relevant nodes in the radio network, enabling the creation of candidate lists for a given criterion. The service priority scheme has an important impact on results, since this mechanism switches terminal services to a given RAN, therefore, being responsible for the load distribution factor within the CRRM domain. The service component has also been considered in the so-called opportunistic CRRM concept, which evaluates the convenience of either allocating a low bit rate RAT or waiting until reaching the coverage area of a high bit rate RAT to a terminal with a service lacking from stringent delay constraints. The algorithm has been evaluated by means of system level simulations under different conditions in a scenario where the high bit rate RAT is HSPA and the low bit rate RAT is UTRAN R99. It has been observed that the algorithm achieves an interference reduction which allows increasing the throughput of the users operating in R99 (i.e videophone traffic in the considered conditions). This improvement is achieved at the expense of a small degradation (around 6%) in the average delay experienced by users operating in opportunistic mode. The effect of the errors in the decision due to the uncertainties in the mobile trajectories has also been analysed, obtaining that the algorithm is quite robust to cope with different mobility patterns. From all the previous results, and trying to combine all the relevant conclusions obtained, a general framework capturing all the different aspects involved in the RAT selection process has been presented based on the so-called fittingness-factor, which is a new metric introduced in AROMA. As a result, a generic CRRM framework that comes up with suitable RAT selection principles under any possible circumstance is obtained. The fittingness-factor definition is spitted in different terms reflecting the main levels in the RAT selection, namely the terminal and network capabilities, the technical suitability at the radio part, which considers both a macroscopic and a microscopic component, the technical suitability at the transport part, and the operator/user preferences, which allows enforcing different operator policies in the decision. Using this new metric, which can be regularly updated with the user and network measurements, a specific algorithm for RAT selection has been proposed. It can be executed both at session initiation as well as during the session lifetime, so that vertical handover procedures and even horizontal handover procedures can be triggered. The evaluation of the proposed strategy has revealed that it is able to split the traffic in the considered RATs reflecting the variations in the propagation, interference and load existing in the network, and accounting for different operator preferences. As a result of this, by taking the appropriate decisions in each case, the performance of the different services can be improved with respect to other strategies. Furthermore, by including transport network considerations in the fittingness factor definition, combined transport-aware RAT selection and cell selection schemes can be deployed, which turn to be beneficial in scenarios where a given BS or a limited group of BSs can experience transport limitations.
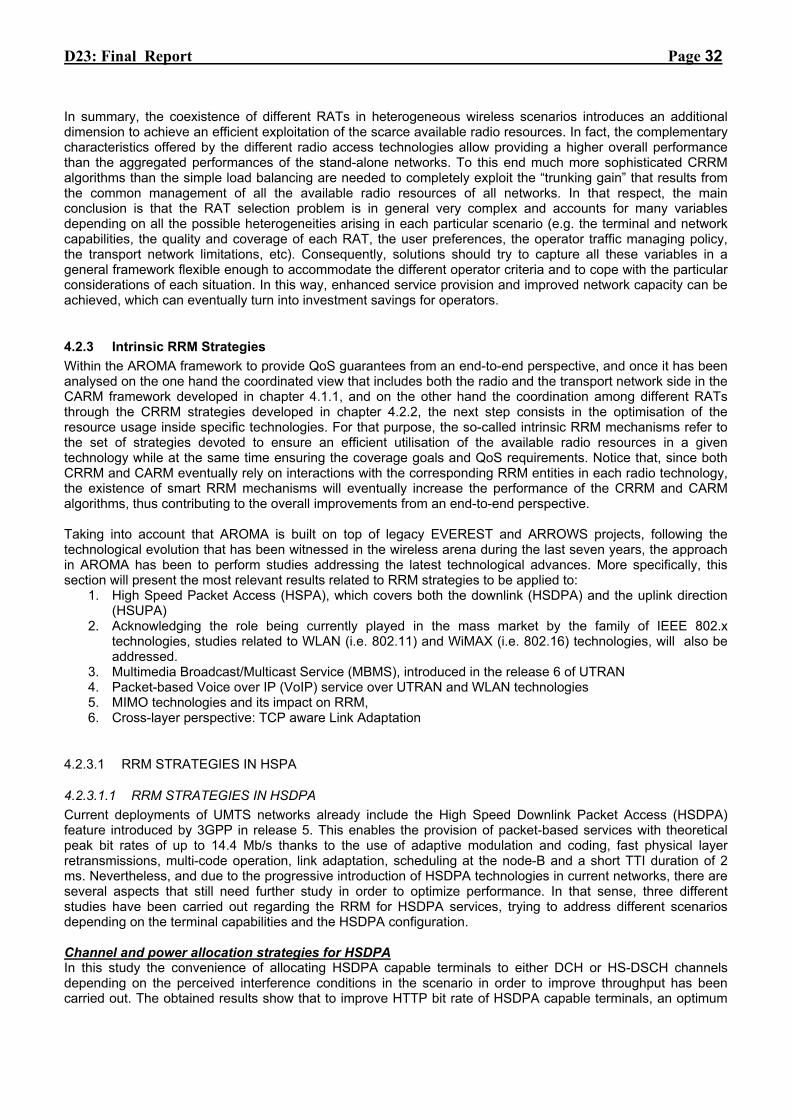
D23: Final Report Page 32
In summary, the coexistence of different RATs in heterogeneous wireless scenarios introduces an additional dimension to achieve an efficient exploitation of the scarce available radio resources. In fact, the complementary characteristics offered by the different radio access technologies allow providing a higher overall performance than the aggregated performances of the stand-alone networks. To this end much more sophisticated CRRM algorithms than the simple load balancing are needed to completely exploit the “trunking gain” that results from the common management of all the available radio resources of all networks. In that respect, the main conclusion is that the RAT selection problem is in general very complex and accounts for many variables depending on all the possible heterogeneities arising in each particular scenario (e.g. the terminal and network capabilities, the quality and coverage of each RAT, the user preferences, the operator traffic managing policy, the transport network limitations, etc). Consequently, solutions should try to capture all these variables in a general framework flexible enough to accommodate the different operator criteria and to cope with the particular considerations of each situation. In this way, enhanced service provision and improved network capacity can be achieved, which can eventually turn into investment savings for operators.
4.2.3 Intrinsic RRM Strategies Within the AROMA framework to provide QoS guarantees from an end-to-end perspective, and once it has been analysed on the one hand the coordinated view that includes both the radio and the transport network side in the CARM framework developed in chapter 4.1.1, and on the other hand the coordination among different RATs through the CRRM strategies developed in chapter 4.2.2, the next step consists in the optimisation of the resource usage inside specific technologies. For that purpose, the so-called intrinsic RRM mechanisms refer to the set of strategies devoted to ensure an efficient utilisation of the available radio resources in a given technology while at the same time ensuring the coverage goals and QoS requirements. Notice that, since both CRRM and CARM eventually rely on interactions with the corresponding RRM entities in each radio technology, the existence of smart RRM mechanisms will eventually increase the performance of the CRRM and CARM algorithms, thus contributing to the overall improvements from an end-to-end perspective. Taking into account that AROMA is built on top of legacy EVEREST and ARROWS projects, following the technological evolution that has been witnessed in the wireless arena during the last seven years, the approach in AROMA has been to perform studies addressing the latest technological advances. More specifically, this section will present the most relevant results related to RRM strategies to be applied to:
1. High Speed Packet Access (HSPA), which covers both the downlink (HSDPA) and the uplink direction (HSUPA)
2. Acknowledging the role being currently played in the mass market by the family of IEEE 802.x technologies, studies related to WLAN (i.e. 802.11) and WiMAX (i.e. 802.16) technologies, will also be addressed.
3. Multimedia Broadcast/Multicast Service (MBMS), introduced in the release 6 of UTRAN 4. Packet-based Voice over IP (VoIP) service over UTRAN and WLAN technologies 5. MIMO technologies and its impact on RRM, 6. Cross-layer perspective: TCP aware Link Adaptation
4.2.3.1 RRM STRATEGIES IN HSPA
4.2.3.1.1 RRM STRATEGIES IN HSDPA Current deployments of UMTS networks already include the High Speed Downlink Packet Access (HSDPA) feature introduced by 3GPP in release 5. This enables the provision of packet-based services with theoretical peak bit rates of up to 14.4 Mb/s thanks to the use of adaptive modulation and coding, fast physical layer retransmissions, multi-code operation, link adaptation, scheduling at the node-B and a short TTI duration of 2 ms. Nevertheless, and due to the progressive introduction of HSDPA technologies in current networks, there are several aspects that still need further study in order to optimize performance. In that sense, three different studies have been carried out regarding the RRM for HSDPA services, trying to address different scenarios depending on the terminal capabilities and the HSDPA configuration. Channel and power allocation strategies for HSDPA In this study the convenience of allocating HSDPA capable terminals to either DCH or HS-DSCH channels depending on the perceived interference conditions in the scenario in order to improve throughput has been carried out. The obtained results show that to improve HTTP bit rate of HSDPA capable terminals, an optimum

D23: Final Report Page 33
RRM strategy is to direct HSDPA capable terminals to DCH when the I-factor (other-to-own cell interference ratio) is larger than 1.9.
In addition to that, in this study, also efficient ways to ensure that there are enough radio resources available in HS-DSCH for streaming services were explored: In particular, AROMA also studied the effect of reserving power statically or dynamically to HS-DSCH and to set the maximal power, Pmax, of dedicated and control channels to a lower value. To get a low dropping ratio of streaming services over HSDPA, Pmax should not be set higher than 17 W. It is preferable to use a dynamic power setting, since it gives a lower streaming dropping rate of HSDPA capable UEs at 17 W and a lower blocking rate of the streaming services. Analysis of the number of codes reserved for HSDPA In this study, the evaluation of the power to be allocated to HSDPA in accordance with the terminal capabilities has also been carried out. As a first study the possibilities to devote 5, 7, 10, 12 and 15 codes to HSDPA were analysed, assuming a mix of 200 users of R99 and 75 users of HSDPA. The obtained results reveal that in order to increase the throughput a convenient solution could be: first to increase the power devoted to HSDPA, and then, once the power has been increased, the number of codes can be varied up to the maximum of 10, provided that HSDPA and R99 operate in the same carrier. Values greater than 10 would produce an important reduction in the R99 throughput. A second study that analyses the impact of the progressive inclusion of terminals supporting better HSDPA capabilities was also addressed. The obtained results reveal that, as new categories of terminals start appearing, the throughput per sector can be maximised with little impact on R99 users if the number of OVSF codes is increased up to 10. On the other hand, in case that a second carrier was included, enabling the increase of up to 12 or 15 OVSF codes for HSDPA, the impact of the different terminal capabilities can be more clearly observed because in this case the terminals are able to better exploit their multi-code capabilities, thus increasing the throughput per sector A third study related to an algorithm that automatically adjusts the power devoted to HSDPA in order to maximize the throughput per sector was also carried out. The results reveal that the throughput per sector can be increased at the expense of a certain reduction in the number of connected R99 users due to the higher power devoted to HSDPA in case that the algorithm is applied. A part from this, the impact of the number of OVSF codes and the terminal categories is similar to the previous cases. Impact of HSDPA and channel switching over different service classes Finally, the adequate mapping of business and consumer interactive traffic classes to either HSDPA or R99 channels including channel switching was studied. Channel switching strategies intend to optimize the use of the radio resources by dynamically changing the physical resources allocated to the interactive RAB users, according to the amount of data that needs to be transmitted. Specifically, this functionality is applied to interactive traffic without stringent QoS requirements. It operates by switching this traffic to common transport channels whenever a user has a small amount of data to send or receive. When the traffic handled by the UE increases the user is switched to a dedicated transport channel again, if there are resources available. In this framework, the study assumes the existence of two different QoS classes for the interactive service, namely business users and consumer users. Different possibilities were explored regarding how these classes are mapped onto specific RABs. Particularly, for the business profile it is considered its provision either through HSDPA or through R99 DCH channels with 64/128 or 64/384 kb/s. In turn for the consumer profile, it is assumed that the service is only provided through DCH channels From the obtained results it can be inferred that, whenever the operator aims at discerning between user classes, it is preferable to provide business service through HSDPA, because these increases not only the throughput of business users but also the throughput of consumer users in R99, since more power and code resources are available for these users.
4.2.3.1.2 RRM STRATEGIES IN HSUPA HSUPA is designed to support high speed packet access over the uplink in UTRAN. To achieve this, a set of new traffic channel are introduced to enhance the uplink performance in release 6. To this end, fast node B
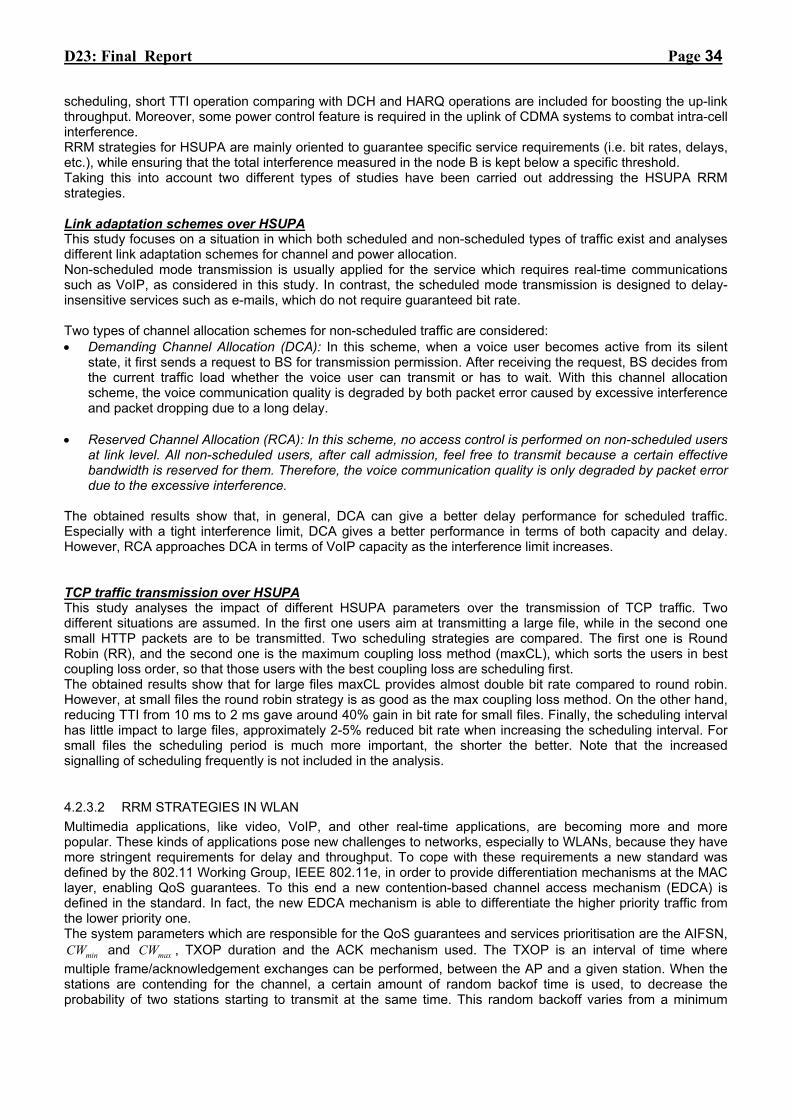
D23: Final Report Page 34
scheduling, short TTI operation comparing with DCH and HARQ operations are included for boosting the up-link throughput. Moreover, some power control feature is required in the uplink of CDMA systems to combat intra-cell interference. RRM strategies for HSUPA are mainly oriented to guarantee specific service requirements (i.e. bit rates, delays, etc.), while ensuring that the total interference measured in the node B is kept below a specific threshold. Taking this into account two different types of studies have been carried out addressing the HSUPA RRM strategies. Link adaptation schemes over HSUPA This study focuses on a situation in which both scheduled and non-scheduled types of traffic exist and analyses different link adaptation schemes for channel and power allocation. Non-scheduled mode transmission is usually applied for the service which requires real-time communications such as VoIP, as considered in this study. In contrast, the scheduled mode transmission is designed to delay-insensitive services such as e-mails, which do not require guaranteed bit rate. Two types of channel allocation schemes for non-scheduled traffic are considered: • Demanding Channel Allocation (DCA): In this scheme, when a voice user becomes active from its silent
state, it first sends a request to BS for transmission permission. After receiving the request, BS decides from the current traffic load whether the voice user can transmit or has to wait. With this channel allocation scheme, the voice communication quality is degraded by both packet error caused by excessive interference and packet dropping due to a long delay.
• Reserved Channel Allocation (RCA): In this scheme, no access control is performed on non-scheduled users
at link level. All non-scheduled users, after call admission, feel free to transmit because a certain effective bandwidth is reserved for them. Therefore, the voice communication quality is only degraded by packet error due to the excessive interference.
The obtained results show that, in general, DCA can give a better delay performance for scheduled traffic. Especially with a tight interference limit, DCA gives a better performance in terms of both capacity and delay. However, RCA approaches DCA in terms of VoIP capacity as the interference limit increases. TCP traffic transmission over HSUPA This study analyses the impact of different HSUPA parameters over the transmission of TCP traffic. Two different situations are assumed. In the first one users aim at transmitting a large file, while in the second one small HTTP packets are to be transmitted. Two scheduling strategies are compared. The first one is Round Robin (RR), and the second one is the maximum coupling loss method (maxCL), which sorts the users in best coupling loss order, so that those users with the best coupling loss are scheduling first. The obtained results show that for large files maxCL provides almost double bit rate compared to round robin. However, at small files the round robin strategy is as good as the max coupling loss method. On the other hand, reducing TTI from 10 ms to 2 ms gave around 40% gain in bit rate for small files. Finally, the scheduling interval has little impact to large files, approximately 2-5% reduced bit rate when increasing the scheduling interval. For small files the scheduling period is much more important, the shorter the better. Note that the increased signalling of scheduling frequently is not included in the analysis.
4.2.3.2 RRM STRATEGIES IN WLAN Multimedia applications, like video, VoIP, and other real-time applications, are becoming more and more popular. These kinds of applications pose new challenges to networks, especially to WLANs, because they have more stringent requirements for delay and throughput. To cope with these requirements a new standard was defined by the 802.11 Working Group, IEEE 802.11e, in order to provide differentiation mechanisms at the MAC layer, enabling QoS guarantees. To this end a new contention-based channel access mechanism (EDCA) is defined in the standard. In fact, the new EDCA mechanism is able to differentiate the higher priority traffic from the lower priority one. The system parameters which are responsible for the QoS guarantees and services prioritisation are the AIFSN,
minCW and maxCW , TXOP duration and the ACK mechanism used. The TXOP is an interval of time where multiple frame/acknowledgement exchanges can be performed, between the AP and a given station. When the stations are contending for the channel, a certain amount of random backof time is used, to decrease the probability of two stations starting to transmit at the same time. This random backoff varies from a minimum

D23: Final Report Page 35
value, minCW , being doubled after each unsuccessful transmission until it reaches its maximum, maxCW . Finally, AIFS is the minimum duration that every station must wait before starting transmission, even if the medium is found to be idle. To analyse the impact on the network global performance of the different QoS system parameters defined within the 802.11e standard, for each Access Category (AC) the default values7 for the TXOP duration, AIFSN, minCW and maxCW were varied. Considering the three most representative envisaged scenarios8 (RTM, BS and HVSM), and just as an example of the benefits achieved when the QoS parameters are tuned, Figure 30 shows the variation of delay experienced for the envisaged four applications: VoIP (end-to-end delay), Video (end-to-end delay including both Video Streaming and Video Conference applications together), HTTP (object response time) and Email (download response time), each one allocated in a specific ACs. This figure shows how better or how worse delay is, for each scenario and for each of the selected applications, when using QoS mechanisms, e.g., a 20 % value means that the delay when using QoS mechanisms is 20 % smaller.
-20
0
20
40
60
80
100
VoIP
Vid
eo
HTT
P
Emai
l
VoIP
Vid
eo
HTT
P
Emai
l
VoIP
Vid
eo
HTT
P
Emai
l
RTM BS HVSM
Scenario
Dela
y im
prov
emen
t [%
]
ref30%50%80%100%
Figure 30: Delay improvement by using the QoS mechanisms in three different scenarios.
Such as it was expected, the performance of QoS mechanisms improves when the network load is higher, but even so, very substantial gains can be seen in almost all scenarios, even when increasing the number of users to the double of the reference scenario (100 % increase). In fact, to evaluate the influence of system parameters variation on the global network performance, and to verify if better performance can be achieved by tuning up the four considered QoS parameters, these parameters were tuned in a set of 16 relevant scenarios Then, these scenarios were simulated using 3 different application profiles (the RTM, BS and HVSM scenarios previously defined) varying also 3 times the number of users in each profile/scenario (reference9, 50 % increase and 100 % increase), which amounts to a total of 144 different scenarios. The main conclusion of the study was that the default system parameters are a good “all round” balance between all applications and scenarios, even when varying the number of users and the application profiles. It was seen that they provide a good performance balance for all profiles studied. On the other hand, all scenarios analysed allowed one to see that one might manage to improve network performance by tuning up the system parameters, increasing performance for a given application or under a given profile, but this being only possible in specific situations. This way, WLANs can be tuned up, according to its location and typical usage profile, e.g.,
7 The default parameters are defined in [28]. 8 Real Time Maximum (RTM) scenario with 80% of the users being real time (RT) and 20% non-real time (NRT). Basic Scenario (BS) with 60% of the
users being real time (RT) and 40% non-real time (NRT).HTTP plus Video streaming scenario maximum (HVSM) with 10% of the users being real time (RT) and 90% non-real time (NRT).
9 The reference scenario considers 23 users attached to the same Access Point (AP)

D23: Final Report Page 36
one can boost VoIP application performance if there are no real-time video users present. Notice that system parameters values can be changed whenever needed, as they are chosen and distributed to the stations by the AP, which gives a lot of flexibility to the network management.
4.2.3.3 RRM STRATEGIES IN WIMAX WiMAX is an emerging technology clearly designed to support data services with performances that typically are associated to ‘fixed’ technologies, such as DSL or cable, likely outperforming 3GPP standards for this purpose. In terms of RRM, one of the most relevant issues impacting the QoS performances of the WIMAX system is the packet scheduler algorithm, which determines what users are allocated to the available resources. In AROMA three different scheduling algorithms are considered in order to treat differently the co-existence of a service mix and the different radio conditions experienced by each user: Round-Robin (RR), Maximum Cell Throughput (MAX), Proportional Fair (PF). In addition to that, two classes of users are considered for each service: consumer (associated to simulator’s Mass Market class) and business class (associated to simulator’s Business class), each indicating different traffic and service patterns. The considered scheduling mechanisms have been evaluated by means of system-level simulations. Focusing on best effort applications, which include streaming, WWW, FTP and Email, instead of being lost, packets are delayed when there are no system resources available, which affects the overall user perception of the service. Consequently, the results in terms of percentage of delayed packets and average delay and standard deviation of the delayed packets are presented in Figure 31.
0%
5%
10%
15%
20%
25%
3500
4000
4500
5000
5500
6000
6500
# Users
Del
ayed
Pac
kets
[%]
MAX PF RR
020406080
100120140160
3500
4000
4500
5000
5500
6000
6500
# Users
Del
ay o
f Del
ayed
Pac
kets
[ms]
MAX PF RR
(a) (b)
Figure 31: Percentage of best-effort delayed packets and average delay of delayed best-effort packets for increasing number of served users by the BS –Dense urban.
When a basic RR scheduling is implemented, the percentage of BE delayed packets increases when the number of users increases as well, as would be expected. On the contrary, the MAX scheduling decreases the percentage of delayed packets decreases significantly, thanks to serving first the users having the best channel conditions, thus increasing the overall system capacity. However, since historical delay is not considered in this king of scheduling, users suffering the worse channel conditions are likely to wait long time periods before being assigned any resources. This trade-off between avoiding too long delays and increased system capacity can be solved through the PF scheduling, which gives higher priority to users that already experienced long delays. As a result, PF provides a lower percentage of delayed packets when compared to RR, while it provides reduced delays for delayed packets when compared to the MAX approach.
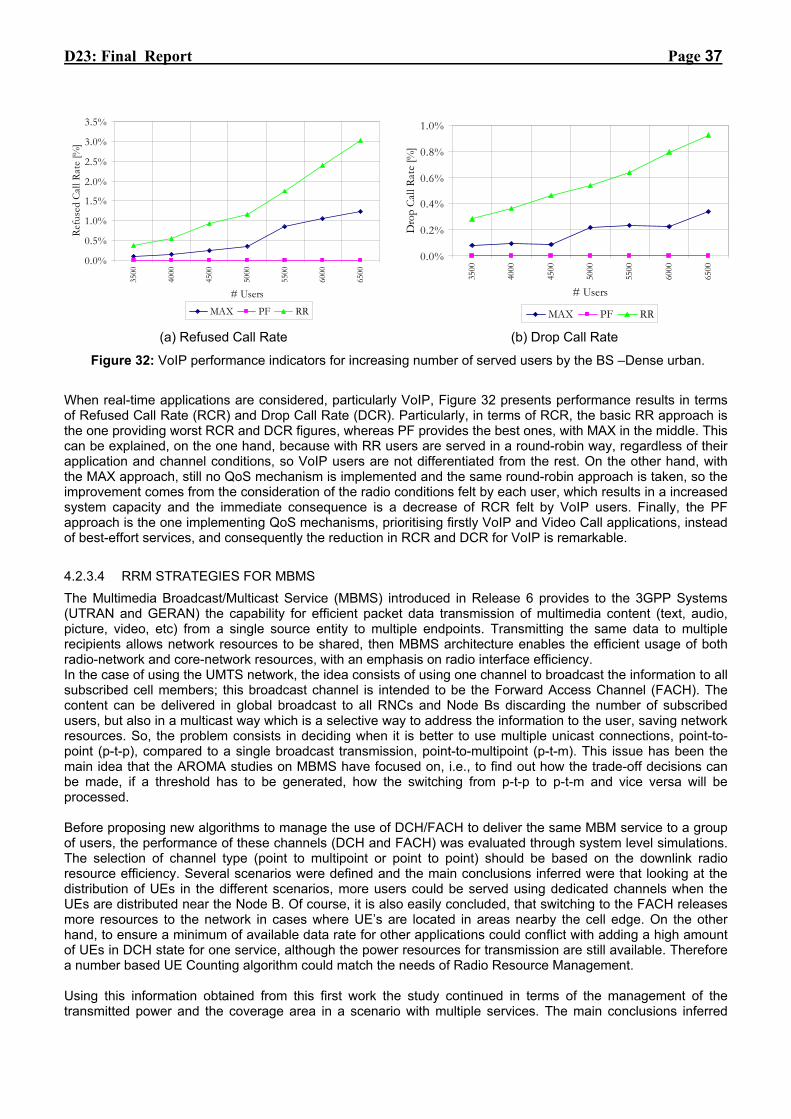
D23: Final Report Page 37
0.0%
0.5%
1.0%
1.5%
2.0%
2.5%
3.0%
3.5%35
00
4000
4500
5000
5500
6000
6500
# Users
Refu
sed
Call
Rate
[%]
MAX PF RR
0.0%
0.2%
0.4%
0.6%
0.8%
1.0%
3500
4000
4500
5000
5500
6000
6500
# Users
Dro
p Ca
ll Ra
te [%
]
MAX PF RR
(a) Refused Call Rate (b) Drop Call Rate
Figure 32: VoIP performance indicators for increasing number of served users by the BS –Dense urban.
When real-time applications are considered, particularly VoIP, Figure 32 presents performance results in terms of Refused Call Rate (RCR) and Drop Call Rate (DCR). Particularly, in terms of RCR, the basic RR approach is the one providing worst RCR and DCR figures, whereas PF provides the best ones, with MAX in the middle. This can be explained, on the one hand, because with RR users are served in a round-robin way, regardless of their application and channel conditions, so VoIP users are not differentiated from the rest. On the other hand, with the MAX approach, still no QoS mechanism is implemented and the same round-robin approach is taken, so the improvement comes from the consideration of the radio conditions felt by each user, which results in a increased system capacity and the immediate consequence is a decrease of RCR felt by VoIP users. Finally, the PF approach is the one implementing QoS mechanisms, prioritising firstly VoIP and Video Call applications, instead of best-effort services, and consequently the reduction in RCR and DCR for VoIP is remarkable.
4.2.3.4 RRM STRATEGIES FOR MBMS The Multimedia Broadcast/Multicast Service (MBMS) introduced in Release 6 provides to the 3GPP Systems (UTRAN and GERAN) the capability for efficient packet data transmission of multimedia content (text, audio, picture, video, etc) from a single source entity to multiple endpoints. Transmitting the same data to multiple recipients allows network resources to be shared, then MBMS architecture enables the efficient usage of both radio-network and core-network resources, with an emphasis on radio interface efficiency. In the case of using the UMTS network, the idea consists of using one channel to broadcast the information to all subscribed cell members; this broadcast channel is intended to be the Forward Access Channel (FACH). The content can be delivered in global broadcast to all RNCs and Node Bs discarding the number of subscribed users, but also in a multicast way which is a selective way to address the information to the user, saving network resources. So, the problem consists in deciding when it is better to use multiple unicast connections, point-to-point (p-t-p), compared to a single broadcast transmission, point-to-multipoint (p-t-m). This issue has been the main idea that the AROMA studies on MBMS have focused on, i.e., to find out how the trade-off decisions can be made, if a threshold has to be generated, how the switching from p-t-p to p-t-m and vice versa will be processed. Before proposing new algorithms to manage the use of DCH/FACH to deliver the same MBM service to a group of users, the performance of these channels (DCH and FACH) was evaluated through system level simulations. The selection of channel type (point to multipoint or point to point) should be based on the downlink radio resource efficiency. Several scenarios were defined and the main conclusions inferred were that looking at the distribution of UEs in the different scenarios, more users could be served using dedicated channels when the UEs are distributed near the Node B. Of course, it is also easily concluded, that switching to the FACH releases more resources to the network in cases where UE’s are located in areas nearby the cell edge. On the other hand, to ensure a minimum of available data rate for other applications could conflict with adding a high amount of UEs in DCH state for one service, although the power resources for transmission are still available. Therefore a number based UE Counting algorithm could match the needs of Radio Resource Management. Using this information obtained from this first work the study continued in terms of the management of the transmitted power and the coverage area in a scenario with multiple services. The main conclusions inferred
D23: Final Report Page 38
from the study were that an increase in the power of the stations meant an increase in the percentage of MBMS coverage and that MBMS services with radio bearers of greater binary rates needed more power to meet the objectives of coverage. Next, the study of p-t-p to p-t-m switching mechanisms was addressed. These switching mechanisms can be divided in two main categories: No power based, and Power based. In the first case the switching criteria between p-t-p and p-t-m transmission modes is based on the UE counting procedure but also in cell power budget considerations. Hence, a specific analytical power budget analysis has been hereby proposed with the aim of optimizing the MBMS UE switching threshold. The obtained results show that the analytical power budget analysis can be effectively exploited by a RRM algorithm to accommodate the MBMS service in the most appropriate transmission mode according to the number of users within a cell. The limit of the proposed approach relies on the need of a priori analytical power budget analysis, by considering the mean level of traffic offered to the cell because the power budget estimation cannot take into account the instantaneous traffic condition experienced by the cell at the beginning of the MBMS session. The second studied algorithm is based on a power threshold to switch from p-t-p to p-t-m. Certainly, a more accurate strategy could be base both on UE counting and instantaneous estimation of the actual downlink transmitted power required in the case of p-t-p transmission, depending on the UEs location. In fact, due to the different physical locations of UEs, each one experiencing different fading and path loss, and a more effective decision can be taken about the switching point between p-t-p and p-t-m. From simulation results, iIt is observed that the algorithm is able to perform a proper estimation of the total DCH transmitted power in order to make the decisions, being more effective than the previous one that only considers a threshold with respect to the number of UE involved in the MBMS service. It is not worthless to mention here that some of the results concerning RRM strategies for MBMS were used to submit a change request contribution to the 3GPP TR 25.922 [28] [29], with the aim of adding a new section in this 3GPP document. The contribution (ref. R2-070649-“Examples of RRM strategies for MBMS”; Telecom Italia, TeliaSonera, Telefonica on behalf of the AROMA Consortium; AI 8.2) was presented and accepted at 3GPP RAN2 57th meeting, held in St. Luis (USA), on February, 12th -16th , 2007.
4.2.3.5 ANALYSES ON VoIP OVER ALL-IP HETEROGENEOUS NETWORK For all a set of well known reasons as, for example, higher flexibility, cost reduction, facilitation of the fixed mobile convergence, the evolutionary trend of mobile communication systems is focusing toward radio access networks allowing only packet switched transmission over shared channels for any kind of service. The IP protocol that governs the packet transmission on the fixed networks is now reached the extreme border of the radio access network. It is evident that, in this evolved scenario where all services are provided through packet transmission, it is required to be confident of the achievable performance of the most relevant services, first of all, the voice. While voice carried through IP (VoIP) on the fixed network can be considered a consolidated reality with a well known behaviour, this is not true for the wireless scenario, especially in case of mobility. In order to allow the migration of voice toward a VoIP transmission even in the wireless context it is necessary to perform an in depth analysis aiming at identifying performance, and weakness of the solution. For this reason, AROMA has investigated in detail performance of VoIP over relevant radio technologies as WiFi, UMTS-R99 and HSPA so as to evaluate and characterize end-to-end QoS and to determine the capacity limits of these systems.
4.2.3.5.1 VoIP over UTRAN When considering the transmission of voice traffic over packet switched networks, it’s very important to be able to manage a large amount of traffic preserving as much as possible the quality of every single voice source, and to solve the problem of the bottleneck represented by bandwidth capacity. Delay and packet loss requirements for VoIP lead to accurate design needs for the overall system that support this service: preserving the quality for a VoIP communication means that transmission delay and packet loss rate must be minimized. Several simulations were conducted in order to evaluate the Quality of Service for VoIP service in UTRAN R99 radio access network. The simulation were focused on the QoS experimented by VoIP service with respect to variations on some factors; particularly, the variable factors chosen for simulations are radio BLER and de-jittering buffer dimension.
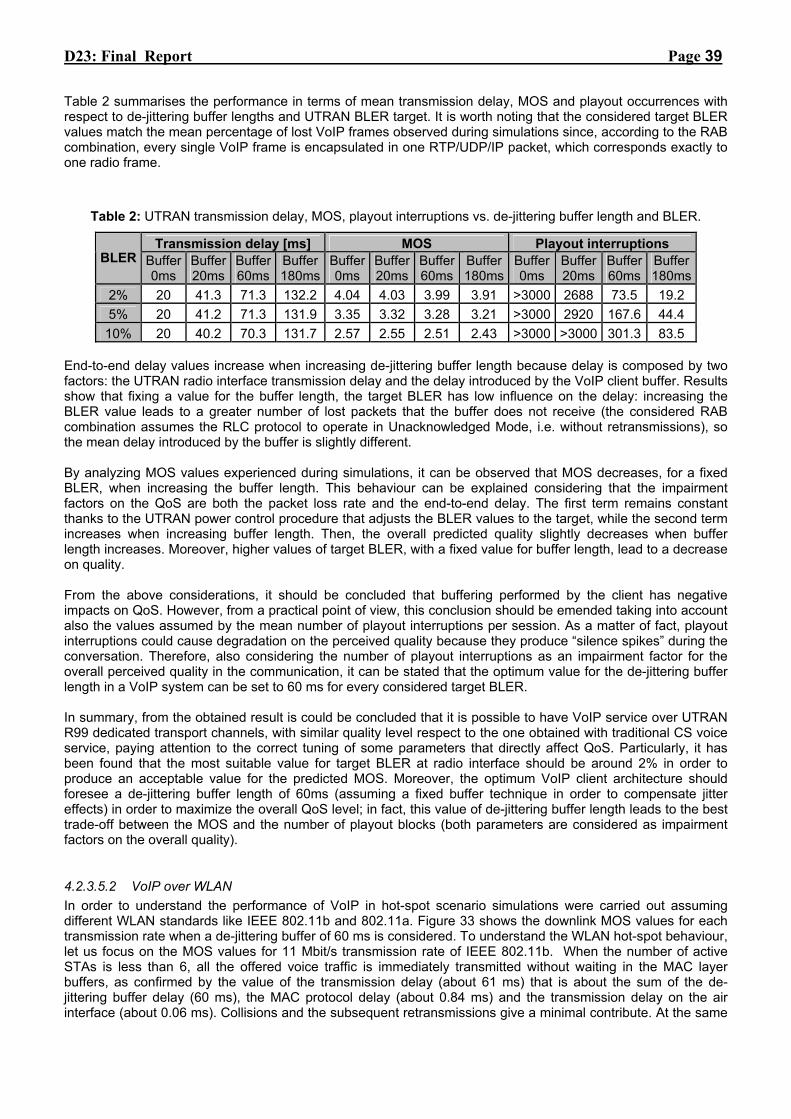
D23: Final Report Page 39
Table 2 summarises the performance in terms of mean transmission delay, MOS and playout occurrences with respect to de-jittering buffer lengths and UTRAN BLER target. It is worth noting that the considered target BLER values match the mean percentage of lost VoIP frames observed during simulations since, according to the RAB combination, every single VoIP frame is encapsulated in one RTP/UDP/IP packet, which corresponds exactly to one radio frame.
Table 2: UTRAN transmission delay, MOS, playout interruptions vs. de-jittering buffer length and BLER.
Transmission delay [ms] MOS Playout interruptions BLER Buffer
0ms Buffer 20ms
Buffer 60ms
Buffer 180ms
Buffer 0ms
Buffer 20ms
Buffer 60ms
Buffer 180ms
Buffer 0ms
Buffer 20ms
Buffer 60ms
Buffer 180ms
2% 20 41.3 71.3 132.2 4.04 4.03 3.99 3.91 >3000 2688 73.5 19.2 5% 20 41.2 71.3 131.9 3.35 3.32 3.28 3.21 >3000 2920 167.6 44.4 10% 20 40.2 70.3 131.7 2.57 2.55 2.51 2.43 >3000 >3000 301.3 83.5
End-to-end delay values increase when increasing de-jittering buffer length because delay is composed by two factors: the UTRAN radio interface transmission delay and the delay introduced by the VoIP client buffer. Results show that fixing a value for the buffer length, the target BLER has low influence on the delay: increasing the BLER value leads to a greater number of lost packets that the buffer does not receive (the considered RAB combination assumes the RLC protocol to operate in Unacknowledged Mode, i.e. without retransmissions), so the mean delay introduced by the buffer is slightly different. By analyzing MOS values experienced during simulations, it can be observed that MOS decreases, for a fixed BLER, when increasing the buffer length. This behaviour can be explained considering that the impairment factors on the QoS are both the packet loss rate and the end-to-end delay. The first term remains constant thanks to the UTRAN power control procedure that adjusts the BLER values to the target, while the second term increases when increasing buffer length. Then, the overall predicted quality slightly decreases when buffer length increases. Moreover, higher values of target BLER, with a fixed value for buffer length, lead to a decrease on quality. From the above considerations, it should be concluded that buffering performed by the client has negative impacts on QoS. However, from a practical point of view, this conclusion should be emended taking into account also the values assumed by the mean number of playout interruptions per session. As a matter of fact, playout interruptions could cause degradation on the perceived quality because they produce “silence spikes” during the conversation. Therefore, also considering the number of playout interruptions as an impairment factor for the overall perceived quality in the communication, it can be stated that the optimum value for the de-jittering buffer length in a VoIP system can be set to 60 ms for every considered target BLER. In summary, from the obtained result is could be concluded that it is possible to have VoIP service over UTRAN R99 dedicated transport channels, with similar quality level respect to the one obtained with traditional CS voice service, paying attention to the correct tuning of some parameters that directly affect QoS. Particularly, it has been found that the most suitable value for target BLER at radio interface should be around 2% in order to produce an acceptable value for the predicted MOS. Moreover, the optimum VoIP client architecture should foresee a de-jittering buffer length of 60ms (assuming a fixed buffer technique in order to compensate jitter effects) in order to maximize the overall QoS level; in fact, this value of de-jittering buffer length leads to the best trade-off between the MOS and the number of playout blocks (both parameters are considered as impairment factors on the overall quality).
4.2.3.5.2 VoIP over WLAN In order to understand the performance of VoIP in hot-spot scenario simulations were carried out assuming different WLAN standards like IEEE 802.11b and 802.11a. Figure 33 shows the downlink MOS values for each transmission rate when a de-jittering buffer of 60 ms is considered. To understand the WLAN hot-spot behaviour, let us focus on the MOS values for 11 Mbit/s transmission rate of IEEE 802.11b. When the number of active STAs is less than 6, all the offered voice traffic is immediately transmitted without waiting in the MAC layer buffers, as confirmed by the value of the transmission delay (about 61 ms) that is about the sum of the de-jittering buffer delay (60 ms), the MAC protocol delay (about 0.84 ms) and the transmission delay on the air interface (about 0.06 ms). Collisions and the subsequent retransmissions give a minimal contribute. At the same

D23: Final Report Page 40
time, the percentage of discarded packets is null. When the offered traffic increases, i.e. when the number of active STAs reaches the 7 units, the hot-spot approaches its throughput limit and contemporarily the number of collisions becomes more relevant: packets have to wait more in the MAC buffers causing an increase of the transmission delay (73,5 ms) and minimally of the discarded packets(0,03%); the final result is a decrease of the MOS. When the number of active STAs equals and exceeds the 8 units, the offered traffic is higher then the maximum throughput and so voice packets have to wait much longer in the MAC buffer before their transmission: this is evidenced by the rapid increase of the delay (190 ms for 8 STA, 360ms for 9 STA). At the same time, also the discarded packets increase but they are still quite low (they are under 1%) and so they have a limited effect on MOS degradation. The maximum number of active STAs in order to have an acceptable voice quality (MOS ≥ 3.6) is 9. On the other hand, MOS values in uplink have not been reported in the figure since they remains constant to the value of 4.47 due to the low delay (with 9 active STAs it is equal to 62 ms) and to the null value of the discarded packets. This demonstrates that QoS limitations of VoIP service within a single hot-spot are due to the downlink. This fact can be explained by considering that the WLAN access technique has been designed to be fair between all the equipments and so the AP has not any priority with respect to the STAs.m Finally, when the transmission rate reduces, the network performances get worse and the maximum number of active STAs supported by the network decreases to 7 (5.5 Mbit/s), 5 (2 Mbit/s) and 3 (1Mbit/s) units. This performance reduction is not directly proportional to the rate reduction due to the increasing efficiency of the MAC protocol that is related to the fixed duration of some MAC overhead elements (DIFS, SIFS, PHY layer preamble, ACK).
3
3.2
3.4
3.6
3.8
4
4.2
4.4
4.6
4.8
5
0 5 10 15 20 25 30 35 40 45 50 55Number of active STAs
MO
S
1 Mbit/s 2 Mbit/s 5.5 Mbit/s 11 Mbit/s6 Mbit/s 12 Mbit/s 36 Mbit/s 54 Mbit/s
0
100
200
300
400
500
600
20 40 60 120Buffer length [ms]
Play
out B
lock
s3 STA @ 1 Mbit/s
9 STA @ 11 Mbit/s
7 STA @ 11 Mbit/s
Figure 33: Downlink MOS values for different rate of IEEE 802.11b (empty symbols) and 802.11a (filled symbols).
Figure 34: Mean number of playout blocks per session versus de-jittering buffer length.
Similar conclusions could be obtained for the standard IEEE 802.11a but managing high bit rates. On the other hand, the impact of de-jittering buffer length on the downlink MOS values has also been investigated. In particular the simulation results show that MOS does not change too much for the considered buffer lengths (20 ms, 40 ms, 60 ms and 120 ms). Hence, the optimum length for the buffer should be determined looking at the number of playout blocks per session, such as it is reported in Figure 34. It that figure the results demonstrate that a low number of playout blocks can be obtained with a buffer length at least equal to 40 ms. The performance with the optional RTS/CTS handshaking technique has also been analyzed. It has been shown that the performance strongly degrades because VoIP packets are small packets and in this situation the overhead introduced by RTS and CTS exceeds the benefits introduced by the channel reservation. On the other hand, the overall QoS level of VoIP service is also affected by the increase of the time needed to setup the call due to the increasing downlink transmission delay. According to the achieved results, the mean value of the session setup delay, for the 11 Mbit/s transmission rate, increases from 0.3 s (with 1 active STA) to 1.3 s (with 9 active STAs). Finally, the coexistence in the same network of STA with different transmission rates has been investigated. The analysis shows that the maximum number of active STA with a transmission rate of 11 Mbit/s reduces when there are 1, 2 or 3 STA at 1 Mbit/s or 2 Mbit/s in the same network, i.e. connected to the same Access Point.
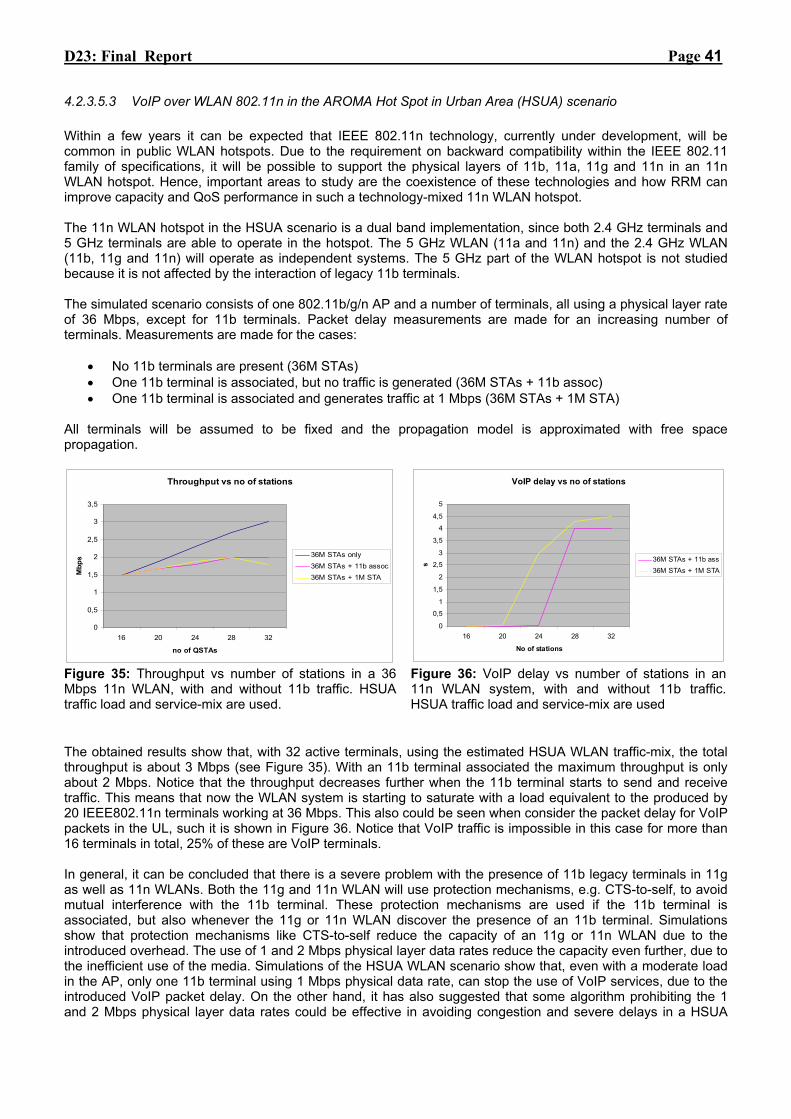
D23: Final Report Page 41
4.2.3.5.3 VoIP over WLAN 802.11n in the AROMA Hot Spot in Urban Area (HSUA) scenario Within a few years it can be expected that IEEE 802.11n technology, currently under development, will be common in public WLAN hotspots. Due to the requirement on backward compatibility within the IEEE 802.11 family of specifications, it will be possible to support the physical layers of 11b, 11a, 11g and 11n in an 11n WLAN hotspot. Hence, important areas to study are the coexistence of these technologies and how RRM can improve capacity and QoS performance in such a technology-mixed 11n WLAN hotspot. The 11n WLAN hotspot in the HSUA scenario is a dual band implementation, since both 2.4 GHz terminals and 5 GHz terminals are able to operate in the hotspot. The 5 GHz WLAN (11a and 11n) and the 2.4 GHz WLAN (11b, 11g and 11n) will operate as independent systems. The 5 GHz part of the WLAN hotspot is not studied because it is not affected by the interaction of legacy 11b terminals. The simulated scenario consists of one 802.11b/g/n AP and a number of terminals, all using a physical layer rate of 36 Mbps, except for 11b terminals. Packet delay measurements are made for an increasing number of terminals. Measurements are made for the cases:
• No 11b terminals are present (36M STAs) • One 11b terminal is associated, but no traffic is generated (36M STAs + 11b assoc) • One 11b terminal is associated and generates traffic at 1 Mbps (36M STAs + 1M STA)
All terminals will be assumed to be fixed and the propagation model is approximated with free space propagation.
Throughput vs no of stations
0
0,5
1
1,5
2
2,5
3
3,5
16 20 24 28 32
no of QSTAs
Mbp
s 36M STAs only36M STAs + 11b assoc36M STAs + 1M STA
VoIP delay vs no of stations
0
0,5
1
1,5
2
2,5
3
3,5
4
4,5
5
16 20 24 28 32
No of stations
s
36M STAs + 11b ass36M STAs + 1M STA
Figure 35: Throughput vs number of stations in a 36 Mbps 11n WLAN, with and without 11b traffic. HSUA traffic load and service-mix are used.
Figure 36: VoIP delay vs number of stations in an 11n WLAN system, with and without 11b traffic. HSUA traffic load and service-mix are used
The obtained results show that, with 32 active terminals, using the estimated HSUA WLAN traffic-mix, the total throughput is about 3 Mbps (see Figure 35). With an 11b terminal associated the maximum throughput is only about 2 Mbps. Notice that the throughput decreases further when the 11b terminal starts to send and receive traffic. This means that now the WLAN system is starting to saturate with a load equivalent to the produced by 20 IEEE802.11n terminals working at 36 Mbps. This also could be seen when consider the packet delay for VoIP packets in the UL, such it is shown in Figure 36. Notice that VoIP traffic is impossible in this case for more than 16 terminals in total, 25% of these are VoIP terminals. In general, it can be concluded that there is a severe problem with the presence of 11b legacy terminals in 11g as well as 11n WLANs. Both the 11g and 11n WLAN will use protection mechanisms, e.g. CTS-to-self, to avoid mutual interference with the 11b terminal. These protection mechanisms are used if the 11b terminal is associated, but also whenever the 11g or 11n WLAN discover the presence of an 11b terminal. Simulations show that protection mechanisms like CTS-to-self reduce the capacity of an 11g or 11n WLAN due to the introduced overhead. The use of 1 and 2 Mbps physical layer data rates reduce the capacity even further, due to the inefficient use of the media. Simulations of the HSUA WLAN scenario show that, even with a moderate load in the AP, only one 11b terminal using 1 Mbps physical data rate, can stop the use of VoIP services, due to the introduced VoIP packet delay. On the other hand, it has also suggested that some algorithm prohibiting the 1 and 2 Mbps physical layer data rates could be effective in avoiding congestion and severe delays in a HSUA

D23: Final Report Page 42
WLAN scenario. But, it may be a sensitive issue to just disassociate terminals that need to use these data rates. In that case, and from the perspective of a heterogeneous RAN, these terminals may not need to be abandoned from access, but instead handed over from WLAN to a more appropriate RAN, e.g. GERAN or UTRAN
4.2.3.5.4 Mobility issues for VoHSDPA Within the context of all IP heterogeneous networks, HSPA channels are considered as key technologies in order to offer high bit rate services to the end users and also to improve the overall capacity of the access network. In fact, HSPA channels were optimized for streaming, interactive and background classes of services. However, conversational services and speech particularly has always been and will most likely continue to be for some time the most popular service offered by wireless systems. While HSPA channels are capable of supporting applications like VoIP in a spectrally efficient manner, these channels did not consider the quality requirements of such applications, particularly from a handover perspective.
Then, in AROMA mobility management procedures for HSPA have been taken into account in order to investigate QoS performance of VoIP over HSDPA. More in detail, the impact of the HSDPA cell change procedure on the quality of VoIP service has been investigated for different values of users’ speed (3km/h, 30 km/h, 90 km/h 120 km/h) within a dense urban environment.
Buffer = 20ms; Event 1D TTT = 0; activation Time =0ms
2.95574
3.16005
4.08161
2.85338
2.6
3
3.4
3.8
4.2
0 20 40 60 80 100 120
Speed [km/h]
MO
S
Buffer = 60ms; Event 1D TTT = 0
0
4
8
12
0 20 40 60 80 100 120
Speed [km/h]
Play
out b
lock
s
Figure 37: MOS values vs. speed Figure 38: Playout blocks vs. speed
Figure 37 plots the MOS values as a function of user speed, especially for users’ speed higher than 3 km/h, the achieved results in terms of MOS denote a progressive decrease of the quality, much lower than the acceptable thresholds (MOS equal to 3.6). The poor QoS level of VoIP over HSDPA when high speed values are considered is also confirmed by results shown in Figure 38, where the mean number of underflow conditions of the de- jittering buffer during the voice calls is reported (as a matter of fact, annoying “voice clips” may be experienced by the user due to the interruption on the reproduction of voice frames, when this buffer becomes empty).
In summary, results of these investigations confirm that HSDPA technology as defined in 3GPP release 5 cannot be considered fully adequate to support real-time services and justify the effort made recently within 3GPP in order to improve performance of HSDPA in the next UMTS releases by adding several enhancements devoted to improve QoS of real time services for high mobility users.
4.2.3.6 Impact of MIMO Technology over RRM The inclusion of MIMO systems, from system level simulators, must have a simplified approach, in order to keep the focus over RRM/CRRM issues. Thus, one option is to include MIMO, view as a relatively gain over SISO systems. To this end a MIMO Simulator, which provides a statistics description, by means of cumulative density function (CDFs), for the relative MIMO gain has been developed. These statistics can be used by system level simulators to study system level performance gains when MIMO technology is being considered. In order to highlight potential differences between MIMO and SISO based systems, simulations were performed using a Cost Function that considers the following KPIs: blocking, delay and bit rate, for operators and users.
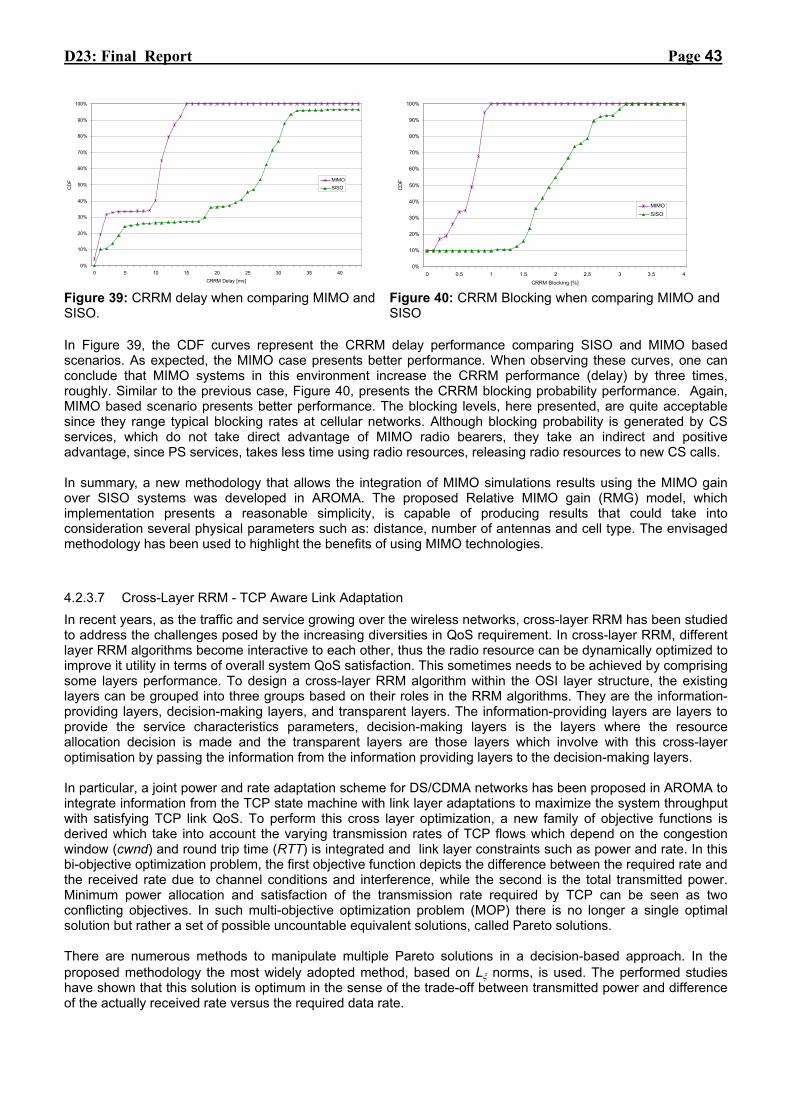
D23: Final Report Page 43
0%
10%
20%
30%
40%
50%
60%
70%
80%
90%
100%
0 5 10 15 20 25 30 35 40CRRM Delay [ms]
CD
F MIMOSISO
0%
10%
20%
30%
40%
50%
60%
70%
80%
90%
100%
0 0.5 1 1.5 2 2.5 3 3.5 4CRRM Blocking [%]
CD
F
MIMOSISO
Figure 39: CRRM delay when comparing MIMO and SISO.
Figure 40: CRRM Blocking when comparing MIMO and SISO
In Figure 39, the CDF curves represent the CRRM delay performance comparing SISO and MIMO based scenarios. As expected, the MIMO case presents better performance. When observing these curves, one can conclude that MIMO systems in this environment increase the CRRM performance (delay) by three times, roughly. Similar to the previous case, Figure 40, presents the CRRM blocking probability performance. Again, MIMO based scenario presents better performance. The blocking levels, here presented, are quite acceptable since they range typical blocking rates at cellular networks. Although blocking probability is generated by CS services, which do not take direct advantage of MIMO radio bearers, they take an indirect and positive advantage, since PS services, takes less time using radio resources, releasing radio resources to new CS calls. In summary, a new methodology that allows the integration of MIMO simulations results using the MIMO gain over SISO systems was developed in AROMA. The proposed Relative MIMO gain (RMG) model, which implementation presents a reasonable simplicity, is capable of producing results that could take into consideration several physical parameters such as: distance, number of antennas and cell type. The envisaged methodology has been used to highlight the benefits of using MIMO technologies.
4.2.3.7 Cross-Layer RRM - TCP Aware Link Adaptation In recent years, as the traffic and service growing over the wireless networks, cross-layer RRM has been studied to address the challenges posed by the increasing diversities in QoS requirement. In cross-layer RRM, different layer RRM algorithms become interactive to each other, thus the radio resource can be dynamically optimized to improve it utility in terms of overall system QoS satisfaction. This sometimes needs to be achieved by comprising some layers performance. To design a cross-layer RRM algorithm within the OSI layer structure, the existing layers can be grouped into three groups based on their roles in the RRM algorithms. They are the information-providing layers, decision-making layers, and transparent layers. The information-providing layers are layers to provide the service characteristics parameters, decision-making layers is the layers where the resource allocation decision is made and the transparent layers are those layers which involve with this cross-layer optimisation by passing the information from the information providing layers to the decision-making layers. In particular, a joint power and rate adaptation scheme for DS/CDMA networks has been proposed in AROMA to integrate information from the TCP state machine with link layer adaptations to maximize the system throughput with satisfying TCP link QoS. To perform this cross layer optimization, a new family of objective functions is derived which take into account the varying transmission rates of TCP flows which depend on the congestion window (cwnd) and round trip time (RTT) is integrated and link layer constraints such as power and rate. In this bi-objective optimization problem, the first objective function depicts the difference between the required rate and the received rate due to channel conditions and interference, while the second is the total transmitted power. Minimum power allocation and satisfaction of the transmission rate required by TCP can be seen as two conflicting objectives. In such multi-objective optimization problem (MOP) there is no longer a single optimal solution but rather a set of possible uncountable equivalent solutions, called Pareto solutions. There are numerous methods to manipulate multiple Pareto solutions in a decision-based approach. In the proposed methodology the most widely adopted method, based on Lξ norms, is used. The performed studies have shown that this solution is optimum in the sense of the trade-off between transmitted power and difference of the actually received rate versus the required data rate.
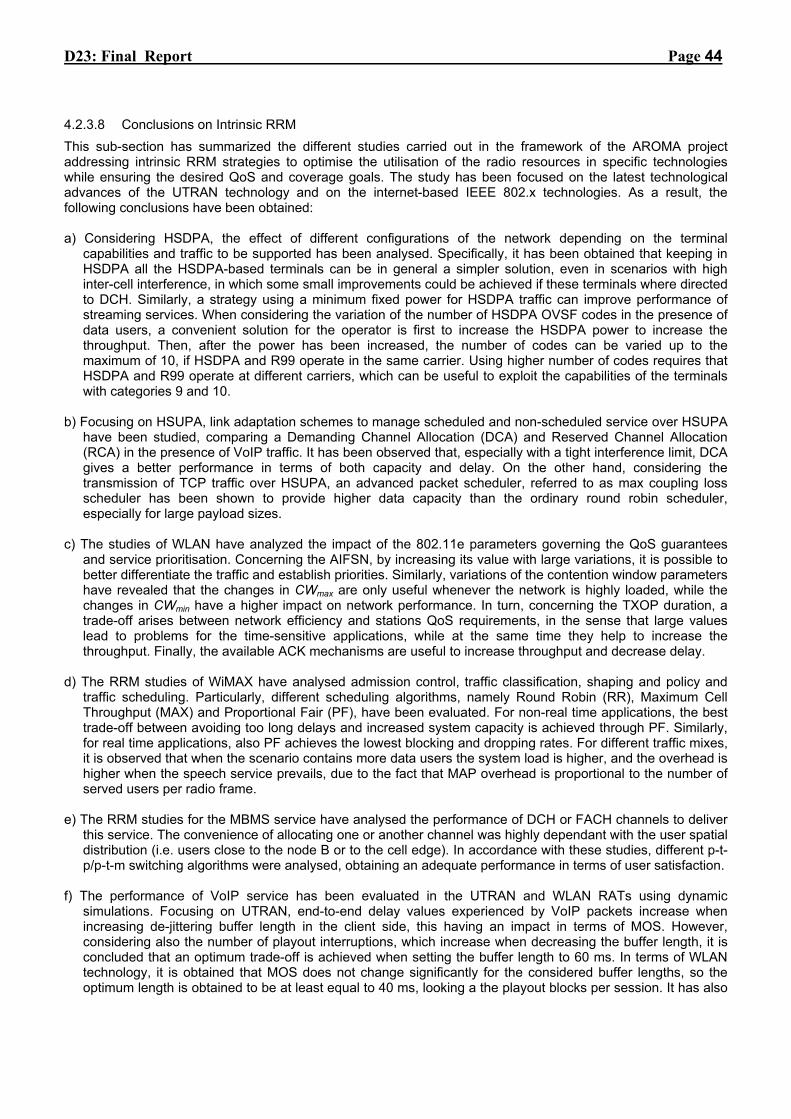
D23: Final Report Page 44
4.2.3.8 Conclusions on Intrinsic RRM This sub-section has summarized the different studies carried out in the framework of the AROMA project addressing intrinsic RRM strategies to optimise the utilisation of the radio resources in specific technologies while ensuring the desired QoS and coverage goals. The study has been focused on the latest technological advances of the UTRAN technology and on the internet-based IEEE 802.x technologies. As a result, the following conclusions have been obtained: a) Considering HSDPA, the effect of different configurations of the network depending on the terminal
capabilities and traffic to be supported has been analysed. Specifically, it has been obtained that keeping in HSDPA all the HSDPA-based terminals can be in general a simpler solution, even in scenarios with high inter-cell interference, in which some small improvements could be achieved if these terminals where directed to DCH. Similarly, a strategy using a minimum fixed power for HSDPA traffic can improve performance of streaming services. When considering the variation of the number of HSDPA OVSF codes in the presence of data users, a convenient solution for the operator is first to increase the HSDPA power to increase the throughput. Then, after the power has been increased, the number of codes can be varied up to the maximum of 10, if HSDPA and R99 operate in the same carrier. Using higher number of codes requires that HSDPA and R99 operate at different carriers, which can be useful to exploit the capabilities of the terminals with categories 9 and 10.
b) Focusing on HSUPA, link adaptation schemes to manage scheduled and non-scheduled service over HSUPA
have been studied, comparing a Demanding Channel Allocation (DCA) and Reserved Channel Allocation (RCA) in the presence of VoIP traffic. It has been observed that, especially with a tight interference limit, DCA gives a better performance in terms of both capacity and delay. On the other hand, considering the transmission of TCP traffic over HSUPA, an advanced packet scheduler, referred to as max coupling loss scheduler has been shown to provide higher data capacity than the ordinary round robin scheduler, especially for large payload sizes.
c) The studies of WLAN have analyzed the impact of the 802.11e parameters governing the QoS guarantees
and service prioritisation. Concerning the AIFSN, by increasing its value with large variations, it is possible to better differentiate the traffic and establish priorities. Similarly, variations of the contention window parameters have revealed that the changes in CWmax are only useful whenever the network is highly loaded, while the changes in CWmin have a higher impact on network performance. In turn, concerning the TXOP duration, a trade-off arises between network efficiency and stations QoS requirements, in the sense that large values lead to problems for the time-sensitive applications, while at the same time they help to increase the throughput. Finally, the available ACK mechanisms are useful to increase throughput and decrease delay.
d) The RRM studies of WiMAX have analysed admission control, traffic classification, shaping and policy and
traffic scheduling. Particularly, different scheduling algorithms, namely Round Robin (RR), Maximum Cell Throughput (MAX) and Proportional Fair (PF), have been evaluated. For non-real time applications, the best trade-off between avoiding too long delays and increased system capacity is achieved through PF. Similarly, for real time applications, also PF achieves the lowest blocking and dropping rates. For different traffic mixes, it is observed that when the scenario contains more data users the system load is higher, and the overhead is higher when the speech service prevails, due to the fact that MAP overhead is proportional to the number of served users per radio frame.
e) The RRM studies for the MBMS service have analysed the performance of DCH or FACH channels to deliver
this service. The convenience of allocating one or another channel was highly dependant with the user spatial distribution (i.e. users close to the node B or to the cell edge). In accordance with these studies, different p-t-p/p-t-m switching algorithms were analysed, obtaining an adequate performance in terms of user satisfaction.
f) The performance of VoIP service has been evaluated in the UTRAN and WLAN RATs using dynamic
simulations. Focusing on UTRAN, end-to-end delay values experienced by VoIP packets increase when increasing de-jittering buffer length in the client side, this having an impact in terms of MOS. However, considering also the number of playout interruptions, which increase when decreasing the buffer length, it is concluded that an optimum trade-off is achieved when setting the buffer length to 60 ms. In terms of WLAN technology, it is obtained that MOS does not change significantly for the considered buffer lengths, so the optimum length is obtained to be at least equal to 40 ms, looking a the playout blocks per session. It has also
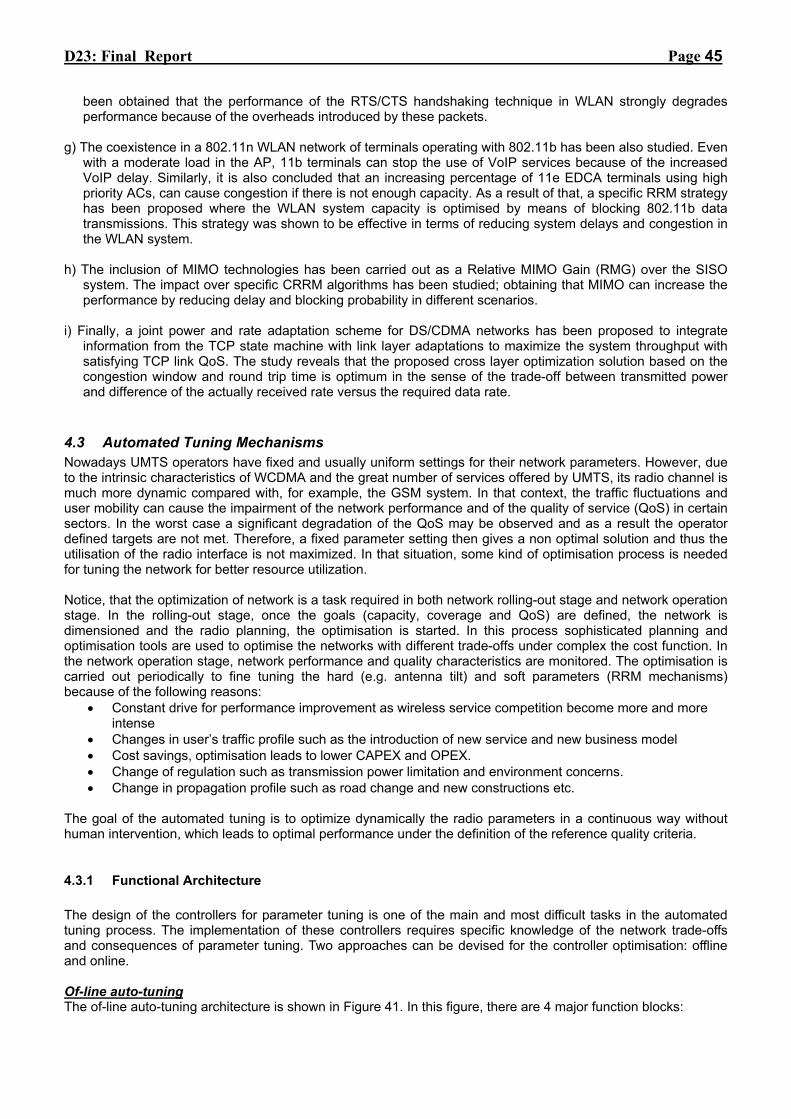
D23: Final Report Page 45
been obtained that the performance of the RTS/CTS handshaking technique in WLAN strongly degrades performance because of the overheads introduced by these packets.
g) The coexistence in a 802.11n WLAN network of terminals operating with 802.11b has been also studied. Even
with a moderate load in the AP, 11b terminals can stop the use of VoIP services because of the increased VoIP delay. Similarly, it is also concluded that an increasing percentage of 11e EDCA terminals using high priority ACs, can cause congestion if there is not enough capacity. As a result of that, a specific RRM strategy has been proposed where the WLAN system capacity is optimised by means of blocking 802.11b data transmissions. This strategy was shown to be effective in terms of reducing system delays and congestion in the WLAN system.
h) The inclusion of MIMO technologies has been carried out as a Relative MIMO Gain (RMG) over the SISO
system. The impact over specific CRRM algorithms has been studied; obtaining that MIMO can increase the performance by reducing delay and blocking probability in different scenarios.
i) Finally, a joint power and rate adaptation scheme for DS/CDMA networks has been proposed to integrate
information from the TCP state machine with link layer adaptations to maximize the system throughput with satisfying TCP link QoS. The study reveals that the proposed cross layer optimization solution based on the congestion window and round trip time is optimum in the sense of the trade-off between transmitted power and difference of the actually received rate versus the required data rate.
4.3 Automated Tuning Mechanisms Nowadays UMTS operators have fixed and usually uniform settings for their network parameters. However, due to the intrinsic characteristics of WCDMA and the great number of services offered by UMTS, its radio channel is much more dynamic compared with, for example, the GSM system. In that context, the traffic fluctuations and user mobility can cause the impairment of the network performance and of the quality of service (QoS) in certain sectors. In the worst case a significant degradation of the QoS may be observed and as a result the operator defined targets are not met. Therefore, a fixed parameter setting then gives a non optimal solution and thus the utilisation of the radio interface is not maximized. In that situation, some kind of optimisation process is needed for tuning the network for better resource utilization. Notice, that the optimization of network is a task required in both network rolling-out stage and network operation stage. In the rolling-out stage, once the goals (capacity, coverage and QoS) are defined, the network is dimensioned and the radio planning, the optimisation is started. In this process sophisticated planning and optimisation tools are used to optimise the networks with different trade-offs under complex the cost function. In the network operation stage, network performance and quality characteristics are monitored. The optimisation is carried out periodically to fine tuning the hard (e.g. antenna tilt) and soft parameters (RRM mechanisms) because of the following reasons:
• Constant drive for performance improvement as wireless service competition become more and more intense
• Changes in user’s traffic profile such as the introduction of new service and new business model • Cost savings, optimisation leads to lower CAPEX and OPEX. • Change of regulation such as transmission power limitation and environment concerns. • Change in propagation profile such as road change and new constructions etc.
The goal of the automated tuning is to optimize dynamically the radio parameters in a continuous way without human intervention, which leads to optimal performance under the definition of the reference quality criteria.
4.3.1 Functional Architecture The design of the controllers for parameter tuning is one of the main and most difficult tasks in the automated tuning process. The implementation of these controllers requires specific knowledge of the network trade-offs and consequences of parameter tuning. Two approaches can be devised for the controller optimisation: offline and online. Of-line auto-tuning The of-line auto-tuning architecture is shown in Figure 41. In this figure, there are 4 major function blocks:

D23: Final Report Page 46
• Analysis block, • Cost function constructive block • Tuning block, and • Simulator updating block.
Among these blocks, the tuning block which consists of an optimization engine and a dynamic network simulator is the core function of the tuning frame work. The two blocks forms a close feedback loops to perform the tuning process through an iteration process. In every step of the iteration, the optimization engine takes the KPI (Key Performance Indicator) from simulator to check if achieve the optimization objectives. If not, the optimization engine will derive a new set of RRM parameters based on the built-in optimization algorithms and cost function as the input of the simulator. After the taking the new RRM parameters, the simulator will perform new evaluation with the new set of RRM parameters. After the simulation, the KPIs are sent to optimization engine start new round of optimization process. This iteration will continues until either the expected the optimization results are obtained or exhaustive search has been done by the optimization algorithm.
Figure 41: Off-line Tuning Architecture Figure 42: On-line Automated Tuning System
On-line auto-tuning The On-line architecture, shown in Figure 42, is designed to make tuning mechanism to interact with network directly. The tuning scheme is trigger by real network events and then tuned parameters will be passed back to configure the system through an interface automatically. So it is called on-line Automated Tuning System (ATS system). This consists of three main blocks:
• Monitoring: A set of input measurements for each cell is constantly monitored and an alarm is triggered when a KPI is not met. This alarm is passed to the algorithm entity, which takes the adequate measures to put the QoS within the target defined by the operator.
• Learning & Memory: This block can be seen as a database that accumulates statistical information concerned with the network performance (memory). It is also responsible for finding out trends and network behaviour regarding different traffic and radio aspects (learning). Thus, at the end it can extract cell characterisation due to the tuning of RRM parameters. This entity can also be used to adjust the rules or the steps of the control algorithm.
• Control Algorithm: This block can also be called intelligent control algorithm. It receives the alarm from the monitoring block and with the information provided by “Learning & Memory” decides on the actions to take. This action may compromise the change of one or several RRM parameters, or there may be no change, because network operator would not benefit. In this situation the process is stopped and, for example, a new subsystem to tune is chosen.
In this kind of on-line automated tuning system for the studied UTRAN case, the network provides access to the RRM parameters and gives the values for the counters, which can be grouped into a single parameter (key performance indicator - KPI) to give a better understanding of the real state of the network. On the other side, a reference source provides the operator’s concept of quality of service and network performance. This reference can also consist of KPIs. Through these interfaces, the automated tuning system creates a statistical feedback loop between network measurements and the RRM parameters. The network is constantly monitored; the selected parameters are placed into memory for statistical analysis and compared with the reference source. When any of the cells does not meet the reference criteria, the tuning algorithm is started, and possibly parameters are possibly changed. Thus, the radio network tuning process becomes an automatic process.

D23: Final Report Page 47
4.3.2 Parameter Optimisation In the AROMA project, parameter tuning has been the main focus of the research in the automated tuning issues. The research has been carried out on those parameters related to radio resource management. In particular two kinds of studies have been carried out:
• Studies focused on the tuning mechanisms of the RF parameters (hard parameters). Particularly, the antenna tilt tuning and CPICH power tunings mechanisms were addressed.
• Studies focused on RRM/CRRM parameters (i.e. soft parameters). Specifically, parameters related to: soft handover, cell reselection, uplink load factor and number of codes for HSDPA were addressed.
4.3.2.1 RF Parameter Tuning
4.3.2.1.1 Automated tuning of antenna tilt angle in UTRAN During network planning and optimisation the antenna tilt for every cell in the network is selected in order to support a given traffic distribution and to provide a determined coverage area. The optimum tilt angle will be dependent on the current cell load. Thus a static tilt configuration will not allow the network to overcome instantaneous traffic and interference fluctuations. The technique of dynamically adapting the base station tilt to the current traffic conditions is referred as automatic tilt control [30]. There are two different ways to perform the antenna tilt: mechanically (MT) or electrically (ET); manually and automatically; locally or remotely. Due to the higher capacity gains and to allow remote adjustments, it was selected the continuously adjustable remote electrical down tilt scheme. The proposed Automated Tuning System (ATS) aims at providing a mechanism to perform load balancing between cells and consequently to improve the network performance (e.g. in terms of QoS) in some sectors. The optimisation method analysed in AROMA consists basically of two phases: QoS improvement and capacity improvement. In the first phase, the QoS statistics or KPIs, such as CBR and CDR, are improved by changing the antenna tilt. When statistics fall bellow the reference values this first phase of the optimisation process is stopped. In the next step, the network capacity is to be improved. The antenna tilt is changed until the more users can be served in the network but always keeping the QoS statistics bellow the defined limits. It has also to be stated that for these two phases special attention has to be paid to the neighbouring cells QoS and network performance in terms of capacity. In the case that the QoS statistics of the neighbouring cells go above their reference values, the optimisation process of the test cell will be immediately stopped. This avoids network spread of a local problem. In all scenarios the proposed strategy was able to reduce the so-called KPI-A (composed by the Call Blocking Rate (CBR) + Call Dropping Rate (CDR)) to values below the 5% limit while maintaining KPI-A of the neighbouring cells also below the limit. It was also observed that the best antenna tilt angles corresponded to a minimum for the average i-factor10.
4.3.2.1.2 CPICH Tuning with Coverage-based CRRM Common pilot channel is designed in UMTS system to provide the measurements for handover and cell selection/reselection and as the reference for channel estimation for dedicated and common channels. In addition to that, a CPICH tuning mechanism could allow at minimizing the system outage probability which consists of both: outage probability that is caused by outage of coverage and blocking rate that is caused by shortage of resource in both UMTS-only system and UMTS/GSM with coverage-based CRRM. Certainly, in W-CDMA downlink, the BS output power is the common resource shared by all control and traffic channels. Then, reducing and increasing CPICH power will lead a trade-off between the BS coverage and its capacity.
10 I-factor.- Ratio between the intercell and intracell interferente.

D23: Final Report Page 48
20
22
24
26
28
30
32
34
0 1 2 3 4 5 6
Cell Number
CPI
CH
Pow
er in
dB
m
Uniform
10% Extra
20% Extra
30% Extra
40% Extra
50% Extra
PreTuing
2 0
2 2
2 4
2 6
2 8
3 0
3 2
3 4
3 6
0 1 2 3 4 5 6
C e ll N u m b e r
CPC
IH P
ower
in d
Bm Pre tu in g
Un ifo rme xtra 1 0 %e xtra 2 0 %e xtra 3 0 %e xtra 3 0 %
Figure 43: CPICH power change before and after tuning (UMTS-ONLY).
Figure 44: CPICH power change before and after tuning.
Figure 43 and Figure 44 show the power profiles before and after tuning for UMTS and heterogeneous system respectively. For the even traffic distribution, we can find that, the tuning process is to minimizing the CPICH power. And with uneven traffic distribution, the CPICH power tuning reflects more on the traffic balancing between cells as CPICH power profiles, i.e. when the traffic load in cell0 becomes larger and larger, the difference between its CPICH power level and other cells CPCIH power becomes bigger and bigger and this eventually leads to more balancing traffic distribution. Comparing the two figures, we found that, with the same uneven traffic distribution, the CPICH power difference with CRRM between the overloaded cell (cell0) and other cells are bigger than the UMTS-only system. This is because, with a static GSM system, to attract more users into its own cell from an overloaded neighbouring cell, the power difference between the cell and its neighbouring overloaded cell must be big enough to make the light loaded cell’s coverage bigger than the GSM coverage offered by its co-sited GSM, while this is not required in UMTS-only system.
4.3.2.2 RRM/ CRRM Parameter Tuning
4.3.2.2.1 Soft Handover parameter tuning Two parameters have been considered to be automatically tuned, namely the number of base stations that can be included in the active set (AS) of one UE and the Addition Window (AddWin), which defines the relative difference of those cells that are to be included in the AS in terms of P-CPICH Ec/I0. These are key parameters because their variation imply opposite effects in UL and DL. An AddWin and maximum number of cells in the AS set to a too low value can cause the terminals to connect to a cell which may not be the best option (i.e. the one that would request less power to achieve the Eb/N0 target). This implies increased UL interference, poor quality and a rise in blocking and congestion. Dropping can also grow because of power outage. On the other hand, in the DL, although individual links quality can benefit of macrodiversity gains, too many base stations in the AS would cause a reduction in the DL capacity because of increased TX powers due to many links. Given this trade-off between UL and DL, the control of these parameters is revealed as a feasible option to design an automatic tuning system able to dynamically manage possible unbalances between both links. Besides, AddWin has been shown to be the parameter with a major impact on capacity, and for that reason a tuning algorithm was also designed to deal with load balancing among cells to reduce downlink interference. Results reveal that the proposed tuning strategies are able to improve the perceived QoS. Effectively,
Table 3 shows how the proposed algorithm provides significant capacity gains performing an effective adaptation to changes in traffic patterns.
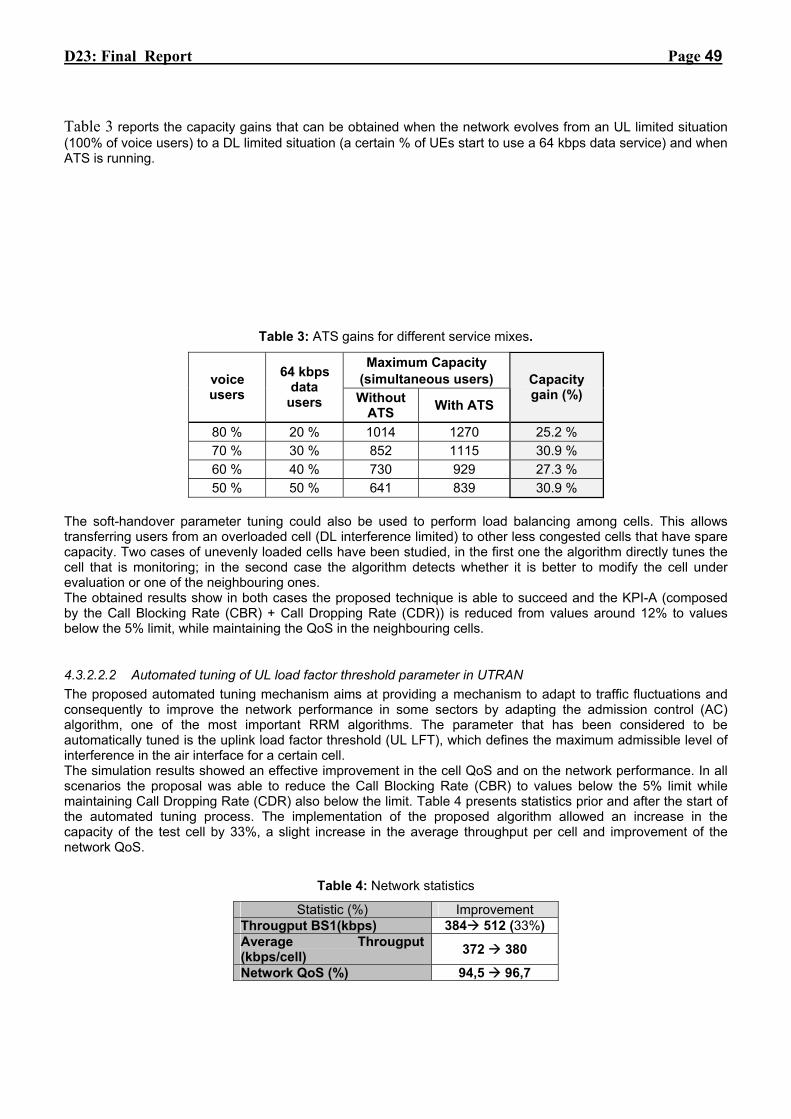
D23: Final Report Page 49
Table 3 reports the capacity gains that can be obtained when the network evolves from an UL limited situation (100% of voice users) to a DL limited situation (a certain % of UEs start to use a 64 kbps data service) and when ATS is running.
Table 3: ATS gains for different service mixes.
Maximum Capacity (simultaneous users) voice
users 64 kbps
data users Without
ATS With ATS
Capacity gain (%)
80 % 20 % 1014 1270 25.2 % 70 % 30 % 852 1115 30.9 % 60 % 40 % 730 929 27.3 % 50 % 50 % 641 839 30.9 %
The soft-handover parameter tuning could also be used to perform load balancing among cells. This allows transferring users from an overloaded cell (DL interference limited) to other less congested cells that have spare capacity. Two cases of unevenly loaded cells have been studied, in the first one the algorithm directly tunes the cell that is monitoring; in the second case the algorithm detects whether it is better to modify the cell under evaluation or one of the neighbouring ones. The obtained results show in both cases the proposed technique is able to succeed and the KPI-A (composed by the Call Blocking Rate (CBR) + Call Dropping Rate (CDR)) is reduced from values around 12% to values below the 5% limit, while maintaining the QoS in the neighbouring cells.
4.3.2.2.2 Automated tuning of UL load factor threshold parameter in UTRAN The proposed automated tuning mechanism aims at providing a mechanism to adapt to traffic fluctuations and consequently to improve the network performance in some sectors by adapting the admission control (AC) algorithm, one of the most important RRM algorithms. The parameter that has been considered to be automatically tuned is the uplink load factor threshold (UL LFT), which defines the maximum admissible level of interference in the air interface for a certain cell. The simulation results showed an effective improvement in the cell QoS and on the network performance. In all scenarios the proposal was able to reduce the Call Blocking Rate (CBR) to values below the 5% limit while maintaining Call Dropping Rate (CDR) also below the limit. Table 4 presents statistics prior and after the start of the automated tuning process. The implementation of the proposed algorithm allowed an increase in the capacity of the test cell by 33%, a slight increase in the average throughput per cell and improvement of the network QoS.
Table 4: Network statistics
Statistic (%) Improvement Througput BS1(kbps) 384 512 (33%) Average Througput (kbps/cell) 372 380
Network QoS (%) 94,5 96,7

D23: Final Report Page 50
In summary, the network performance in terms of throughput and QoS improves with the automated tuning process, and, consequently, the radio access network can be used more efficiently.
4.3.2.2.3 Automated Tuning Mechanism for UTRAN cell reselection process Taking advantage of the mobile network continuous need for optimization, an auto-tuning mechanism has been developed with the purpose of reducing the number of rejected requests from bordering cell users, when there is a high load in a cell. The proposed mechanism acts at the cell re-selection process for mobiles without any dedicated channel allocated (i.e. idle mode users or connected mode users using only common channels). The final goals would be the optimization of the cell load distribution and consequently better a QoS perceived by the users and the operator, through the reduction of dropped and blocked calls on over-loaded cells. The main idea of the proposed mechanism is to enlarge or reduce the coverage of the cell by modifying the Qoffset parameter and therefore, to affect the cell position on the cell re-selection ranking. The modification of this parameter is done based on the UL and DL cell load factors (ηUL , ηDL), since they capture the continuous trade-off between coverage and capacity present in each cell and in the network as a whole. As a general conclusion from the obtained results in the different case studies, it can be concluded that the proposed auto-tuning mechanism of the cell reselection parameters allows achieving gains in terms of admission probability. However, these gains happen mainly in scenarios where high loaded cells are surrounded by low loaded cells. Thus, to determine in which situations the auto-tuning mechanism should be triggered it should be considered not only the overload or under-load situation of a given cell but also the load situation of its neighbouring cells.
4.3.2.2.4 Automated tuning of the number of OVSF codes in HSDPA The utilization of the OVSF code tree is one of the relevant aspects to consider when deploying HSDPA over one existing Rel’99 carrier. The number of codes that are assigned to each technology must take into account different requirements in terms of throughput or blocking. Furthermore, aspects such as the user spatial distribution inside a given cell also has an impact because they determine the throughput that can be achieved for a given code tree allocation. Since each HS-PDSCH uses a SF16 code, up to 15 codes could be allocated to HSDPA. Moreover, for each active HSDPA user there must be an associated Rel’99 DCH (with a minimum SF of 256), and in addition to that, up to 4 HS-SCCH channels with SF 128 can be allocated. As a result, the configuration of 15 codes for HSDPA in a single carrier would leave Rel’99 users with almost no codes or even without any of them. Under the above considerations, an automated tuning algorithm of the number of OVSF codes devoted to HS-DSCH was also analyzed. The aim was to maximize the cell throughput while guaranteeing blocking and dropping criteria. When implementing HSDPA, two different scenarios can be typically considered: 1. One-to-one overlay. That is to say, HSDPA is provided through a different and dedicated carrier. In this
case, traffic balancing lies in that all PS and HSDPA capable users are directly assigned to the HS carrier while the rest remain in the Rel’99 one. By means of an inter-frequency handover, UEs are directed to the HSDPA carrier only when activating the particular HS services. This strategy is of simple management but at the expense of an inefficient use of the spectrum. The possible limited number of carriers per operator as well as the costs and issues associated with upgrading to a multi-carrier network are important drawbacks.
2. Single carrier shared between Rel’99 and HSDPA. In this second approach a single carrier shares all
types of traffic. Spectrum is now more efficiently used but several issues are not defined by 3GPP and must be tackled carefully. In particular, the two basic resources to be shared between HS and Rel’99 users are power and codes, whose allocation could be potentially done in a dynamic way. Regarding the power to be assigned to HSDPA, the usual strategies are:
A. Some providers design their equipment so that HSDPA power is fixed as a percentage of the total. B. Others allow a dynamic allocation on the basis of usage of non-HSDPA users. C. Finally, some authors propose fixing a minimum amount of planned power devoted to HSDPA and, if
available, allowing more power dynamically up to a certain maximum threshold [31].
The obtained results have been shown that the optimum code assignment is dependent on traffic patterns.

D23: Final Report Page 51
0
500
1000
1500
2000
2500
1 2 3 4 5 6 7 8 9 10 11 12 13 14
# HS-PDSCH
Thro
ughp
ut [k
bps]
TotalRel'99HSDPA
a. UEs close to cell edge.
0
1000
2000
3000
4000
5000
6000
7000
8000
1 2 3 4 5 6 7 8 9 10 11 12 13 14
# HS-PDSCH
Thro
ughp
ut [k
bps]
Total
Rel'99
HSDPA
b. UEs close to node-B (<150 m).
Figure 45: Throughput evolution for different number of HS-PDSCH and geographical UE distribution.
The optimum number of codes to be assigned to HSDPA is tightly coupled with the reported channel quality indicators (CQIs), moreover blocking is a constraint that upper bounds the maximum number of codes in HSDPA, as it can be observed in Figure 45. From the graphs, it can be observed that when the UEs are mostly far from the node-B, there is no gain in reserving more than 5 codes to HSDPA. Reported CQIs are low and those extra codes would be hardly used. In fact, assigning more than 7 codes would even imply a reduction in the global cell throughput because of the effects previously explained. Hence, the histogram of CQI reports could be used as an indicator informing about the UEs channel conditions and so, whenever it is detected that RF channels improve, more codes could be reserved to HSDPA. Certainly, by analyzing the histogram of CQIs and, in particular, its filtered 25th percentile, the optimum number of codes can be allocated for each technology, as it is shown in Figure 46 and Figure 47. .
1500
2000
2500
3000
3500
4000
4500
5000
5500
6000
0 50 100 150 200 250 300 350 400 450 500 550 600
Time [s]
Thro
ughp
ut [k
bps]
9 HS-PDSCHs
ATS
5 HS-PDSCHs
Figure 46 : KPIs evolution and # of HS-PDSCHs automatically configured.
Figure 47: Averaged throughput evolution for fixed and dynamic code assignments.
From the Figure 46 it is clear, how the filtering window avoids false alarms and excessive number of control triggering. Indeed, down in the figure, the number of commutations between 5 and 9 codes can be observed. On the other hand, Figure 47 shows the operation of the whole automated tuning mechanism when UEs tend to approach to the node-B. The throughput evolution is shown. It can be observed how the control stage is able to maximize the global cell throughput assigning the exact number of required codes to HSDPA. Commuting from 5 to 9 codes when the CQI histogram and derived KPIs indicate the requirement implies that the throughput remains maximized. In summary, the previous results shown that the automated tuned proposal succeeds in the improvement of the network performance, optimizing the cell throughput while minimizing both Rel’99 and HSPDA blocking probabilities.

D23: Final Report Page 52
4.3.2.2.5 Multiple Parameter CRRM Tuning with Genetic Algorithms Cellular network parameter optimization is a very complex problem. Especially when we consider multiple parameters, it becomes a mixed (continuous and discrete), and non-linear NP-complete combinatorial problem [32] [33] [34] makes the simple rule-based algorithms very difficult to find the optimum to the solution, because in such a non-linear NP-complete problem, there are many local optimal values. In this context, more complex algorithms such as genetic algorithms, tabu search and simulated annealing etc are also needed to achieve a better solution in such a complex problem, in which multiple conflicted objectives might exist and a large number of parameters need to be tuned. Genetic algorithm is one of the most popular of them and also most widely-used in many fields because it is applicable for almost every types of optimization problem. With a stochastically simulated evolution process, genetic algorithms always guarantee a better solution though it might not be the optimal solution [32] [33] [34]. In this study, the CPICH power, Path-loss Threshold and Admission Control margin are tuned to minimize the average system outage probability in a multi-cell environment. Since average system outage probability is related to all the cells involved, this problem also becomes a multi-objective optimization problem, which leads to multiple optimal solutions. Taking into account that the traffic tends to be non-uniformly distributed and traffic hot sport areas become more prone to the QoS degradation since higher traffic density than the rest area, some genetic tuning strategies to tackle this QoS imbalance problem caused by the non-uniform traffic distribution were considered. In particular, apart from minimizing the overall area outage probability, two new cost functions were constructed to address the QoS balancing issue: load balancing and QoS Balancing. Figure 48 shows the each individual cell outage performance, whereas Figure 49 gives the each cell’s load with configured the optimum values from three tuning process.
0
0.01
0.02
0.03
0.04
0.05
0.06
0.07
0 1 2 3 4 5 6
Cell Index
Out
age
Pro
babi
liy
LDQoSOutage
0
0.5
1
1.5
2
2.5
0 1 2 3 4 5 6
Cell Index
Cell
Load
LDQoSOutage
Figure 48: The cell outage probability after tuning Figure 49: Cell Load.
The obtained results show that the QoS balancing and load balancing does tend to be two quite different tuning approaches, although both of tem intend to address the unbalancing problem. Load balancing achieve a best balance load between cells however, in terms of performance for each cell, it does not reflect as fair as that with QoS balancing. This is because, in CDMA system, the traffic load is related to the power consumption rather than directly to number of users. With the same traffic load in CDMA, there are the different combinations of the number of users and their propagation profile, and each of these combinations will have different blocking, dropping and out of coverage rate.
4.3.3 Conclusions on Automated Tuning mechanisms The network optimization process could imply the tuning of a large set of radio parameters in thousands of cells for evaluating the effects of a radio parameter on the network performance. As a result, AROMA has considered the dynamic automated tuning of the RRM/CRRM parameters. Two different architectures were presented: on-line and off-line, and several parameter tuning mechanisms were proposed. The main outcomes of the activity can be summarised in the following points: a) On-line tuning requires fast time convergence and thus, fast rule-based tuning is applied. However, due to
the limitation of rule-based algorithm, the complex optimization problem can not be completely solved through a set of rules. Consequently, a genetic algorithm (GA) to tune more complex cellular optimisation problems in the off-line framework was studied. It can be further used to tuning the parameters for rule-based tuning.

D23: Final Report Page 53
Specifically, the algorithm is studied for the multi-parameter optimization for a CRRM algorithm in a UMTS/GSM heterogeneous environment. To make GA more efficient, a rule-based solution is also incorporated into the GA operator, showing that this hybrid approach tends to be more efficient in terms of finding quality solutions.
b) A methodology to automatically tune the antenna tilt angle in a UMTS network has been presented, based on the implementation of the continuously adjustable remote electrical down tilt scheme. Two KPIs (call failure rate and i-factor) were found appropriate for the monitoring stage. The proposed mechanism performs load balancing between cells and consequently improves network performance (e.g. in terms of QoS) in some sectors. Similarly, tuning CPICH power is another way to be able to balancing traffic through controlling the coverage. This has been studied in both UMTS-only environment and GSM/UMTS heterogeneous environment.
c) In AROMA project, the RRM parameter tuning has focused on improving soft handover, call admission and
cell re-selection in idle mode. Focusing on SHO parameters, both the number of base stations in the active set and the addition window have been automatically tuned obtaining capacity gains between approximately 25 and 30%. Similarly, the tuning of the uplink load factor threshold used in the admission control has been proposed based on three KPIs (call blocking rate, call dropping rate and load factor). Simulation results showed an effective improvement in the cell QoS and on the network performance, with capacity increases of 33%. Finally, an automated tuning mechanism of UTRAN cell reselection parameters addressed to mobile terminals without dedicated channels has also been presented based on modifying the ranking of the R criterion among cells depending on the existing load in each one. The obtained results have been exploited to propose a contribution toward 3GPP standardization with a new self optimization use case for cell reselection for Section “6.21.5.3 Use Case 3” of the document TR 03.018 [37].
d) Considering a scenario where both HSDPA and R99 share the same carrier the automated tuning of the
number of OVSF codes devoted to HSDPA has been analysed. Specifically, the KPIs being considered are based on percentiles obtained from the histogram of reported CQIs by the different terminals, which captures the spatial traffic distribution, allowing a maximization of cell throughput while minimizing blocking probability.
e) Finally, the study of auxiliary mechanisms for specific tuning mechanisms was carried out. Particularly,
learning processes to update the other cell interference and learning process/monitor process in downlink capacity tuning were studied.
4.4 Resource Management in The Transport Network Layer
In AROMA, at transport network layer (TNL) level, the QoS is provided by assuming Diffserv technology in user plane jointly with the use of a Bandwidth Broker (BB) entity in the control. In addition to that, MPLS based micro-mobility is used to handle IP handover.
TNL – Functional Modules
Routing
QoS
Mobility
Management
Resource Reservation &
Admission Control
MPLS
Figure 50: TNL-Functional model.
Figure 50 portrays the functional modules of the AROMA TNL architecture. The holistic view of the AROMA TNL is achieved by integrating the functionalities namely routing, QoS provision framework, MPLS based mobility management, resource reservation and admission control. Figure 51 describes the procedures involved in the definition and design of the functional model.

D23: Final Report Page 54
TNL Functional model
BE & QoS routing Resource Reservation &
Admission Control
Diffserv & MPLS
Protocol / algorithm and IPC Specifications
Implementation aspects
Mobility Management
Figure 51: Functional model development procedures.
The Resource Management TNL functional model has been developed by means of:
⇒ Definition of protocol and algorithm specifications ⇒ Definition and implementation of IPC between the protocol entities ⇒ Performance analysis by simulation
The Best Effort (BE) and QoS routing is provided by the OSPF11 and QOSPF12 protocols respectively. Bandwidth Broker performs the resource reservation and admission control whereas IP mobility management is provided by MPLS based mobility management.
4.4.1 Framework of the Study Currently, one of the main areas of focus for 3GPP Rel-8 is the introduction of the System Architecture Evolution (SAE) work item, which has recently been renamed the Evolved Packet System (EPS) architecture jointly with Long Term Evolution (LTE) work item, often referred to as the Evolved UMTS Terrestrial Radio Access Network (e-UTRAN). For this reason, the EPS architecture, shown in Figure 52, has been taken as reference for the analysis of the resource management at the transport network layer level.
11 Open Shortest Path First 12 QoS enabled OSPF
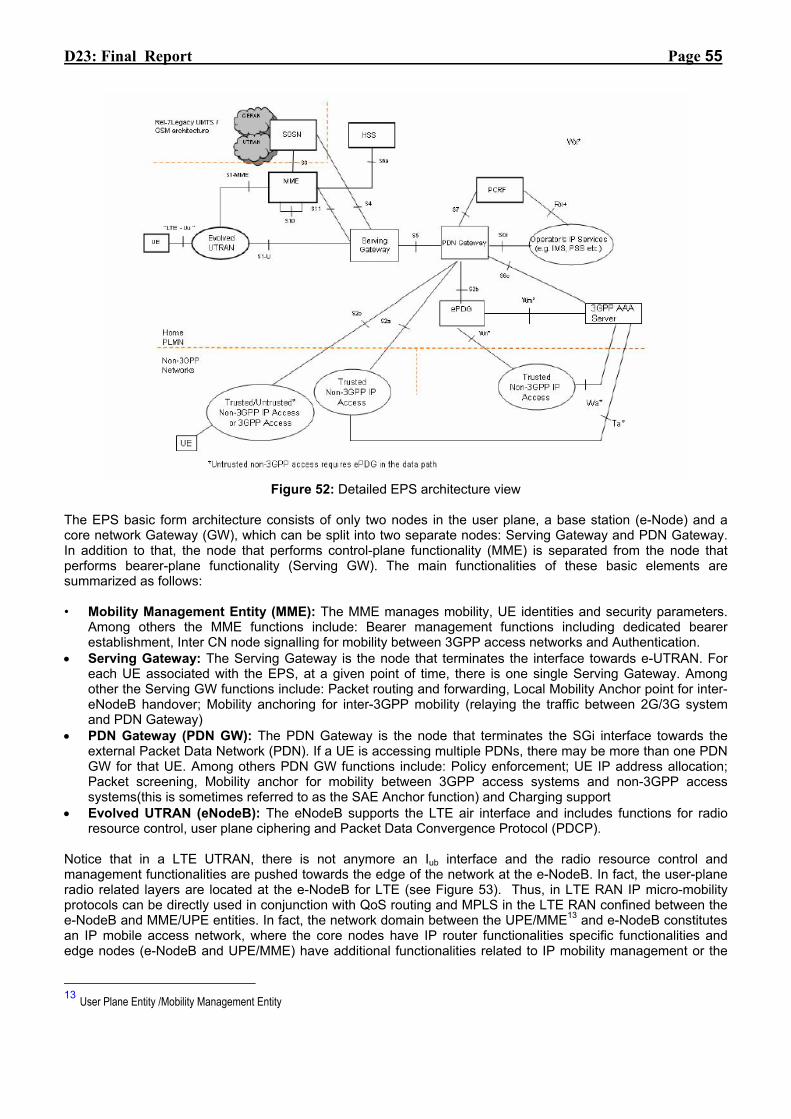
D23: Final Report Page 55
Figure 52: Detailed EPS architecture view
The EPS basic form architecture consists of only two nodes in the user plane, a base station (e-Node) and a core network Gateway (GW), which can be split into two separate nodes: Serving Gateway and PDN Gateway. In addition to that, the node that performs control-plane functionality (MME) is separated from the node that performs bearer-plane functionality (Serving GW). The main functionalities of these basic elements are summarized as follows: • Mobility Management Entity (MME): The MME manages mobility, UE identities and security parameters.
Among others the MME functions include: Bearer management functions including dedicated bearer establishment, Inter CN node signalling for mobility between 3GPP access networks and Authentication.
• Serving Gateway: The Serving Gateway is the node that terminates the interface towards e-UTRAN. For each UE associated with the EPS, at a given point of time, there is one single Serving Gateway. Among other the Serving GW functions include: Packet routing and forwarding, Local Mobility Anchor point for inter-eNodeB handover; Mobility anchoring for inter-3GPP mobility (relaying the traffic between 2G/3G system and PDN Gateway)
• PDN Gateway (PDN GW): The PDN Gateway is the node that terminates the SGi interface towards the external Packet Data Network (PDN). If a UE is accessing multiple PDNs, there may be more than one PDN GW for that UE. Among others PDN GW functions include: Policy enforcement; UE IP address allocation; Packet screening, Mobility anchor for mobility between 3GPP access systems and non-3GPP access systems(this is sometimes referred to as the SAE Anchor function) and Charging support
• Evolved UTRAN (eNodeB): The eNodeB supports the LTE air interface and includes functions for radio resource control, user plane ciphering and Packet Data Convergence Protocol (PDCP).
Notice that in a LTE UTRAN, there is not anymore an Iub interface and the radio resource control and management functionalities are pushed towards the edge of the network at the e-NodeB. In fact, the user-plane radio related layers are located at the e-NodeB for LTE (see Figure 53). Thus, in LTE RAN IP micro-mobility protocols can be directly used in conjunction with QoS routing and MPLS in the LTE RAN confined between the e-NodeB and MME/UPE entities. In fact, the network domain between the UPE/MME13 and e-NodeB constitutes an IP mobile access network, where the core nodes have IP router functionalities specific functionalities and edge nodes (e-NodeB and UPE/MME) have additional functionalities related to IP mobility management or the
13 User Plane Entity /Mobility Management Entity

D23: Final Report Page 56
radio resource management. Furthermore, at the UPE/MME entity in the evolved packet core, IP packets delivered by the 3GPP anchor, are first processed by the PDCP14 layer where header compression is occurring and then packets are then passed to the IP mobility management layer, which has the duty to deliver the data packets to the appropriate e-NodeB. It can be pointed out that the S1 interface has not specified yet.
Figure 53: User plane stack of LTE.
On the other hand, to model the IP mobile access network, a mesh architecture has been assumed. The use of QoS routing in a mesh-based access network, presents advantages, which are related to the increase of the network capacity. First, it gives more flexibility in the dimensioning of the mobile access network. For instance, with a tree-based topology (see Figure 54) if a new wireless AP is added to the access network, then the capacity of the links at each hierarchy of the tree topology has to be increased. With a partially-mesh topology, the change in the capacity of the links is less important, as the traffic from and to this new AP can be routed using multiple paths. Secondly, the use of QoS routing has also an impact on the session completion probability of mobile users. In an IP mobile access network, a user may change its attachment point during an on-going session (for instance a VoIP session), hence specific techniques have to be set up in order to guaranty with a given probability the continuity of the session while the user is moving. Network resources have to be reserved in the following IP attachment point in order to guaranty this continuity.
Figure 54. Tree and mesh topology
Taking into account the above framework in AROMA a scalable QoS architecture for an IP mobile access network was proposed, which encompasses the following elements: the DiffServ data-plane, the bandwidth 14 Packet Data Convergence Protocol

D23: Final Report Page 57
broker, the QoS routing and the IP micro-mobility management. Moreover, this proposed architecture is further extended in order to include the MPLS forwarding mechanism with constraint-based routing. This architecture aims to provide a scalable QoS framework based on the DiffServ paradigm, for which the network complexity is concentrated at the edge of the network.
4.4.2 Resource Management & QoS Framework The resource management and IP QoS architecture considered in the AROMA project is based on the LTE RAN architecture previously presented and summarised in Figure 55. The ANP/GW (Anchor Point/Gateway) entity corresponds to the UPE/MME entity in the LTE architecture, whereas the AR (Access Router) corresponds to the e-NodeB entity. All nodes in the access network are DiffServ capable and in addition ANPs and ARs have DiffServ edge functionalities (traffic shaping, marking, dropping). The IP QoS management is done by a centralized entity: the Bandwidth Broker (BB), which has information regarding the reserved bandwidth at each link of the access network. Finally, the MPLS-based micro-mobility management performs the establishment of a new path between the ANP and the new AR after an IP handover.
Figure 55: MPLS-based micro-mobility
The BB performs admission control based on the bandwidth constraints, QoS parameters like delay, jitter or loss. The decision to accept a call is based on the effective bandwidth usage of the current flows and the requested bandwidth of the new call. When the session is accepted, the BB configures the ingress routers to mark the session packets in order for them to follow the correct LSP and get the guaranteed QoS. In order for the BB to have updated network information, the network characteristics are queried periodically and the BB knowledge base is refreshed. Mobility Framework MPLS- based micro mobility management is used for the path establishment between the ANP and the AR. Different mobility schemes (handover mechanisms) were considered in the mobility framework. They include tunnel-based IP handover, chain tunnelling handover mechanism, hierarchical mobility and QoS routing mechanism and adaptive ANP placement mechanisms. In addition, the IP mobility process is categorized into inter-ANP handover and intra-ANP handover. The inter-ANP handover results in the change in communication path between the gateway and the ANP, whereas the intra-ANP handover results only the change in the communication path between the ANP and the AR. The handover mechanisms are independent of the tunnelling between the ANP and the AR. The mobility management and QoS framework considered in the AROMA project involves initial login, handover execution without ANP change, handover execution with ANP change and handover preparation stage.

D23: Final Report Page 58
4.4.2.1 QOS PERFORMANCE DURING IP HANDOVER Simulations are carried out to analyse the QoS performance and service degradation during IP handover in the specified architecture. The simulation platform includes the following functionalities: Diffserv and MPLS for the user plane forwarding, QOSPF for routing, Bandwidth Broker for resource reservation and admission control and finally IP micro-mobility protocol for mobility management. From the obtained results it can be concluded that there is no packet loss for the static nodes, which is a desired effect in order to create background traffic in the access network. The loss and delay seen by the mobile nodes is due to the service degradation to the BE class. The mobile nodes experiences longer delays, as the BE priority queues get longer and packet loss happens only when one of the BE priority queues in the network overflows. Thus, the effect of the service degradation can be seen on the delay, jitter, throughput and loss of the MNs’ sessions. Nevertheless, here the absolute values of the network performance indicators are not as interesting as the comparison between QoS routing and BE routing. Figure 56 and Figure 57 show the probability density of the end-to-end delay for QoS routing and BE routing, respectively with a medium and higher load, whereas Figure 58 and Figure 59 show the probability density of the packet loss ratio for QoS routing and BE routing, respectively with a medium and higher load.
Figure 56: Delay probability density with medium load Figure 57: Delay probability density with high load.
Figure 58: Loss probability density with medium load. Figure 59: Loss probability density with high load.
In summary, from the simulations, we find that the service degradation varies depending on inter-ANP handover, intra-ANP handover and the chain-tunnelling mechanism. When QoS routing is used, the performance in terms of service degradation is better compared with BE routing. With QOSPF, the path chosen after handover varies depending on the traffic distribution and also the mobility pattern of the mobile terminals, whereas in the case of BE routing the chosen path after handover is limited to the shortest path between the gateway and the AR. With
D23: Final Report Page 59
QOSPF routing, the standard deviation of the service degradation is more and more important as the mobile terminals mobility rate increases. When chain tunnelling mechanism is used, this deviation is less important although QOSPF is used as the communication path is extended by a new segment, corresponding to the segment the old AR and the new AR. The service degradation during IP handover and the Diffserv queuing mechanisms has impact on the throughput, end-to-end delay, jitter and the loss of user sessions. From simulations performed, it is evident that the position of the ANP has an impact on the quantity of the Diffserv class degradation. If the ANP is closer to AR, the smaller is the routing area and therefore fewer paths available between the ANP and the AR. If the ANP is located closer to gateway, the IP handover delay and packet loss during handover increases due to signalling delay. Hence the position of the ANP on the network is a trade-off between the IP handover delay and access network capacity. Considering the above constraint, we propose a hierarchical and QoS routing architecture and adaptive ANP selection. 4.4.3 Conclusions on Transport Layer Network
The studies in the transport network layer considered the necessity of IP based micro-mobility protocol and the associated resource management framework in the LTE architecture. Based on the state of the art LTE architecture, a framework for the resource management, QoS routing and IP micro-mobility stack was designed and their performance analysis was studied based on the chosen performance metrics. 4.5 Implementation issues in resource management: AROMA’s approach
One of the tasks carried out within AROMA deals with algorithm implementation aspects. Under this task, the implementation feasibility of different RRM (Radio Resource Management), CRRM (Common RRM) and CARM (Coordinated Access Resource Management) algorithms proposed in the project have been analysed. A basic methodology aimed at defining a systematic process valid to move from conceptual algorithms proposals towards their implementation has been reported in [21]. The proposed methodology is intended to be used as a generic framework accounting for the main items to be dealt with when addressing implementation feasibility studies in AROMA. The proposed methodology comprises the following items:
1. Algorithm selection 2. Functional description of the algorithm 3. Development of practical implementation approaches and identification of critical aspects. 4. Performance assessment for practical implementations. 5. Potential algorithm enhancements and/or new system capabilities requirements
Attending to this methodology, practical implementation aspects of specific algorithms, or sets of algorithms having similar implementation requirements, have been analysed in accordance to the current status of standardisation (i.e. 3GPP, IEEE 802 and IETF specifications). In particular, the development of practical implementation approaches (item 3 within the proposed methodology) has been targeted to identify the main building blocks in terms of:
• Availability of the information and measurements for the decision-making process of a given algorithm in the network element where the logic is allocated.
• Availability and triggering of appropriate execution mechanisms required to enforce decisions in all involved network elements.
From such analysis, in some cases, new requirements and system capabilities needed to effectively support the considered algorithms not currently supported in the standards have been identified (item 5 within the proposed methodology). In such cases, specific contributions to 3GPP standardizations bodies have been proposed to overcome the identified limitations on the basis of the project results [35], [36]. As well, some algorithm enhancements have been introduced attending to practical considerations arisen when carrying out the entire process. As a matter of fact, conducted studies within AROMA have put more effort on developing items 3 and 5 of the proposed methodology while a lower attention has been paid to item 4.

D23: Final Report Page 60
Next sections provide main relevant outcomes arisen from the different studies that have been addressed to analyse key implementation issues related to specific RRM, CRRM and CARM algorithms.
4.5.1 RRM implementation aspects Although main focus has been on the analysis of CRRM and CARM algorithms implementation aspects, some studies have also been conducted to endorse relevant proposed RRM mechanisms within UTRAN networks. In this sense, main implementation aspects for a MBMS (Multicast Broadcast Multimedia Service) RRM switching algorithm between point-to-point (p-t-p) and point-to-multipoint (p-t-m) transmission were addressed and reported in [5]. The functional description of the algorithm was first proposed in section 4.3.3 of deliverable D12, jointly with a performance analysis. Then, in the implementation analysis, it was discussed how the Controller RNC (CRNC), where the MBMS switching algorithm would be executed, can make use of existing procedures and reporting mechanisms to obtain all the necessary power-related information in order to determine the best MBMS transmission type, so that the content reaches the UE with the minimum radio resources involved. Main results from this activity concerning MBMS have been also acknowledged by 3GPP, in the technical report devoted to summarize RRM strategies for the UMTS system [38].
4.5.2 CRRM implementation aspects In a general sense, CRRM algorithms shall incorporate different drivers to gear the decision-making process such as [39] [40]: Best radio conditions (e.g. minimum path loss); Least radio resource consumption (e.g. interference reduction); RAT coverage; Service; Subscription (e.g. user profiles); Load Balancing; UE capability (e.g. multimode features); Hierarchical cell structures; Network sharing and Private networks/home cells. As well, different limitations should be taken into account in the decision-making process of CRRM [40] such as: UE battery saving; Network signalling/processing load; U-plane interruption and data loss and OAM complexity. In this context, AROMA has proposed and analysed several specific CRRM algorithms that embrace some of the aforementioned drivers and limitations to different extent. Over such a basis, when moving towards implementation considerations, the following four aspects have been considered as the key CRRM building blocks needed to effectively deploy most of considered CRRM strategies:
• Availability of inter-RAT traffic steering mechanisms capable to distribute traffic according to the considered CRRM strategy within the different coordinated RATs.
• Inter-RAT measurement reporting from UEs and base stations. Some of these measurements shall be used in the decision-making process of the CRRM algorithm.
• Distribution of inter-RAT information to UEs so that UEs connected or camping in a given RAT can be aware of the existence and characteristics of potential cells in other RATs. This information can be used to feed autonomous decisions in the terminals (e.g. cell reselection) but also to force the reporting of measurements for a given cell that could be relevant for the CRRM decision.
• Inter-RAT information and measurements exchanges among radio network controllers (i.e. RNC, BSC) or equivalent functionality in the different radio access networks so that proper coordination can be achieved in the network side.
Figure 60 illustrates these four key CRRM building blocks.
Inter-RAT trafficsteering
mechanisms
Inter-RAT systeminformationdistribution to UEs
Inter-RAT mesurementsfrom UEs and
BSs
Inter-RAT informationand measurementsfrom radio resource
managers
CRRM Building Blocks
MonitoringExecution
Inter-RAT trafficsteering
mechanisms
Inter-RAT systeminformationdistribution to UEs
Inter-RAT mesurementsfrom UEs and
BSs
Inter-RAT informationand measurementsfrom radio resource
managers
CRRM Building Blocks
MonitoringExecution
Figure 60: CRRM Implementation Building Blocks.
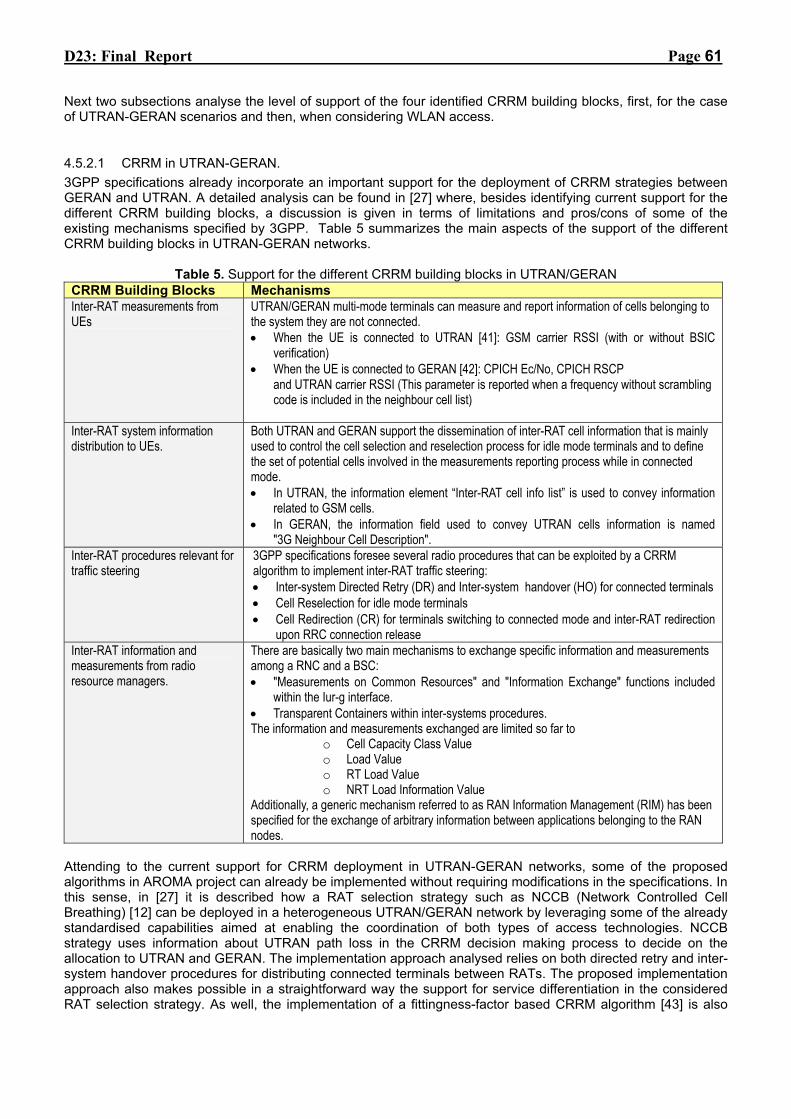
D23: Final Report Page 61
Next two subsections analyse the level of support of the four identified CRRM building blocks, first, for the case of UTRAN-GERAN scenarios and then, when considering WLAN access.
4.5.2.1 CRRM in UTRAN-GERAN. 3GPP specifications already incorporate an important support for the deployment of CRRM strategies between GERAN and UTRAN. A detailed analysis can be found in [27] where, besides identifying current support for the different CRRM building blocks, a discussion is given in terms of limitations and pros/cons of some of the existing mechanisms specified by 3GPP. Table 5 summarizes the main aspects of the support of the different CRRM building blocks in UTRAN-GERAN networks.
Table 5. Support for the different CRRM building blocks in UTRAN/GERAN CRRM Building Blocks Mechanisms Inter-RAT measurements from UEs
UTRAN/GERAN multi-mode terminals can measure and report information of cells belonging to the system they are not connected. • When the UE is connected to UTRAN [41]: GSM carrier RSSI (with or without BSIC
verification) • When the UE is connected to GERAN [42]: CPICH Ec/No, CPICH RSCP
and UTRAN carrier RSSI (This parameter is reported when a frequency without scrambling code is included in the neighbour cell list)
Inter-RAT system information distribution to UEs.
Both UTRAN and GERAN support the dissemination of inter-RAT cell information that is mainly used to control the cell selection and reselection process for idle mode terminals and to define the set of potential cells involved in the measurements reporting process while in connected mode. • In UTRAN, the information element “Inter-RAT cell info list” is used to convey information
related to GSM cells. • In GERAN, the information field used to convey UTRAN cells information is named
"3G Neighbour Cell Description". Inter-RAT procedures relevant for traffic steering
3GPP specifications foresee several radio procedures that can be exploited by a CRRM algorithm to implement inter-RAT traffic steering: • Inter-system Directed Retry (DR) and Inter-system handover (HO) for connected terminals • Cell Reselection for idle mode terminals • Cell Redirection (CR) for terminals switching to connected mode and inter-RAT redirection
upon RRC connection release Inter-RAT information and measurements from radio resource managers.
There are basically two main mechanisms to exchange specific information and measurements among a RNC and a BSC: • "Measurements on Common Resources" and "Information Exchange" functions included
within the Iur-g interface. • Transparent Containers within inter-systems procedures. The information and measurements exchanged are limited so far to
o Cell Capacity Class Value o Load Value o RT Load Value o NRT Load Information Value
Additionally, a generic mechanism referred to as RAN Information Management (RIM) has been specified for the exchange of arbitrary information between applications belonging to the RAN nodes.
Attending to the current support for CRRM deployment in UTRAN-GERAN networks, some of the proposed algorithms in AROMA project can already be implemented without requiring modifications in the specifications. In this sense, in [27] it is described how a RAT selection strategy such as NCCB (Network Controlled Cell Breathing) [12] can be deployed in a heterogeneous UTRAN/GERAN network by leveraging some of the already standardised capabilities aimed at enabling the coordination of both types of access technologies. NCCB strategy uses information about UTRAN path loss in the CRRM decision making process to decide on the allocation to UTRAN and GERAN. The implementation approach analysed relies on both directed retry and inter-system handover procedures for distributing connected terminals between RATs. The proposed implementation approach also makes possible in a straightforward way the support for service differentiation in the considered RAT selection strategy. As well, the implementation of a fittingness-factor based CRRM algorithm [43] is also
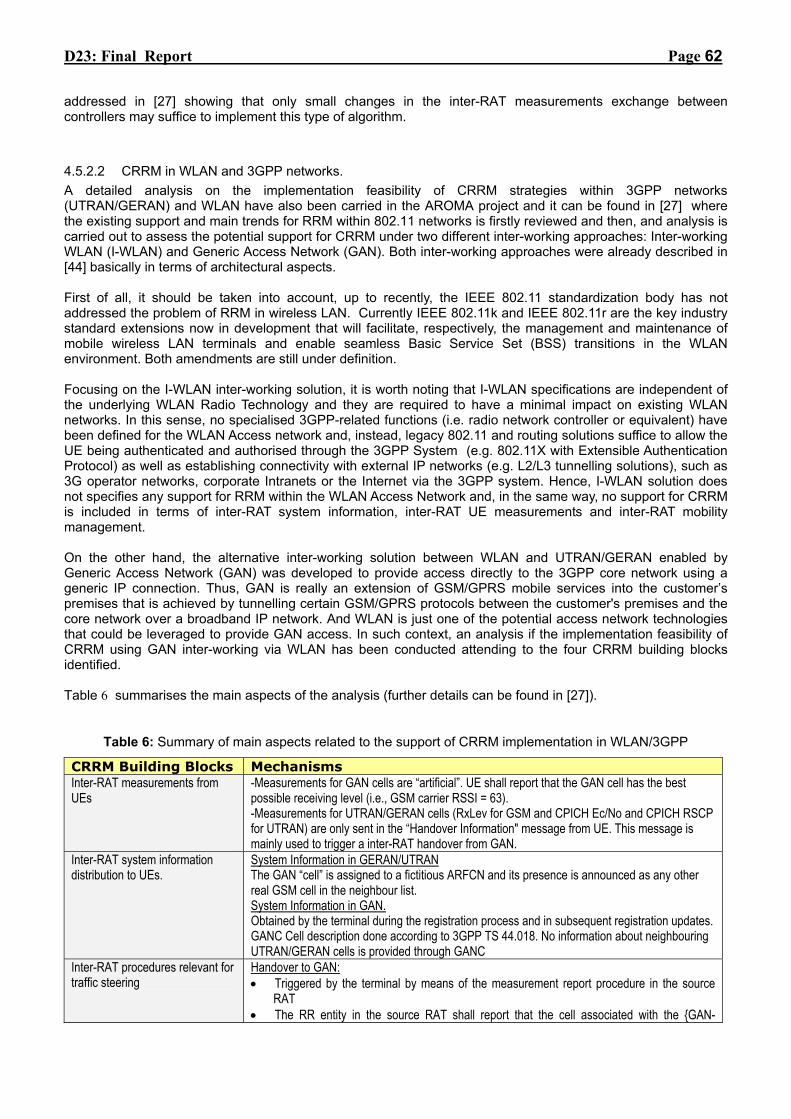
D23: Final Report Page 62
addressed in [27] showing that only small changes in the inter-RAT measurements exchange between controllers may suffice to implement this type of algorithm.
4.5.2.2 CRRM in WLAN and 3GPP networks. A detailed analysis on the implementation feasibility of CRRM strategies within 3GPP networks (UTRAN/GERAN) and WLAN have also been carried in the AROMA project and it can be found in [27] where the existing support and main trends for RRM within 802.11 networks is firstly reviewed and then, and analysis is carried out to assess the potential support for CRRM under two different inter-working approaches: Inter-working WLAN (I-WLAN) and Generic Access Network (GAN). Both inter-working approaches were already described in [44] basically in terms of architectural aspects. First of all, it should be taken into account, up to recently, the IEEE 802.11 standardization body has not addressed the problem of RRM in wireless LAN. Currently IEEE 802.11k and IEEE 802.11r are the key industry standard extensions now in development that will facilitate, respectively, the management and maintenance of mobile wireless LAN terminals and enable seamless Basic Service Set (BSS) transitions in the WLAN environment. Both amendments are still under definition. Focusing on the I-WLAN inter-working solution, it is worth noting that I-WLAN specifications are independent of the underlying WLAN Radio Technology and they are required to have a minimal impact on existing WLAN networks. In this sense, no specialised 3GPP-related functions (i.e. radio network controller or equivalent) have been defined for the WLAN Access network and, instead, legacy 802.11 and routing solutions suffice to allow the UE being authenticated and authorised through the 3GPP System (e.g. 802.11X with Extensible Authentication Protocol) as well as establishing connectivity with external IP networks (e.g. L2/L3 tunnelling solutions), such as 3G operator networks, corporate Intranets or the Internet via the 3GPP system. Hence, I-WLAN solution does not specifies any support for RRM within the WLAN Access Network and, in the same way, no support for CRRM is included in terms of inter-RAT system information, inter-RAT UE measurements and inter-RAT mobility management. On the other hand, the alternative inter-working solution between WLAN and UTRAN/GERAN enabled by Generic Access Network (GAN) was developed to provide access directly to the 3GPP core network using a generic IP connection. Thus, GAN is really an extension of GSM/GPRS mobile services into the customer’s premises that is achieved by tunnelling certain GSM/GPRS protocols between the customer's premises and the core network over a broadband IP network. And WLAN is just one of the potential access network technologies that could be leveraged to provide GAN access. In such context, an analysis if the implementation feasibility of CRRM using GAN inter-working via WLAN has been conducted attending to the four CRRM building blocks identified. Table 6 summarises the main aspects of the analysis (further details can be found in [27]).
Table 6: Summary of main aspects related to the support of CRRM implementation in WLAN/3GPP
CRRM Building Blocks Mechanisms Inter-RAT measurements from UEs
-Measurements for GAN cells are “artificial”. UE shall report that the GAN cell has the best possible receiving level (i.e., GSM carrier RSSI = 63). -Measurements for UTRAN/GERAN cells (RxLev for GSM and CPICH Ec/No and CPICH RSCP for UTRAN) are only sent in the “Handover Information" message from UE. This message is mainly used to trigger a inter-RAT handover from GAN.
Inter-RAT system information distribution to UEs.
System Information in GERAN/UTRAN The GAN “cell” is assigned to a fictitious ARFCN and its presence is announced as any other real GSM cell in the neighbour list. System Information in GAN. Obtained by the terminal during the registration process and in subsequent registration updates. GANC Cell description done according to 3GPP TS 44.018. No information about neighbouring UTRAN/GERAN cells is provided through GANC
Inter-RAT procedures relevant for traffic steering
Handover to GAN: • Triggered by the terminal by means of the measurement report procedure in the source
RAT • The RR entity in the source RAT shall report that the cell associated with the {GAN-
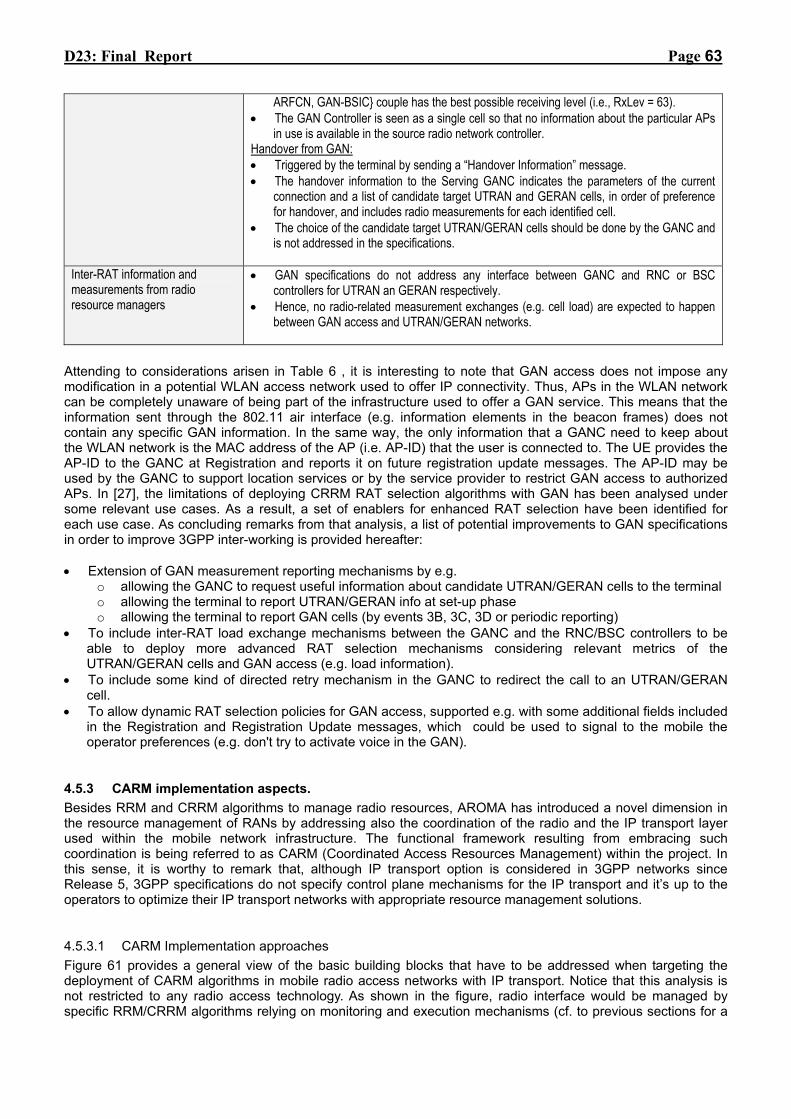
D23: Final Report Page 63
ARFCN, GAN-BSIC} couple has the best possible receiving level (i.e., RxLev = 63). • The GAN Controller is seen as a single cell so that no information about the particular APs
in use is available in the source radio network controller. Handover from GAN: • Triggered by the terminal by sending a “Handover Information” message. • The handover information to the Serving GANC indicates the parameters of the current
connection and a list of candidate target UTRAN and GERAN cells, in order of preference for handover, and includes radio measurements for each identified cell.
• The choice of the candidate target UTRAN/GERAN cells should be done by the GANC and is not addressed in the specifications.
Inter-RAT information and measurements from radio resource managers
• GAN specifications do not address any interface between GANC and RNC or BSC controllers for UTRAN an GERAN respectively.
• Hence, no radio-related measurement exchanges (e.g. cell load) are expected to happen between GAN access and UTRAN/GERAN networks.
Attending to considerations arisen in Table 6 , it is interesting to note that GAN access does not impose any modification in a potential WLAN access network used to offer IP connectivity. Thus, APs in the WLAN network can be completely unaware of being part of the infrastructure used to offer a GAN service. This means that the information sent through the 802.11 air interface (e.g. information elements in the beacon frames) does not contain any specific GAN information. In the same way, the only information that a GANC need to keep about the WLAN network is the MAC address of the AP (i.e. AP-ID) that the user is connected to. The UE provides the AP-ID to the GANC at Registration and reports it on future registration update messages. The AP-ID may be used by the GANC to support location services or by the service provider to restrict GAN access to authorized APs. In [27], the limitations of deploying CRRM RAT selection algorithms with GAN has been analysed under some relevant use cases. As a result, a set of enablers for enhanced RAT selection have been identified for each use case. As concluding remarks from that analysis, a list of potential improvements to GAN specifications in order to improve 3GPP inter-working is provided hereafter: • Extension of GAN measurement reporting mechanisms by e.g.
o allowing the GANC to request useful information about candidate UTRAN/GERAN cells to the terminal o allowing the terminal to report UTRAN/GERAN info at set-up phase o allowing the terminal to report GAN cells (by events 3B, 3C, 3D or periodic reporting)
• To include inter-RAT load exchange mechanisms between the GANC and the RNC/BSC controllers to be able to deploy more advanced RAT selection mechanisms considering relevant metrics of the UTRAN/GERAN cells and GAN access (e.g. load information).
• To include some kind of directed retry mechanism in the GANC to redirect the call to an UTRAN/GERAN cell.
• To allow dynamic RAT selection policies for GAN access, supported e.g. with some additional fields included in the Registration and Registration Update messages, which could be used to signal to the mobile the operator preferences (e.g. don't try to activate voice in the GAN).
4.5.3 CARM implementation aspects. Besides RRM and CRRM algorithms to manage radio resources, AROMA has introduced a novel dimension in the resource management of RANs by addressing also the coordination of the radio and the IP transport layer used within the mobile network infrastructure. The functional framework resulting from embracing such coordination is being referred to as CARM (Coordinated Access Resources Management) within the project. In this sense, it is worthy to remark that, although IP transport option is considered in 3GPP networks since Release 5, 3GPP specifications do not specify control plane mechanisms for the IP transport and it’s up to the operators to optimize their IP transport networks with appropriate resource management solutions.
4.5.3.1 CARM Implementation approaches Figure 61 provides a general view of the basic building blocks that have to be addressed when targeting the deployment of CARM algorithms in mobile radio access networks with IP transport. Notice that this analysis is not restricted to any radio access technology. As shown in the figure, radio interface would be managed by specific RRM/CRRM algorithms relying on monitoring and execution mechanisms (cf. to previous sections for a
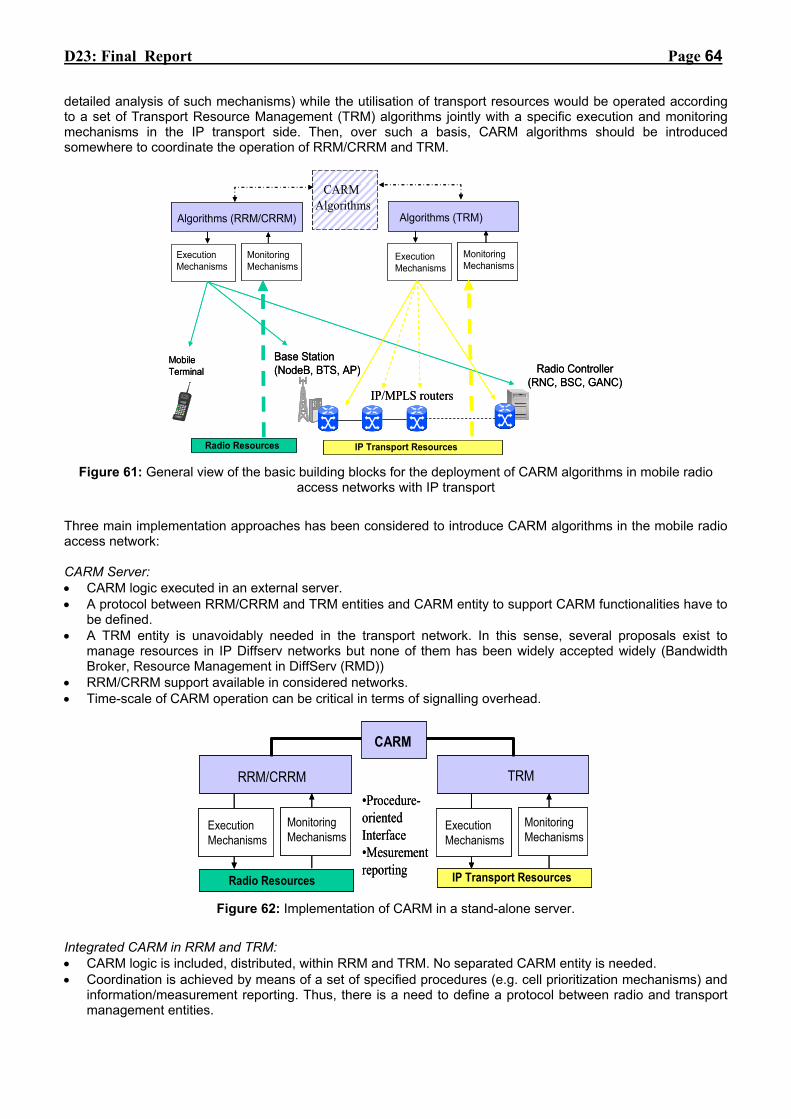
D23: Final Report Page 64
detailed analysis of such mechanisms) while the utilisation of transport resources would be operated according to a set of Transport Resource Management (TRM) algorithms jointly with a specific execution and monitoring mechanisms in the IP transport side. Then, over such a basis, CARM algorithms should be introduced somewhere to coordinate the operation of RRM/CRRM and TRM.
Algorithms (RRM/CRRM)
ExecutionMechanisms
MonitoringMechanisms
Algorithms (TRM)
MonitoringMechanisms
ExecutionMechanisms
Radio Controller(RNC, BSC, GANC)
Base Station(NodeB, BTS, AP)
Mobile Terminal
IP/MPLS routers
Radio Resources IP Transport Resources
CARM Algorithms
Algorithms (RRM/CRRM)
ExecutionMechanisms
MonitoringMechanisms
Algorithms (TRM)
MonitoringMechanisms
ExecutionMechanisms
Radio Controller(RNC, BSC, GANC)
Base Station(NodeB, BTS, AP)
Mobile Terminal
IP/MPLS routers
Radio Resources IP Transport Resources
CARM Algorithms
Figure 61: General view of the basic building blocks for the deployment of CARM algorithms in mobile radio
access networks with IP transport
Three main implementation approaches has been considered to introduce CARM algorithms in the mobile radio access network: CARM Server: • CARM logic executed in an external server. • A protocol between RRM/CRRM and TRM entities and CARM entity to support CARM functionalities have to
be defined. • A TRM entity is unavoidably needed in the transport network. In this sense, several proposals exist to
manage resources in IP Diffserv networks but none of them has been widely accepted widely (Bandwidth Broker, Resource Management in DiffServ (RMD))
• RRM/CRRM support available in considered networks. • Time-scale of CARM operation can be critical in terms of signalling overhead.
RRM/CRRM
MonitoringMechanisms
ExecutionMechanisms
TRM
MonitoringMechanisms
ExecutionMechanisms
•Procedure-orientedInterface•Mesurementreporting
CARM
Radio Resources IP Transport Resources
RRM/CRRM
MonitoringMechanisms
ExecutionMechanisms
TRM
MonitoringMechanisms
ExecutionMechanisms
•Procedure-orientedInterface•Mesurementreporting
CARM
Radio Resources IP Transport Resources
Figure 62: Implementation of CARM in a stand-alone server.
Integrated CARM in RRM and TRM: • CARM logic is included, distributed, within RRM and TRM. No separated CARM entity is needed. • Coordination is achieved by means of a set of specified procedures (e.g. cell prioritization mechanisms) and
information/measurement reporting. Thus, there is a need to define a protocol between radio and transport management entities.
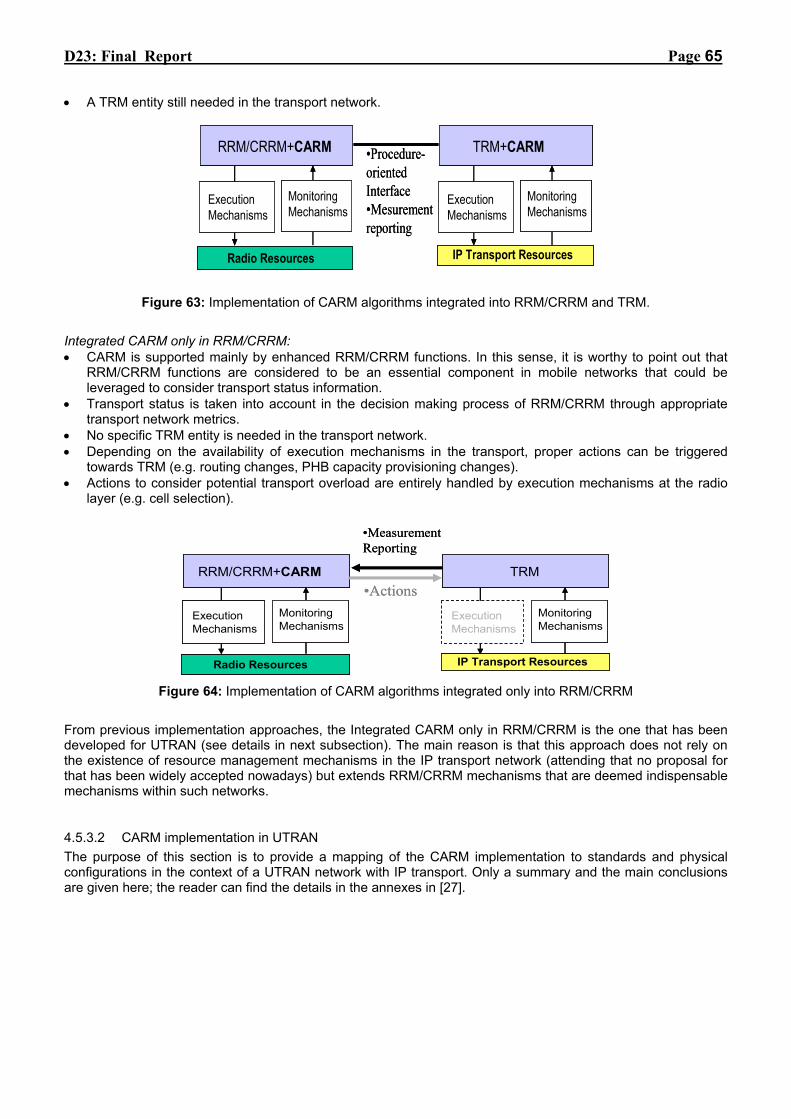
D23: Final Report Page 65
• A TRM entity still needed in the transport network.
RRM/CRRM+CARM
MonitoringMechanisms
ExecutionMechanisms
TRM+CARM
MonitoringMechanisms
ExecutionMechanisms
Radio Resources IP Transport Resources
•Procedure-orientedInterface•Mesurementreporting
RRM/CRRM+CARM
MonitoringMechanisms
ExecutionMechanisms
TRM+CARM
MonitoringMechanisms
ExecutionMechanisms
Radio Resources IP Transport Resources
•Procedure-orientedInterface•Mesurementreporting
Figure 63: Implementation of CARM algorithms integrated into RRM/CRRM and TRM.
Integrated CARM only in RRM/CRRM: • CARM is supported mainly by enhanced RRM/CRRM functions. In this sense, it is worthy to point out that
RRM/CRRM functions are considered to be an essential component in mobile networks that could be leveraged to consider transport status information.
• Transport status is taken into account in the decision making process of RRM/CRRM through appropriate transport network metrics.
• No specific TRM entity is needed in the transport network. • Depending on the availability of execution mechanisms in the transport, proper actions can be triggered
towards TRM (e.g. routing changes, PHB capacity provisioning changes). • Actions to consider potential transport overload are entirely handled by execution mechanisms at the radio
layer (e.g. cell selection).
RRM/CRRM+CARM
MonitoringMechanisms
ExecutionMechanisms
TRM
MonitoringMechanisms
ExecutionMechanisms
•MeasurementReporting
Radio Resources IP Transport Resources
•ActionsRRM/CRRM+CARM
MonitoringMechanisms
ExecutionMechanisms
TRM
MonitoringMechanisms
ExecutionMechanisms
•MeasurementReporting
Radio Resources IP Transport Resources
•Actions
Figure 64: Implementation of CARM algorithms integrated only into RRM/CRRM
From previous implementation approaches, the Integrated CARM only in RRM/CRRM is the one that has been developed for UTRAN (see details in next subsection). The main reason is that this approach does not rely on the existence of resource management mechanisms in the IP transport network (attending that no proposal for that has been widely accepted nowadays) but extends RRM/CRRM mechanisms that are deemed indispensable mechanisms within such networks.
4.5.3.2 CARM implementation in UTRAN The purpose of this section is to provide a mapping of the CARM implementation to standards and physical configurations in the context of a UTRAN network with IP transport. Only a summary and the main conclusions are given here; the reader can find the details in the annexes in [27].

D23: Final Report Page 66
(*)
*L2 Connectivity (not necessarily meaning a star-based physical topology)
IP routers(packet-based trafficaggregation)
NodeBs
RNC
TopologyInformation(configuration, OSPF)
Link Loads TransportMeasurementsProcessing
Transport MetricsCARM
Iub-RNCPath metrics
Radio metrics
NB’ radio metrics
UE’s radio metrics
Figure 65: CARM Implementation in UTRAN
Considering an implementation model for CARM according to "Integrated CARM only in RRM/CRRM", CARM logic would be allocated in the RNC extending current RRM functionality. Figure 65 shows the conceptual relationships between the CARM supporting entities (RNC in the figure) and the radio and transport monitoring mechanisms providing the radio and transport metrics. To improve the feasibility of the proposed CARM solutions, the mechanisms by which these radio and transport metrics are obtained should be supported by current radio and transport standards. Table 7 is a summary of the proposed standard frameworks and protocols that can be used to implement CARM monitoring and execution mechanisms.
Table 7: Summary of the main CARM Building Blocks in the context of UTRAN with IP-based transport.
UTRAN CARM Building Blocks
Mechanisms
Radio Metrics CARM algorithms rely on the availability of the same kind of radio metrics already used for RRM and potentially CRRM mechanisms. Radio-related metrics available at the RNC in UTRAN shall be reported from individual UEs and from controlled NodeBs. The list of available measures at UE and UTRAN is specified in [45] for UTRAN FDD systems.
Transport metrics - OSPF (RFC 2328) for learning network topology and identify links to monitor - SNMP (RFC 3289: SNMP MIB of a DiffServ router) for monitoring bottleneck link occupations
on a PHB basis - Measurement Server (alternatively: supported at every RNC) for collecting measurements,
averaging link loads, identify bottleneck links and compute per-path metrics Execution Mechanisms The set of procedures that should be used to configure radio bearers attending to decisions
coming from CARM logic are those specified in TS 25.331: -Reconfigure parameters of established radio bearers: • Radio bearer reconfiguration • Transport channel reconfiguration • Physical channel reconfiguration • Transport format combination control procedure -Change the serving cell within UTRAN • Active Set Update procedure • Hard Handover procedure -Move the connection to other RAT • Inter-RAT handover from UTRAN procedure • Inter-RAT cell change order from UTRAN procedure
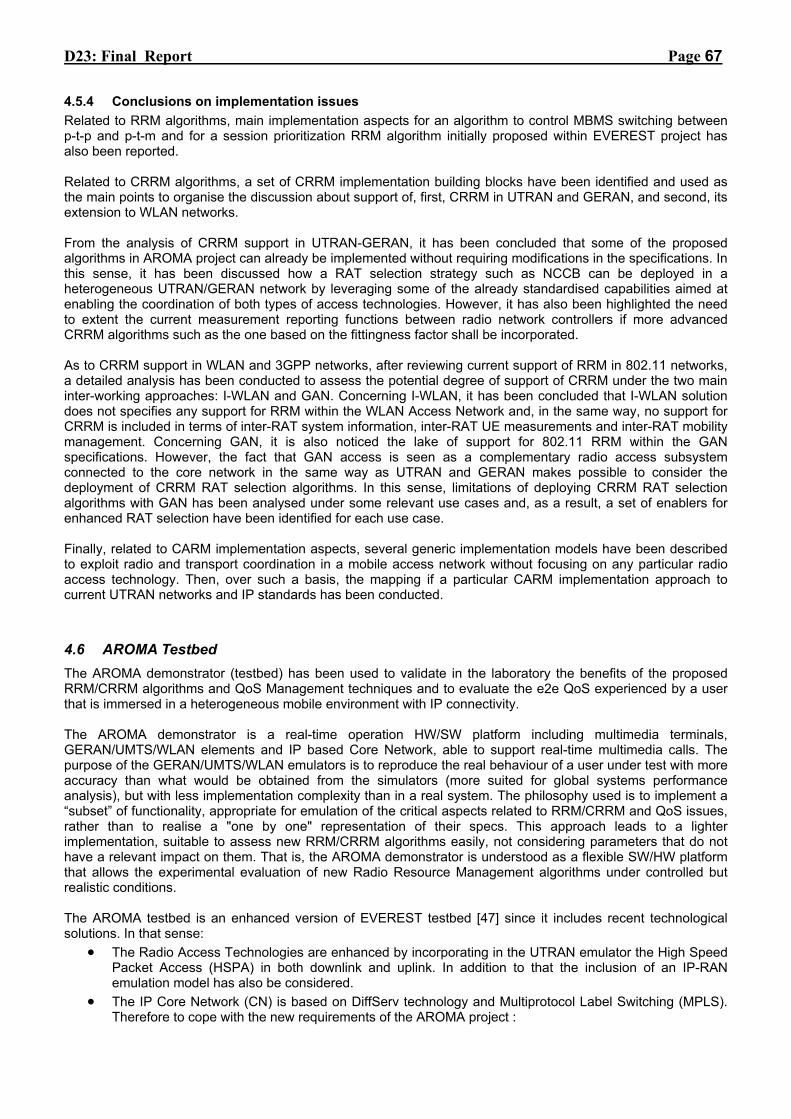
D23: Final Report Page 67
4.5.4 Conclusions on implementation issues Related to RRM algorithms, main implementation aspects for an algorithm to control MBMS switching between p-t-p and p-t-m and for a session prioritization RRM algorithm initially proposed within EVEREST project has also been reported. Related to CRRM algorithms, a set of CRRM implementation building blocks have been identified and used as the main points to organise the discussion about support of, first, CRRM in UTRAN and GERAN, and second, its extension to WLAN networks. From the analysis of CRRM support in UTRAN-GERAN, it has been concluded that some of the proposed algorithms in AROMA project can already be implemented without requiring modifications in the specifications. In this sense, it has been discussed how a RAT selection strategy such as NCCB can be deployed in a heterogeneous UTRAN/GERAN network by leveraging some of the already standardised capabilities aimed at enabling the coordination of both types of access technologies. However, it has also been highlighted the need to extent the current measurement reporting functions between radio network controllers if more advanced CRRM algorithms such as the one based on the fittingness factor shall be incorporated. As to CRRM support in WLAN and 3GPP networks, after reviewing current support of RRM in 802.11 networks, a detailed analysis has been conducted to assess the potential degree of support of CRRM under the two main inter-working approaches: I-WLAN and GAN. Concerning I-WLAN, it has been concluded that I-WLAN solution does not specifies any support for RRM within the WLAN Access Network and, in the same way, no support for CRRM is included in terms of inter-RAT system information, inter-RAT UE measurements and inter-RAT mobility management. Concerning GAN, it is also noticed the lake of support for 802.11 RRM within the GAN specifications. However, the fact that GAN access is seen as a complementary radio access subsystem connected to the core network in the same way as UTRAN and GERAN makes possible to consider the deployment of CRRM RAT selection algorithms. In this sense, limitations of deploying CRRM RAT selection algorithms with GAN has been analysed under some relevant use cases and, as a result, a set of enablers for enhanced RAT selection have been identified for each use case. Finally, related to CARM implementation aspects, several generic implementation models have been described to exploit radio and transport coordination in a mobile access network without focusing on any particular radio access technology. Then, over such a basis, the mapping if a particular CARM implementation approach to current UTRAN networks and IP standards has been conducted.
4.6 AROMA Testbed The AROMA demonstrator (testbed) has been used to validate in the laboratory the benefits of the proposed RRM/CRRM algorithms and QoS Management techniques and to evaluate the e2e QoS experienced by a user that is immersed in a heterogeneous mobile environment with IP connectivity. The AROMA demonstrator is a real-time operation HW/SW platform including multimedia terminals, GERAN/UMTS/WLAN elements and IP based Core Network, able to support real-time multimedia calls. The purpose of the GERAN/UMTS/WLAN emulators is to reproduce the real behaviour of a user under test with more accuracy than what would be obtained from the simulators (more suited for global systems performance analysis), but with less implementation complexity than in a real system. The philosophy used is to implement a “subset” of functionality, appropriate for emulation of the critical aspects related to RRM/CRRM and QoS issues, rather than to realise a "one by one" representation of their specs. This approach leads to a lighter implementation, suitable to assess new RRM/CRRM algorithms easily, not considering parameters that do not have a relevant impact on them. That is, the AROMA demonstrator is understood as a flexible SW/HW platform that allows the experimental evaluation of new Radio Resource Management algorithms under controlled but realistic conditions. The AROMA testbed is an enhanced version of EVEREST testbed [47] since it includes recent technological solutions. In that sense:
• The Radio Access Technologies are enhanced by incorporating in the UTRAN emulator the High Speed Packet Access (HSPA) in both downlink and uplink. In addition to that the inclusion of an IP-RAN emulation model has also be considered.
• The IP Core Network (CN) is based on DiffServ technology and Multiprotocol Label Switching (MPLS). Therefore to cope with the new requirements of the AROMA project :

D23: Final Report Page 68
o A new Bandwidth Broker (BB) is going to replace the Everest one. o Additional nodes to Core Network (CN) have been added to improve the mobility management
capabilities and/or to test MPLS technology.
4.6.1 AROMA Testbed Overview The AROMA testbed allows to test the e2e QoS performance and to evaluate, in real-time, the effects that the implemented e2e QoS management algorithms have over the user’s perception when using different classes of QoS. In this sense, suitable and aligned with the state of the art applications have been chosen for evaluation in the testbed in terms of objective user’s QoS perception. In addition, the network architecture in the testbed encompasses heterogeneity in the radio access domain. UTRAN, GERAN, and WLAN are considered as potential RATs according to specific deployments and scenarios. Coordination and inter- working of such different RATs in terms of CRRM is stated as another key driver to be studied within the testbed. As well, the progressive introduction of IP technology in the radio access network also constitutes a main pillar in the way to the definition of more efficient and less complex network architectures capable to accommodate such radio access heterogeneity. Therefore, within testbed goals is the control and inter-working of these IP-based functionalities like QoS-aware mobility with CRRM.
A. Functional Architecture In Figure 66 all the entities and connections of the AROMA testbed are depicted. Orange connections correspond to user data interfaces, whereas red and blue connections correspond to control plane interfaces. The User Under Test (UUT) has at his disposal one stand-alone PC to run the application, and one additional stand-alone PC is used to run the main functionalities associated to the User Equipment (UE). A correspondent node is used to test symmetric services (e.g., videoconference) through the IP CN network. It also acts as a multimedia server (web, streaming and mail server). The three mentioned RANs and seven CN routers (CR) with MPLS/DiffServ support are depicted in Figure 66. There are three CRs serving as edge routers (two Ingress Routers-IR, and one Egress Router-ER), and four CRs interconnecting all edge routers. A Traffic Switch (TS) is mainly used to establish different configurations between RANs and the correspondent IR in the CN. It captures the IP packets from the UUT, passes them to the correspondent RAN to make the real-time emulation and re-injects them in the interface with the IR where the RAN is supposed to be connected to. In addition the QoS management entities (Wireless QoS Broker: WQB, Master PDP: MPDP, and Bandwidth Broker: BB) can be seen. WQB handles QoS management in the radio part as well as CRRM functions, whereas QoS in the CN is managed by the BB. MPDP, collocated with the WQB for simplicity, acts as a master broker taking the final decision on the acceptance of a new user flow.
For the emulated users passing through the testbed there is a PC called Traffic Generator (TG) that is in charge of generating real IP traffic to load core network. Obviously, generation of this traffic is coordinated with the traffic emulated in the radio part.
Finally, a graphical management and configuration tool called Advanced Graphical Management Tool (AGMT) has been developed to configure the initialization parameters, to control the execution flow, to collect logged data and to obtain statistics during the execution of a demonstration. The yellow area in Figure 66 includes all the machines controlled by the AGMT.
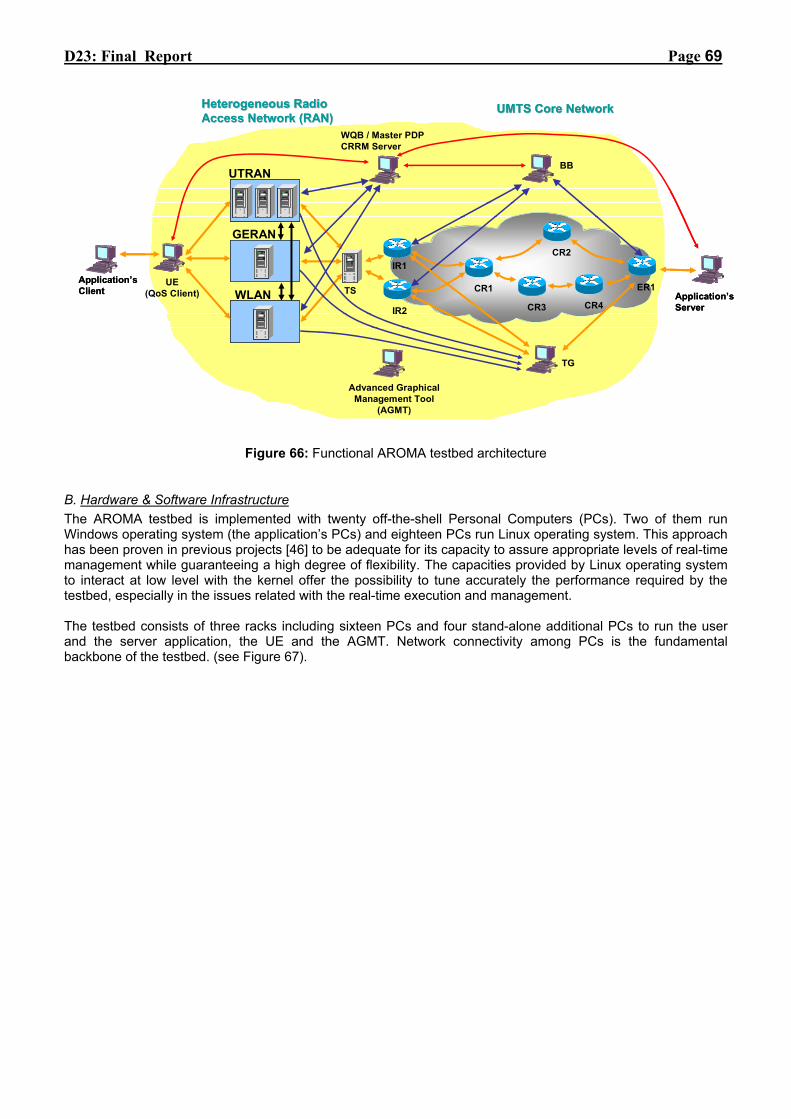
D23: Final Report Page 69
Application’sServer
GERAN
UMTS Core NetworkUMTS Core Network
IR1
IR2
ER1
TG
CR1
UTRAN
WLANUE
(QoS Client)
WQB / Master PDPCRRM Server
BB
Heterogeneous Radio Heterogeneous Radio Access Network (RAN)Access Network (RAN)
TS
CR2
CR3 CR4
Advanced GraphicalManagement Tool
(AGMT)
Application’sClient Application’s
Server
GERAN
UMTS Core NetworkUMTS Core Network
IR1
IR2
ER1
TG
CR1
UTRAN
WLANUE
(QoS Client)
WQB / Master PDPCRRM Server
BB
Heterogeneous Radio Heterogeneous Radio Access Network (RAN)Access Network (RAN)
TS
CR2
CR3 CR4
Advanced GraphicalManagement Tool
(AGMT)
Application’sClient
Figure 66: Functional AROMA testbed architecture
B. Hardware & Software Infrastructure The AROMA testbed is implemented with twenty off-the-shell Personal Computers (PCs). Two of them run Windows operating system (the application’s PCs) and eighteen PCs run Linux operating system. This approach has been proven in previous projects [46] to be adequate for its capacity to assure appropriate levels of real-time management while guaranteeing a high degree of flexibility. The capacities provided by Linux operating system to interact at low level with the kernel offer the possibility to tune accurately the performance required by the testbed, especially in the issues related with the real-time execution and management. The testbed consists of three racks including sixteen PCs and four stand-alone additional PCs to run the user and the server application, the UE and the AGMT. Network connectivity among PCs is the fundamental backbone of the testbed. (see Figure 67).

D23: Final Report Page 70
Figure 67: AROMA Testbed.
The network architecture has been conceived to both simplify the programming of testbed functions and keep a clear testbed organization. The connections are based on Ethernet 100BaseT links. Different virtual local networks have been differentiated to carry several kinds of packets. The two application PCs just need to offer enough capacities to run normal applications that are currently available at the market. To implement real-time operation a very high computational power is required. These computational requirements are out of the scope of today’s off-the-shelf PCs. Then, a cluster of PCs has been constructed to distribute the computational load throughout different processors. To do that, a tool named Communications Manager (CM) was designed and implemented to make this distribution completely transparent. Communications Manager (CM) [46] is a home-made software tool mainly devoted to integrate software from different developers and manage its execution on a networked cluster of PCs with a Linux operating system. An application under CM is made of software modules running in parallel that are joined through interfaces adequately matched. It also offers means to such software to interact with the controlling entity of the system by means of dynamically modified parameters and statistics. Finally, CM controls the execution of the software in a slotted temporal framework to provide the required timing to the application.
4.6.2 Innovative Issues As it has been mentioned, the AROMA testbed is a tool for evaluating e2e QoS within a B3G framework. This task requires complex configuration processes as well as careful implementation of some B3G enablers in both the radio and core network parts (e.g., all-IP, MPLS, QoS-aware mobility). In this section relevant aspects of the testbed concerning configuration and implementation issues that mainly differentiates this testbed from its predecessor in EVEREST project are detailed. These innovative issues are: the new capabilities of the RAN emulators, the mobility management solution, the RAT selection CRRM algorithms, the DiffServ/MPLS approach, the CN traffic generation, the e2e QoS management and the new Bandwidth Broker.
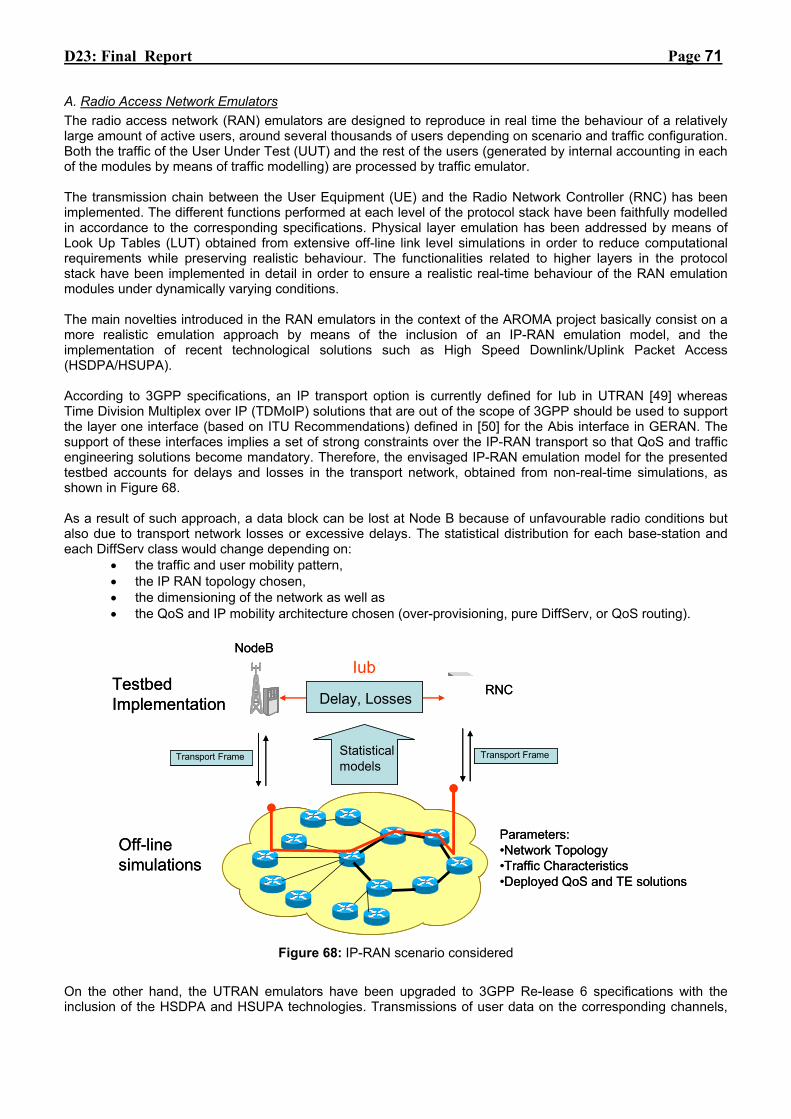
D23: Final Report Page 71
A. Radio Access Network Emulators The radio access network (RAN) emulators are designed to reproduce in real time the behaviour of a relatively large amount of active users, around several thousands of users depending on scenario and traffic configuration. Both the traffic of the User Under Test (UUT) and the rest of the users (generated by internal accounting in each of the modules by means of traffic modelling) are processed by traffic emulator. The transmission chain between the User Equipment (UE) and the Radio Network Controller (RNC) has been implemented. The different functions performed at each level of the protocol stack have been faithfully modelled in accordance to the corresponding specifications. Physical layer emulation has been addressed by means of Look Up Tables (LUT) obtained from extensive off-line link level simulations in order to reduce computational requirements while preserving realistic behaviour. The functionalities related to higher layers in the protocol stack have been implemented in detail in order to ensure a realistic real-time behaviour of the RAN emulation modules under dynamically varying conditions. The main novelties introduced in the RAN emulators in the context of the AROMA project basically consist on a more realistic emulation approach by means of the inclusion of an IP-RAN emulation model, and the implementation of recent technological solutions such as High Speed Downlink/Uplink Packet Access (HSDPA/HSUPA). According to 3GPP specifications, an IP transport option is currently defined for Iub in UTRAN [49] whereas Time Division Multiplex over IP (TDMoIP) solutions that are out of the scope of 3GPP should be used to support the layer one interface (based on ITU Recommendations) defined in [50] for the Abis interface in GERAN. The support of these interfaces implies a set of strong constraints over the IP-RAN transport so that QoS and traffic engineering solutions become mandatory. Therefore, the envisaged IP-RAN emulation model for the presented testbed accounts for delays and losses in the transport network, obtained from non-real-time simulations, as shown in Figure 68. As a result of such approach, a data block can be lost at Node B because of unfavourable radio conditions but also due to transport network losses or excessive delays. The statistical distribution for each base-station and each DiffServ class would change depending on:
• the traffic and user mobility pattern, • the IP RAN topology chosen, • the dimensioning of the network as well as • the QoS and IP mobility architecture chosen (over-provisioning, pure DiffServ, or QoS routing).
NodeB
RNCIub
Delay, Losses
Off-linesimulations
TestbedImplementation
Parameters:•Network Topology•Traffic Characteristics•Deployed QoS and TE solutions
Statisticalmodels
Transport Frame Transport Frame
NodeB
RNCIub
Delay, Losses
Off-linesimulations
TestbedImplementation
Parameters:•Network Topology•Traffic Characteristics•Deployed QoS and TE solutions
Statisticalmodels
Transport Frame Transport Frame
Figure 68: IP-RAN scenario considered
On the other hand, the UTRAN emulators have been upgraded to 3GPP Re-lease 6 specifications with the inclusion of the HSDPA and HSUPA technologies. Transmissions of user data on the corresponding channels,
D23: Final Report Page 72
i.e. High Speed Downlink Shared CHannel (HS-DSCH) for HSDPA and Enhanced Dedicated CHannel (E-DCH) for HSUPA, as well as all the related functionalities are fully implemented and emulated in real-time. Adaptive Modulation and Coding (AMC) has been implemented for HSDPA, a Hybrid Automatic Repeat reQuest (HARQ) protocol has been implemented for both HSDPA and HSUPA. In that sense, the effects of combining a transmitted data block with the subsequent re-transmissions following the chase combining and incremental redundancy methods have also been taken into account by means of accurate models based on link level results, and several scheduling algorithms have been included (for instance, round robin, maximum C/I, proportional fairness, and minimum guaranteed bit rate are implemented for HSDPA). Moreover the UTRAN emulators allow the possibility of including other scheduling criterions in an easy manner due to the scalable design of the RAN emulation modules. The rest of channels associated to HSDPA and HSUPA, others than the HS-DSCH and E-DCH, have not been implemented in a detailed manner, as it has been done for HS-DSCH and E-DCH, but their functionalities have been preserved completely in the emulation model and the existence of such channels is taken into account in terms of power and code space consumption. Notice that these channels are supporting channels carrying out signalling for the proper behaviour of the emulated HSDPA and HSUPA. Therefore, for emulation purposes it is enough to consider their main functionalities. Implementation details for all these channels and their associated techniques and functionalities as well as some related mobility aspects can be found in [51].
B. Mobility Management QoS-aware MPLS based mobility management implemented in the testbed allows the evaluation of IP handover delays in heterogeneous scenarios. The mobility management module considered in the tested comprises of three modules:
• the Anchor Point (ANP), • the Access Routers (AR) and • the Mobile Node (MN).
With reference to the test bed functional architecture (Figure 1), the ANP module runs in the Egress Router (ER), the AR runs in Ingress Router 1 (IR1) and IR2 and the MN agent runs in the UE. The functionalities of each of the entities in the testbed is explained below
• Initial login phase – At the beginning the MN is receiving Route Advertisement (RA) messages from the AR running in the IRs. Then, the MN makes a request to the correspondent AR that is processed and routed to the ANP. The ANP is in charge of providing the IP care-of-address to the MN that is running in the UE. The MN is authenticated, authorised and obtains an IP address (care-of-address) from the ANP. In the testbed, the ANP module is run at the ER node. The ANP sends an acknowledgement message to the MN agent with the network information and the result of the login request. On receipt of this, the MN sends the received network information to the QoS client. Based on this information, the UUT can make a session request with QoS negotiation.
• Handover execution – performed in case there is a change of AR. Based on the received RA information, the
MN detects that it is currently attached to the new access network. This triggers the handover procedures. A handover request is send through the new AR to the ANP that checks whether the new AR is within its operation area. Since in the testbed, the ANP module is run at the ER, both the ARs are within its operation range. The ANP processes the handover request and, sends a handover message to the BB indicating the changes in the network information. Based on the network information, the BB will initiate an e2e QoS re-negotiation with WQB.
• Handover preparation stage (called fast handover mechanism) aims at reducing handover delay and packet
losses during handover execution. This occurs just before the regular handover phase. With handover preparation stage, the traffic switch and CRRM modules are configured such that they allow the RAs from both the ARs to reach the MN just before the handover .When the MN receives RA from multiple ARs, it compares the (two in our case) received RAs. Comparing the AR information in the RAs, the MN knows to which AR it is moving to. The MN informs its current AR about the planned handover by sending the target AR IP address and QoS details. The old AR sets up a tunnel towards the new AR calculating the QoS route and performing source routing configuration. It is remarkable that any DiffServ class change here is hidden inside that tunnel. The tunnel is removed once the handover execution is completed.
Finally it is nor worthless to mention here that the envisaged mobility scenarios has been defined taking into account the network architecture, services (including mix and traffic load), environment type (suburban, urban

D23: Final Report Page 73
and indoor), and type of mobile users (pedestrian, urban traffic, and highway). The considered scenarios are mainly based on the requirements and visions of the three mobile operators that participate in the AROMA project.
C. CRRM and RAT selection The selection of an appropriate RAT for an incoming user requesting a given service is a key to any CRRM algorithm. Both the initial RAT selection, i.e. the allocation of resources at session initiation, and the vertical handover (VHO), i.e. the capability to switch on-going connections from one Radio Access Network (RAN) to another, are considered under RAT selection problem. Algorithms to select the most suitable RAT are not defined by the standardization bodies, thus the development of such kind of algorithms has become an important research field between radio communications community. Although this problem has been covered in a number of papers, e.g. [52], the proposed algorithms usually have been evaluated using simulators. Therefore, the relevance of testbed-based evaluation of RAT selection algorithms is becoming essential as a step forward towards the implementation of these algorithms in real B3G systems. RAT selection algorithms implemented in the testbed aim to facilitate the initial admission control, the congestion control and the VHO. Currently testbed incorporates six different newly algorithms like Network-Controlled Cell-Breathing (NCCB) [53] and fittingness factor [54], and it is open to include other new algorithms.
D. DiffServ/MPLS and CN architecture The core network built in the testbed is not emulated; it is a real implementation of different nodes working as routers. Those nodes are Linux machines that work as routers with DiffServ and MPLS support. The network topology can be seen in Figure 66 which illustrates a slightly unbalanced fish model. With this topology design and MPLS usage it is possibly to force data packets to follow different paths within the CN. MPLS architecture, defined in [55] and [56] to improve the IP networks forwarding capacity was also incorporated into the testbed, in order to enhance described IP tunnelling mechanism. MPLS adopts switching mechanisms based on labels added to IP packets on ingress points (the Label Edge Routers - LERs). LER takes unmarked packets from the network, looks up the IP header and determines a Forward Equivalency Class (FEC) the packet should belong to, deriving the corresponding LSP (Label Switched Path) the packet should take in the MPLS domain. With some exceptions, depending on the used L1/L2 technology, this requires the addition of special header to the IP packet to be correctly forwarded over the MPLS domain. In order to associate DiffServ information inside a MPLS domain the L-LSP (labelled-LSP) approach is used. The LER selects a label value not only by the packet destination address but also according to the DiffServ Code Point (DSCP) of the IP header (the corresponding FEC). In the MPLS domain, packets may follow different paths according to their priority (i.e., low priority packets may follow a longer path than the high priority ones), making traffic engineering possible.
E. Core Network Traffic generation For the core network part, there is no emulation. The traffic for the emulated users passing through the testbed is real IP traffic, which is generated by a modified iperf traffic generator in the CN [57]. Obviously, generation of traffic in IP network should be coordinated with traffic emulated in RANs. For this purpose, an aggregated traffic model has been used. In each of the RANs, the mean and variance of emulated traffic is calculated. After a predefined update interval this information is passed to traffic generator that controls up to 18 real flows entering the CN, see Figure 69. For the easier control of traffic differentiation per class, as well as for the control of the attachment point (IR) of a certain RAT, separate flows are generated for different services in each RAT. The downlink flows are entering in ER and are directed towards corresponding IR. The uplink flows are entering one of the IR (each RAN is connected to one of the two IRs) and going toward ER. The IP packet sizes are predefined and fixed for a certain class. These values may be changed as well as the update interval for the traffic generation.

D23: Final Report Page 74
Figure 69: Coordinated traffic generation model in CN
F. End-to-Edge QoS management As mentioned before, the AROMA testbed constitutes a realistic framework to test different e2e QoS strategies and evaluate the QoS level provided. Real client-server IP based applications are executed in the edges of the testbed and the perceived QoS will be measured once the real IP packets have passed through the testbed. This framework allows, at the same time, the testing of particular implementation of the QoS entities (WQB and BB) which may be important for operators before putting these implementations in their real networks. Initial negotiation of the QoS during session establishment as well as QoS re-negotiation procedures have been developed in the testbed. As a result, in our testbed the WQB (acting as the master policy broker) manages the QoS negotiation during session establishment and QoS re-negotiation within a session. The goal of the initial QoS negotiation procedure is to show that the status of both the RAN and the CN is taken into account in the session establishment. By testing different load conditions either in the RAN or in the CN it is expected to have different decisions (e.g. the session establishment with QoS requirements can be accepted, accepted with changes or rejected). This procedure involves the UUT, the WQB, the CRRM and the BB. The aim of the QoS re-negotiation procedure is to show how the QoS conditions may adapt themselves along an active session due to load changes in the radio part or in the core network part. These load changes during an active session may trigger a QoS re-negotiation that can be initiated either in the RAN or in the CN. Let us assume that WLAN and GERAN RATs are connected to the same Ingress Router (IR) of the CN and that UTRAN is connected to the other one (see Figure 66). Then some of the representative examples of situations that might trigger a QoS re-negotiation are:
• RAN triggered re-negotiation: An accepted WLAN connection has to move to UTRAN (VHO) due to an excessive WLAN occupation that degrades the rest of the services. In this case a QoS re-negotiation between the RAN and the CN is needed due to the change of attachment point (IR).
• CN triggered: In this case an UTRAN connection has to be moved to GERAN due to core network problems, triggering, in consequence, a QoS re-negotiation that involves also the execution of the RAT selection procedures in the radio part.
As in the session establishment, the RAN admission and congestion control algorithms (that move session from one RAT to another depending on load conditions) will impact the final result of the QoS re-negotiation. A detailed description of all the interactions between QoS management entities and supported procedures can be found in [51].
G. Bandwidth Broker The BB (Bandwidth Broker) is the main architecture element of the control plane of the DiffServ model proposed by IETF for supporting end-to-edge QoS in IP-based networks. In EVEREST testbed the BB regularly consulted

D23: Final Report Page 75
a data base manually modified where the currently available resources at the two ingress routers were stored. In AROMA testbed we replace this BB simplified implementation by a real BB implementation designed by the Portuguese operator in the project (Portugal Telecom Inovação). One relevant characteristic of this new BB architecture is the use of policy-based management, in order to dynamically allocate resources to the edge routers of the CN. As presented in previous section, the CN is composed by a DiffServ/MPLS domain with real traffic. BB’s responsibility is to control the LSPs creation and release when a certain event occurs, such as a new/delete session or a mobility issue. For that reason, an updated knowledge of the CN topology must exist in the BB, in order to verify the existence of available resources for a requested session. We refer to topology as the logical connection between routers in the network, which in the case of AROMA testbed is the knowledge of all the established LSPs and their availability to receive a new session, or to move one session from IR1 to IR2, or vice versa. The main objective of a BB is to perform admission control. Admission control is the mechanism used to evaluate whether requested resources are available in the CN, or, more precisely, if the routers in the traffic path have enough re-sources available to support the new traffic. Different ways to perform admission control exist, based in different evaluation parameters. Admission control procedure is triggered when the BB receives a request from the WQB for a new session entering the network, or for a moving session. After the reception of such request it should compute the path the packets will take from the ingress to the egress router, associate the type of traffic to a specific LSP and verify if the traffic characteristics can be attended in the path. Admission control can also exist every time the BB notes that a handover should be executed. A handover trigger from the CN part of the network is possible because BB is periodically collecting usage information from the IRs via SNMP. During the admission control process, a CAC algorithm is executed in order to produce a decision regarding the requested session that triggered the process. The main BB’s modules are depicted in figure 4 and a brief description of the internal BB’s modules follows:
1. Mobility Attendant – module that receives the mobility requests and triggers (inside the BB) the admission control process to verify if the user can move his sessions to another IR.
2. Resource Req. Attendant – modules to parse and understand the requests performed by the WQB entity.
3. Measurement analyst – Admission control process is based in the real status of the network. This module periodically polls (via SNMP) the network elements in order to update the network status, providing a better admission control process.
4. Admission Control – this module implements the admission control algorithms, responsible to accept or reject the requests received via the BB’s interfaces.
Several databases exist in order to accommodate the needed internal state of the BB, being the most important the topology and network status.

D23: Final Report Page 76
Figure 70: BB internal modules
4.6.3 Feasible Trials In this section some of the trials that can be carried out with the testbed are indicated. The trials defined for the AROMA testbed pursuit three specific objectives, which are proof of concepts, perceived QoS and implementation performance evaluation.
A. Proof of concepts The main objective of this set of demonstrations addresses the coherence between results obtained with simulators and the ones obtained with the real-time testbed where additional details of implementation are taken into account. These trials include:
• Support for specific CRRM algorithms and validation under realistic scenarios. • Support for integrated QoS control mechanisms between radio resource management and IP transport
network resources (i.e., between the e2e QoS entities like WQB and BB). • Support for the basic signalling procedures (session establishment, VHO, session QoS re-negotiation).
For example, RAT selection algorithms like NCCB and fittingness factor are implemented in the testbed and results obtained can be compared with the ones in the references [53], [54] also within the AROMA project. This kind of test is only as a proof of concept in a realistic scenario of the RAT selection algorithm that has actually been tested by simulation.
B. Perceived QoS In this set of trials, the main objective is to evaluate the variation in perceived QoS experienced by a user running real multimedia applications when changing e2e QoS management policies or strategies. The following trials have been initially defined:
• QoS requirements evaluation for selected applications in terms of needed bandwidth, guaranteed delay or packet losses. This means to make quality measurements with several commercial applications to test the QoS perceived by the UUT.
• Impairments in QoS perception related to specific network conditions in the core network. • Perform test over the testbed addressed to obtain results around the QoS perceived by the UUT under
different situations and scenarios like, vertical handover, changes in CRRM algorithms or QoS policies.
C. Implementation performance The main objective of this set of trials focuses on aspects that can provide valuable information of the behaviour of the considered algorithms and entities when working in an e2e QoS framework. These trials include:
• Execution time of specific procedures (e.g., period of time that a session request with QoS negotiation involving WQB, BB and CRRM requires).

D23: Final Report Page 77
• Performance of specific algorithms and entities using real measurements of the network traffic (e.g. BB’s Connection Admission Control (CAC) decisions based on real measurements of some links within the IP transport network).
During the entire simulation process, the AGMT enables an insight into the set of statistics in real time. These are values regarding both UUT’s performances in UTRAN, GERAN and WLAN, the number of active users, CRRM functionalities, etc
4.6.4 Testbed Conclusions In this section the beyond 3G real-time testbed for an all-IP heterogeneous wireless access network developed within the AROMA European project has been described. The testbed constitutes a powerful tool for carrying out realistic trials, usually not achievable by means of non-real-time simulations. In that sense, the SW/HW platform could be used to evaluate the e2e QoS experienced by a user in a heterogeneous mobile environment with IP connectivity under realistic conditions; to test and validate specific algorithms and mechanisms; and to evaluate real implementations of various subsystems. In addition to that, it is also important to remark that the platform currently includes both an IP CN, based on DiffServ/MPLS technology, using the L-LSP approach, with support of QoS-aware mobility, and UTRAN, GERAN and WLAN emulation. Moreover, the testbed is open to incorporate any other radio access technology foreseen in a heterogeneous environment.
Final Report Page 78
4.7 Techno-economic aspects of RRM techniques in Heterogeneous Networks One of the main objectives of the AROMA project was to highlight economic impacts of the Radio Resource Management (RRM) and Common RRM (CRRM) mechanisms within the context of an all IP heterogeneous network as well as to investigate the potential benefits coming from the long-term evolution of the existing mobile network architecture towards a new architecture based on the all IP paradigm. More in detail, the objectives of the techno-economics investigations have been: • To demonstrate the economic benefits of the proposed algorithms and techniques (complementing the
technical evaluations carried out by the project) • To give evidence of the potential economic advantages of using the specific RRM/CRRM algorithms
addressed by AROMA project • To identify and evaluate economic drivers in terms of CAPEX (CAPital EXpenditure) and OPEX (OPerational
EXpenditure) to migrate and converge towards an all IP heterogeneous architecture • To identify the most relevant economic scenarios, hypothesis and parameters dealing with RRM/CRRM
solutions.
In order to accomplish the techno-economic evaluations, CAPEX and OPEX figures have been collected from public available sources (mainly [58], [59]) and further elaborated internally by the AROMA consortium.
4.7.1 Addressed Methodology A. Investments versus revenues valorisation All the techno-economic evaluations have been carried out by assuming a short- or medium- term increase of the data traffic and by analyzing the potential savings offered by the addressed solutions with respect to the total investment (i.e. CAPEX and OPEX) needed to increase the capacity of the network. Hence, following the same approach also described in [59], these evaluations are based only on the estimation of the total costs faced by a network operator for upgrading the already deployed network in order to support the expected amount of traffic. In principle, an alternative way of calculating the economic value of the solutions taken into account could be based also on the estimation of the extra revenues related to the additional data traffic supported by the network. This approach has been considered less appropriate since it would require as much exact as possible assumptions on the revenues deriving from the services. Unfortunately, market forecasts on revenues could be very subjective and are usually affected by a higher degree of uncertainty with respect to the estimation of the network investments, since these are strictly related to the willingness to pay of the users for new services. Moreover, revenues from the offerings of new services are strictly dependent also on specific marketing strategies carried out as far as the end-user pricing policies are concerned, which can find justifications on many reasons (e.g. promotion of a specific new service by means of flat-rate prices, volume discounts to boost the service usage, etc.). As a consequence, service revenues are not always proportional to the load generated in the network, because these ones responds to different (marketing based) mechanisms with respect to the technical ones. Thus, the value of the service can be not related at all to the traffic generated. For this reason the revenues typically do not grow linearly with the amount of data exchanged, and this make hard to estimate the economic impacts of the addressed solutions on the basis of the capacity increase achieved within the heterogeneous network. B. Dependence of the results from the time based traffic hypotheses The carried out techno-economic investigations are based on the assumptions that a not negligible increase of data traffic will be demanded by users of mobile heterogeneous network in the next years, especially in dense populated areas. Several market forecasts agree on this assumption on the basis of the recent trends observed in European countries where 3G systems are more diffused nowadays. Even though the increase of data traffic demands is evident, it is however very difficult to say to what extent, and when, the potential savings related to this market trend can be realized. This uncertainty rise from the difficulty to make reliable traffic forecasts on a per year base, and thus it is difficult to say how big the demand for future network capacity will be. In order to limit the sensitivity of the results on the traffic forecasts, the approach based on the comparison of the solution with respect a “reference case” has been followed. In this way, economic impacts have been highlighted according to a “what-if” approach, apart from the absolute values achieved. This means that the results reported in the next section should not be considered relevant in an absolute way but useful to compare the different scenarios taken into accounts.

Final Report Page 79
In any case, it is worth noting that when the Net Present Value (NPV) of the investments during the reference period have been estimated, this calculus has been made in order to have a general idea of the actual economic value of the addressed solutions, even if should be clear that it strictly depends on the specific time assumptions considered. C. Market penetration of multi-mode terminals Another important aspect taken into account in the work consists in the thorough analysis of the market penetration of multi-mode terminals. How much relevant this aspect could be within the context of a heterogeneous network scenario is clear: by means of the CRRM mechanisms addressed by the AROMA project, different services are supposed to be offered by means of several radio access networks and technologies, in a transparent way for the users, with the aim of improving the QoS and optimizing the network. It is evident that this objective can be accomplished only if a no negligible percentage of users own terminals capable of using most of the radio technologies taken into account. For the above mentioned reasons, as a starting point of the work, an in deep investigation concerning the actual mobile terminal penetration (differentiated with respect to the different technologies available nowadays) as well as the expected short-term evolution of them has been carried out. On this concern the following information has been collected from public sources [60], [61], [62], [63], [64] and further elaborated for the specific scenarios taken as reference. According to [61] Europe’s operators estimate the UMTS adoption only by 10% of the European mobile users in 2007. This research also shows that UK and Italy are in the lead for 3G adoption: these countries are expected to see 3G penetration rates of 68% and 72%, respectively, by the end of 2010. Referring to [62], Figure 71 provides an assumed long-term growth rate for 3G penetrations up to 2021:
Figure 71 : Expected penetration of UMTS terminals up to 2021. [62]
With respect to the penetration of HSDPA capable terminal, as reported in [60] it is expected that about 19% of global mobile phone subscribers (40% of WCDMA connections) will have HSDPA capable terminals by 2011, as depicted in Figure 72:
Figure 72 :Terminal penetrations vs. different technologies [60].

Final Report Page 80
Also according to a white paper from the UMTS forum [64], by 2012, there will be almost 1 billion users of HSPA technology worldwide:
Figure 73 : Expected HSPA users worldwide (Source: UMTS forum [64]).
From the data reported above, we have derived the distribution of GSM, UMTS Release99 and UMTS HSDPA terminals that has been considered in the work, as shown by Table 8 .
Table 8 : Forecast of distribution of GSM, UMTS R99 and UMTS-HSDPA terminals
YEAR GSM terminals
UMTS R99 terminals
UMTS HSDPA terminals
2007 64 % 32.00 % 3.60 % 2008 57% 35.26 % 7.74 % 2009 48% 39.00 % 13.00 % 2010 38% 41.54 % 20.46 % 2011 35% 35.75 % 29.25 % 2012 33% 23.80 % 44.20 %
4.7.2 Economic impacts and business models of RRM mechanisms for micro-cell and WLAN usage within the 3G networks
A. Motivations An extensive increase of multimedia services demand originated by mobile users is expected in the near future. On the other hand, for the time being, it is possible to assume that the deployment of the UMTS radio access network (UTRAN) has been carried out in every country in order to offer coverage as large as possible. Such coverage based planning can be appropriate to offer multimedia 3G services (such as video telephony, video streaming , etc) in the wider part of the urban and sub-urban areas but it is not suitable to support high amount of users. WCDMA UMTS imposes a stringent limit in the maximum capacity achievable by means of a high number of sites due to the mutual interference that every cell causes to each other. Within the context of a heterogeneous network, micro-cell or WLAN technologies could be better solutions to increase capacity than conventional macro-cells. The most appropriate solution depends first of all on the spatial distribution of the traffic. When the users requesting services are approximately uniformly distributed in the area taken into account, one of the best solutions to increase the capacity could be the deployment of UTRAN micro-cells. Nevertheless, in many practical cases, a large amount of traffic is often localized in a few specific places inside the area. In this other

Final Report Page 81
case, it is well known that WLAN technologies are able to offer broadband bandwidth to a large amount of users characterized by a limited mobility level. Several technologies devoted to enable access to mobile services over WLAN are under definition. In the work, Unlicensed Mobile Access (UMA) technology [66] has been taken as reference, also considering that this solution has been acknowledged in 3GPP (Release 6) with the name of GAN, Generic Access Network [67]. B. Technical approach and main results One of the AROMA techno-economic investigation was devoted to evaluate on which conditions it is profitable to deploy UMTS micro-cells or WLAN hot-spots in a pre-existent UMTS macro-cell radio access network in order to support a given traffic increase. Both economic evaluations were based on the same fictive scenario, consisting in a dense-urban area where 10 tri-sectored UTRAN macro-sites are present, covering the entire area so that a mobile user inside the scenario can have access to 3G services. While the obtained results depends on the fictive scenario taken into account (considered as representative of a generic dense-urban area) the general approach and methodology used in the carried out economic analysis can be assumed as valid in a general case. According to the traffic based dimensioning model developed in the work (coverage issues have not been addressed), when a specific traffic threshold is reached, the deployed macro-cells layer is not able to fully support the assumed traffic any more so that a further deployment (UTRAN micro-cell or WLAN hot-spots) has to be foreseen due to capacity restrictions reasons. By applying to the network quantities estimated by means of the dimensioning model, and the assumed hypotheses in terms of traffic and costs, we obtained the total investments needed to support the assumed traffic increase, in each of the cases taken into account, as shown in Figure 74.
0
2000
4000
6000
8000
10000
1010 3536 6062 8587 11113 13639 16164 18690 21216
Traffic [kbit/s]
Cap
ex+O
pex
[Eur
o]
MACRO ONLYMACRO+WLAN 802.11bMACRO+WLAN 802.11aMACRO + MICRO (hot-spot)
Figure 74 – Total investments needed to support the assumed traffic increase (UTRAN micro-cell versus WLAN
cases). C. Conclusions The achieved results demonstrate that with the assumed hypotheses the addition of a micro-cell layer to the macro-cell one can be a very effective and flexible way to increase the capacity of large urban area. More in general, in a dense urban environment this kind of solution is expected to be more convenient than deploying additional macro sites. Moreover, results also highlight the potential advantages of using WLAN technologies when the demanded traffic is located in hot-spot areas. Further details on these topics can be found in AROMA deliverable D08 [65]. 4.7.3 Qualitative techno-economic analysis of long-term all IP mobile network architecture evolution A. Motivations Some techno-economic aspects concerning the evolution of mobile systems toward the future all IP architecture have been addressed by the AROMA project. The most relevant characteristics of the main novel emerging technologies in the mobile telecommunication field (such as OFDM based air interfaces, MBMS, DVB-H, WiMax,
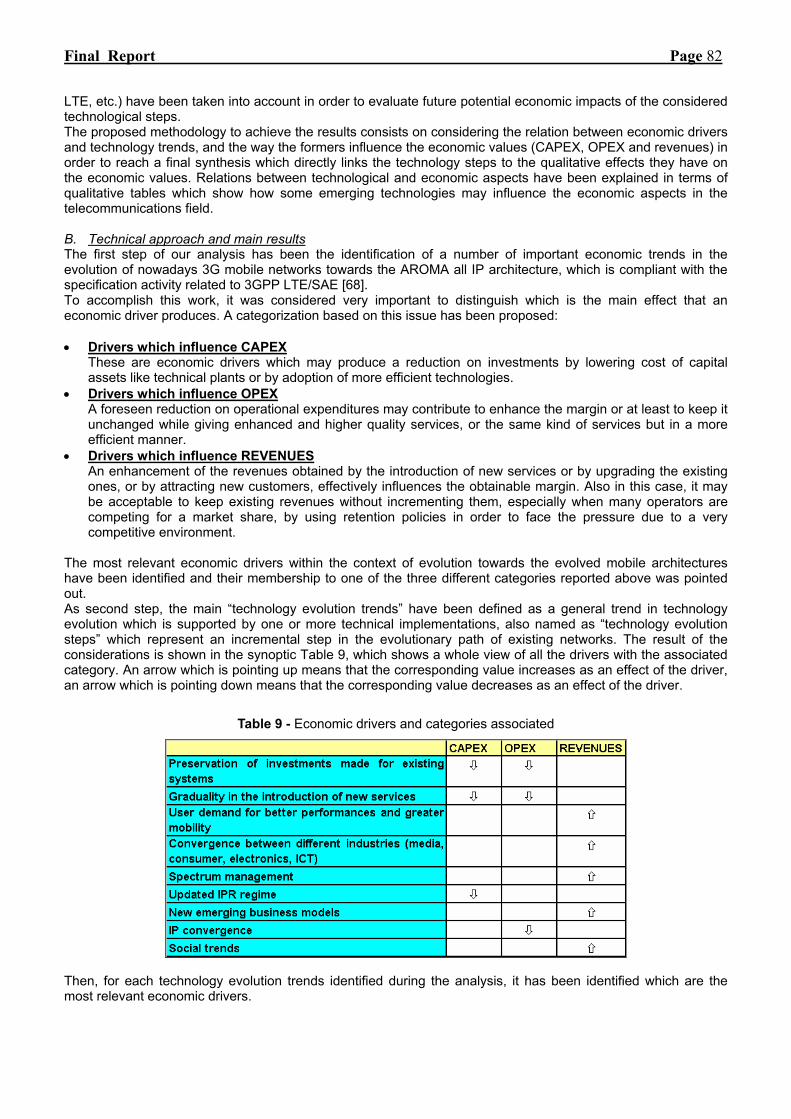
Final Report Page 82
LTE, etc.) have been taken into account in order to evaluate future potential economic impacts of the considered technological steps. The proposed methodology to achieve the results consists on considering the relation between economic drivers and technology trends, and the way the formers influence the economic values (CAPEX, OPEX and revenues) in order to reach a final synthesis which directly links the technology steps to the qualitative effects they have on the economic values. Relations between technological and economic aspects have been explained in terms of qualitative tables which show how some emerging technologies may influence the economic aspects in the telecommunications field. B. Technical approach and main results The first step of our analysis has been the identification of a number of important economic trends in the evolution of nowadays 3G mobile networks towards the AROMA all IP architecture, which is compliant with the specification activity related to 3GPP LTE/SAE [68]. To accomplish this work, it was considered very important to distinguish which is the main effect that an economic driver produces. A categorization based on this issue has been proposed: • Drivers which influence CAPEX
These are economic drivers which may produce a reduction on investments by lowering cost of capital assets like technical plants or by adoption of more efficient technologies.
• Drivers which influence OPEX A foreseen reduction on operational expenditures may contribute to enhance the margin or at least to keep it unchanged while giving enhanced and higher quality services, or the same kind of services but in a more efficient manner.
• Drivers which influence REVENUES An enhancement of the revenues obtained by the introduction of new services or by upgrading the existing ones, or by attracting new customers, effectively influences the obtainable margin. Also in this case, it may be acceptable to keep existing revenues without incrementing them, especially when many operators are competing for a market share, by using retention policies in order to face the pressure due to a very competitive environment.
The most relevant economic drivers within the context of evolution towards the evolved mobile architectures have been identified and their membership to one of the three different categories reported above was pointed out. As second step, the main “technology evolution trends” have been defined as a general trend in technology evolution which is supported by one or more technical implementations, also named as “technology evolution steps” which represent an incremental step in the evolutionary path of existing networks. The result of the considerations is shown in the synoptic Table 9, which shows a whole view of all the drivers with the associated category. An arrow which is pointing up means that the corresponding value increases as an effect of the driver, an arrow which is pointing down means that the corresponding value decreases as an effect of the driver.
Table 9 - Economic drivers and categories associated
Then, for each technology evolution trends identified during the analysis, it has been identified which are the most relevant economic drivers.

Final Report Page 83
As a final step, the logical combination of the two previously introduced steps shows the way technology trends influence and determine economic values, (i.e. CAPEX, OPEX or Revenues) as shown in Table 10.
Table 10 -Technology trends relation with economic variables.
CAPEX OPEX REVENUES
OFDM based radio interfaces
Core Network Evolution
All-IP paradigm
Terminal and application evolution
Broadcast solutions15
WLAN and cellular convergence (GAN)
Each red arrow pointing down represents a link between an economic driver, which is related to the technological trend, and the economic value, which is supposed to be reduced thanks to the new trend. In any case, it has to be remarked that the up and down arrows in Table 10 should be considered in a qualitative way so that they are not equivalent one each other (i.e. they cannot be directly compared and in some way algebraically summed up). C. Conclusions In the work a qualitative analysis of the technological trends and steps related to the evolution of mobile network architecture is provided. In this context, the main different evolutionary paths have been investigated both from a technical and an economic point of view, by highlighting in a qualitative way the relations between different technologies and economic aspects. In any case, it is useful to remark that the carried out analysis is not meant to provide any direct comparison between different options for network architectures, which was out of scope of the work, since it is of course determined by a lot of operator-specific characteristics, not applicable in a generic context. Further details on this study can be found in AROMA deliverable D14 [69].
4.7.4 Techno-economic evaluation of mobile TV service over MBMS A. Motivations The main objective of the Mobile TV techno-economic analysis was to investigate the total investment (i.e. CAPEX and OPEX) needed to increase the capacity of the UMTS network in order to be able to support also the traffic generated by the expected Mobile TV service subscribers. More in detail, mobile TV over MBMS scenario has been compared with respect to the mobile TV over HSDPA one In both cases, before assuming investments for the introduction of new nodeBs in the area of interest, it was assumed that the already existent nodeBs can be upgraded by activating a second UTRAN carrier in each cell. On this concern, Figure 75 shows the logic modules of the evaluation model:
15 Values reported in this table are related to MBMS, whereas CAPEX and OPEX for DVB-H have opposite values.
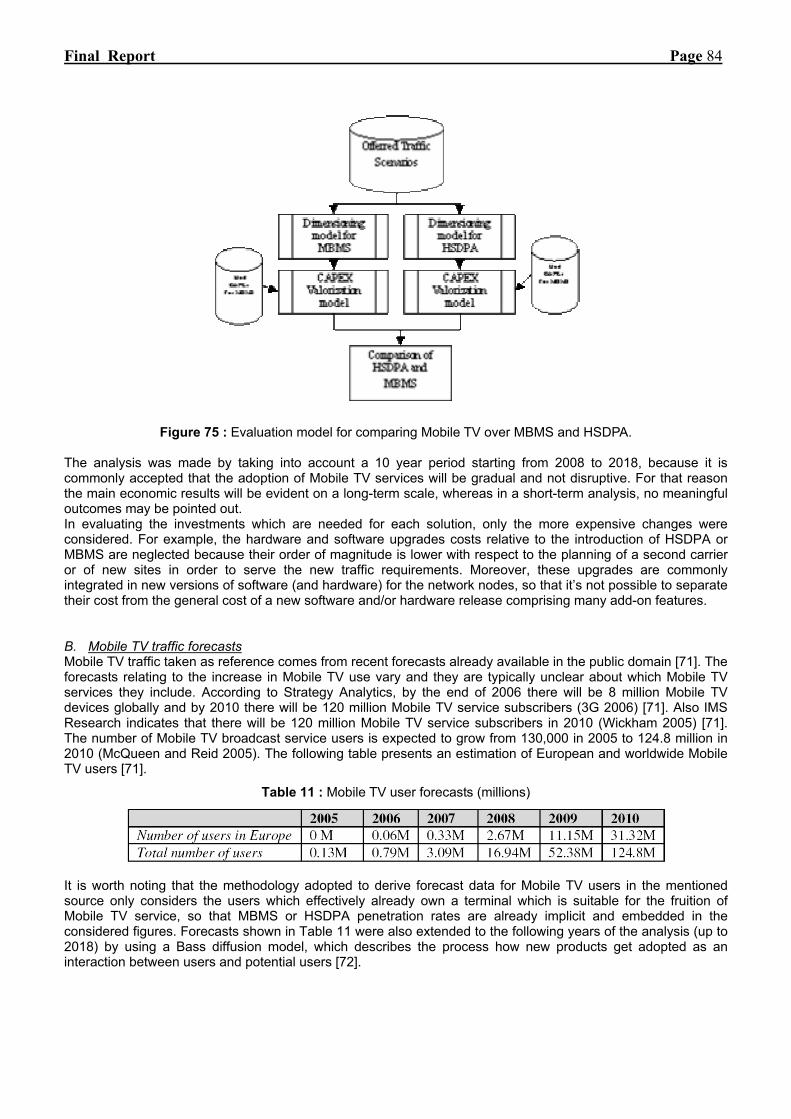
Final Report Page 84
Figure 75 : Evaluation model for comparing Mobile TV over MBMS and HSDPA.
The analysis was made by taking into account a 10 year period starting from 2008 to 2018, because it is commonly accepted that the adoption of Mobile TV services will be gradual and not disruptive. For that reason the main economic results will be evident on a long-term scale, whereas in a short-term analysis, no meaningful outcomes may be pointed out. In evaluating the investments which are needed for each solution, only the more expensive changes were considered. For example, the hardware and software upgrades costs relative to the introduction of HSDPA or MBMS are neglected because their order of magnitude is lower with respect to the planning of a second carrier or of new sites in order to serve the new traffic requirements. Moreover, these upgrades are commonly integrated in new versions of software (and hardware) for the network nodes, so that it’s not possible to separate their cost from the general cost of a new software and/or hardware release comprising many add-on features. B. Mobile TV traffic forecasts Mobile TV traffic taken as reference comes from recent forecasts already available in the public domain [71]. The forecasts relating to the increase in Mobile TV use vary and they are typically unclear about which Mobile TV services they include. According to Strategy Analytics, by the end of 2006 there will be 8 million Mobile TV devices globally and by 2010 there will be 120 million Mobile TV service subscribers (3G 2006) [71]. Also IMS Research indicates that there will be 120 million Mobile TV service subscribers in 2010 (Wickham 2005) [71]. The number of Mobile TV broadcast service users is expected to grow from 130,000 in 2005 to 124.8 million in 2010 (McQueen and Reid 2005). The following table presents an estimation of European and worldwide Mobile TV users [71].
Table 11 : Mobile TV user forecasts (millions)
It is worth noting that the methodology adopted to derive forecast data for Mobile TV users in the mentioned source only considers the users which effectively already own a terminal which is suitable for the fruition of Mobile TV service, so that MBMS or HSDPA penetration rates are already implicit and embedded in the considered figures. Forecasts shown in Table 11 were also extended to the following years of the analysis (up to 2018) by using a Bass diffusion model, which describes the process how new products get adopted as an interaction between users and potential users [72].
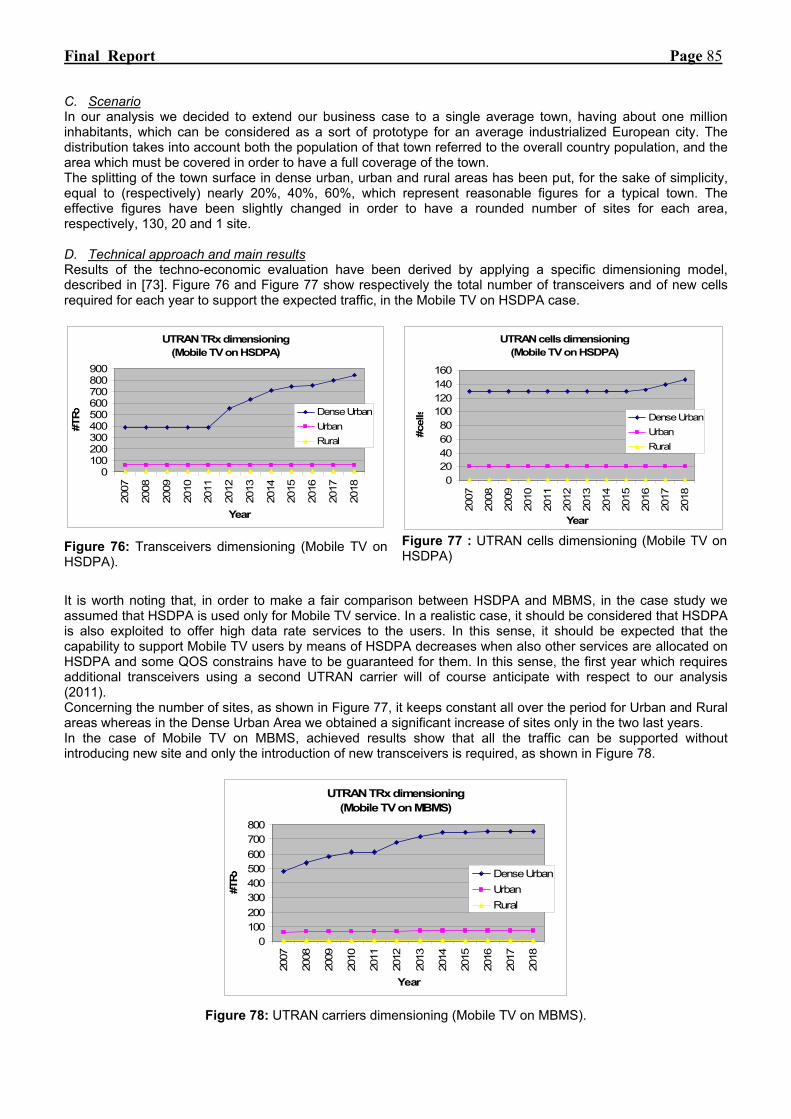
Final Report Page 85
C. Scenario In our analysis we decided to extend our business case to a single average town, having about one million inhabitants, which can be considered as a sort of prototype for an average industrialized European city. The distribution takes into account both the population of that town referred to the overall country population, and the area which must be covered in order to have a full coverage of the town. The splitting of the town surface in dense urban, urban and rural areas has been put, for the sake of simplicity, equal to (respectively) nearly 20%, 40%, 60%, which represent reasonable figures for a typical town. The effective figures have been slightly changed in order to have a rounded number of sites for each area, respectively, 130, 20 and 1 site. D. Technical approach and main results Results of the techno-economic evaluation have been derived by applying a specific dimensioning model, described in [73]. Figure 76 and Figure 77 show respectively the total number of transceivers and of new cells required for each year to support the expected traffic, in the Mobile TV on HSDPA case.
UTRAN TRx dimensioning(Mobile TV on HSDPA)
0100200300400500600700800900
2007
2008
2009
2010
2011
2012
2013
2014
2015
2016
2017
2018
Year
#TR
x Dense UrbanUrbanRural
Figure 76: Transceivers dimensioning (Mobile TV on HSDPA).
UTRAN cells dimensioning(Mobile TV on HSDPA)
020406080
100120140160
2007
2008
2009
2010
2011
2012
2013
2014
2015
2016
2017
2018
Year
#cel
ls Dense UrbanUrbanRural
Figure 77 : UTRAN cells dimensioning (Mobile TV on HSDPA)
It is worth noting that, in order to make a fair comparison between HSDPA and MBMS, in the case study we assumed that HSDPA is used only for Mobile TV service. In a realistic case, it should be considered that HSDPA is also exploited to offer high data rate services to the users. In this sense, it should be expected that the capability to support Mobile TV users by means of HSDPA decreases when also other services are allocated on HSDPA and some QOS constrains have to be guaranteed for them. In this sense, the first year which requires additional transceivers using a second UTRAN carrier will of course anticipate with respect to our analysis (2011). Concerning the number of sites, as shown in Figure 77, it keeps constant all over the period for Urban and Rural areas whereas in the Dense Urban Area we obtained a significant increase of sites only in the two last years. In the case of Mobile TV on MBMS, achieved results show that all the traffic can be supported without introducing new site and only the introduction of new transceivers is required, as shown in Figure 78.
UTRAN TRx dimensioning(Mobile TV on MBMS)
0100200300400500600700800
2007
2008
2009
2010
2011
2012
2013
2014
2015
2016
2017
2018
Year
#TR
x Dense UrbanUrbanRural
Figure 78: UTRAN carriers dimensioning (Mobile TV on MBMS).

Final Report Page 86
E. Conclusions The cumulative CAPEX and OPEX for the two different technologies is compared in the following graph, which is relative to an estimation of the investments needed for an fictive average town in a European country, for a “main” mobile operator (e.g. incumbent or second operator, with a 40% market share).
Cumulative CAPEX and OPEX
0123456789
10111213
2008
2009
2010
2011
2012
2013
2014
2015
2016
2017
2018
Year
Euro
(mill
ions
)
HSDPAMBMS
Figure 79 : Cumulative CAPEX and OPEX for MBMS and HSDPA
In the first years of the analysis MBMS is less convenient with respect to HSDPA because of the reasons already mentioned in previous section. When the number of Mobile TV subscribers continues to grow, the MBMS solution becomes more convenient. The break even point in our analysis is reached at around 2013. The number of users per cell (and their average usage) which is obtainable in this year may be considered the threshold of the data service usage that makes the introduction of MBMS more advantageous with respect to HSDPA. At the end of the observed period, the ratio of the cumulative investments for the two technologies is equal to 1.90, so the investments for supporting Mobile TV on HSDPA are nearly doubled with respect to the MBMS ones. In our analysis no new sites are added for MBMS solution, whereas their introduction is foreseen for HSDPA starting from 2016 (which corresponds to the knee of the curve of cumulative CAPEX and OPEX for this technology that can be observed in Figure 79. In any case, as already mentioned in section II, the achieved results strictly depend on the assumed hypotheses in terms of traffic, deployment and scenario). Further details on this study can be found in AROMA deliverable D17, [73].
4.7.5 Techno-economic evaluation of fittingness factor CRRM algorithm A. Motivations Potential economic benefits of applying traffic steering policies between GSM and UMTS systems have been largely investigated within the context of the AROMA project. In the considered case study, the traffic steering strategy is supposed to be realized by means of a specific implementation of a RAT selection algorithm based on the Fittingness Factor framework. This framework has been developed by the AROMA project and assessed from a technical point of view in deliverable D13 of AROMA project, [74]. The techno-economic evaluation has been carried out by assuming an increase of the data traffic demands for the next 5 years which requires new investments on network resources and by analyzing the potential savings offered by the CRRM algorithm with respect to the case when the algorithm is not present. In both these two cases (when the algorithm is present and when it is not), the specific investments considered in order to increase the capacity of the network to fulfill the traffic increase consists in the upgrade of the already present UTRAN sites by activating the second UTRAN carrier (i.e. same approach followed in [59]). B. Scenario and algorithm definition The fictive scenario when the CRRM algorithm is supposed to operate consists in an already deployed 2G/3G heterogeneous network which offers the radio coverage in a specific area by means of GSM and UMTS co-site cells. Within this scenario, the following three main categories of mobile terminals diffused in the market nowadays are supposed: • Category 1: single-mode ”GSM-only” mobile terminals (i.e. 2G terminals) • Category 2: dual-mode “GSM /UMTS-R99” mobile terminals (i.e. 3G terminals, not HSDPA capable) • Category 3: multi-mode “GSM/UMTS-R99/HSDPA” mobile terminals (i.e. 3G terminals, HSDPA capable)
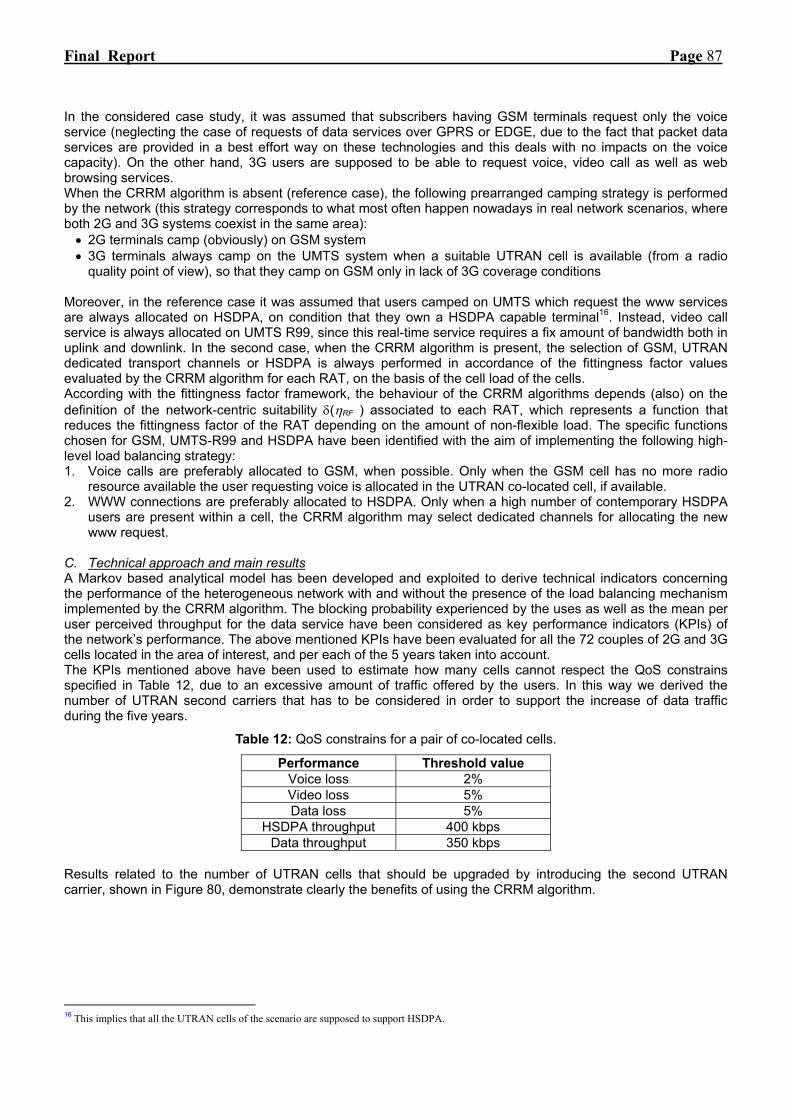
Final Report Page 87
In the considered case study, it was assumed that subscribers having GSM terminals request only the voice service (neglecting the case of requests of data services over GPRS or EDGE, due to the fact that packet data services are provided in a best effort way on these technologies and this deals with no impacts on the voice capacity). On the other hand, 3G users are supposed to be able to request voice, video call as well as web browsing services. When the CRRM algorithm is absent (reference case), the following prearranged camping strategy is performed by the network (this strategy corresponds to what most often happen nowadays in real network scenarios, where both 2G and 3G systems coexist in the same area): • 2G terminals camp (obviously) on GSM system • 3G terminals always camp on the UMTS system when a suitable UTRAN cell is available (from a radio
quality point of view), so that they camp on GSM only in lack of 3G coverage conditions Moreover, in the reference case it was assumed that users camped on UMTS which request the www services are always allocated on HSDPA, on condition that they own a HSDPA capable terminal16. Instead, video call service is always allocated on UMTS R99, since this real-time service requires a fix amount of bandwidth both in uplink and downlink. In the second case, when the CRRM algorithm is present, the selection of GSM, UTRAN dedicated transport channels or HSDPA is always performed in accordance of the fittingness factor values evaluated by the CRRM algorithm for each RAT, on the basis of the cell load of the cells. According with the fittingness factor framework, the behaviour of the CRRM algorithms depends (also) on the definition of the network-centric suitability δ(ηRF ) associated to each RAT, which represents a function that reduces the fittingness factor of the RAT depending on the amount of non-flexible load. The specific functions chosen for GSM, UMTS-R99 and HSDPA have been identified with the aim of implementing the following high-level load balancing strategy: 1. Voice calls are preferably allocated to GSM, when possible. Only when the GSM cell has no more radio
resource available the user requesting voice is allocated in the UTRAN co-located cell, if available. 2. WWW connections are preferably allocated to HSDPA. Only when a high number of contemporary HSDPA
users are present within a cell, the CRRM algorithm may select dedicated channels for allocating the new www request.
C. Technical approach and main results A Markov based analytical model has been developed and exploited to derive technical indicators concerning the performance of the heterogeneous network with and without the presence of the load balancing mechanism implemented by the CRRM algorithm. The blocking probability experienced by the uses as well as the mean per user perceived throughput for the data service have been considered as key performance indicators (KPIs) of the network’s performance. The above mentioned KPIs have been evaluated for all the 72 couples of 2G and 3G cells located in the area of interest, and per each of the 5 years taken into account. The KPIs mentioned above have been used to estimate how many cells cannot respect the QoS constrains specified in Table 12, due to an excessive amount of traffic offered by the users. In this way we derived the number of UTRAN second carriers that has to be considered in order to support the increase of data traffic during the five years.
Table 12: QoS constrains for a pair of co-located cells.
Performance Threshold value Voice loss 2% Video loss 5% Data loss 5%
HSDPA throughput 400 kbps Data throughput 350 kbps
Results related to the number of UTRAN cells that should be upgraded by introducing the second UTRAN carrier, shown in Figure 80, demonstrate clearly the benefits of using the CRRM algorithm.
16 This implies that all the UTRAN cells of the scenario are supposed to support HSDPA.

Final Report Page 88
23.6%13.9%
56.9%
4.2%
79.2%
0.0%
86.1%
0.0%
90.3%
0.0%0%
10%20%30%
40%50%60%
70%80%90%
100%
2008 2009 2010 2011 2012
Percentage of cells requring a new transceiver on the 2nd UTRAN carrier
without CRRMwith CRRM
Figure 80 : Percentage of UTRAN cells which require the introduction of new transceivers on the 2nd carrier.
Total 2nd UTRAN carrier investments
€ 0
€ 200,000
€ 400,000
€ 600,000
€ 800,000
€ 1,000,000
€ 1,200,000
€ 1,400,000
2008 2009 2010 2011 2012
without CRRM
with CRRM
Figure 81 : Total investments needed to support the offered traffic with and without the CRRM algorithm.
It is worth noting that, when the CRRM algorithm is used, the number of activations estimated by considering the QoS constrains decrease in the years following the first one. This issue can be understood by considering that the penetration of 3G terminals (as well as the penetration of HSDPA ones) increases during the time. For this reason, also the overall network performance increases due to the higher degrees of freedom of the CRRM algorithm. Even tough this phenomenon certainly happens, it should be considered that in practice the investments related to the upgrade of UTRAN cells to introduce new transceivers using the second carrier are not alienable. This practical consideration has been taken into account in the estimation of the total investments, which has been done by considering that the investments related to the UTRAN cells required in the first year of the analysis cannot be recovered in the following years. In this sense, the number of second UTRAN carrier activations for the estimation of the investments is determined by the first year. Hence, the total investments (CAPEX + OPEX) needed to introduce the additional spectrum with and without the CRRM algorithm are depicted in Figure 81. Figure 81 clearly demonstrates the positive economic impacts offered by the CRRM algorithm in terms of investments savings. In any case, concerning this aspect, it is worth noting that the cost of the introduction of the algorithm has not been considered, since it is very difficult to estimate and it strictly depends on the specific implementations and technological choices which can be very different case by case. In any case, also by considering that an extra cost should be included for the introduction of the CRRM algorithm, the economic benefits for an operator in terms of investments savings is not jeopardized. Finally, Table 13 reports how the investments should be spread over the considered five years (note that with the CRRM algorithm, investments are needed only in the first year, in order to upgrade the ten most critical cells with the second UTRAN carrier).
Table 13 : Investments needed to introduce new transceivers on the 2nd UTRAN carrier (k€).
2nd UTRAN carrier investments
(k€) 2008 2009 2010 2011 2012
without CRRM 306 432 288 90 54 with CRRM 180 0 0 0 0
By means of the figures reported in table above, it is possible also to estimate the Net Present Value (NPV)17 for the two considered cases, which represents the actual value of the entire investments made over the five years. NPV of investments without and with CRRM is about 1 M€ and about 0.1 M€ respectively, so that the difference in terms of NPV between the two considered cases (delta NPV) is around 0.9 M€. This figure can be considered as the last key indicator of the positive economic impacts offered by the CRRM algorithm.
4.7.6 Conclusions on Techno-economic evaluation Achieved results clearly demonstrate the positive potential economic impacts of the introduction of the CRRM algorithm taken into account, in terms of investments savings. Even though a specific algorithm was taken as reference, the load balancing strategies implemented by the algorithm for voice and data services can be 17 A WACC of 2% is considered.

Final Report Page 89
considered very general. For this reason, results similar to the ones reported in this work can be expected also with different CRRM algorithm implementations, on condition that they are devoted to put into practice the considered load balancing mechanisms. In this sense, the validity of the carried out techno-economic investigation can be considered quite general, too (even if the specific achieved results depends on the considered scenario and hypotheses). . It should be also considered that the economic analysis was based on the assumption that the network operator already has an important asset consisting in the already deployed GSM network. All the advantages offered by the CRRM algorithm is due to a better exploitation of this asset for voice users, which cannot be exploited adequately when 3G terminals are camped on UTRAN by default. In this sense, the validity of this analysis is limited to the case where the network operator has different radio access technologies and intends to put into practice appropriate strategies to exploit all of them within the context of an all-IP heterogeneous network. Further details on this study can be found in AROMA deliverable D17 [73].
Final Report Page 90
5 Main conclusions reached The overall conceptual studies and the implementation of the testbed have given good knowledge on the Radio Resource and QoS Management techniques. Complexity, feasibility and impacts of the selected solutions have produced a positive impression.
From a macro prospective, we have derived the following main lessons:
Coordination between the Transport and the Radio Part Focusing on the transport and radio access network coordination, AROMA has presented the Coordinated Access Resource Management (CARM) concept as a novel approach where some of the most important resource management functions (admission, congestion, cell/RAT selection, and bearer control) are designed to cope simultaneously with the resources in the radio part and those of the transport network. This leads to a new paradigm where transport resources are considered not only at the network dimensioning stage but are included in an integrated resource management scheme. It has been obtained that this general approach can bring particular benefits in terms of enhanced service provision in case that there exist bottlenecks in some transport links. Radio Resource Management Issues The RRM/CRRM is a complex problem with many factors influencing in the achieved performance and with many mixing effects. The intensive simulation work carried out in AROMA has provided a solid background and a significant engineering enrichment. The step by step approach that has been followed, starting with the simpler scenarios and ending up with the more involved ones, has been revealed very useful to cope with the RRM/CRRM problem. At the end recommendations on: CRRM issues A large variety of studies related to CRRM for heterogeneous access networks have been carried out. Specifically: a) A 4D Markov chain model has been proposed for the evaluation of RAT selection strategies in a multi-RAT
scenario comprising GERAN and UTRAN technologies. The model enables a characterization of the main key performance indicators and allows a flexible definition of various RAT selection schemes. It provides some detailed insights that are not easily extracted from simulations (e.g. different maps of steady state distribution probabilities for the different RAT selection policies) and can be useful for a complete design of a CRRM strategy.
b) Specific inter-working mechanisms between GERAN and UTRAN specified by 3GPP have been analyzed, in order to identify useful CRRM strategies exclusively based on radio coverage aspects. In idle mode, simulation results show that inter-RAT cell re-selection procedure can be used to implement different camping strategies between GERAN and UTRAN, by modifying some key parameters. In turn, in connected mode, simulation results dealing with UTRAN to GERAN handover highlight that the handover procedure can be effectively exploited in order to take advantage of GERAN as a back-up system when the radio quality of UTRAN cell is not able to support user’s service. Furthermore, the impact of compress mode operation over specific CRRM strategies has been evaluated, showing that, compared with load balancing, coverage-based CRRM is more sensitive to compress mode operation.
c) Considering a heterogeneous system with 2G, 3G and WLAN radio access networks, it has been shown that using a centralized traffic steering algorithm implementing an operator traffic managing policy can improve the total heterogeneous system capacity in the order of 10-40% compared to a manual RAT selection reference case.
d) A Cost Function has been developed including a wide range of KPIs that take both user’s and operator’s perspectives into account. Many CRRM algorithms, policies and strategies can be based on this function, since all BSs and MTs will be marketed by their own cost on the network, enabling the creation of candidate lists for a given criterion. From the analysis of different strategies, it is shown that the service priority scheme has an important impact on results, since it modifies the load distribution factor in the different networks.

Final Report Page 91
e) The so-called opportunistic CRRM concept, which evaluates the convenience of either allocating a low bit rate RAT or waiting until reaching the coverage area of a high bit rate RAT to a terminal with a service lacking from stringent delay constraints. The algorithm has been evaluated revealing that it achieves an interference reduction in UTRAN R99 at the expense of only a small degradation in the average delay experienced by users operating in opportunistic mode.
f) Finally, trying to combine all the above conclusions obtained, a general framework has been presented in AROMA capturing all the issues involved in the RAT selection process. It is based on the so-called fittingness-factor, which is a new metric split in different terms reflecting the different main levels in the RAT selection, namely the terminal and network capabilities, the technical suitability at the radio part, which considers both a macroscopic and a microscopic component, the technical suitability at the transport part, and the operator/user preferences, which allows enforcing different operator policies in the decision. Using this new metric, which can be regularly updated with the user and network measurements, a specific algorithm for RAT selection has been proposed. The evaluation of this strategy has revealed its ability to split the traffic between RATs adapting to the network variations in terms of propagation, load and interference. As a result, services performance is improved. Furthermore, this algorithm has also been integrated in the CARM framework by considering RAT selection as a means to overcome problems due to transport network limitations.
The main conclusion is that the RAT selection problem is in general very complex and accounts for many variables depending on all the possible heterogeneities arising in each particular scenario. Consequently, CRRM solutions should try to capture all these variables in a general framework flexible enough to accomodate the different operator criteria and to cope with the particular considerations of each situation. In this way, enhanced service provision and improved network capacity can be achieved, which can eventually turn into investment savings for operators. Intrinsic RRM issues Intrinsic RRM mechanisms have been studied focusing on the latest technological advances of the UTRAN technology and on the internet-based IEEE 802.x technologies. As a result, the following conclusions have been obtained: a) Focusing in HSPA:
1. In the case of HSDPA, the effect of different configurations of the network depending on the terminal capabilities and traffic to be supported has been analysed. Specifically, it has been obtained that keeping in HSDPA all the HSDPA-based terminals can be in general a simpler solution, even in scenarios with high inter-cell interference. Similarly, a strategy using a minimum fixed power for HSDPA traffic can improve performance of streaming services. When considering the variation of the number of HSDPA OVSF codes in the presence of data users, a convenient solution for the operator is first to increase the HSDPA power to increase the throughput and later on to adapt the number of codes used per terminal.
2. In the case of HSUPA, link adaptation schemes to manage scheduled and non-scheduled service over
HSUPA have been studied, comparing a Demanding Channel Allocation (DCA) and Reserved Channel Allocation (RCA) in the presence of VoIP traffic. It has been observed that, especially with a tight interference limit, DCA gives a better performance in terms of both capacity and delay.
b) The studies of WLAN have analyzed the impact of the 802.11e parameters governing the QoS guarantees
and service prioritization. Network performance optimization, in terms of throughput and delay, has been performed by tuning properly some key parameters as: the contention window (CW), the AIFSN value or the transmission opportunity (TXOP) duration. Moreover, the available ACK mechanisms are also useful to increase throughput and decrease delay.
c) The RRM studies of WiMAX have analyzed admission control, traffic classification, shaping and policy and
traffic scheduling. Different scheduling algorithms have been evaluated and the Proportional Fair (PF) strategy gives the best performance for both non-real time and real time applications.
d) The RRM studies for the MBMS service have analyzed the performance of DCH or FACH channels to
deliver this service. The convenience of allocating one or another channel was highly dependant with the user spatial distribution (i.e. users close to the node B or to the cell edge). In accordance with these studies,

Final Report Page 92
different p-t-p/p-t-m switching algorithms were analyzed, obtaining an adequate performance in terms of user satisfaction.
e) The performance of VoIP service has been evaluated in the UTRAN and WLAN RATs using dynamic
simulations.
1. Focusing on UTRAN, end-to-end delay values experienced by VoIP packets increase when increasing de-jittering buffer length in the client side, this having an impact in terms of MOS. However, considering also the number of play-out interruptions, which increase when decreasing the buffer length, it is concluded that an optimum trade-off is achieved when setting the buffer length to 60 ms.
2. In terms of WLAN technology, it is obtained that MOS does not change significantly for the considered buffer lengths, so the optimum length is obtained to be at least equal to 40 ms, looking a the play-out blocks per session. It has also been obtained that the performance of the RTS/CTS handshaking technique in WLAN strongly degrades performance because of the overheads introduced by these packets.
f) The coexistence in a 802.11n WLAN network of terminals operating with 802.11b has been also studied.
Even with a moderate load in the AP, 11b terminals can stop the use of VoIP services because of the increased VoIP delay. A specific RRM strategy has been proposed where the WLAN system capacity is optimized by means of blocking 802.11b data transmissions. This strategy was shown to be effective in terms of reducing system delays and congestion in the WLAN system.
g) Finally, a joint power and rate adaptation scheme for DS/CDMA networks has been proposed to integrate
information from the TCP state machine with link layer adaptations to maximize the system throughput with satisfying TCP link QoS. The study reveals that the proposed cross layer optimization solution based on the congestion window and round trip time is optimum in the sense of the trade-off between transmitted power and difference of the actually received rate versus the required data rate.
Automated Tuning The network optimization process could imply the tuning of a large set of radio parameters in thousands of cells for evaluating the effects of a radio parameter on the network performance. As a result, a new RRM level has been considered in AROMA, namely the dynamic automated tuning of the RRM/CRRM parameters. Two different architectures were presented: on-line and off-line, and several parameter tuning mechanisms were proposed. The main outcomes of the activity can be summarized in the following points
a) On-line tuning requires fast time convergence and thus, fast rule-based tuning shall be applied.
However, to cope with the limitations of rule-based algorithm, a genetic algorithm (GA) to tune complex cellular optimization problems in the off-line framework was studied.To make GA more efficient, a rule-based solution is also incorporated into the GA operator, showing that this hybrid approach tends to be more efficient in terms of finding quality solutions.
b) A methodology to automatically tune the antenna tilt angle in a UMTS network has been presented, based on the implementation of the continuously adjustable remote electrical down tilt scheme. The proposed mechanism performs load balancing between cells and consequently improves network performance (e.g. in terms of QoS) in some sectors. Similarly, tuning CPICH power is another way to be able to balancing traffic through controlling the coverage.
c) In AROMA project, the RRM parameter tuning has focused on improving soft handover, call admission
and cell re-selection in idle mode. In the case of idle mode, the obtained results have been exploited to propose a contribution toward 3GPP standardization with a new self optimization use case for cell reselection for Section “6.21.5.3 Use Case 3” of the document TR 03.018 [37].
d) Considering a scenario where both HSDPA and R99 share the same carrier the automated tuning of the number of OVSF codes devoted to HSDPA has been analyzed. Specifically, the KPIs being considered are based on percentiles obtained from the histogram of reported CQIs by the different terminals, which captures the spatial traffic distribution, allowing a maximization of cell throughput while minimizing blocking probability.

Final Report Page 93
e) Finally, the study of auxiliary mechanisms for specific tuning mechanisms was carried out. Particularly, learning processes to update the other cell interference and learning process/monitor process in downlink capacity tuning were studied.
Transport Network Layer The studies in the transport network layer considered the necessity of IP based micromobility protocol and the associated resource management framework in the LTE architecture. Based on the state of the art LTE architecture, a framework for the resource management, QoS routing and IP micromobility stack was designed and their performance analysis was studied based on the chosen performance metrics. Implementation Feasibility The main outcomes of this task can be summarised in the following: a) Related to RRM algorithms, main implementation aspects for an algorithm to control MBMS switching
between p-t-p and p-t-m have been reported and acknowledged by 3GPP. b) Focusing on CRRM algorithms for UTRAN-GERAN, it has been concluded that some of the proposed
algorithms in AROMA projects can already be implemented without requiring modifications in the specifications. However, it has also been highlighted the need to extent the current measurement reporting functions between radio network controllers if more advanced CRRM algorithms such as the one based on the fittingness factor shall be incorporated.
c) Focusing on CRRM for WLAN and 3GPP networks, a detailed analysis has been conducted to assess the
potential degree of support of CRRM under the I-WLAN and GAN approaches. It has been concluded that I-WLAN solution does not specify any support for CRRM in terms of inter-RAT system information, inter-RAT UE measurements and inter-RAT mobility management. In turn, it is also noticed the lake of support for 802.11 RRM within the GAN specifications. However, since GAN is seen as a complementary radio access subsystem connected to the core network it is possible to consider the deployment of CRRM RAT selection algorithms.
d) Finally, focusing on the CARM framework, several generic implementation models have been described
without focusing on any particular radio access technology.
Final Report Page 94
References [1] 3GPP TR 25.912v7.0.0, “Feasibility study for evolved Universal Terrestrial Radio Access (UTRA) and
Universal Terrestrial Radio Access Network (UTRAN) (Release 7)”
[2] E. Mykoniati et al. “Admission Control for Providing QoS in DiffServ IP Networks: The TEQUILA Approach”. IEEE Communications Magazine, Jan. 2003.
[3] "An Admission Control Framework Integrating Radio and IP-Transport in 3GPP-based Networks", IST Mobile and Wireless Communications Summit, Budapest, July 2007.
[4] Ramon Ferrus et al., "Evaluation of a Cell Selection Framework for Radio Access Networks considering Backhaul Resource Limitations", PIMRC 2007.
[5] O. Sallent (editor) et al. ”Intermediate report on AROMA algorithms and simulation results”, IST-AROMA Project, Deliverable D12, EC-IST Office, Brussels, Belgium, March, 2007.
[6] 3GPP TR 25.881 v5.0.0 “Improvement of RRM across RNS and RNS/BSS”
[7] J. Pérez-Romero, O.Sallent, R.Agustí, M. Díaz-Guerra, Radio Resource Management Strategies in UMTS, John Wiley & Sons, 2005.
[8] 3GPP TS 44.318 “Generic access to the A/Gb interface; Stage 3”
[9] A. Tölli, P. Hakalin, “Adaptive load balancing between multiple cell layers”, IEEE VTC Fall, Vol. 3, Sept. 2002, pp.1691 – 1695.
[10] A. Pillekeit, F. Derakhshan, E. Jugl, A. Mitschele-Thiel, “Force-based load balancing in co-located UMTS/GSM networks”, IEEE 60th VTC 2004-Fall. 2004 Vol. 6, 26-29 Sept. 2004 pp. 4402 – 4406.
[11] S. Lincke-Salecker, “The Benefits of Load Sharing when Dimensioning Networks”, Proceedings of the 37th Annual Simulation Symposium (ANSS’04), April, 2004.
[12] J. Pérez-Romero, O.Sallent, R.Agustí, “Network Controlled Cell Breathing in Multi-service heterogeneous CDMA/TDMA scenarios”, IEEE VTC 2006-Fall, Montreal, September, 2006.
[13] IST-AROMA Project. http://www.aroma-ist.upc.edu
[14] J. Pérez-Romero et al. “Common Radio Resource Management: Functional Models and Implementation Requirements”, IEEE PIMRC Conference, Berlin, September, 2005.
[15] J. Pérez-Romero, O.Sallent, R.Agustí, “On the Optimum Traffic Allocation in Heterogeneous CDMA/TDMA Networks”, IEEE Trans. on Wireless Communications, Vol. 6, No. 9, September, 2007.
[16] J. Pérez-Romero, O.Sallent, R.Agustí, “Enhanced Radio Access Technology selection exploiting path loss information”, IEEE PIMRC Conference, Helsinki, September, 2006.
[17] X. Gelabert et al “A 4-Dimensional Markov Model for the Evaluation of Radio Access Technology Selection Strategies in Multiservice Scenarios”, IEEE VTC Fall Proceedings (VTC-F06), Montreal, October, 2006.
[18] A. Serrador, (ed.) et al., “Simulation tools: final version capabilities and features”, IST-AROMA Project, Deliverable D13, EC-IST Office, Brussels, Belgium, Apr. 2007.
[19] R. Ljung, (ed.) et al., “Target Scenarios specification: vision at project stage 1”, IST-AROMA Project, Deliverable D05, EC-IST Office, Brussels, Belgium, March 2006.
[20] 3GPP TS 25.304, “UE Procedures in Idle Mode and Procedures for Cell Reselection in Connected Mode”, Release 99.
[21] O. Sallent (editor) et al., “First report on AROMA algorithms and simulation results”, IST-AROMA Project, Deliverable D09, EC-IST Office, Brussels, Belgium, Nov. 2006.
[22] L. Ferreira, A. Serrador, L.M. Correia, “Concepts of Simultaneous Use in Mobile and Wireless Communications”, Wireless Personal Comms., Vol. 37, No. 3, May 2006, pp. 317-328.
[23] A. Serrador, L.M. Correia, “A Cost Function for Heterogeneous Networks Performance Evaluation Based on Different Perspectives”, in Proc. of ISTMWCS’07 - 16th IST Mobile & Wireless Communications Summit, Budapest, Hungary, July 2007.
[24] A. Serrador, L.M. Correia, “Policies For a Cost Function For Heterogeneous Networks Performance Evaluation”, 18th Personal, Indoor and Mobile Radio Communications, Athens, Greece, Sep. 2007.

Final Report Page 95
[25] J. Pérez-Romero et al. “Operator’s RAT Selection Policies Based on the Fittingness Factor Concept”, Proc. IST Summit, Budapest, June, 2007.
[26] J. Pérez-Romero, O.Sallent, R.Agustí, “A Novel Metric for Context-Aware RAT Selection in Wireless Multi-Access Systems”, Proc. ICC conference, Glasgow, June, 2007.
[27] O. Sallent & J. Pérez-Romero (editors) et al., “Final report on AROMA algorithms and simulation results”, IST-AROMA Project, Deliverable D18, EC-IST Office, Brussels, Belgium, Oct. 2007.
[28] IEEE 802.11 WG, “IEEE Standard for Information Technology – Telecommunications and information exchange between systems – Local and metropolitan area networks – specific requirements. Part 11: Wireless LAN Medium Access Control (MAC) and Physical Layer (PHY) specifications. Amendment 8: Medium Access Control (MAC) Quality of Service Enhancements”, IEEE Std 802.11e – 2005, Sep. 2005.
[29] 3GPP TR 25.922, “Radio resource management strategies (Release 7)”.
[30] Magne Petterson, Lars E. Braten, Anders G. Spilling, “Automatic antenna tilt control for capacity enhacement in UMTS”.
[31] A. Mäder, D. Staehle and M. Spahn, “Impact of HSDPA Radio Resource Allocation Schemes on the System Performance of UMTS”, in Proc. of VTC’07 Fall – 66th IEEE Vehicular Technology Conference, Baltimore, USA, Sep-Oct. 2007.
[32] M. Nawrocki, M. Dohler and A. Aghvami, Understanding UMTS Radio Network - Modelling, Planning and Automated Optimisation, John Wiley & Sons, 2006.
[33] E. Amaldi, A Capone and F. Malucelli, “Planning UMTS Base Station Location: Optimization Models with Power Control and Algorithms”, IEEE Trans. Comm., 2(5), Sept, 2005.
[34] A Eisebblatter et al, “Integer Programming methods for UMTS network planning”, in Proc of WiOpt’04, Cambridge, UK, 2004.
[35] 3GPP RAN2#57, R2-070649 (CR to TR 25.922), "Examples of RRM strategies for MBMS", Telecom Italia, TeliaSonera, Telefonica, February 2007.
[36] 3GPP RAN3#57, R3-071432 (CR to TR 03.018), "Self-optimization use case: self-tuning of cell reselection parameters for load balancing", Telecom Italia, Orange, Agust 2007.
[37] TR 03.018, "Evolved UTRA and UTRAN;Radio Access Architecture and Interfaces”
[38] 3GPP TR 25.922, “Radio Resource Management Strategies” (v. 7.0.1).
[39] Ericsson, "Drivers for Inter-RAT Radio Resource Management", R2-070051, 3GPP TSG-RAN WG2 Meeting #56-bis, Sorrento, Italy, 15-19 January 2007
[40] NTT DoCoMo, "Drivers for LTE Mobility Control", Tdoc-R2-070276, 3GPP TSG RAN WG2 #56bis, 15th – 19th January 2007
[41] 3GPP TS 25.331 v7.0.0, “Radio Resource Control (RRC); Protocol Specification (Release 7)”
[42] 3GPP TS 45.008 v7.3.0, “Radio Access Network; Radio subsystem link control (Release 7)”
[43] J. Pérez-Romero, O.Sallent, R.Agustí, “A Novel Metric for Context-Aware RAT Selection in Wireless Multi-Access Systems”, Proc. ICC conference, Glasgow, June, 2007.
[44] Rickard Ljung (editor), Anders Dahlen (editor) et al., "D05 Target Scenarios specification: vision at project stage 1", Deliverable of the AROMA project, April 2006. Available at http://www.aroma-ist.upc.edu.
[45] 3GPP TS 25.215: "Physical layer – Measurements (FDD)"
[46] X. Revés, A. Umbert, et al, “Implementation of a Real-time UMTS Testbed in a PC Network”, ACIS 3rd SNPD, June 2002, pp. 345-352.
[47] R. Ferrús, et al, “EVEREST Testbed: QoS Management Evaluation in B3G Networks”, TRIDENCOM, March 2006, 6pp.
[48] A. Umbert (Ed.), “D07: Testbed Specification”, Public Deliverable D07, AROMA IST-4-027567. Available: http://www.aroma-ist.upc.edu/
[49] 3GPP TS 25.434, “UTRAN Iub Interface Data Transport and Transport Signalling for Common Transport Channel Data Streams”.

Final Report Page 96
[50] 3GPP TS 48.054, “Base Station Controller – Base Transceiver Station: (BSC-BTS) interface; Layer 1 structure of physical circuits”.
[51] D. P. Audsin (Ed.) “D16: Integrated Testbed”, Public Deliverable D16, AROMA IST-4-027567. Available: http://www.aroma-ist.upc.edu/
[52] G. Fodor, A. Furuskär, and J. Lundsjo, “On access selection techniques in always best connected networks,” in ITC Specialist Seminar on Performance Evaluation of Wireless and Mobile Systems, Aug. 2004.
[53] J. Pérez-Romero, O. Sallent, R. Agustí, L. Wang, H. Aghvami, “A Novel Algorithm for Radio Access Technology Selection in Heterogeneous B3G networks”, IEEE VTC 2006-Spring, Melbourne, May, 2006.
[54] J. Pérez-Romero, O. Sallent, R. Agustí, “A Novel Metric for Context-Aware RAT Selection in Wireless Multiple Access Systems”, The IEEE International Conference on Communications (ICC 2007), Glasgow, Scotland, June 2007.
[55] E. Rosen, et al, “Multiprotocol Label Switching Architecture”, IETF RFC 3031, Jan. 2001.
[56] E. Rosen, et al, “MPLS Label Stack Encoding”, IETF RFC 3032, Jan. 2001.
[57] Iperf Project. Available: http://dast.nlanr.nat/Project/Iperf
[58] K. Johansson, “Cost Efficient Provisioning of Wireless Access”, licentiate Thesis in Telecommunications, KTH Stockholm, Sweden 2005.
[59] HiQ data AB, “Potential Value of Additional Spectrum for an UMTS Operator”, Stockholm, Sweden, 2004.
[60] IST-TONIC, Deliverable #11, "Final results on seamless mobile IP service provision economics”, Oct. 2002.
[61] http://nordicwirelesswatch.com/wireless/story.html?story_id=2296
[62] J. Björkdahl, E. Bohlin, "Competition Policy and Scenarios for European 3G Markets", Chalmers University of Technology, Göteborg, Sweden.
[63] http://www.wirelessbroadbandsystem.fi/bbstats.htm
[64] UMTS forum white paper, “3G/UMTS Evolution: towards a new generation of broadband mobile services”, Dec. 2006.
[65] A. Barbaresi et al., “Economic evaluation of legacy IST-EVEREST RRM/CRRM algorithms and solutions”, IST-AROMA Project, Deliverable D08, Oct. 2006
[66] UMA web site, http://www.umatechnology.org/technology/index.htm.
[67] 3GPP TS 43.318, ”Generic access to the A/Gb interface; Stage 2” (Release 6)
[68] 3GPP TR 25.913, “Requirements for Evolved UTRA (E-UTRA) and Evolved UTRAN (E-UTRAN)”
[69] R. Farotto et al., “Economic evaluation of AROMA all-IP architecture”, IST-AROMA Project, Deliverable D14, Apr. 2007.
[70] 3GPP TS 25.346, “Introduction of the Multimedia Broadcast Multicast Service (MBMS) in the Radio Access Network (RAN) - Stage 2 (Release 6)”
[71] P. Karhu, “Emerging Mobile Service Innovation Markets: The Case of the Finnish Mobile TV Service Market”,Dissertation of the University of St. Gallen, Jan. 2007.
[72] Bass, Frank (1969). "A new product growth model for consumer durables", Management Science 15, p215-227.
[73] R. Farotto et al., “Economic evaluation of novel AROMA RRM/CRRM algorithms and solutions”, IST-AROMA Project, Deliverable D17, Oct. 2007
[74] O. Sallent et al., "Intermediate report on AROMA algorithms and simulation results", IST-AROMA Project, Deliverable D13, Apr. 2007.
[75] Jialing Wang, “Will WiMAX + WLAN constitute a substitue to 3G? A Techno-Economic Case Study”, Master’s Degree Project, Sweden, March 2004
Final Report Page 97
Annex 1.- List of Publications The scope of this sub-section is to present the dissemination activities carried out by the AROMA project in scientific fora. In total the partners have published 47 scientific papers and contributed with 16 presentations in workshops. The publications are ordered according the media used: scientific journals and magazines, international conferences, workshops. Scientific Journals/Magazines
• Alvaro Gomes, Pedro Moreira, “Optimização automática de redes UMTS”, Saber & Fazer Telecomunicações. (Oct-Nov 2006)
• J. Perez- Romero, O. Sallent, R. Agusti, “On the optimum traffic allocation in heterogeneous
CDMA/TDMA networks”, IEEE Transaction on Wireless Communications. Vol. 6, nº9, September 2007
• Adelantado, J. Pérez-Romero, O. Sallent; “Non-uniform traffic distribution model in reverse link of multi-rate/multi-service WCDMA based systems”, IEEE Transactions on Vehicular Technology. Vol. 56, nº5, September 2007.
• N. Nafis, L. Wang, H. Agvahmi, R. Ferrús, X. Revés, “IP micromobility & QoS virtual network
testbed”, accepted for publication on International Journal of Network Management.
• J. Perez- Romero, O. Sallent, R. Agusti, “A novel Approach to Smart Multi-cell Radio Resource Management Based on Load Gradient Calculations” Wireless Networks Journal Accepted for publication in Wireless Networks journal, Springer, September, 2007.
Conferences: The following papers were presented in International Conferences:
• F. Casadevall; R. Ljung; A. Vega; A. Barbaresi; N. Nafisi; A. Gomes; L. M.Correia, “Overview of the
AROMA Project”, IST Summit 2006. Mykonos (Greece) June 5-8, 2006.
• R. Ferrús, N. Nafisi, O. Sallent, J. Pérez-Romero, A. Gelonch, “Towards End-to-end QoS in a Beyond 3G Scenario”, IST Summit 2006. Mykonos (Greece) June 5-8, 2006
• J. Majkowski, F. Casadevall, “Coexistence of IEEE 802.11b and IEEE 802.11e Stations in QoS
Enabled Wireless Local Area Network “,IASTED International Conference on Communication Systems and Applications (CSA 2006), Banff (Canada), July 3-05, 2006.
• J. Majkowski, F. Casadevall; “QoS Protection for IEEE 802.11e in WLAN with Shared EDCA and
DCF Access” 5th IASTED International Conference on COMMUNICATION SYSTEMS and NETWORKS (CSN 2006),Special session on Wireless Communication Systems and Networks (WCS&N 2006) , Palma de Mallorca (Spain) , 28-30 August 2006
• J. Pérez-Romero, O. Sallent, R. Agustí, “Enhanced Radio Access Technology Selection Exploiting
Path Loss Information”, 17th IEEE International Symposium on Personal Indoor and Mobile Radio Communications (PIMRC’06), Helsinki (Finland); 11-14 September 2006.
•
• F. Adelantado, J. Pérez-Romero, O. Sallent, "On Deploying Repeaters in CDMA Systems for Traffic Hot-Spots: An Analytical Characterisation”, 17th IEEE International Symposium on Personal Indoor and Mobile Radio Communications (PIMRC’06), Helsinki (Finland); 11-14 September 2006.
• J. Pérez-Romero, O. Sallent, R. Agustí, “Network Controlled Cell Breathing in Multi-service
heterogeneous CDMA/TDMA scenarios”; IEEE Vehicular Technology Conference 2006 Fall. Montreal (Canada), September 25-28, 2006.
Final Report Page 98
• X. Gelabert, J. Pérez-Romero, O. Sallent, R. Agustí, “A 4-Dimensional Markov Model Evaluation of Radio Access Technology Selection Strategies in Multiservice”; IEEE Vehicular Technology Conference 2006 Fall. Montreal (Canada), September 25-28, 2006.
• J. Majkowski, F. Casadevall, “Enhanced TXOP scheme for efficiency improvement of WLAN IEEE
802.11”; IEEE Vehicular Technology Conference 2006 Fall. Montreal (Canada), September 25-28, 2006.
• J. Majkowski, F. Casadevall, “Dynamic TXOP Configuration for QOS Enhancement in IEEE 802.11e Wireless LAN” , International Conference on Software, Telecommunications and Computer Networks (SoftCOM-2006), Split – Dubrovnik (Croatia), September 29-October 1, 2006
• R. Zubala, H. Kokoszkiewicz, M. Kuipers and L.M. Correia, “A Simple Approach to MIMO Channel
Modelling”, Proc. of EUSIPCO’2006 – 14th European Signal Processing Conference, Florence, Italy, Sep. 2006.
• Sallent, “A Perspective on Radio Resource Management in B3G”, 3rd International Symposium on
Wireless Communications held in Valencia (Spain), 5-8 September 2006
• X. Gelabert, J. Pérez-Romero, O. Sallent, R. Agustí, “Congestion Control Strategies In Multi-Access Networks” , 3rd International Symposium on Wireless Communications held in Valencia (Spain), 5-8 September 2006
• M. Kuipers and L.M. Correia, “Observed Relation between the Relative MIMO Gain and the Cell
Type”. EuCAP’2006, Nice (France), 6-10 November 2006
• J. Majkowski, F. Casadevall, “Calidad de servicio en WLAN considerando un escenario mixto IEEE 802.11e y IEEE 802.11b”. XVI TELECOM I+D+i , Madrid (Spain) 29-30 November 1 December 2006
• J. Pérez-Romero, R. Ferrús, O. Sallent, J. Olmos, “RAT Selection in 3GPP-based cellular
heterogeneous networks: From Theory to Practical Implementation”. IEEE Wireless Communications & Networking Conference WCNC2007, Hong Kong (China), 11-15 March, 2007.
• H. Galeana-Zapién, R. Ferrús, J. Olmos “Transport Capacity Estimations for Over-provisioned
UTRAN IP-based Networks”, IEEE Wireless Communications & Networking Conference WCNC2007, Hong Kong (China), 11-15 March, 2007.
• J. Olmos, R. Ferrús, O. Sallent, J. Pérez-Romero, F. Casadevall “A Functional End-to-End QoS
Architecture Enabling Radio and IP Transport Coordination”, IEEE Wireless Communications & Networking Conference WCNC2007, Hong Kong (China), 11-15 March, 2007.
• J. Pérez-Romero, O. Sallent, R. Agustí, “A Generalized Framework for Multi-RAT Scenarios
Characterisation”, at IEEE Vehicular Technology Conference (VTC2007- Spring), Dublin (Ireland) April 23-25, 2007.
• X. Gelabert, J. Pérez-Romero, O. Sallent, R. Agustí “On Managing Multiple Radio Access
Congestion Events in B3G Scenarios”, at IEEE Vehicular Technology Conference (VTC2007- Spring), Dublin (Ireland) April 23-25, 2007.
• Barbaresi, M. Colonna, A. Mantovani, G. Zarba, “Quality evaluation of VoIP service over IEEE 802.11
Wireless LAN”, 8th European Conference on Fixed Wireless Networks and Technologies (ECRR 2007) Paris (France) FR, 3-5 April 2007.
• Andrea Barbaresi, Andrea Mantovani, “Performance Evaluation of quality of VoIP service over
UMTS-UTRAN R99”, at ICC2007, Glasgow, (Scotland-United Kingdom), 24-28 June 2007.
• J. Pérez-Romero, O. Sallent, R. Agustí “A Novel Metric for Context-Aware RAT Selection in Wireless Multi-Access Systems”, at ICC2007, Glasgow, (Scotland-United Kingdom), 24-28 June 2007.

Final Report Page 99
• L. Wang, H. Aghvami , “Coverage-based Common Radio Resource Management in heterogeneous CDMA/TDMA Cellular Systems,” 2nd International Workshop on eSafety and Convergence of Heterogeneous Wireless Networks; New Orleans, Louisiana (USA), April 11-13, 2007.
• Á. Gomes, P.M. d’Orey, “Online Automated Tuning of RRM Parameters of UMTS Networks: Uplink
Load Factor Threshold”, at 6th Conference on Telecommunications (Conftele 2007), Peniche, Portugal, 9-11 May 2007.
• M. Kuipers and L.M. Correia, “Evaluation of the Relative MIMO Gain”, at 6th Conference on
Telecommunications (Conftele 2007), Peniche, Portugal, 9-11 May 2007.
• A. Serrador and L.M. Correia, “A Cost Function for Heterogeneous Networks Performance Evaluation”, at 6th Conference on Telecommunications (Conftele 2007), Peniche, Portugal, 9-11 May 2007.
• R. Ferrús, J. Olmos, O. Sallent, J. Pérez-Romero, F. Casadevall; “An Admission Control Framework
Integrating Radio and IP-Transport in 3GPP-based Networks” IST SUMMIT 2007, Budapest (Hungary) 1-5 July 2007.
• O. Sallent, J. Perez-Romero, R. M. Ljung, P. Karlsson, A. Barbaresi; "Operator’s RAT Selection
Policies Based on the Fittingness Factor Concept"; IST SUMMIT 2007, Budapest (Hungary) 1-5 July 2007.
• A. Serrador and L.M. Correia: “A Cost Function for Heterogeneous Networks Performance
Evaluation Based on Different Perspectives", IST Summit 2007, Budapest (Hungary) 1-5 July 2007.
• L. Wang, H. Aghvami, J. Perez-Romero, O. Sallent and R. Agusti, “Voice Capacity with Coverage-based CRRM in a Heterogeneous UMTS/GSM Environment”; 2nd International Conference on Communications and Networking in China (ChinaCom), Shanghai, China, August 22-24, 2007
• A. Serrador and L.M. Correia, “Policies for a Cost Function for Heterogeneous Networks
Performance Evaluation”, PIMRC 2007; Athens (Greece), 3-7 September 2007.
• N.Vucevic; J. Perez-Romero; O. Sallent, R. Agustí; “Reinforcement Learning for Active Queue Management in Mobile ALL-IP Networks”, PIMRC2007; Athens (Greece), 3-7 September 2007.
• R. Ferrús, J. Olmos, H. Galeana-Zapién, "Evaluation of a Cell Selection Framework for Radio
Access Networks considering Backhaul Resource Limitations" ;PIMRC2007 ; Athens (Greece), 3-7 September 2007.
• H. Galeana-Zapién, R. Ferrús, J. Olmos, "Comparison of Transport Capacity Requirements in 3GPP
R99 and HSDPA IP-based Radio Access Networks", PIMRC2007; Athens (Greece), 3-7 September 2007.
• A. Umbert, Ł. Budzisz, N. Vučević and F. Bernardo “An all-IP heterogeneous wireless testbed for
RAT selection and e2e QoS evaluation”; 1st International Workshop on Broadband Wireless Access (BWA2007); Cardiff- Wales (UK), 12-14 September 2007.
• M. Lopez Benitez, Ł. Budzisz, A. Umbert, N. Vučević and F. Bernardo, “A real-time testbed for
heterogeneous wireless networks”. 1st IEEE International Symposium on Wireless Vehicular Communications (WiVeC 2007); Baltimore (USA), 30-September 1-October 2007.
• M. García-Lozano, O. Sallent, J. Pérez-Romero, Á. Gomes, P. M. d’Orey, S.Ruiz; “Automated Up- and
Downlink Capacity Balancing in WCDMA networks”, VTC2007 fall; Baltimore (USA), 1-3 October 2007.
• M. Kuipers, A. Serrador and L.M. Correia, “Impact of MIMO Systems on CRRM in Heterogeneous
Networks”, Proc. of Workshop on Smart Antennas at the 37th European Microwave Conference, Munich, Germany, 8-12 October 2007.

Final Report Page 100
• N. Vučević, F. Bernardo, A. Umbert and Ł. Budzisz, “Evaluation of Perceived QoS with Multimedia
Applications in a Heterogeneous Wireless Network”. IEEE International Symposium on Wireless Communication Systems 2007 (ISWCS'07); Trondheim (Norway), 17-19 October 2007.
• R. Ljung, O. Sallent, J. Pérez-Romero, “On Improving Perceived User Throughput in Heterogeneous
HSPA, GERAN and WLAN Scenarios”; IEEE International Symposium on Wireless Communication Systems 2007 (ISWCS'07); Trondheim (Norway), 17-19 October 2007.
• F. Bernardo, N. Vučević, Ł. Budzisz, A. Umbert, and R. Acevedo “A Beyond 3G Real-Time Testbed for
an all-IP Heterogeneous Network”, 5th ACM International Workshop on Mobility Management and Wireless Access Protocols (MobiWAC 2007); Chania, Crete Island (Greece), 22 -26 October 2007
• M Kuipers, M. Maćkowiak and L.M. Correia, “Understanding Geometrically Based Multiple Bounce
Channel Models”, Proc. of EuCAP 2007 - The 2nd European Conference on Antennas and Propagation, Edinburgh, United Kingdom, 11-16 November 2007.
Workshops The following presentations were done in the Workshops
• O. Sallent “Radio Resource Management approaches in EVEREST & AROMA”. Spectrum and Radio Management Cluster meeting, Brussels (Belgium); 22 March 2006.
• O. Sallent “Radio Resource Management approach in EVEREST & AROMA”, WWI-MOCCA
Workshop, Yokosuka (Japan), 30 March 2006.
• O. Sallent “Spectrum and Resource Management (S&RM) Cluster”; SPORT VIEWS Workshop Paris (France) 22 June 2006.
• R. Ferrús, “Functional QoS Architecture enabling Radio and IP Transport Coordination”. Spectrum
and Radio Resource Management cluster. Brussels 3rd October 2006
• J. Pérez-Romero “AROMA overview and activities”, COST 2100, AROMA, NEWCOM joint workshop, Brussels (Belgium); 13 December 2006.
• O. Sallent: “AROMA: Conceptual studies: algorithms and simulations”; Broadband Air Interfaces and
SRM joint Workshop; Brussels 21st March 2007.
• R. Ferrús, “ End to Edge Architecture and QoS management for IP RANs”; B3G and SRM joint Workshop; Brussels 21st March 2007
• A. Barbaresi, “ Techno-economic aspects of the RRM techniques in Heterogeneous Networks”;
B3G and SRM joint Workshop; Brussels 21st March 2007
• R. Ferrús “Implementation framework for coordinated access and radio resource management solutions”. Presentation did at the Spectrum and Radio Resource Management cluster. Brussels 25th September 2007
• J. Pérez-Romero, O. Sallent, A. Umbert, A.Barbaresi, R.Ljung, R.Azevedo, “RAT Selection in Wireless
Multi-Access Systems”; 1st First Ambient Networks Workshop on Mobility, Multiaccess, and Network Management (M2NM 2007).
• R. Ferrús, J. Olmos, O. Sallent, J. Pérez-Romero, F. Casadevall; “A Resource Management
Framework for IP-based Radio Access Networks”. 1st First Ambient Networks Workshop on Mobility, Multiaccess, and Network Management (M2NM 2007).
Final Report Page 101
• J. Olmos, R. Ferrús, O. Sallent, J. Pérez-Romero, F. Casadevall “QoS architecture and functionalities: AROMA’s perspective”; Trends in Radio Resource management - 3rd Edition (AROMA workshop).
• J. Pérez-Romero, O. Sallent, A. Barbaresi, R. Ljung, A. Serrador, L.M. Correia; “Advanced Radio
Resource Management Solutions in AROMA” ; Trends in Radio Resource management - 3rd Edition (AROMA workshop).
• R. Ferrús, J. Olmos, A. Barbaresi, O. Sallent, J. Pérez-Romero, A. Vega; “Implementation issues in
resource management: AROMA’s approach.” ; Trends in Radio Resource management - 3rd Edition (AROMA workshop).
• A. Barbaresi, S. Barberis, F. Casadevall, R. Farotto, A. Vega Novella, “Techno-economic aspects of
RRM techniques in Heterogeneous Networks “;Trends in Radio Resource management - 3rd Edition (AROMA workshop).
• A. Umbert, R. Azevedo, D. Pramil Audsin, ”The AROMA Testbed solution: a realistic implementation
of a heterogeneous wireless access platform”; Trends in Radio Resource management - 3rd Edition (AROMA workshop).
Tutorials The presentation “Topics on Common Radio Resource Management (CRRM) Strategies for QoS provisioning over Heterogeneous (Beyond 3G) Wireless Radio Access Networks”; was done as a Tutorial in the 3rd International Symposium of Wireless Communication Systems 2006 (ISWCS 06), Valencia, Spain, September 5-8, 2006.
White Papers Three White Papers, two related to techno-economic issues and the other one related to the Common Resource Management strategies have been produced. The tittles of these White Papers follow:
• A Qualitative Techno-Economic Analysis on Evolutive 3GPP All-IP Architectures • Overview Of Techno-Economic Evaluation of Novel AROMA RRM/CRRM Algorithms and Solutions • RAT Selection in Heterogeneous Wireless Networks: AROMA’s View
Final Report Page 102
Annex 2.- Relation with the Standards As a matter of fact, the AROMA project addresses topics such as Radio Resource Management (RRM), Common Radio Resource Management (CRRM) and QoS Management that are typically outside the scope of the Standardization fora, being mainly implementation dependent issues which are considered as a way to let TCL players compete one each other. However, as it is explained below, the AROMA consortium has prepared some contributions to 3GPP reflecting the main outcomes of the project, with the aim of proposing enhancements useful to implement the solutions proposed by the project, especially as far as UMTS LTE is concerned These contributions are:
• R2-070916, CR to 3GPP TR 25.922 approved, “Examples of RRM strategies for MBMS” (Telecom Italia,
TeliaSonera, Telefónica on behalf of AROMA consortium): a new section concerning RRM strategies for MBMS has been added to the 3GPP TR 25.922 technical report. This section summarizes the main results achieved by the AROMA projects on the MBMS topic.
• R3-071432, CR to 3GPP TS 36.300 approved, “Self-optimization use case: self-tuning of cell reselection
parameters for load balancing.” (Telecom Italia on behalf of AROMA consortium, Orange):on the basis of AROMA results, the document proposed to 3GPP a new self optimization use case for cell reselection for Section “6.21.5.3 Use Case 3” of the TR 03.018. The proposal was agreed, that is Section “6.21.5.3 Use Case 3” of the TR 03.018 ¡Error! No se encuentra el origen de la referencia. has been extended including the optimisation of parameters for cell reselection as well. Hence, it is expected that SON use cases described in the TR will be included in a proper Annex of TS 36.300 (LTE Stage 2) as soon as they will be considered sufficiently stable
In addition to that is not worthless to mention a contribution on load balancing enhancements for LTE proposed by vendors in line with AROMA vision:
• R2-072390, “Requirements for Redirection” (Nokia, Nokia Siemens Networks, Telecom Italia, T-Mobile)

Final Report Page 103
Annex 3: Patents
A patent application has been submitted to the European Patent Office for one of the solution developed within the AROMA context concerning automated tuning mechanism. The proposed solution implements a RRM strategy for idle-mode users by optimizing parameters belonging to the System Information messages broadcasted by each cell of the network. Simulation results show that by following this approach, it is possible to obtain a more uniform load distribution among the cells: the usage of the available radio resource usage can be optimized accordingly.
• Patent title: "Method for managing radio resource of a mobile radio network, and network implementing the method"
• Reference: PCT/EP2007/052301 • Authors: A. Barbaresi, P. Goria • Data: March 12th 2007
Another patent application has been submitted to the Spanish Patent Office for one of the CRRM concepts developed within AROMA. In particular, the proposed procedure allows deciding the suitable time when a terminal establishes a connection to transfer delay non-sensitive data as well as the suitable Radio Access Technology to use. System level simulations carried out within AROMA have shown that the proposed method provides a better utilization of the available radio resources. The details about this patent follow:
• Patent title: “Procedimiento de selección de red de acceso radio oportunista” 18 • Reference: P200703008 • Authors: O. Sallent, R. Agustí, J. Pérez • Data: November 12th 2007
18 Title in Spanish. The equivalent English title could be “ Opportunistic Radio Access Technology Selection Procedure”

Final Report Page 104
Acronym List 2G 2nd Generation 3G 3rd Generation 3GPP Third Generation Partnership Project 4D Four Dimensional 4G Fourth Generation AAA Authentication, Authorization, Accounting AAL2 ATM Adaptation Layer 2 ABC Always Best Connected ABR Available Bit Rate AC Access Category, Access Class, Admission Control ACELP Algebraic Code Excited Linear Prediction ACK Acknowledgment AddWin Addition Window AF Assured Forwarding aGW Access Gateway AGMT Advanced Graphical Management Tool AIFS Arbitration IFS AIFSN AIFS Number AMC Adaptive Modulation and Coding AMR Adaptive Multi Rate ANP Anchor Point AP Access Point API Application Programming Interface AQM Adaptive Queue Management AR Access Router ARFCN Absolute Radio Frequency Channel Number AS Active Set ASU Active Set Update ATM Asynchronous Transfer Mode ATS Automated Tuning System B3G Beyond Third Generation BAR Border Access Router BB Bandwidth Broker BCCH Broadcast Control Channel BE Best Effort BER Bit Error Rate BHCA Busy Hour Call Attempt BLER Block Error Rate BO Blocking Only BR Bit Rate BrD Bit rate Delay BrO Bit rate Only BrS Bit rate and Service BS Base Station, Bearer Selection BS_CS Best Server Cell Selection BSC Base Station Controller BSIC Base Station Identity Code BSS Basic Service Set, Base Station Subsystem BSSGP Base Station Subsystem GPRS Protocol BSSMAP Base Station Subsystem Mobile Application Protocol BTS Base Transceiver Station CA Congestion Aware CAC Call Admission Control CAEDT Continuously Adjustable Electrical Downtilt CAPEX Capital Expenditure CARM Coordinated Access Resource Management CBQ Class Based Queuing CBR Call Blocking Rate, Constant Bit Rate CBS Committed Burst Size

Final Report Page 105
CC Convolutional Coding, Congestion Control CD Congestion Detection CDF Cumulative Distribution Function CDMA Code Division Multiple Access CDR Call Dropping Rate CF Cost Function CFR Call Failure Rate CGI Cell Global Identifier CI Cell Identity CIR Carrier to Interference Ratio, Committed Information Rate CM Compress Mode CN Core Network COPS Common Open Policy Service CoS Class of Service CPICH Common Pilot Channel CPU Central Processor Unit CQI Channel Quality Indicator CQICH Channel Quality Information Channel CR Congestion Resolution, Cell Redirection, Core Network Routers CR-LDP Constraint Routing- Label Distribution Protocol CRRM Common Radio Resource Management CRV Congestion RecoVery CS Circuit Switch, Cell Selection CTS Clear To Send CW Contention Window cwnd congestion window DAC Data Centric scenario DB Delay and Blocking DCA Demanding Channel Allocation DCCH Dedicated Control Channel DCF Distributed Coordination Function DCH Dedicated CHannel DCR Drop Call Rate DFT Drop From Tail DIFS Distributed InterFrame Space DiffServ Differentiated Services DHCP Dynamic Host Configuration Protocol DL Downlink DO Delay Only DPCCH Dedicated Physical Control Channel DPDCH Dedicated Physical Data Channel DR Directed Retry DS/CDMA Direct Sequence Code Division Multiple Access DSL Digital Subscriber Line DSCP DiffServ Code Point DSNP Dynamic Service Negotiation Protocol DWDM Dense Wavelength Digital Multiplexing E2E End to End E-AGCH E-DCH Absolute Grant Channel Eb/No bit energy over noise power spectral density Ec/Io, Ec/No chip energy over total received power spectral density EDCA Enhanced Distributed Channel Access EDGE Enhanced Data rates for GSM Evolution E-DCH Enhanced Dedicated Channels E-DPDCH Enhanced Dedicated Physical Data Channel E-DPCCH E-DCH Dedicated Physical Control Channel EF Expedited Forwarding EGPRS Enhanced GPRS E-HICH E-DCH HARQ Indicator Channel EM Element Manager

Final Report Page 106
EMC Electromagnetic compatibility eNB Evolved Node B ER Egress Router E-RGCH E-DCH Relative Grant Channel ET Electrical Tilt E-TFCI Enhanced Transport Format Combination Indicator ETSI European Telecommunications Standardization Institute EUL Enhanced Uplink E-UTRAN Evolved UTRAN FACH Forward Access Channel FCH Frame Control Header FDD Frequency Division Duplex FDMA Frequency Division Multiple Access FEC Forwarding Equivalency Class FFT Fast Fourier Transform FIFO First Input First Output FP Framing Protocol FR Frame Relay FTP File Transfer Protocol GA Genetic Algorithm GAN Generic Access Network GANC Generic Access Network Controller GBR Guaranteed Bit Rate GBSBCM Geometrical Based Single Bounce Channel Model GERAN GSM/EDGE Radio Access Network GGSN Gateway GPRS Support Node GPRS General Packet Radio Service GSLP Generic Signalling Layer Protocol GSM Global System for Mobile Communications GW GateWay HARQ Hybrid Automatic Repeat reQuest HCCA HCF Controlled Channel Access HCS Hierarchical Cell Structure HEC HTTP + Email Centric HEM HTTP + Email Maximum HHO Horizontal Handover HM High Mobility HMIP Hierarchical Mobile IP HO HandOver HOFF Handoff HPLMN Home Public Land Mobile Network HPREP Handover Preparation HQOSPF Hierarchical QOSPF HS-DSCH High Speed Downlink Shared Channel HS-PDSCH High Speed Physical Downlink Shared Channel HSDPA High Speed Downlink Packet Access HSPA High Speed Packet Access HS-SCCH High Speed Signalling Control Channel HSUA Hot Spot in Urban Area HSUPA High Speed Uplink Packet Access HTTP Hypertext Transfer Protocol HUD High User Density HVSC HTTP + Video Streaming Centric HVSM HTTP + Video Streaming Maximum IAPP Inter-Access Point Protocol IE Information Element IEEE Institute of Electrical and Electronics Engineers IETF Internet Engineering Task Force IFS InterFrame Space IMS IP Multimedia Subsystem
Final Report Page 107
IMSI International Mobile Subscriber Identifier IntServ Integrated Services IP Internet Protocol IPC IP Communication IR Ingress Routers ISCP Interference Signal Code Power ISDN Integrated Services Digital Network ITU International Telecommunications Union I-WLAN Inter-working Wireless Local Area Network KPI Key Performance Indicator JRT Joint Radio and Transport L1 Layer 1 L2 Layer 2 L3 Layer 3 LA Link Adaptation LAI Location Area Identifier LB Load Balancing LBR Load Balancing Radio LDP Label Distribution Protocol LER Label Edge Router LEMA Label Edge Mobility Agent LF Load Factor LFIB Label Forwarding Information Base LFT Load Factor Threshold L-LSP Labelled-LSP LM Low Mobility LNA Low Noise Amplifier LoS Line-of-Sight LPC Low Path loss for CDMA LPT Low Path loss for TDMA LSA Link State Advertisement LSP Label Switched Path LSR Label Switching Router LTE Long Term Evolution LU Link Utilisation LUD Low User Density LUT Look Up Tables MAC Medium Access Control MAN Metropolitan Area Network maxCL Maximum Coupling Loss MAX Maximum Cell Throughput MBAC Measurement Based Admission Control MBMS Multimedia Broadcast/Multicast Service MBR Maximum Bit Rate MC Mobility Control MCL Minimum Coupling Loss MCS Modulation and Coding Scheme MGW Media GateWay MIB Management Information Base MIMO Multiple Input Multiple Output MIP Mobile IP MM Medium Mobility, Mobility Management MME Mobility Management Entity MMS Multimedia Messaging Service MMTD Multi-Mode Terminal Driven MN Mobile Node MOP Multi-objective Optimization Problem MOS Mean Opinion Score MPDP Master PDP MPL Minimum Path Loss

Final Report Page 108
MPLS Multi Protocol Label Switching MSC Mobile Switching Center MSRP Message Session Relay Protocol MT Mobile Terminal, Mechanical Tilt MUD Medium User Density MUI Multi User Interference NACC Network Assisted Cell Change NACK Negative Acknowledgement NCCB Network Controlled Cell Breathing NE Network Element NHLFE Next Hop Label Forwarding Entry NM Negotiation Manager NMS Network Management System NoCF No Cost Function NP Network Performance NPV Net Present Value NRT Non Real Time NRTC Non Real Time Centric NRTM Non Real Time Maximum NSIS Next Steps in Signalling NSLP NSIS Signalling Layer Protocol OAM Operation And Maintenance OFDMA Orthogonal Frequency Division Multiple Access OPEX Operational Expenditure OSPF Open Shortest Path First OVSF Orthogonal Variable Spreading Factor PC Power Control, Personal Computer P-CCPCH Primary Common Control Physical Channel PCEF Policy and Charging Enforcement Function PCPICH Primary CPICH PDA Portable Device Assistant PDC Pacific Digital Cellular PDCH Packet Data Channel PDCP Packet Data Convergence Protocol PDG Packet Data Gateway PDH Plesiochronous Digital Hierarchy PDN Packet Data Network PDP Packet Data Protocol PDU Packet Data Unit, Protocol Data Unit PF Proportional Fair PHB Per Hop Behaviour PHY Physical PLM Path Loss Margin POS Packet Over SONET PPP Point to Point Protocol PQ Priority Queuing PS Packet Switch PSTN Public Switched Telephone Network P-t-m point to multipoint P-t-p point to point PU Path Utilisation PUSC Partially Used Sub-Carrier QAM Quadrature Amplitude Modulation QI Quality Indicator QoE Quality of Experience QoS Quality of Service QOSPF QoS enabled OSPF QoSR QoS Routing QPSK Quadrature Phase Shift Keying R5 Release 5
Final Report Page 109
R6 Release 6 R99, Rel’99 Release 99 RAB Radio Access Bearer RACH Random Access Channel RAN Radio Access Network RAT Radio Access Technology RC Route Control RCA Demanding Channel Allocation RCR Refused Call Rate RED Random Early Discard REF Reference RET Remote Electrical Tilt RETAP Remote Electrical Tilting Antennas Application Part RF Radio Frequency RFC Request For Comments RGB Red Green Blue RIM RAN Information Management RLA Received Level Average RLC Radio Link Control RL-QDL Reinforcement Learning Queuing Delay Limits RMG Relative MIMO Gain RM Resource Manager RN Radio Network RANAP Radio Access Network Application Protocol RMD Resource Management in DiffServ RNAP Resource Negotiation and Pricing Protocol RNC Radio Network Controller RND RaNDom RNL Radio Network Layer ROHC RObust Header Compression RP_CS Radio Prioritized Cell Selection RPS Radio Packet Scheduling RR Round-Robin RRC Radio Resource Control RRM Radio Resource Management RS RAT Selection RSCP Received Signal Code Power RSN Retransmission Sequence Number RSSI Received Signal Strength Indicator RSVP Reservation Protocol RT Real Time RTC Real Time Centric RTM Real Time Maximum RTP Real Time Protocol RTPS Real Time Packet Services RTS Request To Send RTT Round Trip Time Rx Receiver SAE System Architecture Evolution SB Service Based S-CCPCH Secondary Common Control Physical Channel SDH Synchronous Digital Hierarchy SDU Service Data Unit SEGW Secure Gateway SF Spreading Factor SGSN Serving GPRS Support Node SHO Soft Handover SI Service Interval SIB System Information Block SID Silence Detection

Final Report Page 110
SIFS Short InterFrame Space SINR Signal to Interference and Noise Ratio SIP Session Initiation Protocol SIR Signal to Interference Ratio SISO Single Input Single Output SLA Service Level Agreement SLS Service Level Specification SNMP Simple Network Management Protocol SONET Synchronous Optical NETwork SPC Speech Centric scenario SRNC Serving Radio Network Controller SrNP Service Negotiation Protocol SS Scheduled Service SSBE Steady-State Balance Equation ST Subscriber Terminal STA STAtion TB Transport Block TBF Temporary Block Flow TBS Transport Block Size TCH-FS Traffic Channel – Full rate Speech TCP Transport Control Protocol TCS Traffic Conditioning Specification TCTS Transport Channel Type Switching TDM Time Division Multiplex TDMA Time Division Multiple Access TDMoIP TDM over IP TD-SCDMA Time Division-Synchronous Code Division Multiple Access TE Terminal Equipment TG Traffic Generator TISPAN Telecoms and Internet converged Service and Protocols for Advanced Networks TMSI Temporary Mobile Subscriber Identifier TNL Transport Network Layer ToS Type of Service TP_CS Transport Prioritized Cell Selection TPC Transmit Power Control TRM Transport Resource Manager TS Traffic Switch TSL Time SLot TSPEC Traffic Specification TTG Transmit/receive Transition Gap TTI Transmission Time Interval TTT Time To Trigger TU Transport Utility TVD Time Volume Dependent Tx Transmitter TXOP Transmission Opportunity U2G UTRAN to GERAN UBR Unspecified Bit Rate UDP User Datagram Protocol UE User Equipment UL Uplink UMA Unlicensed Mobile Access UMTS Universal Mobile Telecommunication System UUT User Under Test UPE User Plane Entity UTG User Traffic Generation UTRAN UMTS Terrestrial Radio Access Network VBR Variable Bit Rate VCC Voice Continuation to CS VET Variable Electrical Tilt

Final Report Page 111
VHO Vertical HandOver VoHSDPA Voice over HSDPA VoIP Voice over IP WAN Wide Area Network WCDMA Wideband Code Division Multiple Access WFQ Weighted Fair Queuing WiMAX Worldwide Interoperability for Microwave Access WLAN Wireless Local Area Network WMAN Wireless Metropolitan Area Network WP Work Package WPA Wireless Protected Access WRR Weighted Round Robin WQB Wireless QoS Brok WWW World Wide Web