draft - university of central...
TRANSCRIPT
DRAFT
Design and Operational Issues Related to the Co-Disposal of Sludges and Biosolids in Class I Landfills
by
Debra R. Reinhart, Manoj B. Chopra, Aparna Sreedharan, and Binoy Koodhathinkal Civil and Environmental Engineering Department
University of Central Florida Orlando, Florida
Timothy G. Townsend Department of Environmental Engineering and Science
University of Florida Gainesville, Florida
July 2003

ii
TABLE OF CONTENTS
Table of Contents............................................................................................................................ ii LIST OF TABLES ..........................................................................................................................iv LIST OF FIGURES .........................................................................................................................v Abstract ........................................................................................................................................ viii Chapter 1 ......................................................................................................................................... 1 Introduction..................................................................................................................................... 1 Chapter 2 ......................................................................................................................................... 3 Literature Review............................................................................................................................ 3
2.1 Biosolids Definition.............................................................................................................. 3 2.2 Regulations affecting the Beneficial Use of Biosolids ......................................................... 3 2.3 Biosolids from Wastewater Treatment ................................................................................. 4 2.4 Trends and Projections for Biosolids Generation, Use and Disposal ................................... 5 2.5 Biosolids Treatment .............................................................................................................. 5
2.5.1 Stabilization Processes ................................................................................................... 6 2.6 Methods of Biosolids Disposal ............................................................................................. 7
2.6.1 Incineration .................................................................................................................... 7 2.6.2 Composting .................................................................................................................... 9 2.6.3 Land Application.......................................................................................................... 10 2.6.4 Surface and Landfill Disposal...................................................................................... 12
2.7 Background on Drinking Water Sludge .............................................................................. 16 2.8 Geotechnical Stability......................................................................................................... 18
2.8.1 Factors Affecting Slope Stability. ................................................................................ 18 2.8.2 Geotechnical Properties of MSW and Sludges ............................................................ 20 2.8.3 Slope Stability Analysis ............................................................................................... 21 2.8.4 Ideal Method for Analysis ........................................................................................... 23 2.8.5 Physical Aspects of Landfilling ................................................................................... 25 2.8.6 Summary of Geotechnical Literature ........................................................................... 26
Chapter 3 ....................................................................................................................................... 27 Methodology ................................................................................................................................. 27
3.1 Introduction......................................................................................................................... 27 3.2 Surveys................................................................................................................................ 27 3.3 Statistical Analysis .............................................................................................................. 28
3.3.1 Data Collection and Associated Problems ................................................................... 28 3.3.2 Analysis........................................................................................................................ 29 3.3.3 Hypothesis Testing....................................................................................................... 29
3.4 Economic Analysis ............................................................................................................. 31 3.5 Geotechnical Stability......................................................................................................... 32
3.5.1 Preparation of Synthetic Waste.................................................................................... 32 3.5.2 Determination of Geotechnical Properties of MSW and Sludge Mixtures.................. 33 3.5.3 Slope Stability Analysis of Landfill Using SLOPE/W ................................................ 40
Chapter 4 ....................................................................................................................................... 50 Results and Discussion ................................................................................................................. 50
4.1 Introduction......................................................................................................................... 50 4.2 Survey Results............................................................................................................... 50

iii
4.2.1 Biosolids ..................................................................................................................... 50 4.2.2 Water Treatment Plant Sludge ..................................................................................... 54
4.3 Issues Associated with Landfilling of Biosolids................................................................. 54 4.3.1 Operational Issues........................................................................................................ 54 4.3.2 Greater Input of Moisture ............................................................................................ 56 4.3.3 Impact on Leachate Qua lity......................................................................................... 56 4.3.4 Impact on Gas Production............................................................................................ 61 4.3.5 Impact on Geotechnical Stability................................................................................. 62
4.4 Economic Analysis ............................................................................................................. 96 4.4.1 Air Space Issues........................................................................................................... 96 4.4.2 Alternative Comparison............................................................................................... 96 4.4.3 Gas Production............................................................................................................. 98
Chapter 5 ..................................................................................................................................... 101 Conclusions and Recommendations ........................................................................................... 101
5.1 Conclusions ....................................................................................................................... 101 5.2 Recommendations ............................................................................................................. 102
References ................................................................................................................................... 105
iv
LIST OF TABLES
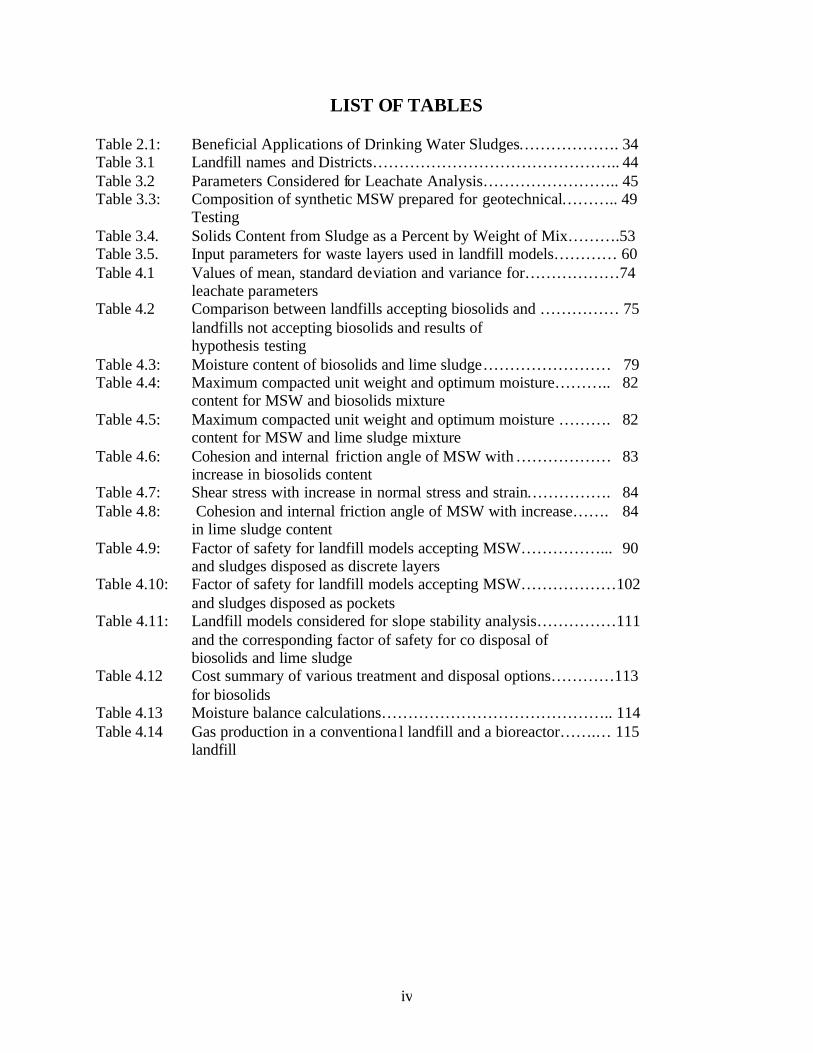
Table 2.1: Beneficial Applications of Drinking Water Sludges………………. 34 Table 3.1 Landfill names and Districts……………………………………….. 44 Table 3.2 Parameters Considered for Leachate Analysis…………………….. 45 Table 3.3: Composition of synthetic MSW prepared for geotechnical……….. 49
Testing Table 3.4. Solids Content from Sludge as a Percent by Weight of Mix……….53 Table 3.5. Input parameters for waste layers used in landfill models………… 60 Table 4.1 Values of mean, standard deviation and variance for………………74 leachate parameters Table 4.2 Comparison between landfills accepting biosolids and …………… 75 landfills not accepting biosolids and results of
hypothesis testing Table 4.3: Moisture content of biosolids and lime sludge…………………… 79 Table 4.4: Maximum compacted unit weight and optimum moisture……….. 82
content for MSW and biosolids mixture Table 4.5: Maximum compacted unit weight and optimum moisture ………. 82
content for MSW and lime sludge mixture Table 4.6: Cohesion and internal friction angle of MSW with ……………… 83
increase in biosolids content Table 4.7: Shear stress with increase in normal stress and strain……………. 84 Table 4.8: Cohesion and internal friction angle of MSW with increase……. 84
in lime sludge content Table 4.9: Factor of safety for landfill models accepting MSW……………... 90
and sludges disposed as discrete layers Table 4.10: Factor of safety for landfill models accepting MSW………………102 and sludges disposed as pockets Table 4.11: Landfill models considered for slope stability analysis……………111
and the corresponding factor of safety for co disposal of biosolids and lime sludge
Table 4.12 Cost summary of various treatment and disposal options…………113 for biosolids Table 4.13 Moisture balance calculations…………………………………….. 114 Table 4.14 Gas production in a conventiona l landfill and a bioreactor…….… 115
landfill

v
LIST OF FIGURES
Figure 2.1: Plot of factor of safety vs. lambda (λ)……………………………... 40 Figure 3.1: Artificially prepared shredded solid waste………………………… 50 Figure 3.2: Auto compaction machine used for modified compaction test……. 51 Figure 3.3: Sample for moisture content determination……………………….. 51 Figure 3.4: Plot of dry unit weight and moisture content……………………… 52 Figure 3.5: Large size direct shear mold………………………………………. 53 Figure 3.6: Shear mold assembly for direct shear test………………………… 54 Figure 3.7: Sample plot of shear stress against horizontal deformation………. 55 Figure 3.8: Sample plot of shear stress against normal stress for MSW……… 56 mixed with 15% by weight of biosolids Figure 3.9: Summation of forces acting on sample slice………………………. 57 Figure 3.10: Profile of typical landfill accepting MSW…………………………. 59 Figure 3.11: Plot showing increase in shear stress with increase in normal…….. 61 stress Figure 3.12: Typical landfill showing array of radii and grid for center of……... 62 failure plane Figure 3.13: Slope Stability Analysis for MSW Landfill Model (MSW………… 63 Failure Model: Shear-Normal Function) Figure 3.14: Slope Stability Analysis for MSW Landfill Model (MSW………… 64 Failure Model: Mohr-Coulomb Function) Figure 3.15: Landfill model with MSW only showing block failure……………. 65 Figure 4.1: Biosolids disposed in 2001 (in tons)……………………………….. 67 Figure 4.2: Biosolids disposal tipping fee in 2001………………………………. 67 Figure 4.3: Biosolids reception Frequency in 2001…………………………….. 68 Figure 4.4: Biosolids Handling Procedure………………………………………. 69 Figure 4.5. Compaction Curve for MSW with 15% BS……………………….. 79 Figure 4.6. Compaction Curve for MSW with 30% BS………………………. 80 Figure 4.7. Compaction Curve for MSW with 50% BS………………………. 80 Figure 4.8. Compaction Curve for MSW with 15% LS………………………. 81 Figure 4.9. Compaction Curve for MSW with 30% LS………………………. 81 Figure 4.10. Compaction Curve for MSW with 50% LS………………………. 82 Figure 4.11: Stability analysis of a landfill model accepting MSW only……….. 86
considering circular failure Figure 4.12: Stability analysis of a landfill model accepting MSW and ……….. 87 biosolids disposed as discrete layers considering circular failure Figure 4.13: Stability analysis of a landfill model accepting MSW and lime….. 88
sludge disposed as discrete layers considering circular failure Figure 4.14 Stability analysis of a landfill model accepting MSW and ………. 89
biosolids disposed as discrete layers considering circular failure with side slope 1:4
Figure 4.15: Stability analysis of a landfill model accepting MSW and……….. 91 Biosolids disposed as discrete layers after mixing with MSW at 15% by weight
Figure 4.16: Stability analysis of a landfill model accepting MSW and……….. 92

vi
lime sludge disposed as discrete layers after mixing with MSW at 15% by weight
Figure 4.17: Stability analysis of a landfill model accepting MSW and……….. 93 Biosolids disposed as discrete layers after mixing with MSW at 50% by weight Figure 4.18: Stability analysis of a landfill model accepting MSW and……….. 94 lime sludge disposed as discrete layers after mixing with MSW at 50% by weight Figure 4.19: Stability analysis of a landfill model accepting MSW and………… 96 biosolids disposed as pockets within the landfill Figure 4.20: Stability analysis of a landfill model accepting MSW and ……….. 97 lime sludge disposed as pockets within the landfill Figure 4.21: Stability analysis of a landfill model accepting MSW and ……….. 98
biosolids disposed as pockets of biosolids after mixing with MSW at 15% by weight
Figure 4.22: Stability analysis of a landfill model accepting MSW and………… 99 lime sludge disposed as pockets of biosolids after mixing with MSW at 15% by weight
Figure 4.23: Stability analysis of a landfill model accepting MSW and………… 100 biosolids disposed as pockets of biosolids after mixing with MSW at 50% by weight Figure 4.24: Stability analysis of a landfill model accepting MSW and………… 101 lime sludge disposed as pockets of biosolids after mixing with MSW at 50% by weight Figure 4.25: Stability analysis of a landfill model accepting MSW only……….. 103
considering block failure Figure 4.26: Stability analysis of a landfill model accepting MSW and ………... 104
biosolids disposed as a discrete layer considering block failure Accepting MSW (MSW Failure Model: Mohr-Coulomb Function)
Figure 4.27: Stability analysis of a landfill model accepting MSW and lime…… 105 sludge disposed as a discrete layer considering block failure
Figure 4.28: Stability analysis of a landfill model accepting MSW and………. 106 biosolids disposed as pockets within the landfill considering block failure
Figure 4.29: Stability analysis of a landfill model accepting MSW and lime…… 107 sludge disposed as pockets within the landfill considering block failure
Figure 4.31: Sensitivity Analysis of Unit Weight of MSW for Landfill…………. 108 Accepting MSW (MSW Failure Model: Shear-Normal Function)
Figure 4.32: Sensitivity Analysis of Unit Weight of MSW for Landfill…………. 108 Accepting MSW (MSW Failure Model: Mohr-Coulomb Function)
Figure 4.33: Sensitivity Analysis of Cohesion of MSW for Landfill ……………. 109 Accepting MSW (MSW Failure Model: Mohr-Coulomb Function)
Figure 4.30: Sensitivity Analysis of Friction Angle of MSW for Landfill……….. 109 Figure 4.30: Gas production in conventional landfill and a bioreactor…………… 116

vii
LIST OF ABBREVIATIONS, ACRONYMNS, AND UNITS OF MEASUREMENT
ASTM American Standards of Testing and Measurement BFP Belt Filter Press CAA Clean Air Act CERCLA Comprehensive Environmental Response, Compensation and Liability Act CS2 carbon disulfide CWA Clean Water Act DMDS dimethyl disulfide DMS dimethyl sulfide EPA US Environmental Protection Agency FAC Florida Administrative Code FDEP Florida Department of Environmental Protection FOC Factor of Safety GLE Generalized Limit Equilibrium kN/cm kiloNewtons per cubic meter kPa kilopascal MSW Municipal Solid Waste NPDES National Pollutant Discharge Elimination System NPL National Priority Level OMC Optimum Moisture Content pcf pounds per cubic foot POTW Publicly Owned Treatment Works psi pounds per square inch RCRA Resource Conservation and Recovery Act SCTL Soil Cleanup Target Levels SD Standard Deviation SSG Soil Screening Guide SSL Soil Screening Level TMA trimethyl amine WMI Waste Management Institute WTPS Water Treatment Plant Sludge WWTP Wastewater Treatment Plant

viii
ABSTRACT
Biosolids are nutrient-rich organic matter produced during processing of treatment of wastewater at a treatment facility. It is estimated that approximately 8.2 million tons of biosolids will be produced in the United States by the year 2010. Because of their volume and potential contamination by pathogens and heavy metals, biosolids disposal presents a major challenge to facility owners and operators. Current disposal practices include land application, landfilling, surface disposal, incineration, and composting.
For several years, land application has been the preferred method of biosolids disposal.
The nutrient-rich nature of biosolids makes them an excellent soil amendment and consequently, their use in agriculture as fertilizers has been wide spread. However, in recent years, an increasing awareness of the disease-causing potential of biosolids has given rise to misgivings about this method of disposal. Occurrences of ailments such as ear, eye, nose, throat and lung infections; gastrointestinal problems; skin rashes; nausea; asthma; dizziness; coughing; and in some cases, even death have been attributed to exposure to land-applied biosolids. The fact that the availability of large tracts of land for land applying biosolids is rapidly decreasing has only compounded the concern over land application.
Given these conditions, it seems likely that more and more biosolids will be landfilled.
Landfilling biosolids promotes the use of the landfill as a bioreactor. It helps to accelerate waste stabilization and initiate gas production in greater quantities much earlier in the life of the landfill. The stabilized waste can be recovered and used as compost. Biosolids generate high temperatures in the cores of the landfills which may result in biosolids disinfection.
This report compares landfilling of biosolids to other disposal options, land application in
particular. It identifies issues that need to be addressed while considering landfilling as a disposal option such as impact on leachate quality, geotechnical stability, gas production, operations, air space, and the relative economics of various disposal options.
It was found at the conclusion of this research that co-disposal of biosolids with MSW in
a landfill does not significantly affect leachate quality and that gas production is greatly accelerated. Geotechnical experiments show that the addition of biosolids and lime sludge undermines the strength of the landfill. The effect of biosolids is more prominent than lime sludge in reducing the stability of the landfill. Mixing the sludges with MSW helps in increasing the slope stability of the fill as compare with direct land filling, although it is still very much governed by the placement of the mixture.
Also, landfilling biosolids offers competitive costs and in fact, is cheaper than some
alternative disposal options. Based on these factors, this thesis concludes that co-disposal of MSW and biosolids in a landfill is an economically and technically feasible option of biosolids disposal.

ix
EXECUTIVE SUMMARY
Introduction
Disposal of biosolids presents a great challenge to facility owners. There are a number of ways of disposing of biosolids. The most popular methods include land application and landfilling. For a significant period of time, a large portion of biosolids has been disposed by land application. The application of biosolids to land is regulated at the federal level under the Clean Water Act (40 CFR part 503) and at the Florida state level under Chapter 62-640, Florida Administrative Code (FAC). These regulations establish pollutant limits and treatment requirements for pathogen control. In recent times, there has been a growing uneasiness about the health impacts associated with land application of biosolids. Several incidents of serious ailments associated with land application of biosolids have raised concerns over this method of disposal. This change in the mindset of the general public as well as facility owners has been heightened by a substantial reduction in availability of land for biosolids disposal.
Due to these reasons, landfilling is being regarded with renewed interest as a method of
disposal. Landfilling of biosolids has several advantages. It generates additional revenue for the landfills. Biosolids provide a source of moisture for landfills facilitating their operation as bioreactors. As a result, the addition of biosolids to landfills speeds up the process of gas production. If facilities are capturing this gas for energy generation this enhanced production translates into significant economic benefits. These advantages make biosolids disposal in landfills an option worth exploring.
However, landfilling of biosolids has several challenges. Biosolids have been shown to
create operational difficulties. Mainly due their extremely wet nature, they create soft spots that are difficult to compact. Co-disposal of biosolids with MSW may also create odor situations which will have to be addressed. Also, the increased gas production might prove to be a disadvantage if gas is not captured and odors are promoted.
Biosolids may be contaminated with heavy metals and pathogenic micro-organisms.
Hence, their co-disposal with MSW could impact the quality of the leachate generated by the landfill. Co-disposal may also impact the geotechnical stability of the landfill. The addition of sludges and biosolids results in significant changes to the composition and characteristics of landfills. The evaluation of waste strength when co-disposed with sludges and biosolids is a major issue particularly with regards to the design of waste slopes. Understanding changes in shear strength of waste with the addition of sludges and biosolids is critical, yet there are very little data on the subject.
The specific objectives of this project, therefore, are as follows:
• To complete a statistical analysis of leachate from landfills that accept biosolids and landfills that do not in order to evaluate the impact of co-disposal,
• To prepare an economic analysis to study the financial feasibility of co-disposal, • To study the impact of co-disposal on gas generation, • To address co-disposal as a possible avenue for resource recovery,

x
• To generate data from geo-technical experiments in order to evaluate the impact of co-disposal on the stability of landfills,
• To suggest possible ways of alleviating the operational difficulties and odor problems arising from co-disposal of biosolids with waste,
• To evaluate the performance of slopes using standard slope stability analysis as applied to landfills that are being operated with aggressive sludge and biosolids intake,
• To evaluate the effect of placement of sludges in certain profiles and mixing of sludges with MSW in various percentages by weight on slope stability.
Methodology
To analyze the impact of residuals disposal impacts on landfills, leachate quality data for the statistical analysis were obtained from the Florida Department of Environmental Protection (FDEP). The data were analyzed using Microsoft Excel. Data for a select number of Florida landfills were obtained from FDEP offices. It was found, however, that the data were quite bulky in nature and the process of having the selecting reports copied and then mailed to the University of Central Florida, where they were to be analyzed, would have proved to be laborious, time consuming and expensive. To overcome this difficulty, it was decided to focus on the landfills in the Central and Northeast FDEP Districts where it was possible for students to personally visit FDEP offices and collect the required data. Twenty-six parameters were analyzed for mean, standard deviation, variance, and null hypothesis.
An economic analysis was performed to compare the costs of landfilling biosolids with
those of land applying them. Treatment options that were known to be least cost alternatives were selected for the economic analysis. The more expensive treatment and disposal options such as incineration were not included in this analysis.
The following scenarios were considered while performing the economic analysis:
• Class A Biosolids treatment and disposal alternative: Aerated Static Pile Composting and Compost spreading/disposal.
• Class B Biosolids treatment and disposal alternative: o Aerobic Digestion, thickening of digested biosolids to 6% dry solids and hauling to
land application sites for disposal. o Thickening waste biosolids to 3% dry solids, lime stabilization and hauling to land
application sites for disposal. o Lime stabilization of waste biosolids at 1.5% dry solids and hauling to land
application sites for disposal. • Dewatering biosolids to 16% dry solids and hauling to landfills for disposal.
The geotechnical properties required for slope stability analysis are the unit weight,
internal friction angle, and the cohesion for MSW with various mixes of sludges. These properties could be found by performing direct shear tests on a synthetic municipal solid waste (MSW). Modified Compaction tests were conducted on the waste in accordance with ASTM testing method (ASTM D-1557), with some modifications, to arrive at optimum moisture content

xi
(OMC) and a maximum unit weight simulating real landfill conditions. The modified compaction test applies large compaction energy with the help of an auto-compaction machine.
Direct shear tests were conducted on the artificially prepared solid waste which was
shredded down to around 1 inch. The standard direct shear mold used in soil testing was found to be too small to test the MSW. Hence a large size direct shear mold was designed and built.
Slope stability analysis was conducted on landfill models using the computer software
program SLOPE/W developed by GEO-SLOPE International Ltd. This software is designed for soils but, from literature, similar stability analyses were found to be suitable for modeling idealized landfills slopes as well if the waste is assumed to act like a cohesive soil. SLOPE/W uses the theory of limit equilibrium of forces and moments to compute the factor of safety against failure. The GLE theory is used as the context for relating the factors of safety for all commonly used methods of slices. A factor of safety is defined as that factor by which the shear strength of the soil must be reduced in order to bring the mass of soil into a state of limiting equilibrium along a selected slip surface. The profile of the landfill is drawn considering a typical landfill in Florida with a side slope of 1:3.
The properties of the landfill waste and the sludges were determined by laboratory testing
and these properties were used for modeling of the landfill. First, the soil- type model was input for each waste type. Two types of soil models were considered to determine the strength of the waste. MSW was modeled using a shear/normal function as the depth of this layer was thick. In this model the shear strength of the soil changes with change in normal stress. As the depth of the layer increases, the normal force acting on the waste layer increases, due to the mass of waste above. Hence it was decided to use this model to account for the strength of the waste. All other waste layers were modeled as a Mohr-Coulomb soil model. Probabilistic analysis was used in all soil models.
Findings
The purpose of this research was to compare landfilling of residuals with other disposal
options. Various issues associated with landfilling of biosolids such as impact on leachate quality, impact on geotechnical stability, impact on gas production, operational issues, air space issues and the relative economics of various disposal options were addressed in the course of this research. Leachate data were obtained from the Florida Department of Environmental Protection and subjected to a statistical analysis to evaluate the impact of co-disposal on leachate quality. Also, an economic analysis was conducted to compare the costs of various disposal options. Based on the outcome of these analyses and literature review, the following conclusions can be made:
• Co-disposal of biosolids with MSW leads to operational issues such as difficulty in
compaction, formation of localized soft spots, and odors. These challenges can be rectified by adding compounds or dry MSW to biosolids which will reduce their moisture content and increase their solids content, in the process making them easier to handle and less odorous. However, if the purpose is to operate the landfill as a bioreactor, reducing the moisture content of the biosolids will eliminate the benefit of greater moisture input. In that case, the

xii
landfill operators would probably have to take extra care to mix the biosolids well with the MSW and cover the biosolids as quickly as possible.
• Co-disposal of biosolids with MSW was not found to have an adverse impact on leachate
quality. Because of the variability in the data, a statistical analysis was not very conclusive. However, a comparison of the average values of various parameters of landfills that accept biosolids with landfills that do not indicated that in most cases, there was no difference in leachate quality. This conclusion may be due to the fact that the percentage of biosolids is extremely small in comparison to the percentage of MSW thus making the effect of biosolids negligible. A literature review substantiates the fact that there is very little leaching of metals from biosolids in land application sites. If it is safe to land apply biosolids, it is probably safe to landfill them at reasonable rates. However, statistical analysis shows that landfills accepting biosolids have a higher concentration of mercury in their leachate. This observation might be attributed to the variability of the leachate data and the corresponding inaccuracies in the analysis. However, this is an issue that should be addressed further.
• Literature has shown that biosolids accelerate waste stabilization and consequently, gas
production. Studies have shown that MSW-only landfill cells lag in gas production behind co-disposal landfills by almost two years. This observation has positive implications if arrangements are made to capture and utilize the gas produced.
• Air space issues were investigated and it was found that the air space required by the MSW-
biosolids mixture is less than the air space required by MSW alone. This may be because the introduction of biosolids increases the compactibility and consequently, the density of the waste thus reducing the associated volume. Also, biosolids accelerate waste stabilization and hence facilitate volume reduction.
• Relatively little information is available regarding the disposal of water treatment residuals in
landfills. It appears that because they have increased geotechnical strength and reduced potential for odor, their co-disposal would have advantages over biosolids disposal.
• From the geotechnical investigation involving extensive laboratory testing of waste and slope
stability analysis, the following conclusions may be drawn:
• Laboratory testing showed that lime sludge has more inherent shear strength than biosolids.
• Landfills accepting lime sludge have a higher factor of safety than the ones accepting biosolids.
• The addition of biosolids and lime sludge reduces the strength of the landfill. • The effect of biosolids is more significant than lime sludge in reducing the stability of
the landfill. • The stability of the landfill is more adversely affected when the sludges are placed as
discrete layers as compared to placement as pockets. • Mixing the sludges with MSW helps in increasing the slope stability of the fill as
compared with direct landfilling, although it is still very much governed by the placement of the mixture.

xiii
• The economic analysis showed that landfilling offers competitive prices when contrasted
with alternate biosolids disposal options. Landfilling of biosolids is less expensive than treating biosolids to Class A standards and land applying and nearly equal in cost to aerobic digestion of biosolids at 6% solids and land applying and lime stabilization of biosolids at 1.5% dry solids. The economics will improve if landfill owners reduce the tipping fees for biosolids keeping in mind the fact that the savings due to the use of biosolids as a moisture source could offset the reduced tipping fee.
Based on the above conclusions, it seems that co-disposal of biosolids and MSW in a landfill is a feasible method of biosolids disposal.
One of the advantages of land application of biosolids is resource recovery. The reason
this method of disposal is so popular is that biosolids can be used as fertilizers and can convert large tracts of land to farmland. However, it is possible that land application poses health hazards due to the high pathogen content of biosolids, their heavy metals content and the presence of organic matter such as dioxins, furans and polychlorinated biphenyls which are possible carcinogens and endocrine disruptors. Landfills, on the other hand, provide a safe containment option for biosolids. Further, disposing biosolids in landfills enables its use as a bioreactor. Co-disposal accelerates gas production allowing improved efficiency and the economics of the use of gas. Also, landfills have great attenuation capacity for organic matter and heavy metals. Thus, the potential for soil and groundwater contamination from biosolids in landfills is reduced compared to land application. Also, in the long run, the waste is converted to compost in the landfills. This compost can be recovered and sold bringing economic benefit to the landfills along with the possibility of reuse of the site. In light of all these factors, co-disposal of biosolids is a beneficial option for landfill owners.
Compiling and analyzing data from the FDEP files was a laborious task. Values for such
parameters as BOD and COD needed for determining the landfill age were often missing. Also, only limited data points were available. These shortcomings could have affected the conclusions drawn from the results. It is recommended the FDEP mandate the monitoring of critical leachate parameters and the submission of monitoring reports in a standard electronic format. Data submitted in this format will be easier for researchers to access and compile. This research had to be confined to landfills in only two districts because of the difficulties in accessing data from other districts. This problem would be solved if the data were available in disks which could be easily transported or mailed to researchers.
Also, regular monitoring of critical parameters such as COD and BOD would greatly
enhance the accuracy of analyses and enable researchers to make more conclusive statements about the feasibility of co-disposal. These parameters are crucial in the determination of the age of the landfill and their absence has been the source of one possible inaccuracy in the analysis.
Operational challenges exist in the co-disposal of MSW and biosolids. It is
recommended that field experiments be conducted to closely monitor a co-disposal site. Leachate from this landfill could actually be tested in the laboratory and compared to leachate from non co-disposal sites to realistically evaluate the impact of co-disposal on leachate quality.

xiv
Similarly, field experiments could also be conducted to evaluate the impact of co-disposal on gas production and geotechnical stability.
It has been found that the concentration of mercury in leachate from landfills accepting
biosolids is statistically significantly greater than the concentration of mercury in leachate from landfills not accepting biosolids. This might be because of the large variations in data and the corresponding inaccuracies in the analysis. However, given the biotoxicity of mercury, this is an aspect of co-disposal that should be investigated with great care and in depth.
The following are the recommendations for geotechnical investigations in further studies:
1. Due to the limitations discussed previously for the size of mold for direct shear test, direct shear tests should be conducted in a larger mold with a sample size of around 1 m x 1 m x 1 m. This large sample size would ensure that the waste need not be shredded and waste from landfills may be used for testing to get accurate properties.
2. Results from laboratory testing for shear strength of waste should be compared with results from field testing like the field-based direct shear teat and the cone penetration test.
3. For stability analysis, it is recommended that landfills be modeled with variations in moisture content and with regions of saturated waste.

xv
KEY WORDS
Landfills, biosolids, residuals, sludge, slope, stability

1
CHAPTER 1 INTRODUCTION
Disposal of biosolids presents a great challenge to facility owners. There are a
number of ways of disposing of biosolids. The most popular methods include land application and landfilling. For a significant period of time, a large portion of biosolids has been disposed by land application. The application of biosolids to land is regulated at the federal level under the Clean Water Act (40 CFR part 503) and at the Florida state level under Chapter 62-640, Florida Administrative Code (FAC). These regulations establish pollutant limits and treatment requirements for pathogen control. In recent times, there has been a growing uneasiness about the health impacts associated with land application of biosolids. Several incidents of serious ailments associated with land application of biosolids have raised concerns over this method of disposal. This change in the mindset of the general public as well as facility owners has been heightened by a substantial reduction in availability of land for biosolids disposal.
Due to these reasons, landfilling is being regarded with renewed interest as a
method of disposal. Landfilling of biosolids has several advantages. It generates additional revenue for the landfills. Biosolids provide a source of moisture for landfills facilitating their operation as bioreactors. As a result, the addition of biosolids to landfills speeds up the process of gas production. If facilities are capturing this gas for energy generation this enhanced production translates into significant economic benefits. These advantages make biosolids disposal in landfills an option worth exploring.
However, landfilling of biosolids has several challenges. Biosolids have been
shown to create operational difficulties. Mainly due their extremely wet nature, they create soft spots that are difficult to compact. Co-disposal of biosolids with MSW may also create odor situations which will have to be addressed. Also, the increased gas production might prove to be a disadvantage if gas is not captured and odors are promoted.
Biosolids may be contaminated with heavy metals and pathogenic micro-
organisms. Hence, the ir co-disposal with MSW could impact the quality of the leachate generated by the landfill. Co-disposal may also impact the geotechnical stability of the landfill. The addition of sludges and biosolids results in significant changes to the composition and characteristics of landfills. The evaluation of waste strength when co-disposed with sludges and biosolids is a major issue particularly with regards to the design of waste slopes. Understanding changes in shear strength of waste with the addition of sludges and biosolids is critical, yet there are very little data on the subject.
The specific objectives of this project, therefore, are as follows:
• To complete a statistical analysis of leachate from landfills that accept biosolids and landfills that do not in order to evaluate the impact of co-disposal,
• To prepare an economic analysis to study the financial feasibility of co-disposal, • To study the impact of co-disposal on gas generation,

2
• To address co-disposal as a possible avenue for resource recovery, • To generate data from geo-technical experiments in order to evaluate the impact of
co-disposal on the stability of landfills, • To suggest possible ways of alleviating the operational difficulties and odor problems
arising from co-disposal of biosolids with waste, • To evaluate the performance of slopes using standard slope stability analysis as
applied to landfills that are being operated with aggressive sludge and biosolids intake,
• To evaluate the effect of placement of sludges in certain profiles and mixing of sludges with MSW in various percentages by weight on slope stability.

3
CHAPTER 2 LITERATURE REVIEW
2.1 Biosolids Definition
Biosolids are nutrient-rich organic matter produced during the processing of wastewater at a wastewater treatment plant (WWTP). In addition to significant amounts of carbon, hydrogen, oxygen, sulfur, and nitrogen, biosolids also contain phosphorus, potassium, and essential micronutrients such as zinc and iron. Because of their high content of phosphorus, nitrogen and other nutrients, biosolids make an excellent soil amendment and have been widely used as fertilizers.
2.2 Regulations affecting the Beneficial Use of Biosolids Biosolids must meet the requirements specified in the 40 CFR Part 503 Biosolids
Rule, “The Standards for the Use or Disposal of Sewage Sludge” before they can be beneficially used (EPA, 1999). The Part 503 Biosolids Rule ensures that the pathogens and metals content of biosolids which are to be land applied are below the specified standards. Part 503 also requires that the biosolids be applied at a rate that provides just the amount of nitrogen required for the crop and vegetation to grow, known as the agronomic rate. It also requires that the amount of nitrogen passing below the root zone of the crop to the underlying soil be minimized. Another requirement of Part 503 is that vector (e.g., flies and rodents) attraction be reduced and ways, means, and monitoring requirements for vectors have been defined in the regulations.
More specifically, the Part 503 Biosolids Rule sets metals limits for land-applied
biosolids for nine metals. Four sets of limits are provided: the ceiling limits for land application, more stringent high-quality pollutant concentration limits, the cumulative loading limits, and the annual limits for bagged products not meeting the high quality pollutant concentration limits.
As long as the application rate of biosolids does not exceed the agronomic rates,
biosolids can be land applied without monitoring cumulative loading. Biosolids that meet the ceiling limits but not the pollutant concentration limits can only be applied until the amount of metals on the site have accumulated up to the cumulative limits (EPA, 1999). (For values of pollutant concentrations and ceiling concentrations for metals, please refer to Appendix A).
The Part 503 Biosolids Rule divides biosolids into “Class A” and “Class B”
biosolids based on pathogen levels. The rule mandates vector attraction reduction and provides specific alternatives for meeting this requirement. Whether biosolids are Class A or Class B can affect MSW facility operators in several ways. In Class A biosolids, treatment is carried out to an extent where pathogens (including pathogenic bacteria, enteric viruses and viable helminth ova) in the biosolids are below detectable levels. Once these goals are achieved, Class A biosolids can be land applied without any
4
pathogen-related restrictions at the site. Class A biosolids can be used as bagged biosolids marketed to the public. Thus, the biosolids that experience the least number of on-site restrictions are Class A biosolids which meet all pathogen and vector attraction requirements as well as the concentration limits for heavy metals.
Class B biosolids are treated to reduce their pathogen concentration so that it is
not detrimental to public health. Site restrictions apply to Class B biosolids, which minimize the potential for human and animal contact with the biosolids until environmental factors have reduced pathogens to very low levels. Class B biosolids cannot be bagged and marketed to the public for private use. Class B biosolids can be used in bulk at appropriate types of land application sites, such as agricultural lands, forests, and reclamation sites, if the biosolids meet the limits on metals, vector attraction reduction, and other management requirements of Part 503. Biosolids can be used as MSW landfill cover, as long as they meet regulatory requirements in 40 CFR Part 258 which governs MSW landfills (EPA, 1999).
2.3 Biosolids from Wastewater Treatment The wastewaters that are generated by domestic, commercial and industrial
sources are collected by sewers and brought for treatment to wastewater treatment plants. Most industrial sources provide some sort of pretreatment for their wastewaters in order to reduce the levels of such contaminants as metals and chlorinated hydrocarbons before discharging them into the municipal sewer system. Over the past 20 years, improvement in pretreatment technology and pollution prevention programs has considerably improved the quality of wastewaters that are discharged by these sources into the sewers (Walker, 1998).
At the treatment plant, wastewater is given primary, secondary and, in some
occasions, tertiary treatment prior to discharge into the environment. The nature and amount of biosolids is influenced by the quantity and quality of wastewater entering the treatment plant, the treatment given to the wastewater and also, and the treatment given to the biosolids. Generally, the greater the treatment given to the wastewater, the larger the quantity of biosolids produced. Also, since the volume of biosolids is much smaller than the volume of incoming wastewater, the contaminants in the wastewater tend to get concentrated in the biosolids. If an industrial pretreatment process uses chemical precipitation using such chemicals as ferric chloride, alum, lime or polymers, these chemicals can ultimately wind up in the biosolids (EPA, 1999).
Thus, the nature and the subsequent treatment of the biosolids is influenced by the
quality of the incoming wastewater. The marked improvements in biosolids quality resulting from pretreatment and pollution prevention programs, for example, can encourage POTWs to process their solids further. When biosolids achieve the low levels of pollutants that make the widest distribution of biosolids products possible, processes such as composting become more attractive.
5
2.4 Trends and Projections for Biosolids Generation, Use and Disposal The United States Environmental Protection Agency (USEPA) in 1998 estimated
that approximately 6,232,880 dry metric tons (tonnes) or 6,856,168 dry tons of biosolids are generated annually in the United States. The agency estimated that 7.1 million tons would be generated in 2000 and 8.2 million tons by 2010 (EPA, 1999).
Numerous factors have influenced biosolids generation and use over the years.
Innovations in the treatment of biosolids and wastewater as well as the growth in population have increased the volume and improved the quality of biosolids (Stehouwer and Wolf, 1998). Rules passed by the EPA in recent years have promoted the recycling of biosolids rather than their disposal. Additionally, a number of factors have contributed to increased biosolids use. Factors such as advertising and marketing of biosolids for public use, high costs for disposal of biosolids in some locations, bans on disposal of biosolids in landfills (such as in New Jersey), landfill capacity concerns, closures of landfills following implementation of landfill regulations, and continuing research into the safe beneficial use of biosolids have promoted the recycling of biosolids. On the other hand, some areas of the country still have large landfills and in these areas, the land application of biosolids has declined in favor of landfilling.
2.5 Biosolids Treatment As stated previously, before they can be disposed, biosolids have to meet certain
regulatory requirements as regards their pathogen content, vector attraction potential and heavy metal content in order to ensure that they are not detrimental to public or environmental health. Only high quality biosolids can be land applied or composted. Also, the water content of biosolids can affect many aspects of biosolids management such as the ease of handling and the transportation costs as well as the magnitude of treatment required. The nature of biosolids also influences the decision regarding treatment or disposal. Some biosolids treatment processes reduce the volume or mass of the biosolids (such as biosolids digestion processes), while others increase biosolids mass (for example, when lime is added to control pathogens). The two most common types of biosolids treatment processes are stabilization and dewatering. Stabilization refers to a number of processes that reduce pathogen levels, odor, and volatile solids content. Biosolids must be stabilized to some extent before they can be used or disposed. Typical methods of stabilization include alkali (lime) stabilization, anaerobic digestion (digestion of organics by microorganisms in the absence of oxygen), aerobic digestion (digestion of organics by microorganisms in the presence of oxygen), composting, and/or heat drying (EPA, 1999).
Dewatering removes excess water from biosolids and generally must be
performed before biosolids are composted, landfilled, dried (e.g., pelletized or heat dried), or incinerated in order to facilitate handling and to reduce the transportation costs. A number of dewatering processes can be used, including air drying, vacuum filters, plate-and-frame filters, centrifuges, and belt filter presses.
6
2.5.1 Stabilization Processes 2.5.1.1 Alkaline Stabilization
Lime stabilized biosolids have better characteristics than dewatered biosolids cake
without stabilization. Lime he lps reduce pathogens and odors, allow easy handling, and provide a source of lime to help neutralize acid soils. While lime is most commonly used, other alkaline materials, such as cement kiln dust, lime kiln dust, Portland cement, and fly ash, have also been used for biosolids stabilization. Historically, alkaline stabilization has been implemented using either quicklime (CaO) or hydrated lime (CA[OH]2), which is added to either liquid biosolids before dewatering or dewatered biosolids in a contained mechanical mixer. Traditional lime stabilization processes are capable of producing biosolids meeting the minimum pathogen and vector attraction reduction requirements found in the 40 CFR Part 503 rules governing land application of Class B biosolids. Enough lime is added to raise the pH of the biosolids/lime mixture to 12.0 or above for a period of 2 hours. The elevated pH helps to reduce biological action and odors (EPA, 1999).
In recent years, a number of advanced alkaline stabilization technologies have
emerged where other chemical additives have been used instead of lime. Many of the newer technologies use similar biosolids handling and mixing equipment as traditional lime stabilization, but have unique chemical formulas for additives and/or processing steps (EPA, 1999). Thus, many of these technologies are available only to publicly owned treatment works (POTWs) as patented treatment procedures. The most common modifications used in these newer technologies include the addition of other chemicals, a higher chemical dose, and/or supplemental drying, which increase solids content and granularity; reduce mobility of heavy metals; increase the agricultural lime value; achieve a higher degree of pathogen reduction, including the production of biosolids with pathogens below detectable levels; and/or achieve long-term stability of the product to allow for storage with minimum potential for odor production or regrowth of pathogens. Potential markets for advanced alkaline-stabilized biosolids products include agricultural, slope stabilization, structural fill, and MSW landfill cover. 2.5.1.2 Anaerobic Digestion
Anaerobic digestion involves biologically stabilizing biosolids in a closed tank to
reduce the organic content, mass, odor (and the potential to gene rate odor), and pathogen content of biosolids. In this process, microorganisms consume a part of the organic portion of the biosolids. Anaerobic bacteria need an oxygen-free environment for survival. The organisms proliferate in this system and convert organic solids to carbon dioxide, methane (which can be recovered and used for energy), and ammonia. Anaerobic digestion is one of the most widely used biosolids stabilization practices, especially in larger treatment works, partly because it produces methane which can be recovered and sold or used. Anaerobic digestion usually operates at about 35oC (95o F), but also can be operated at higher temperatures (greater than 55oC [131o F]) to further reduce solids and pathogen content of the stabilized biosolids (EPA, 1999).

7
2.5.1.3 Aerobic Digestion
Aerobic digestion involves biologically stabilizing biosolids in an open or closed
vessel or lagoon. This environment is conducive to the multiplication of aerobic bacteria that convert the organic solids content to carbon dioxide, water, and nitrogen. Pathogens and odors are reduced in the process. Aerobic digestion is commonly used by smaller POTWs and is often accomplished using lagoons containing aeration equipment. The high-temperature operation (i.e., higher than 55oC [131o F]) of aerobic digestion is becoming more popular because it creates a disinfecting environment and reduces pathogen levels while increasing the solids content (EPA, 1999).
2.6 Methods of Biosolids Disposal There are several options for the disposal or utilization of biosolids including
(Hall, 1989):
• Incineration • Composting, heat drying, and land application • Landfilling • Each of the above disposal options will be discussed in the sections below.
2.6.1 Incineration Incineration basically consists of burning biosolids at high temperatures in some
kind of a combustion device in order to eliminate the volatile organic materials. The final product of incineration is an ash that occupies about 20% of the initial biosolids volume. The incineration process destroys virtually all of the volatile solids and pathogens and most toxic organic chemicals. However, some compounds such as dioxins and products of incomplete combustion must be controlled. Incineration does not degrade metals and these are concentrated in the ash and the particulate portion of exhaust gases. Air pollution control devices, such as high-pressure scrubbers, are required to protect air quality. Nonhazardous biosolids incinerator ash can be disposed of in a MSW landfill as allowed by 40 CFR Part 258 Landfill Rule. The ash also can be used in aggregate (e.g., concrete) production, in ore processing, or for other purposes such as an athletic field amendment (EPA, 1999).
The types of incinerators most commonly used are multiple-hearth and fluidized
bed furnaces. Fluidized-bed furnaces, however, are known to have fewer problems with emissions than multiple-hearth units because of their more advanced technology resulting in more uniform combustion of biosolids. Common types of air pollution control devices include wet scrubbers, dry and wet electrostatic precipitators, fabric filters and afterburners. Some municipalities opt for biosolids incineration when land is scarce or unsuitable for land application (EPA, 1999).

8
2.6.1.1 Regulations Affecting the Incineration of Biosolids Several regulatory considerations apply to facilities that incinerate biosolids. The
40 CFR Part 503 Biosolids Rule includes pollutant limits for metals in air emissions, limits on total hydrocarbons or carbon monoxide in emissions, general requirements and management practices, frequency of monitoring requirements; and recordkeeping and reporting requirements. If biosolids incinerator ash is applied to land other than in a MSW landfill, regulations in 40 CFR Part 257 must be followed. Any incinerated waste that meets the definition of a hazardous waste must meet regulations in 40 CFR Parts 261-268 for hazardous wastes. Additionally, if biosolids and MSW are co–incinerated and MSW accounts for less than 30 percent of the mixture, the mixture is considered auxiliary fuel and must meet Part 503 requirements for incineration. If the percentage of MSW in a biosolids/MSW mixture is greater than 30 percent, then the mixture is not regulated as an auxiliary fuel under the Part 503 Biosolids Rule but rather is regulated as MSW under 40 CFR Parts 60 and 61. The equipment used in incinerators that co–incinerate biosolids with other wastes generally must be specially designed for this purpose (e.g., include flash dryers and separate burners) to handle the moisture content and odor potential of biosolids successfully. In the near future, incinerators also will be subjected to regulation under provisions of the Clear Air Act that are more stringent and are based on what is technically achievable. 2.6.1.2 Advantages of Incineration
When compared to other disposal options, the advantages of incineration of biosolids are as follows (Spellman et al., 1997):
• The volume and weight of biosolids are reduced. • Incineration is an immediate reaction and thus eliminates the need for long term
storage or long residence times. • Biosolids can be incinerated on-site eliminating the need for long distance
transportation. • Controlling air discharges and following the regulatory requirements can maintain air
quality. • The ash residue is usually sterile. • The area required for biosolids is smaller than that required for burial or land
application.
2.6.1.3 Disadvantages of Incineration
The disadvantages of incinerating biosolids are as follows (http://spokanecounty.org, 2001): • Air quality concerns and permits become an issue especially where emissions of
dioxins are concerned. • Operation of incinerators entails high energy costs.

9
• Since biosolids and MSW are different in nature, allowances will have to be made in the incineration equipment when co- incineration of biosolids and MSW is planned.
• Beneficial reuse of biosolids does not remain an option when they are incinerated.
2.6.2 Composting The process of composting decomposes organic matter by microorganisms in an
environment in which the size and the porosity of the pile is strictly controlled, thereby facilitating an increase in temperature (typically to about 55o to 60o C [131o to 140o F]) to destroy most pathogens. The moisture and oxygen levels of this process are also controlled to reduce or prevent odor formation. During the process, biosolids are degraded to a humic- like material with excellent soil conditioning properties at a pH range of 6.5 to 8. This material promotes the growth of healthy plants and decreases the mobility of metals. Composting involves mixing dewatered biosolids with a bulking agent such as wood chips, municipal yard trimmings, bark, rice hulls, straw, or previously composted material and allowing the biosolids mixture to decompose aerobically for a while. The biosolids mass is initially increased due to the addition of the bulking agent. The bulking agent is used to lower the moisture content of the biosolids mixture, increase porosity, and add a source of carbon.
Depending on the method used, biosolids compost can be ready in about three to
four weeks of active composting followed by about one month of less-active composting (curing) (EPA, 1999). 2.6.2.1 Advantages of Biosolids Composting
Biosolids composting offers the following advantages (EPA, 2002)
• This disposal option comes in useful when landfill space for solids disposal is scarce. • Composting is a more economical disposal option when landfill tipping fees increase. • Composting stresses beneficial reuse of biosolids. • The composted product is easier to store, handle and use. • Addition of composted biosolids to soil increases its phosphorus, potassium, nitrogen,
and organic carbon content.
2.6.2.2 Disadvantages of Biosolids Composting Biosolids composting has the following disadvantages (EPA, 2002):
• Odor production at the composting site may present a problem. • Composting might not destroy the primary pathogens in the biosolids. These may
continue to survive in the composted product. • Composting biosolids might cause the dispersion of secondary pathogens such as
Aspergillus fumigatus and other airborne allergens. • The product quality might not be consistent in metal content, stability and maturity. • The process of composting is labor–intensive.

10
2.6.3 Land Application
Land application involves the spreading of biosolids on the soil surface or incorporating or injecting biosolids into the soil. Land application has been practiced for decades and is one of the most common methods for using biosolids. Because of their nutrient-rich nature, biosolids serve as soil enrichment and can supplement or replace commercial fertilizers. Nutrients such as nitrogen and phosphorus, micronutrients including essential trace metals such as copper, zinc, molybdenum, boron, calcium, iron, magnesium, and manganese, and organic matter in the biosolids are beneficial for crop production, gardening, forestry, turf growth, landscaping, or growth of other vegetation. Biosolids generally have lower nutrient contents than commercial fertilizers. Biosolids typically contain 3.2 percent nitrogen, 2.3 percent phosphorus, and 0.3 percent potassium, while commercial fertilizers might contain 5 to 10 percent nitrogen, 10 percent phosphorus, and 5 to 10 percent potassium (Metcalf & Eddy, 1991). Nevertheless, biosolids are good soil conditioners and enable reduced usage of commercial fertilizers thus indirectly reducing the accumulation of high levels of nutrients in the environment. Furthermore, although biosolids contain metals, so do fertilizers, although data on metals in fertilizers are not comprehensive (EPA, 1999). States are only now starting to look at regulating metals levels in fertilizers, whereas metals in biosolids have been regulated for years. 2.6.3.1 Advantages of Land Application
A wide range of land-application practices has been investigated and used,
including application to urban parks and golf courses, cropland, rangeland, forests, and disturbed or marginally productive areas, such as strip mines and construction sites. Major land-application projects have been undertaken by Washington, D.C.; New York City, N.Y.; Philadelphia and Pittsburgh, Pa.; Richmond, Va.; Charlotte, N.C.; Chicago, Ill.; Omaha, Neb.; Madison and Milwaukee, Wis.; Minneapolis-St. Paul, Minn.; Denver, Colo.; Albuquerque, N.M.; Seattle, Wash.; Portland, Ore.; and Los Angeles and San Diego, Calif.; as well as thousands of smaller cities and towns(http://www.deq.state.ok.us/fact/SLUDGE-1.html).
Land application of biosolids has advantages associated with its low cost,
simplicity and maximum use of the value of the biosolids. It utilizes the physical, chemical and biological capabilities of the soil to absorb and decompose waste constituents in the biosolids. Land-applied biosolids can be an excellent substitute for commercial fertilizers and soil amendments, and can be cost effective for both the municipality applying the biosolids and the application site which accepts the biosolids.
Direct land application can be beneficially used in agriculture, forestry and land
reclamation. The biosolids can be applied in either a liquid form with low solids (i.e. < 3% solids by weight) or as a semisolid following dewatering. Because of the volume of the material, due to the high water content, it is often applied within relatively short distances of the generation point. Application of biosolids for beneficial use considers the crop requirement for nutrients as well as the accumulation of trace constituents.
11
2.6.3.2 Disadvantages of land application
A U.S National Research Council (NRC) panel has concluded that no documented
scientific evidence exists to show that 40 CFR503, the USEPA biosolids rule, has failed to protect public health (NRC, 2002). At the same time, however, NRC strongly recommends that EPA re-evaluate the science backing the rule, updating it to reflect advances in knowledge since the rule was finalized in 1993. EPA, which classifies land application as a low-risk, low priority activity, requested the report as a result of persistent and growing public concern over the safety of the practice. Related complaints involve such adverse health effects as coughing, skin rashes, gastrointestinal symptoms, asthma, nausea, dizzy spells and eye, nose, throat and lung irritation. Thomas Burke, chair of the NRC panel that compiled the report, commented that the panel was disappointed by the lack of organized studies that have been done to evaluate potential health implications. Most studies to date have involved wastewater treatment plant workers, which are the most exposed population and have turned up no causal links to adverse health effects. But this worker population has a slightly different makeup from the communities living near land application sites, which include children, the elderly, and people with suppressed immune systems.
The panel asserted that odors are a common complaint and greater consideration
should be given to whether odors from biosolids during land application could have adverse health effects. It was also found that the 1988-89 National Sewage Sludge Survey, which EPA relied on to identify hazardous chemicals for regulation and establish concentration limits, is out of date. Other chemicals not included in the survey, such as pharmaceuticals, personal care products and brominated flame retardants, have since been identified as potential concerns. Moreover, detection limits for a number of chemicals were significantly higher when the survey was conducted than what is now used as soil screening level at Superfund cleanup sites. So, even though contaminants were not detected back in 1988-89, they might still be present at levels representing significant risk.
Applications of sludge for landspreading may carry with them great risks of
irreversible effects of toxic substances and of secondary impacts on the environment and on human health (Pollution Technology Review No.58, 1979). It has been suggested that heavy land application of biosolids in Pennsylvania might have been the cause of the death of 17-year old Danny Pennock (Fackelmann, 2002). About 4 million tons of sludge from wastewater treatment plants gets dumped on farmland, golf courses, parks and old mining sites across the USA. Some public health experts say sludge has been tied to 39 outbreaks of illness in Pennsylvania, California, Florida, Virginia and 11 other states. They also suspect that sludge might be to blame for several deaths. Class B biosolids contain potentially harmful pathogens such as bacteria, viruses and even intestinal worms. Of particular concern is the fact that biosolids concentrate wastes collected from thousands of people, including those with infectious diseases (Fackelmann, 2002).

12
Evidence has been found that indicates that exposure to sludge might pose a health hazard. A recent study suggests that people living near sludge sites run a 25% risk of getting infected with Staphylococcus aureus (Lewis, 2002).
Adverse health effects are not the only issues causing a waning of interest in land
application. Availability of large tracts of land for land application is declining at an exponential rate. Land acquisition for landspreading may be costly for larger municipalities with limited access to land (Pollution Technology Review No.58, 1979). The Florida Department of Environmental Protection (FDEP) is presently conducting workshops all over Florida to seek public opinion on whether land applied biosolids should be upgraded to Class A standards, which will significantly increase treatment costs. These proceedings are still in their initial stages (Barker, 2003).
2.6.4 Surface and Landfill Disposal Most biosolids that are disposed of in or on land are landfilled with MSW.
Surface disposal is defined by the Part 503 Biosolids Rule as biosolids placed on an area of land where only biosolids are placed for final disposal. It does not include biosolids that are placed on land for either storage (generally less than 2 years) or treatment (e.g., lagoon treatment for pathogen reduction). It involves landfilling of biosolids in monofills (biosolids-only landfills), disposal in permanent piles or lagoons used for disposal (rather than treatment or temporary storage), and dedicated surface disposal practices. The difference between surface disposal and land application primarily involves the application rate. If the application rates of biosolids on land exceed the agronomic rate, the quantity of nitrogen applied exceeds the assimilative capacity of the crop which could lead to the migration of excess nitrogen through the soil and consequent contamination of groundwater. Whenever the application rate exceeds the agronomic rate, the disposal is considered to be surface disposal by the EPA and the site must comply with all of the management practices outlined for surface disposal in the Part 503 Biosolids Rule, including ground-water monitoring (EPA, 1999). If, however, the applier reduces the application rate or changes the cover crop from a low-nitrogen-demand crop to a high-nitrogen-demand crop, and the practice meets Part 503 requirements for land application, then the practice is considered land application.
At the time the National Sewage Sludge Survey was conducted, biosolids from
most POTWs practicing surface disposal were determined to be able to meet the Part 503 pollutant concentration criteria for land application, and, in many cases, the biosolids were being applied at rates that could be considered agronomic rates (U.S. EPA, 1993a). Therefore, the practice of spreading biosolids on land for disposal purposes was nearly eliminated by the Part 503 Biosolids Rule because: 1) the cost of meeting surface disposal management requirements (including ground-water monitoring) is usually much higher than that for meeting land application requirements, and 2) most operations could be easily adapted to meet the Part 503 definitions of land application. The vast majority of biosolids currently reported as either surface disposed or landfilled are likely to be disposed of in MSW landfills. The small amounts of biosolids reported as surface disposed or landfilled that are not disposed of in MSW landfills are likely primarily

13
disposed of in biosolids-only monofills (i.e., landfills dedicated to accepting only biosolids) (EPA, 1999). 2.6.4.1 Regulations Affecting Surface Disposal and Landfilling of Biosolids
The Part 503 Biosolids Rule regulates the surface disposal of biosolids other than
landfilling of biosolids with MSW in MSW landfills, which is required to meet the Part 258 Landfill Rule. All biosolids disposed in MSW landfills must pass the paint-filter liquids test (dewatering biosolids to about 20 percent solids or more will generally meet this goal). Furthermore, the biosolids cannot contain more than 50 parts per billion of polychlorinated biphenyls (40 CFR Part 761) and must not meet the definition of hazardous wastes under the Resource Conservation and Recovery Act (RCRA).
Biosolids used as MSW landfill cover should be dewatered to achieve soil- like
characteristics. The Part 258 Landfill Rule requires that the daily MSW landfill cover consist of six inches of earthen material and that the solid waste be covered at the end of each day or more frequently as needed to control disease vectors, fires, odors, blowing litter, and scavenging. Biosolids can be used as part of a final MSW landfill cover, which must meet the Part 258 Landfill Rule cover criteria for permeability, infiltration, and erosion control. For surface disposal in biosolids-only facilities, Part 503 requires that the site meet certain location restrictions similar to the site restrictions in the Part 258 Landfill Rule. Provisions for closure and post-closure care must be made, and a plan for leachate collection (if the unit is lined), methane monitoring, and public access restrictions must be developed. If the surface disposal unit is unlined, the biosolids must meet concentration limits on arsenic, chromium, and nickel. Also, the surface disposal unit must meet management requirements similar to those for MSW landfills. These management practices include requirements for runoff collection, leachate collection and disposal, vector control, methane monitoring, and ground-water monitoring or certification, and restrictions on public access, growing of crops, and grazing of animals (EPA, 1999). 2.6.4.2 Issues Related to Landfilling of Biosolids
Before considering landfilling as a potential biosolids disposal option, some
issues have to be addressed. These include moisture input, gas production, leachate quality, geo-technical stability, and odors. These issues will be addressed in the following sections. 2.6.4.2.1 Moisture input
Biosolids provide a source of moisture for landfills facilitating their use as
bioreactors. For most landfills, infiltration is not sufficient to meet moisture needs. To optimize waste degradation, each ton of waste placed in the landfill must receive 30 to 50 gallons of liquid. The waste will absorb some of this liquid, with significant quantities removed through the degradation process via evaporation and gas extraction. Liquids addition is itself a solid waste and leachate treatment process. Carried to the optimum

14
level, it greatly facilitates rapid waste stabilization by providing the moisture the microorganisms require. It helps the waste environment achieve the liquid conditioning needed while distributing nutrients and micro-organisms throughout the mass (SWANA, 2000).
Treatment residuals, grey water and animal feedlot wastes are necessary
ingredients for the successful operation of a bioreactor. The disposal methods currently used for these wastes are sometimes detrimental to public and environmental health besides being very expensive. The ability to reroute these liquids to Subtitle D controlled bioreactor landfills should be a welcome alternative to communities presently faced with this challenge. Developing this alternate disposal option for these liquids may provide an option for communities forced to accept land application of biosolids for want of a better disposal option (SWANA, 2000). 2.6.4.2.2 Impact of Co-disposal of Biosolids on Gas production and Leachate Quality
An experimental biosolids–MSW sanitary landfill program was set up in June
1982 to evaluate the impacts of biosolids co-disposal on air quality, surface water quality and ground water quality (Kinman et al., 1982). Disposal options explored included co-disposal of biosolids and MSW, MSW-only landfills and biosolids-only landfills. Various physical, chemical and biological parameters were measured to evaluate leacha te and gas quantity and quality.
It was found that biosolids concentrations of 10, 20 and 30% by weight caused
gas production to initiate faster than the MSW-only landfills. A burnable gas containing 50% methane was obtained in just one month as compared to 12 months needed for MSW only landfills. Biosolids co-disposed with the MSW were stabilized to a greater extent than those disposed in 100% biosolids landfills. Leachate from biosolids–MSW landfills was of better quality than the MSW-only or biosolids–only landfills. MSW-only cells produced a leachate containing a higher concentration of metals. A total volume reduction of 25% for the combined MSW and biosolids mass was attained in a ten-year period. Readily biodegradable fractions of MSW were nearly gone after ten years.
Laboratory-scale experiments (0.2-m3 reactors) have been used to investigate the
effects of co-disposal of domestic waste and biosolids on leachate quality and gas production at the Water Research Center in Buckinghamshire, UK (Blakey et al., 1989). It was found that co-disposal of domestic waste and biosolids significantly increased the rate of stabilization of the co-disposed wastes, accelerating the reduction of degradable organics leached from wastes, and improving the organic quality of wastes with time. In the laboratory-scale reactors receiving a dewatered biosolids at domestic waste to sludge ratio of 4.1:1 (wet weight), the COD in leachate was reduced by 50% in comparison to domestic waste alone. Where liquid digested biosolids were used at a domestic waste to sludge ratio of 9.7:1 (wet weight), a 7% reduction in COD was achieved when compared with domestic waste alone. These results were achieved at a simulated moderately low moisture infiltration of 300 mm/year. For higher infiltration rates, greater reductions in COD were found. Results from the laboratory-scale reactors show that co-disposal

15
significantly reduces the quantity and concentrations of metals leached (iron, manganese, zinc, nickel and lead), typically by about 50% as compared to domestic waste alone. Although reductions have been identified in the field-scale trials, further data are required to confirm the trends.
Co-disposal has been found to increase the leachate concentrations of ammoniacal
nitrogen and phosphorus. In laboratory trials, leachate ammoniacal nitrogen loads were increased between 10 and 40% and total phosphorus by between 4 and 60% under moderately low infiltration conditions (300 mm/year). For higher infiltration conditions (900 mm/year) leachate loads of ammoniacal nitrogen and total phosphorus were increased by about 70% and 200 % respectively.
During the early stages of both laboratory reactors and pilot scale trials, gas
quality in terms of methane content was much improved over domestic waste alone as a result of biosolids co-disposal. In terms of gas generation rates, laboratory co-disposal reactors yielded 0.28-0.45 m3/tonne volatile solids per day compared to 0.05 m3
methane/tonne volatile solids per day from domestic waste only controls. Total gas production in the co-disposal experiments ranged from 80 to 150 m3 methane/tonne volatile solids in comparison with 36 m3 methane/tonne volatile solids for the domestic waste only tests.
In summary, waste stabilization and hence gas generation has been shown to take
place over a much shorter time period when biosolids are co-disposed with domestic solids waste infiltration in the range 300 – 900 mm/year. In addition, co-disposal does not affect the rate of gas generation but improves the short-term total yield. 2.6.4.2.3 Bearing Capacity/ Suitability for Driving.
The bearing capacity of the disposal site receiving biosolids must be considered in relation to the suitability for driving on the surface of the site. Wolf and Neuschafer conducted research in 1981 to study the relationships between the shear strength, bearing capacity and the suspended solids content. They found an increase in the bearing power and shear strength especially when the biosolids had been conditioned with lime which resulted in an increase in the dry solids content.
Although the only requirement made of biosolids to be disposed involves the
solids content, it can be said that the material to be dumped must have substantial shear strength and bearing capacity. Further treatment of the biosolids after dewatering could greatly improve the dumping suitability of the biosolids (van der Berg et al., 1989). Geotechnical stability is further discussed in Section 2.8. 2.6.4.2.4 Odor
One of the characteristics of biosolids that makes them a formidable challenge to
manage is their odor. Biosolids have a distinctive odor depending on the type of treatment experienced. Some biosolids have only a slight musty, ammonia odor. Others

16
have a stronger odor that may be offensive to some people. Much of the odor is caused by compounds containing sulfur and ammonia nitrogen (EPA, 2001). The storage of biosolids cake provides an opportunity for the material to become septic, with consequent odors. Odors can accumulate during storage and high concentrations of odorous materials that have accumulated can be released during the transport and disposal of biosolids cake (Lamber et al., 2000). Chemical odorous emissions from biosolids were identified using gas chromatography–mass spectrometry and included dimethyl disulfide (DMDS), dimethyl sulfide (DMS), carbon disulfide (CS2), ammonia, trimethyl amine (TMA), and acetone. Odor emissions have been positively correlated to DMDS emissions (Rosenfield et al., 2000).
It has been shown that odor could be controlled when wood ash was incorporated
with biosolids (1:1 dry weight ratio) (Rosenfield et al., 2000). Ash additions reduced overall odor and emissions of DMDS, DMS and carbon disulfide when compared with the biosolids control, depending upon the ash carbon content and surface area. Incorporation of high carbon wood ash with biosolids eliminated DMDS odor. However, wood ash did not significantly reduce the ammonia odor. Some other chemical and biological treatment products to remediate odor in stored cake include oxidizing agents, bacteriological/ enzymatic preparations, biological suppressants, nutrients and odor neutralizers. These are discussed in more detail in Chapter 4.
2.7 Background on Drinking Water Sludge
Drinking water sludge or water treatment plant sludge (WTPS) is a byproduct of conventional drinking water treatment technology. Pre-sedimentation, coagulation, filter backwashing operations, lime softening, iron and manganese removal, and slow sand and diatomaceous earth filtration during water treatment all generate sludge (USEPA, 1996). Virtually, all surface water sources demonstrate perceptible turbidity, caused by suspended silt and colloidal particles. Due to their small particle size, colloids have a very small terminal settling velocity. Moreover, adsorption of humic substances onto natural particles makes them more stable in water columns Because of small size and adsorption of humic substances onto natural particles sedimentation alone is inefficient for their removal. Coagulation with alum [Al2(SO4)3.14.3H2O] or iron(III) salts (FeCl3 or FeSO4) destabilizes these colloidal particles and humic substances in water and triggers their removal. While alum and ferric salts are primarily used for turbidity and color removal, lime is used for hardness removal. Sludge produced in this manner is classified as alum, ferric or lime sludge, depending on the type of coagulant used.
It is estimated that on a global scale, 10,000 tons of drinking water sludges are
generated each day (Waite and Dharmappa, 1993). The sludge is typically managed by surface discharge, land application, disposal to sanitary sewer/WWTP and landfilling. At the federal level, EPA has not established any regulations that are specifically directed at WPTS. Applicable regulations are those associated with the Clean Water Act (CWA); Criteria for Classification of Solid Waste Disposal Facilities and Practices (40 CFR Part 257), the Resource Conservation and Recovery Act (RCRA) regulation; the

17
Comprehensive Environmental Response, Compensation and Liability Act (CERCLA); and the Clean Air Act (CAA). The CWA through the National Pollutant Discharge Elimination System (NPDES) limits direct discharges into a water course. The CWA also regulates WTPS discharge into municipal sewers or to a wastewater treatment plant (WWTP). The landfilling of WTPS is regulated by RCRA regulations (40 CFR Part 257 and 258). Neither 40 CFR Part 257 nor Part 258 require that WTPS be stabilized or have a certain percent solid concentration, however, 40 CFR Part 258 does require that the sludge pass a paint filter test prior to co-disposal with solid wastes in a landfill. Land application of WTPS is typically regulated at the state level.
The federal standards for the use or disposal of biosolids (40 CFR 503)
specifically exclude WTPS, however, these are often used as a guideline to assess environmental impact of its land application. Previous research has demonstrated that WTPS does not typically exceed limits placed on the land application of sewage sludge/biosolids (Schmitt & Hall, 1975; Cornwell et al., 1981; Elliot et al., 1990a; Copeland et al., 1994). Apart from 40 CFR 503 limits, soil screening guidance (SSG) promulgated by EPA for the cleanup of sites on the National Priority List (NPL) can also be used as a guideline for assessment of human health-risk associated with the land application of WTPS. The SSG includes generic Soil Screening Levels (SSLs) that serve as guidelines for the cleanup of various contaminants of concern. SSLs were developed to address health risks to humans resulting from exposure to contaminated soil through inhalation, ingestion, dermal contact and other site-specific pathways. These levels serve as cleanup guidance levels and are not specific regulations. There are two land use categories for SSLs, as well as one for the minimization of groundwater contamination. The land use categories are based on the planned use of remediated land, i.e., either residential or industrial. Some state governments have issued similar guidance for the cleanup of certain categories of contaminated sites. The Florida Department of Environmental Protection (FDEP) has calculated Soil Cleanup Target Levels (SCTLs) (Chapter 62-777, FAC) for future residential and industrial uses as well as for the prevention of groundwater and surface water pollution due to leaching of contaminants from contaminated areas.
Research has been conducted to investigate marketing and commercial
applications for water treatment sludge (Copeland et al., 1994; Cornwell et al., 2000). Table 2.1 presents final disposal methods and beneficial use options of sludge proposed by utilities. Sludge from lime softening at water treatment plants is also used in pollution control equipment. Lime sludge is commonly used in flue gas desulfurization at coal-fired power plants to reduce sulfur oxide emissions.

18
Table 2.1: Beneficial Applications of Drinking Water Sludges
Beneficial Applications of Drinking Water Sludges Land application Road base Hydrogen sulfide binding
Composting Forest application Landfill cover Turf farming Nutrient control Land reclamation Cement and brick manufacture
Top soil and potting soil production
Citrus grove application
2.8 Geotechnical Stability The physical properties of biosolids are important for landfilling. The problems
pertinent to biosolids disposal can be described in terms of soil mechanical stability and the bearing capacity of the landfill. The problems of biosolids disposal involve the physical properties of biosolids, the adhesive properties of biosolids on transport facilities and the effects of biosolids on the soil mechanical properties of the disposal site body (van den Berg et al., 1989).
2.8.1 Factors Affecting Slope Stability. According to Shafer et al. (2003) and Qian et al. (2002) the factors affecting slope
stability include geometry, shear strength of the materials, loading conditions, pore water pressure, settlement, and operations. 2.8.1.1 Geometry
The profile of the landfill has a profound effect on its slope stability. The side slopes, bottom grades, height of fill and surcharges act as the driving force in slope stability analysis. Berms at the toe of slopes contribute to the resisting forces. Qian et al. (2002) suggests that the slope and height of excavated slopes and landfill sub-base slopes are the three geometrical factors that affect slope stability. In one of the case studies they suggested a side slope of 1V: 4H for a waste landfill, although this slope was considered to be conservative by other researchers.
On the other hand, Shafer et al. (2003) suggests that bioreactor landfill facilities should be constructed to allow the landfill geometry to be the owner/operator's ally. In this regard, they suggest that the bottom liner grades, final waste grades and liner side slope grades should be maintained or designed as flat as practical. They suggest that the critical cross-sections for stability analyses are to be selected by superimposing the final or intermediate waste grades over the top of liner grades. Sections for analysis are to be selected where both the liner and waste grades are sloping downward at the steepest combination of grades. Consideration should also be given to the locations where the buttressing liner slope is the shallowest or toe berming is minimal.

19
2.8.1.2 Shear Strength of Materials
The shear strength of liner soils, interfaces between various geosynthetic materials and soil, and waste all affect the stability of landfills. Shear strength of foundation materials resist a bearing failures beneath waste fills. The internal shear strength of waste and the side slope soils also plays an important role in the slope stability of landfills. Once the critical interfaces within the liner leachate collection system are identified, a selection of a reasonable range of interface friction values can be made. Shafer et al. (2003) suggested that the assumed interface friction values at the base of the failure surface be varied over the range of anticipated shear strength parameters for the selected liner leachate collection system interface and the anticipated range of overburden pressures that will exist on the interface. They suggest laboratory testing of critical interfaces be performed using large box shear testing devices.
2.8.1.3 Loading Conditions
Shafer et al. (2003) suggested that the unit weight of waste and any applied external loads, such as stockpiling of soil on the waste fill are the factors which affect the loading conditions in a landfill. Vertical expansions and stockpiles on existing fills increase normal loads on existing waste, liner and base materials. Vertical expansion also induces consolidation of existing waste. Some post-closure activities may increase or even decrease normal loads on fill materials.
2.8.1.4 Pore Water Pressure
According to Shafer et al. (2003), increases in pore water pressure can have an adverse impact on the stability of landfills. Equally, decreases in pore water pressure can further stabilize a fill or slope. Co-disposal of biosolids and sludges, liquid waste, groundwater, surface water infiltration, and recirculation of liquid into the landfill mass can have a destabilizing affect if not properly controlled.
2.8.1.5 Settlement
Settlement of the landfill materials can stabilize or add to factors that de-stabilize a landfill mass. According to Shafer et al. (2003), localized settlement and low spots encourage surface water to infiltrate in the mass, thereby increasing pore water pressure and piezometric head in the waste mass. Biosolids and sludges have a high consolidation factor and if landfilled as zones with high concentration tend to cause local settlement or low spots.
2.8.1.6 Operations
Landfill operations have an impact on landfill stability. Shafer et al. (2003) state that it is advisable to mix the biosolids and sludges with MSW before land filling or place then in thin layers so that they can occupy the voids in the waste when compacted. Degree of saturation of the waste, the liquid injection system, air injection system, gas

20
extraction system, temperature of the waste, piezometric head in the fill and isolated pore water pressure should be monitored.
2.8.2 Geotechnical Properties of MSW and Sludges 2.8.2.1 Unit Weight of MSW
MSW unit weights noted in the literature have a wide range due to a number of factors such as moisture and compaction conditions at the time of waste placement, overburden pressures and source of waste. Landva and Clark (1990) reported unit weights ranging from about 40 to 75 pounds per cubic foot (pcf) in their study of municipal solid waste. Kavazanjian et al. (1995) reported unit weights ranging from 20 pcf up to 99 pcf. The lower values may be assumed to coincide with loose or poorly compacted waste. The upper values correlate with well consolidated waste within deep landfill units. For stability analyses at typical MSW landfills, the in-place total unit weight of waste typically ranged from 65 to about 70 pcf.
Shafer et al. (2003) reported a total unit weight of bioreactor waste to be about 80 pcf. The higher total unit weight is generally attributed to the higher moisture content and greater consolidation of bioreactor waste.
2.8.2.2 Shear Strength of Waste
A review of the literature indicated a wide range of strengths for MSW. Shear strengths and frictional characteristics have been developed from laboratory direct shear and multi-stage triaxial testing, back-calculation of field load test data, and from in-situ standard penetration and vane shear testing.
Singh and Murphy (1990) prepared a compilation of these data which noted waste
strength properties to have an angle of internal friction ranging from about 1 degree with cohesion as large as 2200 psf to an angle of internal friction as high as 36 degrees with zero cohesion. These values are in agreement with a similar study performed by Kavazanjian et al. (1995), in which the drained strength was estimated as the greatest of 500 psf cohesion and 0 degree internal friction angle or 0 psf cohesion and 33 degree internal friction angle. In direct shear testing of waste, significant consolidation of the waste during normal load application and drainage of pore water during shearing resulted in internal friction angles greater than typical waste strengths (i.e., 33 degrees).
According to Shafer et al. (2003), preliminary test results by Waste Management
Institute (WMI) in 2000 revealed an internal friction angle of 39 degrees for low normal stress and 44 degrees at high normal stress. Shaun et al. (2001) performed simple shear and direct shear tests using a large size shear box which was 450 mm long and 305 mm wide. The test was conducted on artificially prepared waste by mixing constituents typically found in domestic waste. Results showed a peak shear stress of 127.4 kPa (i.e. 18.48 psi) for a horizontal displacement of 93 mm (20.6% strain) and for a normal stress of 110 kPa (i.e. 15.95 psi).

21
Gabr and Valero (1995) conducted tests on shredded waste with a dry unit weight
of 7.4 to 7.5 kN/m3 and determined that the friction angle was 34 degree and cohesion of 16.8 kPa (i.e. 2.436 psi). They used a circular direct shear mold of 2.5 inches in diameter. These strength parameters were evaluated at 20% strain level. Eid et al (2000) suggests a friction angle of 35 degree and cohesion of 25 kPa (i.e. 3.62 psi).
2.8.2.3 Shear Strength of Sludges
Shear strength is the fundamental mechanical property that governs landfill stability design. Tests conducted by Wan et al. (1996) indicated that dewatered wastewater sludge behaves differently from soils and are comparable to peat and organic soils in certain aspects. The vane shear strength for the biosolids varied from 3.59 to 7.53 kN/m2 (i.e. 0.52 to 1.09 psi).
Bekker and Berg (1993) conducted triaxial tests to establish a relationship
between the dry matter content of various types of sewage sludge and the resistance to shear. Their research showed that the cohesion force of the sludge at a dry matter content of 38 % is about 10 kN/m2 (i.e. 1.45 psi).
2.8.3 Slope Stability Analysis According to Shafer et al. (2003), there are two approaches to slope stability
analysis, (a) the limit equilibrium method where strain considerations are of little consequence, and (b) the elastic method where strain and its relationship to stress are of great importance. Elastic models are very complicated and are generally too complex for practical use and hence are not used to conduct stability analysis. When using the limit equilibrium approach, the factor of safety (FOS) is an index of stability with respect to sudden failure. A slope on the verge of failure or at limit-equilibrium has a factor of safety of 1.0.
The reliability of the stability analysis is highly dependant on the accuracy of the
strength properties and the defined geometry. The type of analysis or stability calculation can also introduce variability in the results because of the inherent assumptions and approximations made in developing the analysis method. 2.8.3.1 Method of Slices
The method of slices can readily accommodate complex slope geometries, waste
conditions and external loads. The software package, Slope/W employed in this research also uses this method. The method of slices divides a slice of mass into n smaller slices. Each slice is affected by a general system of forces. According to the teaching guide for Slope/W (1999), increasing the number of slices from, for example, 6 to the default value 30 has a profound effect on the factor of safety. Increasing the number of slices beyond the default number of 30, however, has very little effect.

22
The guide for Slope/W (1999) describes several methods of analysis in determining the factor of safety. The Ordinary method of slices (OMS) assumes that the resultant of the side forces acting on a slice act parallel to the base of the slice. This method neglects all inter-slice forces and fails to satisfy force equilibrium for the slide mass as well as for individual slices. This method satisfies only the moment equilibrium. However, this is one of the simplest procedures based on the method of slices. The factor of safety for the nth slice (Fs) can be found using Equation 2.1:
∑
∑=
=
=
=
+∆= pn
nnn
pn
nnnn
s
W
WLcF
1
1
sin
)tancos(
α
φα (2.1)
where, Fs = factor of safety for the nth slice c = cohesion ∆Ln = (bn) / (cosαn) bn = width of nth slice Nr = normal component of reaction R Wn = weight of the slice αn = angle between Wn and Nr φ = internal friction angle
In Bishop's Simplified Method the effect of the inter-slice force is eliminated by
assuming that the vertical component of the inter-slice forces is zero. This method only satisfies moment equilibrium. The Bishop factor of safety is nonlinear, and therefore an iterative technique is required to solve the equation.
The factor of safety for the nth slice (Fs) can be found using equations 2.2 and 2.3:
∑
∑=
=
=
=
+
pn
nnn
pn
n nnn
W
mWcb
1
1 )(
sin
1)tan(
α
φα (2.2)
s
nnn F
mαφ
αα
sintancos)( += (2.3)
where,
bn = width of nth slice Wn = weight of the slice

23
αn = angle between Wn and Nr Janbu's simplified method assumes zero inter-slice shear forces and is similar to Bishop’s method, except it satisfies only horizontal force equilibrium. Spencer's method assumes that the inter-slice forces are parallel. Spencer’s method rigorously satisfies static equilibrium by assuming that the resultant inter-slice force has a constant, but unknown, inclination. This method considers both force and moment equilibrium. The factor of safety (Fs) can be found using equation 2.4:
= −
sd F
φφ
tantan 1 (2.4)
where, φd = slope angle Morgenstern and Price proposed a method that is similar to Spencer's method, except that the inclination of the inter-slice resultant force is assumed to vary according to a "portion" of an arbitrary function. This method allows you to specify different types of inter-slice force function. While Spencer considered overall moment equilibrium, Morgenstern and Price have considered only the moment equations of individual slices. Each method satisfies all conditions of equilibrium but Spencer's Method requires about half the computer time.
The generalized limit equilibrium (GLE) method embodies all other methods. This method calculates both moment and force factor of safety for all specified λ values. The GLE method is much like the Morgenstern-Price method, except that it can be used to compute the moment and factors of safety for a range of user defined λ values.
2.8.4 Ideal Method for Analysis According to Shafer et al. (2003) the preferred method of analysis should satisfy both moment and force equilibrium. Generally, Janbu or Spencer's method of analysis is recommended. This preference is the result of the satisfaction of overall moment and force equilibrium requirements by these methods. Janbu simplified method satisfies overall moment equilibrium and vertical and horizontal force equilibrium, but does not satisfy individual slice moment equilibrium. Spencer's method satisfies all states of equilibrium including individual slice moment equilibrium. SLOPE/W is formulated in terms of two factors of safety equations, one satisfying the force equilibriums and the other satisfying the moment equilibrium. These equations are used to compute the factor of safety based on slice moment and force equilibrium. Depending on the inter-slice force function adopted, the factor of safety for all the methods can be determined from these two equations.

24
One key difference between the various methods is the assumption regarding inter-slice normal and shear forces. The relationship between these inter-slice forces is represented by the parameter, λ. For example, a λ value of zero means there is no shear force between the slices. A λ value that is nonzero means there is shear between the slices.
Figure 2.1 present a plot of factor of safety versus λ. Two curves are shown in the figure, one represents the factor of safety with respect to moment equilibrium, and the other one represents the factor of safety with respect to force equilibrium. Bishop's Simplified method uses normal forces but not shear forces between the slices (λ = 0) and satisfies only the moment equilibrium.
Figure 2.1. Plot of factor of safety vs. lambda (λ) (Slope/W, 1999)
The Bishop factor of safety is on the left vertical axis of Figure 2.1. Janbu's simplified method also uses normal forces but no shear forces between the slices and satisfies only force equilibrium. The Janbu factor of safety is therefore also on the left vertical axis. The Morgenstern-Price and GLE methods use both normal and shear forces between the slices and satisfy both force and moment equilibrium; the resulting factor of safety is equal to the value at the intersection of the two factor of safety curves.
Qian et al. (2002) suggests a minimum factor of safety of 1.5 for stability analysis. Shafer et al. (2003) suggests factor of safety for failures based at a critical liner interface to range from 1.4 for assumed large deformation, residual interface and waste strengths to 1.5 for assumed peak interface and waste strengths. For failures within the waste or subgrade, a minimum acceptable final condition factor of safety is considered to be 1.5. For interim conditions, peak interface strengths are typically used. Acceptable factors of safety for interim conditions typically ranged from 1.2 to 1.3.
SLOPE/W can also perform probabilistic slope stability analyses for any of the limit equilibrium and finite element stress methods using the Monte Carlo technique. The critical slip surface is initially determined based on the mean value of the input parameters. Probabilistic analysis is then performed on the critical slip surface, taking into consideration the variability of the input parameters. The variability of the input
25
parameters is assumed to be normally distributed with user-specified mean values and standard deviations.
During each Monte Carlo trial, the input parameters are updated based on a
normalized random number. The factors of safety are then computed based on these updated input parameters. By assuming that the factors of safety are also normally distributed, SLOPE/W determines the mean and the standard deviations of the factors of safety. The probability distribution function is then obtained from the normal curve.
2.8.5 Physical Aspects of Landfilling The physical problems of dumping biosolids in landfill sites involve the physical
properties of sewage sludge, the adhesive properties of biosolids on transport facilities, and the effect of biosolids on the soil mechanical properties of the dumping site body. When biosolids are placed, a large quantity of water is brought in with the material. This water affects the soil mechanics and hydrological conditions of the landfill. By dumping biosolids with a dry matter content of 12 % together with domestic waste, the landfill weight is more than doubled.
Bekker and Berg (1993) suggest landfilling residuals with a minimum solid or dry
matter content of 35 %, by weight. Thus, the sludge will often have to be dewatered mechanically after conditioning with lime and iron chloride or with polymers. According to Bekker and Berg (1993), practical experience has shown that with a dry matter content of over 35 %, combined processing with domestic waste is indeed practicable and not very critical with regard to the sludge to waste ratio. Such dry matter content can easily be achieved for filter press sludge conditioned with lime and iron chloride and for thermally conditioned biosolids.
According to Bekker and Berg (1993), for biosolids conditioned with polymers
and dewatered with a sieve band press, the optimum weight ratio of biosolids and domestic waste is about 1:4. Blakley (1989) did some laboratory scale reactor tests and suggested a ratio of 1:4.1 for dewatered sludge and a ratio of 1:9.7 for liquid digested sludge for reduction in COD level. But Bekker and Berg (1993) suggested that with larger ratios, the sludge can no longer be properly processed within and among the domestic waste, and the bearing capacity for vehicles decreases. Compacting equipment will therefore skid and bog down, while the sludge will stick to the wheels leading to a continuous expansion of the dumping front.
Bekker and Berg (1993) suggests that in practice, dumping of residuals is done in
different ways; it may be applied layer by layer and mixed later, or it may be applied as a premixed package with the landfill. The results of the various disposal methods are mixed. They went on to further state that dumping methods do not have a significant influence on the mechanical properties of waste. Bekker and Berg (1993) suggest that the stability of a landfill decreases strongly if the sludge is present as continuous horizontal layers. Placing sludge packages perpendicular to the potential shearing line

26
improves the stability. Moreover, applying a covering layer may also increase the slope stability.
2.8.6 Summary of Geotechnical Literature From the literature reviewed in this chapter, it can be inferred that the strength of
MSW varies with the compaction attained and the moisture content of the waste. Hence for determining the strength of co-disposed MSW with sludges, a controlled test is to be performed on the waste where the moisture content can be changed so as to allow maximum compaction of the waste fill. This is known as moisture conditioning.
It is clear from literature that large size samples need to be analyzed to find the
strength of waste samples. Preparing synthetic waste in the laboratory by shredding constituents of domestic waste is a practical solution for controlled testing of co-disposal of MSW with sludges.
It can further be concluded that slope stability analysis must be carried out using a
method that satisfies both moment and force equilibrium. Slope/W software not only satisfies this requirement but also allows us to perform probabilistic slope stability analyses using the Monte Carlo technique. It also defines different layers of waste with different properties according to the amount of sludges co-disposed, if any, and also allows the assigning of pore pressure values to the waste. Hence it is concluded that Slope/W will attend to all stability analysis needs and is suitable for this research

27
CHAPTER 3 METHODOLOGY
3.1 Introduction This chapter describes the methodology employed in analyzing biosolids disposal
impacts on landfills. Leachate quality data for the statistical analysis were obtained from the Florida Department of Environmental Protection (FDEP). The data were analyzed using Microsoft Excel. In addition, this research includes an economic analysis of biosolids management alternatives.
This chapter also discusses the methodology followed for the preparation of
synthetic waste in the laboratory, the tests conducted and the testing procedure followed in determining the geotechnical properties of MSW alone and with various sludge mixes, and lastly the procedure followed for the slope stability analysis. Initially, MSW was prepared synthetically in the laboratory. After the waste was prepared, laboratory tests including the moisture content test, the modified compaction test, and the direct shear test, were conducted on the waste to determine the geotechnical properties of MSW and sludge mixtures. The geotechnical properties thus obtained were used in the modeling effort of a typical landfill for the slope stability analysis.
3.2 Surveys In 2002, the University of Central Florida and the University of Florida conducted a survey of landfill operators regarding the disposal of biosolids and drinking water sludge. The objectives of survey were to find the quantity of sludge/biosolids being disposed in landfills, sludge/biosolids handling procedures prior to disposal, problems/issues associated with sludge/biosolids disposal, and impact of sludge/biosolids disposal on landfill leachate and gas quality and production. The survey was sent to the Class I landfill facilities throughout the state of Florida who may have experience with disposing of residuals. A copy of survey is included in Appendix B. The survey was sent to a total of sixty-two facilities and forty-seven responses were received. Of the forty-seven facilities, which responded to survey, twenty-six accepted biosolids for disposal whereas only five facilities accepted drinking water sludge. The answers to the questions in the survey provided the following information:
• The quantity of municipal solid waste (MSW) accepted by the landfills, • Whether or not the facility accepted biosolids or drinking water sludges, • If the facility accepted biosolids or sludges, what quantity was disposed, • The tipping fees for MSW disposal, • The tipping fees for biosolids and sludges disposed, • The nature of the biosolids and sludges accepted by the facility (dry/wet/very wet), • The method in which the biosolids and sludges were treated by the facility before
disposal, • Any issues that arose because of co-disposal in the facility, and

28
• The operational difficulties experienced by the landfills operators while handling biosolids and sludges.
3.3 Statistical Analysis
3.3.1 Data Collection and Associated Problems
Data for a select number of Florida landfills were obtained from FDEP offices. It was found, however, that the data were quite bulky in nature and the process of having the selecting reports copied and then mailed to the University of Central Florida, where they were to be analyzed, would have proved to be laborious, time consuming and expensive. To overcome this difficulty, it was decided to focus on the landfills in the Central and Northeast FDEP Districts where it was possible for students to personally visit FDEP offices and collect the required data.
Table 3.1 details the landfills selected, the districts they belong to and whether or
not they accept biosolids.
Table 3.1 Landfill names and districts
Landfill name District Accepts biosolids? Orange County Central Yes Brevard Central Yes Indian River County Central Yes Baseline Central Yes Winfield Northeast Yes Tomoka Central No Southport Central No Aucilla Northeast No Suwannee Northeast No Putnam Northeast No Hamilton Northeast No New River Regional Northeast No
Once the landfills were selected, the process of data collection began. Table 3.2 provides parameters selected for study.
The data for these parameters were collected from the DEP files submitted by the
landfills. In some cases, it was found that leachate monitoring was conducted at more than one location in the landfill. In such cases, each of those locations was considered as a separate data collection point and analyzed accordingly. One limitation of this analysis is the fact that landfill age has not been considered. Unfortunately, of the twelve landfills selected for analysis, very few seemed to monitor COD and BOD parameters in their leachate monitoring program that would indicate age. Hence, it was not possible to calculate the age of the landfills analyzed and this factor was ignored while performing the analysis.

29
Table 3.2 Parameters considered for leachate analysis
DO Magnesium Hardness PH Nickel Conductivity Silver Total Dissolved Solids (TDS) Selenium BOD5 Mercury Nitrate Lead Sulfate Fluoride Chloride Chromium Chemical Oxygen Demand (COD) Cadmium Alkalinity Barium Zinc Arsenic Manganese Sodium Potassium Iron
3.3.2 Analysis
The following computations were performed for each parameter:
• Mean, • Standard Deviation, • Variance, and • Null Hypothesis
If the concentration of any constituent was listed as non–detected, it was replaced
with a zero for calculation. A list of groupings for which these descriptive statistical parameters were computed is as follows:
• Individual landfills, • Landfills accepting biosolids, and • Landfills not accepting biosolids
3.3.3 Hypothesis Testing Hypothesis testing is based upon the assumption that given a universe with certain
characteristics, chance fluctuations, and randomness within the universe might cause the statistical characteristics of a sample to vary from that of the universe. The hypothesis also assumes that the chance of the difference between a particular statistical characteristic of a sample and that of the universe is unlikely to be greater than a certain magnitude (Anderson et al., 1981). Thus, in reality, if the difference is indeed within the specified magnitude, the hypothesis is accepted since enough evidence does not exist to prove that the hypothesis is wrong. On the other hand, if the difference is indeed larger than the specified magnitude, then the hypothesis is rejected.

30
The t-distribution is used when the sample size is small (less than or equal to 30
data points). The t-distribution is actually a collection of similar probability distributions. The t distribution is a function of the number of degrees of freedom. That is, there is a unique t- distribution with one degree of freedom, with two degrees of freedom, with three degrees of freedom, and so on (Anderson et al., 1981). 3.3.3.1 Process of Hypothesis Testing
There were two populations under cons ideration: landfills that accepted biosolids
and landfills that did not. Hypothesis testing was used to evaluate whether or not the means of the various parameters in both populations were equal. The null hypothesis H0
was that the two sample means were equal.
H0: µ1 = µ2
Where,
µ1 and µ2 = Sample Means. H0 = Null Hypothesis
In order to verify this, the pooled variance of the two samples was calculated using Equation 3.1.
)1()1()1()1(
21
222
2112
−+−−+−
=NN
SNSNS (3.1)
where,
2S = pooled variance of the two populations 2
1S = variance of landfills accepting biosolids 2
2S = variance of landfills not accepting biosolids
1N = number of samples for each parameter in landfills accepting biosolids
2N = number of samples for each parameter in landfills not accepting biosolids
The degrees of freedom associated with this variance estimate are defined as follows: )1()1( 21 −+−= NNDF (3.2) The value of t statistic was calculated using Equation 3.3:

31
)11
(
)mod(
21
2
21
NNS
XXtcalc
−
−= (3.3)
where, calct = Calculated value of t statistic 1X = Average value of parameter for the first population 2X = Average value of parameter for the second population
The value of the t statistic thus obtained was then compared to the tabulated value of the t statistic unique to that particular degree of freedom. The confidence interval, alpha, for this analysis was assumed to be 0.05.
If the calculated value of the t statistic was found to be greater than the tabulated
value of the t statistic, the null hypothesis was rejected and it was assumed that the means were not equal. If the calculated value of the t statistic was less than the tabulated value of the t statistic, then the null hypothesis could not be rejected therefore there was insufficient evidence to conclude that the means were different.
3.4 Economic Analysis An economic analysis was performed to compare the costs of landfilling biosolids
with those of land applying them. Options that were known to be least cost alternatives were selected for the economic analysis. The more expensive treatment and disposal options such as incineration were not included in this analysis.
The following scenarios were considered while performing the economic analysis:
• Class A Biosolids treatment and disposal alternative: Aerated Static Pile Composting and Compost spreading/disposal.
• Class B Biosolids treatment and disposal alternative: o Aerobic Digestion, thickening of digested biosolids to 6% dry solids and
hauling to land application sites for disposal. o Thickening waste biosolids to 3% dry solids, lime stabilization and hauling to
land application sites for disposal. o Lime stabilization of waste biosolids at 1.5% dry solids and hauling to land
application sites for disposal. • Dewatering biosolids to 16% dry solids and hauling to landfills for disposal.
The land application costs were compared to the tipping fees at landfills. The tipping
fees were obtained from the surveys sent out to the landfills in the initial part of the research. Costs for treatment and disposal of biosolids through land application were provided by Yeats (2003). The following assumptions were made during the economic analysis:

32
• The costs were calculated on a 30-year present worth basis with a discount rate of 8%,
• The wastewater treatment plant had a daily average flow size of 1 MGD, • The distance from the plant to the point of disposal and back was 40 miles, • 0.85 tons dry solids were produced per MGD of wastewater treated which is reduced
to 0.65 dry tons per MGD after aerobic digestion, • The plant dewatering facilities included a belt filter press (BFP) operation with BFP
feed pumps, polymer mixing and feeding system, cake (dewatered biosolids) handling system (conveyors or screw augurs), BFP spray wash water supply and booster pumping system, BFP (one or more at one meter effective width) and filtrate pumping system, and
• Aerobic digestion requires 40-day sludge retention time minimum, or the capability of meeting 2,000,000 fecal coliforms per gram dry solids pathogen reduction criteria; lime stabilization requires 24 hours at required pH levels; Class A composting requires time and temperature combinations.
3.5 Geotechnical Stability
3.5.1 Preparation of Synthetic Waste Geotechnical properties of MSW with different proportion of sludges and
biosolids were prepared for analysis. However, MSW typically has a large particle size and hence it was not possible to determine geotechnical properties using conventional testing apparatus. Removing the large particles would change the MSW properties, which was not acceptable. It was decided to synthetically prepare shredded MSW in the laboratory.
The waste was prepared according to composition published in the 1999 Florida
Solid Waste Management Report (FDEP). Special waste stream such as C&D debris, wood, yard waste, and tires that are not presently placed in Florida Class I landfills were excluded from the synthetic waste. Table 3.3 show the composition of the waste prepared in the laboratory and Figure 3.1 shows a typical portion of the prepared waste.
A large size direct shear mold was designed and fabricated to accept a sample size of 5.51 x 5.51 x 4.33 inches. This was done as the original mold was too small to accept sufficient quantities of waste. All the constituents of the waste were shredded to a size of 1 inch or less. This was done to keep the particle size less than 1/6th the mold size so that the results were not affected by large particle size. According to the Florida Solid Waste Management Report, the waste had a moisture content of 11.7% but the synthetically prepared waste was kept dry in storage and moisture was added only when tests were conducted.
Biosolids were obtained from the East Orange County Utilities after it passed
through a belt filter press. The biosolids had a solids content of 12.2% which was found

33
by laboratory tests and was consistent with the requirements. The drinking water lime sludge used had a higher solids content of around 40.8%.
3.5.2 Determination of Geotechnical Properties of MSW and Sludge Mixtures The geotechnical properties required for slope stability analysis were the unit
weight, internal friction angle, and the cohesion for MSW with various mixes of sludges. These properties could be found by performing direct shear tests on MSW. A determination of the optimum moisture content of the waste was required for the direct shear test. Modified compaction tests were performed for this purpose.
Table 3.3. Composition of Synthetic MSW Prepared for Geotechnical Testing
Material Percent by weight
Office Paper 5.88 Food Waste 8.82 Textiles 3.92 Rubber 0.98 Wood Mulch 8.17 Dirt, Ash, etc. 2.61 Aluminum Cans 0.98 Newspaper 8.82 Steel Cans 1.80 Glass 4.90 Plastic Bottles 1.63 Non-Ferrous Metals 3.43 Ferrous Metals 13.07 Other Plastics 6.05 Other Paper 14.71 Corrugated Paper 14.22 Total 100

34
Figure 3.1. Artificially Prepared Shredded Solid Waste 3.5.2.1 Moisture and Compaction Testing
Modified Compaction tests were conducted on the waste in accordance with
ASTM testing method (ASTM D-1557), with some exceptions, to arrive at the optimum moisture content (OMC) and a maximum compacted unit weight to simulate actual landfill waste conditions. The modified compaction test is different from the standard compaction test, due to higher energy of compaction applied using a 10 lb. hammer. The compaction energy is applied with the help of an auto-compaction machine shown in Figure 3.2.
The machine consists of a circular mold, 4 inch in diameter with a volume 1/30
ft3. The mold sits on a base plate with an extension that can be attached to the top of the mold. The mold was weighed with the base plate, but without the extension. Once the mold was set up, the MSW was placed in the mold with required proportion of sludge in three equal layers. Each layer was compacted uniformly with the modified hammer 25 times, before the next layer of loose MSW was placed into the mold. After compaction of the three layers, the extension of the mold was carefully removed and the excess waste was trimmed using a straight edge.
The weight of the mold with the MSW and the base plate was determined. A
sample of the MSW was removed to determine the moisture content.

35
Figure 3.2. Auto-Compaction Machine Used for Modified Compaction Test
Moisture content was determined by placing a sample of size 8 in. x 3.5 in. x 2 in. of waste (shown in Figure 3.3) in an oven for 2 days at a constant temperature maintained at 60oC to avoid combustion of volatile material.
Figure 3.3. Sample for moisture content determination

36
The remaining MSW was taken out of the mold and remixed. More water was added to the MSW to raise its moisture content and the above procedure was repeated. With the increase in moisture content the dry unit weight of MSW increases until it reaches an optimum value. Beyond this optimum value, addition of moisture and application compaction energy does not result in an increase in the dry unit weight. The test is continued until at least two successive lower readings of dry unit weight are obtained.
Compaction data is plotted as a compaction curve showing the variation of dry
unit weight with moisture content. Figure 3.4 shows the compaction curves for MSW. From the compaction curve, the optimum moisture content and maximum compaction achieved are determined as 60% and 19 lb/ft3 respectively.
Compaction of MSW only
10.0
15.0
20.0
25.0
0.0 10.0 20.0 30.0 40.0 50.0 60.0 70.0 80.0 90.0
Moisture content(%)
Dry
un
it w
eig
ht (
lb/ft
3)
Figure 3.4. Plot of dry unit weight and moisture content for MSW
3.5.2.2 Sludge Mixes
Different mixes of MSW with biosolids and lime sludges were tested for their geotechnical properties. These include addition of 15%, 30% and 50% by weight of biosolids and lime sludges to MSW. Since the amount of moisture may vary from different sources for sludges, it is more important to specify and monitor the total solids content for the sludges. Table 3.4 presents the total solid content for the three cases, as a percentage of the total weight of the mix.

37
Table 3.4. Solids Content from Sludge as a Percent by Weight of Mix
MSW and Percent by Weight of Sludge Solids Content from Sludge (%)
MSW + 15% BS 1.24 MSW + 30% BS 2.46 MSW + 50% BS 4.15 MSW + 15% LS 4.07 MSW + 30% LS 7.94 MSW + 50% LS 13.04
3.5.2.3 Direct shear test
Direct shear tests were conducted on the artificially prepared solid waste which
was shredded down to around 1 inch. The standard direct shear mold used in soil testing was found to be too small to test the MSW. Hence a large size direct shear mold was designed and built as shown in Figure 3.5.
Figure 3.5. Large size direct shear mold
The large size direct shear mold could accept a sample size of 5.51 x 5.51 x 4.33 inches. This mold was designed to fit the existing testing apparatus which allowed for a maximum horizontal deflection of 0.75 inch which was the limit for our horizontal shear displacement. This horizontal deformation corresponds to a strain of 12.7%.

38
The assembly of the direct shear mold is shown in Figure 3.6. The resistance due to the frame was deducted from the final shear readings.
Figure 3.6: Shear mold assembly for direct shear test
During direct shear testing a low strain rate was estimated and drained conditions were assumed to prevail during the direct shear tests. Therefore, strength parameters estimated from these tests were assumed to be apparent effective shear strength parameters. The testing procedures followed the specifications outlined in ASTM Method (ASTM D-3080) for direct shear tests of soil under consolidated drained conditions. The horizontal deformation was noted from the horizontal dial gauge and the shear force applied was noted form the proving ring dial gauge.

39
y = -1.0074x2 + 5.2968x + 4.4691R2 = 0.9912
0.00
2.00
4.00
6.00
8.00
10.00
12.00
0.000 0.200 0.400 0.600 0.800 1.000 1.200 1.400 1.600
Horizontal Deformation (in)
She
ar S
tres
s (p
si)
Figure 3.7. Plot of Shear Stress with Horizontal Deformation for MSW From the collected data, the shear stress against horizontal deformation was
plotted as shown in Figure 3.7 for a normal stress of 10.73 psi. Since there is no well defined failure point, the waste was loaded to the limit of the mold which was 0.75 inches (12.7% strain). From a literature review, it was found that the strain at peak shear stress is around 26% (Shaun et al., 2001) and hence it was decided to extrapolate the results using a polynomial equation to attain failure strain and shear stress. The best fit line was drawn using a second order polynomial equation to extrapolate to 26% strain value or 1.43 inches of horizontal deformation. The shear stress corresponding to this strain value was noted from the graph to be about 10 psi.
Similar tests were conducted for three normal stresses of 3.74 psi and 7.24 psi and
a plot of shear stress against normal stress was plotted as shown in Figure 3.8 to get the cohesion and internal friction angle values for each test sample of MSW mixed with sludges in different percentages by weight.

40
Shear Stress Vs Normal Stress for MSW only c = 4.25 psi; phi = 28.10
y = 0.534x + 4.2522R2 = 1
0.0
5.0
10.0
15.0
0.0 5.0 10.0 15.0 20.0
Normal Stress (psi)
She
ar S
tres
s (p
si)
Figure 3.8. Plot of Shear Stress against Normal Stress for MSW
3.5.3 Slope Stability Analysis of Landfill Using SLOPE/W Slope stability analysis was conducted on landfill models using the computer
software program SLOPE/W developed by GEO-SLOPE International Ltd. This software was designed for soils. Similar soil-based slope stability analysis program have been found to be suitable for modeling idealized landfills slopes as the waste is assumed to act like a cohesive soil (Shafer et al., 2003).
3.5.3.1 Slope stability theory used in SLOPE/W
SLOPE/W uses the theory of limit equilibrium of forces and moments to compute
the factor of safety against failure. The GLE theory is used as the context for relating the factors of safety for all commonly used methods of slices. A factor of safety is defined as that factor by which the shear strength of the soil must be reduced in order to bring the mass of soil into a state of limiting equilibrium along a selected slip surface.
For an effective stress analysis, the shear strength is defined as:
s = c' + (σn - u) tan F ' (3.4) where,
s = shear strength (psi) c' = effective cohesion (psi)

41
F ' = effective angle of internal friction σn = total normal stress (psi) u = pore-water pressure (psi) The stability analysis involves passing a slip surface through the landfill mass and
dividing the inscribed portion into vertical slices. The slip surface may be circular, composite (i.e., combination of circular and linear portions) or consist of any shape defined by a series of straight lines (i.e., fully specified slip surface).
The limit equilibrium formulation assumes that:
1. The factor of safety of the cohesive component of strength and the frictional component of strength are equal for all soils involved.
2. The factor of safety is the same for all slices. Slice 16 - GLE Method
1.0595e+005
1.0147e+005
1.5767e+005
43832
1.8985e+005
53551
Figure 3.9. Summation of Forces Acting on Sample Slice
The GLE uses the following equations of Statics in solving for the factor of
safety:
1. The summation of forces in a vertical direction for each slice. The equation is solved for the normal force at the base of the slice.
2. The summation of forces in a horizontal direction for each slice is used to compute the interslice normal force. This equation is applied in an integration manner across the sliding mass (i.e., from left to right).
3. The summation of moments about a common point for all slices. The equation can be rearranged and solved for the moment equilibrium factor of safety.

42
4. The summation of forces in a horizontal direction for all slices, giving rise to a force equilibrium factor of safety.
The analysis is still indeterminate and a further assumption is made regarding the
direction of the resultant inter-slice forces. The direction is assumed to be described by an inter-slice force function. The factors of safety can now be computed based on moment equilibrium (Fm) and force equilibrium (Fu). These factors of safety may vary depending on the percentage of the force function used in the computation. The factor of safety satisfying both moment and force equilibrium is considered to be the converged factor of safety of the GLE method.
A factor of safety is really an index indicating the relative stability of a slope. It
does not imply the actual risk level of the slope due to the variability of input parameters. With probabilistic analysis, two useful indices are available to quantify the stability or the risk level of a slope. These two indices are known as the probability of failure and the reliability index.
The probability of failure is the probability of obtaining a factor of safety less than
1.0. It is computed by integrating the area under the probability density function for factors of safety less than 1.0. The reliability index describes the stability of a slope by the number of standard deviations separating the mean factor of safety from its defined failure value of 1.0. It can also be considered as a way of normalizing the factor of safety with respect to its uncertainty.
3.5.3.2 Defining the problem
Before starting to define the problem, the program is set for scale, page size, units,
grid etc. The profile of the landfill was then drawn, considering a typical landfill in Florida. The profile showed in Figure 3.10 below show a typical landfill accepting MSW only with a side slope of 1:3.
The properties of the landfill waste and the sludges were determined by laboratory
testing and these properties were used for modeling of the landfill. Firstly the soil model was input for each waste type. Two types of soil models were considered to determine the strength of the waste. MSW was modeled using a shear/normal function as the depth of this layer was thick. In this model the shear strength of the soil changes with change in normal stress. As the depth of the layer increases, the normal force acting on the waste layer increases, due to the mass of waste above. Hence it was decided to use this model to account for the strength of the waste. A shear normal function was defined as shown in Figure 3.11. All other waste layers were modeled as a Mohr-Coulomb soil model. Probabilistic analysis was used in all soil models.
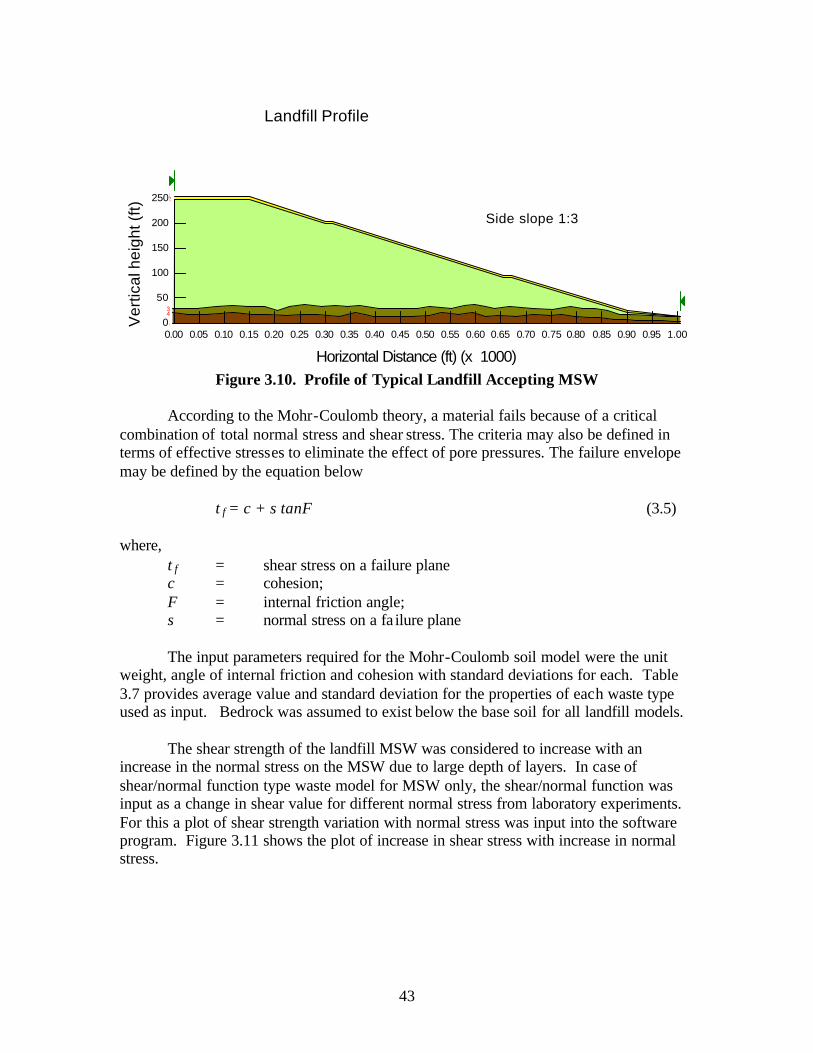
43
12
34
5
Landfill Profile
Side slope 1:3
Horizontal Distance (ft) (x 1000)
0.00 0.05 0.10 0.15 0.20 0.25 0.30 0.35 0.40 0.45 0.50 0.55 0.60 0.65 0.70 0.75 0.80 0.85 0.90 0.95 1.00
Ver
tical
hei
ght (
ft)
0
50
100
150
200
250
Figure 3.10. Profile of Typical Landfill Accepting MSW
According to the Mohr-Coulomb theory, a material fails because of a critical
combination of total normal stress and shear stress. The criteria may also be defined in terms of effective stresses to eliminate the effect of pore pressures. The failure envelope may be defined by the equation below
τf = c + s tanF (3.5)
where,
τf = shear stress on a failure plane c = cohesion; F = internal friction angle; s = normal stress on a fa ilure plane
The input parameters required for the Mohr-Coulomb soil model were the unit
weight, angle of internal friction and cohesion with standard deviations for each. Table 3.7 provides average value and standard deviation for the properties of each waste type used as input. Bedrock was assumed to exist below the base soil for all landfill models.
The shear strength of the landfill MSW was considered to increase with an
increase in the normal stress on the MSW due to large depth of layers. In case of shear/normal function type waste model for MSW only, the shear/normal function was input as a change in shear value for different normal stress from laboratory experiments. For this a plot of shear strength variation with normal stress was input into the software program. Figure 3.11 shows the plot of increase in shear stress with increase in normal stress.
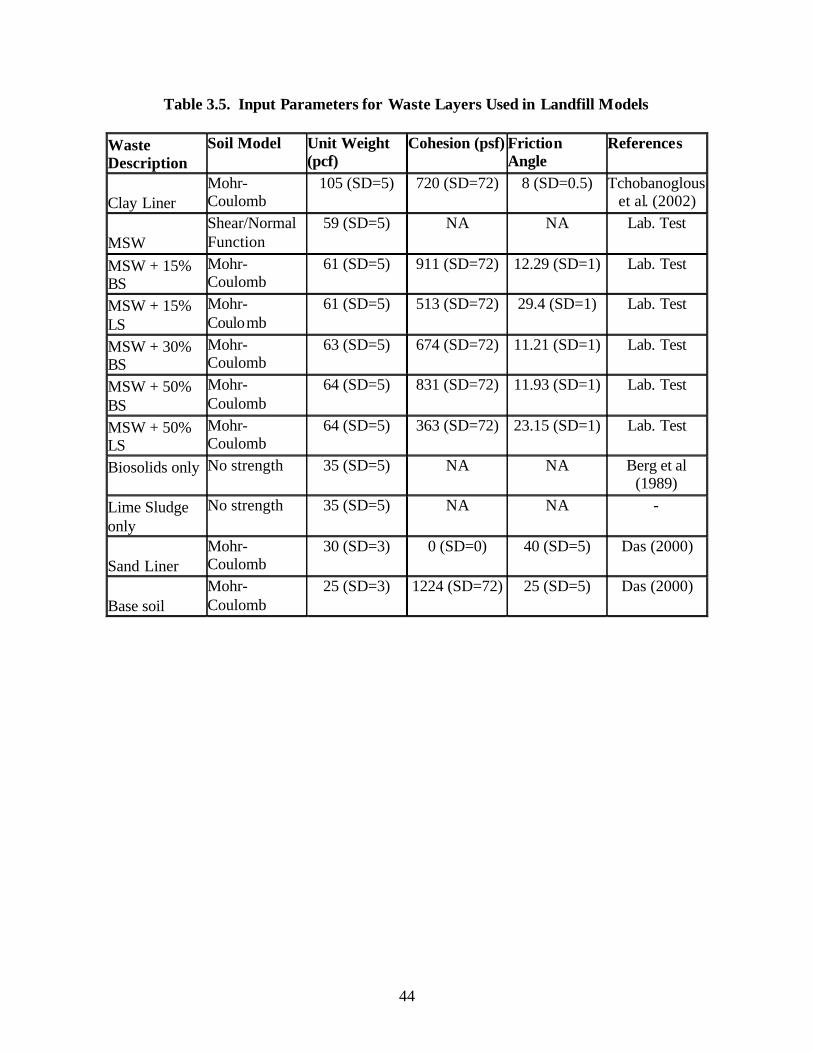
44
Table 3.5. Input Parameters for Waste Layers Used in Landfill Models
Waste Description
Soil Model Unit Weight (pcf)
Cohesion (psf) Friction Angle
References
Clay Liner Mohr-Coulomb
105 (SD=5) 720 (SD=72) 8 (SD=0.5) Tchobanoglous et al. (2002)
MSW Shear/Normal Function
59 (SD=5) NA NA Lab. Test
MSW + 15% BS
Mohr-Coulomb
61 (SD=5) 911 (SD=72) 12.29 (SD=1) Lab. Test
MSW + 15% LS
Mohr-Coulomb
61 (SD=5) 513 (SD=72) 29.4 (SD=1) Lab. Test
MSW + 30% BS
Mohr-Coulomb
63 (SD=5) 674 (SD=72) 11.21 (SD=1) Lab. Test
MSW + 50% BS
Mohr-Coulomb
64 (SD=5) 831 (SD=72) 11.93 (SD=1) Lab. Test
MSW + 50% LS
Mohr-Coulomb
64 (SD=5) 363 (SD=72) 23.15 (SD=1) Lab. Test
Biosolids only
No strength 35 (SD=5) NA NA Berg et al (1989)
Lime Sludge only
No strength 35 (SD=5) NA NA -
Sand Liner Mohr-Coulomb
30 (SD=3) 0 (SD=0) 40 (SD=5) Das (2000)
Base soil Mohr-Coulomb
25 (SD=3) 1224 (SD=72) 25 (SD=5) Das (2000)

45
Normal Stress (x 1000)
0.0 0.5 1.0 1.5 2.0 2.5
She
ar S
tress
(x
100
0)
0.0
0.5
1.0
1.5
2.0
Figure 3.11. Plot Showing Increase in Shear Stress with Increase in Normal Stress
After all waste layer types are defined; the program required the selection of the failure type for each landfill model. Two types of failure are considered for each landfill model, the circular failure model and the block failure model.
For landfills modeled for circular failure, the radius of failure plane and the center
of the circular failure plane are defined. The program allowed the radius to be defined as a grid of increasing radii and the center of the circular failure plane as a grid. The radius of the failure plane is specified such that it covered a large range of radii, while the grid for the center of the circular failure plane is chosen so that the minimum factor of safety lies within the grid. Figure 3.12 shows a typical selection of radii and grid for landfill.
Once the landfill model is defined, the slope stability analysis is carried out. The
results of the program are shown in Figures 3.13 and 3.14 include the failure plane and the minimum factor of safety for the chosen grid. MSW is modeled using a shear-normal function in Figure 3.13 and using a Mohr-Coulomb failure model in Figure 3.14. It is evident that there is no significant difference in the two results. The shear normal function allows for specifying an actual shear stress variation with normal stress and incorporates an important feature allowing the shear stress to increase as a function of depth. Therefore, in this research, the MSW is modeled using the shear-normal function.

46
12
34
5
Horizontal Distance (ft) (x 1000)0.00 0.05 0.10 0.15 0.20 0.25 0.30 0.35 0.40 0.45 0.50 0.55 0.60 0.65 0.70 0.75 0.80 0.85 0.90 0.95 1.00
Ver
tical
hei
ght (
ft)
0
50
100
150
200
250
Figure 3.12. Typical Landfill Showing Array of Radii and Grid for Center of Failure Plane

47
2.700
2.7
00
2.7
00
2.800
2.8
00
2.8
00
2.900
2.9
00
2.9
00
3.0
00
2.667Description: MSW onlySoil Model: Shear/Normal Fn.Unit Weight: 59 (SD=5)
Factor of Safety: 2.667
Reliability Index: 34.571Standard Dev.: 0.048
Landfill accepting MSW only with change in shear with normal stress
Side slope 1:3
Horizontal Distance (ft) (x 1000)
0.00 0.05 0.10 0.15 0.20 0.25 0.30 0.35 0.40 0.45 0.50 0.55 0.60 0.65 0.70 0.75 0.80 0.85 0.90 0.95 1.00
Ver
tical
hei
ght (
ft)
0
50
100
150
200
250
300
350
400
450
500
Figure 3.13. Slope Stability Analysis for MSW Landfill Model (MSW Failure
Model: Shear-Normal Function)

48
2.700
2.7
00
2.7
00
2.800
2.8
00
2.8
00
2.90
0
2.9
00
2.9
00
3.0
00
2.607
Description: MSW onlySoil Model: Mohr-CoulombUnit Weight: 59 (SD=5)
Factor of Safety: 2.607
Reliability Index: 14.908Standard Dev.: 0.108
Landfill accepting MSW only with Mohr-Coulomb failure
Side slope 1:3
Horizontal Distance (ft) (x 1000)
0.00 0.05 0.10 0.15 0.20 0.25 0.30 0.35 0.40 0.45 0.50 0.55 0.60 0.65 0.70 0.75 0.80 0.85 0.90 0.95 1.00
Ver
tical
hei
ght (
ft)
0
50
100
150
200
250
300
350
400
450
500
Figure 3.14. Slope Stability Analysis for MSW Landfill Model (MSW Failure Model: Mohr-Coulomb Function)
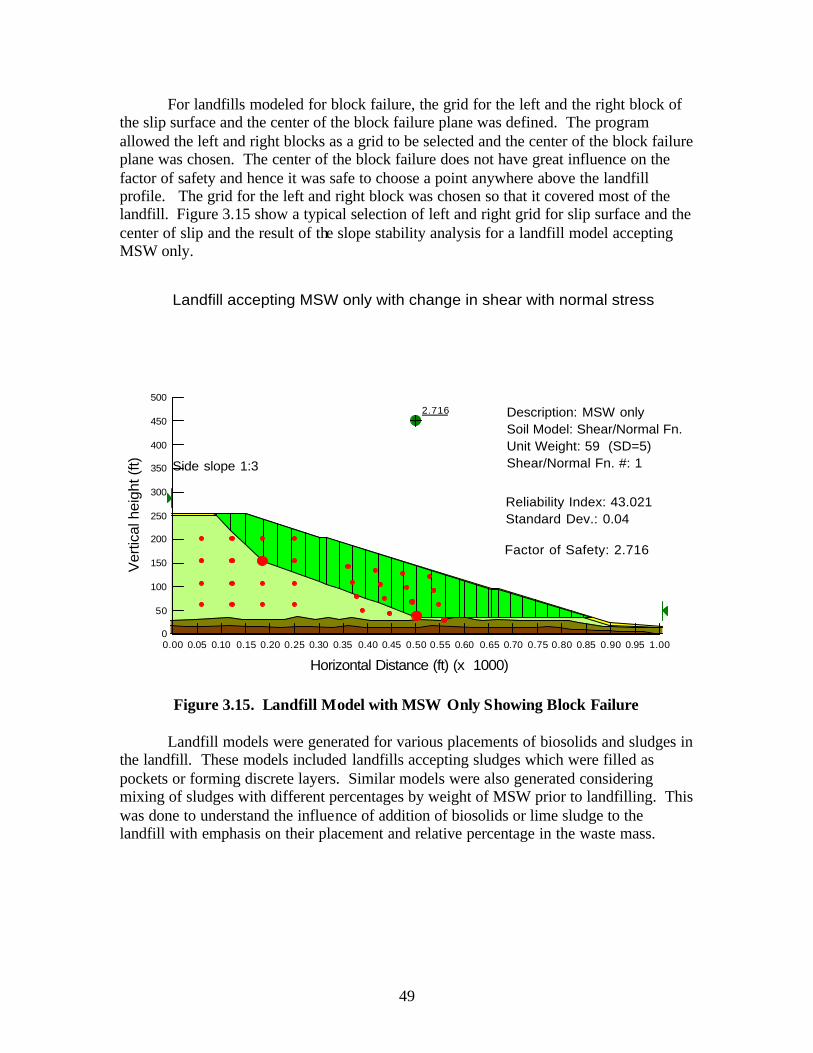
49
For landfills modeled for block failure, the grid for the left and the right block of the slip surface and the center of the block failure plane was defined. The program allowed the left and right blocks as a grid to be selected and the center of the block failure plane was chosen. The center of the block failure does not have great influence on the factor of safety and hence it was safe to choose a point anywhere above the landfill profile. The grid for the left and right block was chosen so that it covered most of the landfill. Figure 3.15 show a typical selection of left and right grid for slip surface and the center of slip and the result of the slope stability analysis for a landfill model accepting MSW only.
2.716
Factor of Safety: 2.716
Reliability Index: 43.021Standard Dev.: 0.04
Description: MSW onlySoil Model: Shear/Normal Fn.Unit Weight: 59 (SD=5)Shear/Normal Fn. #: 1
Landfill accepting MSW only with change in shear with normal stress
Side slope 1:3
Horizontal Distance (ft) (x 1000)0.00 0.05 0.10 0.15 0.20 0.25 0.30 0.35 0.40 0.45 0.50 0.55 0.60 0.65 0.70 0.75 0.80 0.85 0.90 0.95 1.00
Ver
tical
hei
ght (
ft)
0
50
100
150
200
250
300
350
400
450
500
Figure 3.15. Landfill Model with MSW Only Showing Block Failure Landfill models were generated for various placements of biosolids and sludges in
the landfill. These models included landfills accepting sludges which were filled as pockets or forming discrete layers. Similar models were also generated considering mixing of sludges with different percentages by weight of MSW prior to landfilling. This was done to understand the influence of addition of biosolids or lime sludge to the landfill with emphasis on their placement and relative percentage in the waste mass.
50
CHAPTER 4 RESULTS AND DISCUSSION
4.1 Introduction The purpose of this research was to compare landfilling of biosolids with other
disposal options. Biosolids may be contaminated with a variety of pathogens and heavy metals. Of equal concern is the presence of several organic contaminants such as polychlorinated biphenyls (PCBs), phthalates, dioxins and furans, surfactants, acid extractables, and nitrosamines. PCBs are dangerous because they cause birth defects and are possible carcinogens and endocrine disruptors. Dioxins and furans are toxic and accumulate in organisms causing birth defects while surfactants negatively affect microorganisms, fish and the growth of some plants (www.roe.rutgers.edu). On the other hand, Subtitle D landfills have good containment system integrity and the disposal of biosolids in landfills could be as safe as land application. The purpose of this research was to compare landfilling and land application of biosolids by means of literature review, surveys, statistical leachate analysis, geotechnical analysis, and economic analysis. This chapter provides the results of these analyses.
4.2 Survey Results Between the months of March and May 2002, 65 surveys were sent to Class I landfills in Florida out of which 56 were known to be active, one was an ash monofill, and one was closed. Forty-seven facilities responded to the survey. The Class I landfill facilities that responded disposed between 30,000 and 850,000 tons of MSW in 2001. One of the Class III facilities in Florida, Lake County Solid Waste Management Facility, disposed of 8000 tons of MSW in 2001. Out of 47 facilities responding to the survey, 26 accepted biosolids for disposal, whereas only 4 facilities accepted drinking water sludge.
4.2.1 Biosolids
4.2.1.1 Quantity Disposed
Facilities which participated in survey, received between 1 to 36,000 tons of biosolids during 2001 (Figure 3.1). The Gulf Coast Landfill disposed of 4,500 tons of biosolids in 2001, do not accept biosolids. No reason was mentioned for not accepting biosolids in 2001.
4.2.1.2 Tipping Fee
Tipping fees for disposal of biosolids varied from $7 to $80 per ton as compared to $15 to $84 per ton for MSW. Out of 24 facilities, which provided data on tipping fee, 14 charged the same for MSW and biosolids, six charged more for biosolids disposal and four charged less for biosolids disposal than MSW. Figure 3.2 provides the distribution of tipping fees for biosolids disposal in Florida.

51
Figure 4.1. Biosolids disposed in 2001 (in tons)
< $25/ton17%
$26-35/ton33%
$36-50/ton25%
> $50/ton25%
Figure 4.2. Biosolids disposal tipping fee in 2001
Under 1,00042%
1,000-5,00019%
5,001-10,00027%
10,001-20,0008%
20,001-40,0004%

52
4.2.1.3 Frequency of Biosolids Reception
The frequency of the biosolids disposal varied from daily, weekly to once in every 2to 3 years. Figure 3.3 provides the frequencies with which facilities received biosolids.
Daily30%
1-4 Times/Week30%
Bi-weekly20%
Monthly5%
> Monthly15%
Figure 4.3. Biosolids Reception Frequency in 2001
4.2.1.4 Condition of Biosolids
Out of 24 facilities that commented on condition of biosolids received, 11 described it to be dry, nine described it as being wet and four described it as very wet. Approximately 50% of biosolids received by facilities were dry, about 42% were wet, and about 4% were very wet (some facilities did not comment).
4.2.1.5 Handling of Biosolids
Twenty-nine facilities provided handling and disposal practices of the biosolids. Most facilities treated biosolids the same as MSW, while some used it as landfill daily cover (Figure 3.4). The following summarizes the biosolids handling procedures:
• Fifteen facilities disposed of biosolids as they dispose MSW, • Five spread a thin layer on the working face and then mix with MSW, • One mixes it with sand and yard waste and uses this mixture as alternative daily
cover,

53
• Two Ash monofills spread it over ash. • Two, which received dry biosolids, used it as daily cover • Two bury the biosolids in a hole cut into the waste and covered with MSW. • One composted biosolids with yard waste and mulch. • One used it for N-Viro Soils Treatment Facility on Site.
Figure 4.4. Biosolids Handling procedure
4.2.1.6 Problems associated with Biosolids Disposal
Although some facilities reported having no problems with biosolids management, many reported obstacles including reduced landfill compaction, odor, related equipment problems, and employee safety hazards. In general, biosolids disposal makes it hard to work in the area.
4.2.1.7 Miscellaneous Comments
• Thirteen facilities received other wastes like potato chips factory waste, body care product waste, industrial sludges etc., with high moisture content.
• Twenty-two facilities are willing to share leachate and gas data and 23 of the facilities are willing to participate in a follow up interview (4 responded no, 5 left blank and others responded with “n/a”)
Same as / mixed with MSW55%
Spread as thin layer on MSW and covered
with MSW19%
Buried in hole dug into MSW
7%
Used as landfill cover11%
N-Viro soil treatment4%
Composted4%

54
4.2.2 Water Treatment Plant Sludge
Out of five facilities that accepted drinking water sludge, two did not report the quantities disposed in 2001, one disposed 450 tons, another reported two tons, and a third did not receive any drinking water sludge in 2001. The facility that disposed 450 tons in 2001 did not a charge tipping fee for DWS disposal and used it as a daily cover.
4.3 Issues Associated with Landfilling of Biosolids While surveys were being sent, Technical Awareness Group (TAG) meetings were
conducted at UCF. The information obtained from the surveys and the discussions at the TAG meetings were pooled to identify the issues that would have to be addressed while considering landfilling as a disposal option for biosolids. The following were the issues that needed to be addressed:
• Operational issues, • Greater input of moisture into the landfill as a result of introduction of biosolids, • Impact on leachate quality, • Greater and accelerated production of gas, and • Impact on geotechnical stability These issues will be discussed in further detail in the following sections.
4.3.1 Operational Issues
Biosolids are extremely wet in nature. Respondents to the survey reported that
biosolids that are not dewatered have a solids content of 1.5 – 3 % while dewatered biosolids have a solid content of about 12 16%. This wet nature of biosolids leads to some operational difficulties. One difficulty faced by most landfill operators is the greater effort required to compact the waste. Wet biosolids create an extremely slick working surface making it very hard for spotter personnel to walk on it. Also, it is difficult to maneuver compaction equipment on wet biosolids. The biosolids adhere to the tracks of the dozers and often the dozer gets stuck or sinks into the working surface, thus making waste compaction a laborious process. The wet nature of the biosolids also reduces the in-place density of the compacted waste.
It was also reported that it is difficult to homogenously mix MSW and biosolids. This improper mixing causes “soft spots” or localized areas of biosolids that are unable to bear the weight of the dozers and may affect the geotechnical stability of the landfill. Most landfills deal with these issues by somehow reducing the moisture content of the biosolids. Some landfills that receive very wet biosolids spread them out and wait a day or two before landfilling them to reduce some of the moisture. A popular method of handling wet biosolids seems to be to add wood chips, ash, or dry MSW to the biosolids in order to increase the solids content and then dispose it in the landfills. In one landfill,

55
the sludge was mixed in a 1:1 proportion with on-site sands. This mixture was then blended in a 1:1 proportion with shredded yard waste to produce alternative Class I cover material. In ash monofills, the biosolids were mixed with ash and then spread in layers. In other cases, biosolids were spread as a very thin surface on the working face and this face was covered with MSW to avoid the occurrence of soft spots.
Another issue related to biosolids disposal reported in the survey is odor. Their distinctive odor makes them very unpleasant to handle. There is also a concern that odors from biosolids could adversely affect human health. A field test was performed at a land application site which accepted anaerobically digested, de-watered biosolids to test for bioaerosols (Dowd et al., 2000). The data obtained from this field study were then used to calculate microbial release rates from the biosolids which were later used in modeling the transport of bioaerosols. These transport data were then entered into microbial dose-response models in order to evaluate the risk of pathogenic bacteria and viruses infecting workers at the land application site and nearby population centers. The risk of viral and bacterial infection to workers at the land application site was found to be 3:100 and 2:100 respectively less than two m/s wind conditions and one hour of exposure. These models by nature tended to overestimate the risk to humans with immunocompetent systems. In reality, under low-wind conditions, population centers inhabited by immunocompetent individuals would be at little risk of infection from aerosolized bacteria and at no risk from aerosolized viruses (Dowd et al., 2000). It thus seems safe to assume that if biosolids odors are not disease–causing at land application sites, they will not be dangerous at landfills either.
Odor emissions can be reduced by mixing biosolids with high carbon wood ash.
Not only does this reduce DMDS odor but also reduces the moisture content of biosolids making them easier to compact and handle. There are other ways of deodorizing biosolids at the WWTPs. These include the following (Lambert et al., 2000):
• Oxidation: At doses lethal to bacteria, oxidizing agents have two-fold functions. They
react with odor-causing molecules and also inhibit the activities of microorganisms. Some of the common oxidizing agents include chlorine dioxide, ozone, hydrogen peroxide, permanganate, hypochlorite and chlorine.
• Bacteriological dosing, enzyme dosing and biological suppressants: This is a technique where bacteria that are able to remove odorous compounds are inoculated into the system. Following inoculation, these bacteria reduce odors by shifting the balance of microbial activity away from sulfate reduction towards sulfide oxidation and fat hydrolysis. Biological suppressants control odors by inhibiting the activities of sulfate reducing bacteria.
• Electron acceptor dosing: This is a technique where sources of oxygen that do not produce odors are used in preference to those that produce odors. The most widely used nutrients contain calcium nitrate or a mix of ferric sulfate and nitric acid or nitrate salts.
• Odor neutralizers: These generally contain droplets of water coated by surfactants and essential oils and frequently, natural substances such as castor, orange and pine oils. Such constituents contain many polar functional groups of types such as amines,

56
esters, alcohols and acids which are similar to those present in odor-causing molecules. Electrostatic attraction between respective functional groups physically absorbs odor-causing molecules on to the surface of the odor neutralizing droplets.
4.3.2 Greater Input of Moisture Dewatered biosolids typically have a solids content of about 12-16%. Thus, the
addition of biosolids will result in the introduction of moisture into the landfill. In recent years, there has been increasing support for the use of landfills as bioreactors. Bioreactors use leachate recirculation and moisture addition to landfills to accelerate the stabilization of waste and production of gas. Most MSW landfills will not produce sufficient leachate to sustain a bioreactor landfill in its optimum mode. For optimal waste degradation, each ton of waste in a landfill needs about 30 to 50 gallons of liquid that is, a moisture content of about 50% by weight (SWANA, 2000). MSW placed in landfills typically has a moisture content of 20-25% by weight. Therefore, in order for a landfill to be able to function as an effective bioreactor, recirculated leachate or othe r moisture sources will have to be introduced into the landfill.
It has been reported that addition of such wastes as biosolids, grey water or
animal feedlot liquid wastes to MSW landfills greatly enhances its performance as a bioreactor (SWANA, 2000). From the information compiled above, it seems that the introduction of the wastes mentioned above into landfills would improve its performance. It has been demonstrated that the Subtitle D landfill is an environmentally secure facility. Recently compiled information shows that such a landfill has good containment system integrity (SWANA, 2000). Thus, it appears that disposing such wastewaters into Subtitle D landfills under strict management and regulatory supervision might be as safe as other disposal options. SWANA mentioned that disposing such liquids into landfills often provides the necessary ingredient required for accelerated waste stabilization. The accelerated waste stabilization will also create high temperatures in the cores of bioreactors leading to disinfecting environments for pathogens. In addition, wet landfills have been shown to have significant attenuation capacity for heavy metals and many organics (Pohland, 1992).
4.3.3 Impact on Leachate Quality
Biosolids tend to contain pathogens and heavy metals. Hence, while considering co-disposal of biosolids and MSW, its impact on leachate quality will have to be addressed.
One of the questions included in the survey was whether landfill operators noticed any change in leachate quality as a result of co-disposal. Most landfill operators reported no observable impact of co-disposal on leachate quality. They attributed this to the fact that the quantity of biosolids accepted by their facilities was an extremely small percentage of MSW and this prevented biosolids from contributing significantly to leachate quality.

57
A statistical analysis was performed using Microsoft Excel to evaluate the impact
of co-disposal on leachate quality (Refer Chapter 3 for detailed process). The leachate data recorded were extremely variable and the variability of the data made it very difficult to draw any conclusive inferences from the analysis. Table 4.1 presents statistical operations for selected parameters on both kinds of landfills – ones that accepted biosolids and ones that did not.

58
Table 4.1. Values of Mean, Standard Deviation and Variance for Leachate Parameters
Parameters Landfills accepting biosolids Landfills not accepting biosolids
Average Values Average Values
Average
(µg/l) Std.Dev Variance Average
(µg/l) Std.Dev Variance
(No. of data
points) (No. of data
points)
DO 1.89(13) 1.62 2.83 2.05 (8) 1.27 1.85 Ph 6.9(14) 0.61 0.4 7.4(10) 0.55 0.34 Conductivity 408000 (14) 1454866 2.28E+12 8720(8) 6111.78 42690147.59 TDS (Ress.Diss.) 2690 (14) 1594.69 2738656 4180(10) 1878.56 3921087.65 BOD5 40(5) 33.97 1442.42 0(0) 0 * Nitrate 3.8(13) 10.33 115.49 0.08(11) 0.1 0.01 Zinc 37(11) 57.85 3681.76 42.4(11) 51.51 2919.02 Manganese ICP 502(5) 860.92 926476 0(0) 0 * Potassium 171(3) 170.02 43359.28 0(0) 0 * Magnesium hardness 40(4) 21.16 597.08 0(0) 0 * Calcium 184(4) 105.45 14825.79 0(0) 0 * Sulfate 57(4) 69.9 6514.99 0(0) 0 * Chloride 523(14) 387.53 162696.2 1252(11) 795.35 695835.2 Nickel 53(12) 43.21 2036.49 83.1(11) 43.72 2102.32 Silver 3.53(9) 4.83 26.21 3.2(11) 3.98 17.45 Selenium 1.6(11) 2.5 6.86 3.83(10) 3.28 11.95 Mercury 0.13(13) 0.24 0.06 0.05(10) 0.06 0 Lead 4.5(12) 6.07 40.24 1.12(11) 1.49 2.43 Fluoride 0.4(2) 0.12 0.03 0(0) 0 * Chromium 18.3(14) 24.34 638.12 43.5(11) 56.41 3500.45 Cadmium 1.36(11) 2.56 7.24 2.6(11) 5.95 38.93 Barium 97.7(12) 142.72 22220.04 75(11) 87.91 8500.99 Arsenic 15.4(14) 16.78 303.29 18.9(11) 13.39 197.28 COD 512.21(4) 711.95 675824.8 0(0) 0 * Alkalinity 1063.34(9) 1000.38 1125848 2840(11) 3221.83 11418211.52 Sodium 18360(14) 43777.61 2.06E+09 8210(10) 21820.07 529017006.3 Iron 21300(14) 44260.51 2.11E+09 15840(11) 13807.01 209696864.2 * No variances were obtained as the concentrations were at non detectable levels and hence assumed to be zero.

59
Based on the values shown above, Table 4.2 was prepared which compares the values of various parameters in landfills accepting biosolids and landfills not accepting biosolids.
Table 4.2. Comparison between Landfills Accepting Biosolids and Landfills not Accepting them and Results of Hypothesis Testing
Parameter Landfills Typically Having Highest Concentration
Means Equal?
DO Ones Not Accepting Biosolids Insufficient evidence pH Ones Not Accepting Biosolids Insufficient evidence Conductivity Ones Accepting Biosolids Insufficient evidence TDS (Ress.Diss.) Ones Not Accepting Biosolids No BOD5 Ones Accepting Biosolids * - Nitrate Ones Accepting Biosolids Insufficient evidence Zinc Ones Not Accepting Biosolids Insufficient evidence Manganes e ICP Ones Accepting Biosolids* - Potassium Ones Accepting Biosolids* - Magnesium hardness Ones Accepting Biosolids* - Calcium Ones Accepting Biosolids* - Sulfate Ones Accepting Biosolids* - Chloride Ones Not Accepting Biosolids No Nickel Ones Not Accepting Biosolids Insufficient evidence Silver No difference Insufficient evidence Selenium Ones Not Accepting Biosolids Insufficient evidence Mercury Ones Accepting Biosolids No Lead Ones Accepting Biosolids Insufficient evidence Fluoride Ones Accepting Biosolids - Chromium Ones Not Accepting Biosolids Insufficient evidence Cadmium Ones Not Accepting Biosolids Insufficient evidence Barium Ones Accepting Biosolids Insufficient evidence Arsenic Ones Not Accepting Biosolids Insufficient evidence COD Ones Accepting Biosolids* - Alkalinity Ones Not Accepting Biosolids Insufficient evidence Sodium Ones Accepting Biosolids Insufficient evidence Iron Ones Accepting Biosolids Insufficient evidence
- Variances for these parameters were not available hence, hypothesis testing could
not be conducted * Only one reading was available for landfills not accepting biosolids
It can be seen from Table 4.2 that in most cases, there is not sufficient evidence to
prove that the leachate quality of landfills accepting biosolids is significantly different from the leachate quality of landfills not accepting biosolids with the exception of TDS, chlorides and mercury. Landfills not accepting biosolids show higher values of TDS and chlorides. Hence, these parameters might not be of concern to co-disposal landfills. The concentration of mercury in leachate from landfills accepting biosolids is almost three

60
times higher than mercury concentrations in leachate from landfills not accepting biosolids and the difference is statistically significant. This difference may be attributed to the fact that the data are extremely variable as suggested by the large value of standard deviation. However, given the present concerns regarding the hazards of mercury, this is an issue that will have to be looked into carefully and it might be worthwhile to substantiate any conclusions about mercury concentrations with data from field experiments.
The potential for biosolids to contaminate leachate can be inferred from studies
examining the leachability of contaminants from biosolids during land application. Many studies have been conducted that suggest that with appropriate loading, land application does not result in mobilization of metals and organic matter. For example, the potential for contamination of soil and surface water from dewatered biosolids with metals above usual concentrations and at high application rates (0, 30, 60, 120 dry Mg/ha) was evaluated in an Australian sheep-grazing study. The study reported reduced run-off and increased surface retention of rainfall in biosolids-amended soils. The data showed very low concentrations of metals in run-off water. A potential risk of metals leaching existed if biosolids were applied at low rates on soil with pH < 4.5. Studies by Giller et al. (1998) examined the effect of toxic components of biosolids on soil organisms. The study indicated that biosolids amendment significantly increased the microbial biomass and enhanced the soil’s nitrogen mineralization potential (Krogman et al., 1999).
Triplicate wastewater sludge samples from three small municipal wastewater
treatment plants that only accepted municipal wastewater were analyzed using the Extraction Procedure Toxicity Test (EP) and the Toxicity Characteristic Leaching Procedure (TCLP) to evaluate the potential for organic and inorganic chemicals to leach from the sludge. The wastewater sludges from these small municipalities contained few extractable organic pollutants as measure by EP and TCLP. Only one regulated chemical (p-cresol) was detected and the concentration detected was well below the TCLP limit of 10 mg/l of extract. Therefore, it could be concluded that leaching of organic pollutants from sludges arising from treatment of non-industrial wastewater was not a frequent occurrence.
A surface coal mine in southeastern Ohio was reclaimed with approximately 15 to
25 cm of biosolids from a bleached kraft pulp and paper mill wastewater treatment plant. Soil, vegetation, rodents, earthworms, insects, fish, frogs, sediment and algae samples were collected and analyzed for 2,3,7,8–tetracholorodibenzo-p-dioxin and 2,3,7,8–tetracholorodibenzofuran. Water samples from lakes receiving draininage from unreclaimed and biosolids reclaimed areas were collected and analyzed for various parameters including pH and metals. The trace levels of dioxin and furan in the pulp and paper mills biosolids did not bioaccumulate in rodents, insects or earthworms or translocate into plants living in the reclaimed area. The trace levels of dioxin and furan in biosolids did not sufficiently migrate to a drainage lake to result in significant concentrations in fish, frogs, algae or vegetation. The biosolids reclamation resulted in dramatic decreases in spoils leaching of acid, aluminium, calcium, iron, magnesium, manganese, nickel and zinc (McFadden et al., 1995).

61
A Canada-Ontario Agreement established in the early 1970s provided funding for
improved sewage treatment in the Lower Great Lakes basin. Although much of the funding was designated for infrastructure improvements, a portion was available for research and development including a study of land application of biosolids (Krouskop et al., 1995). These experiments were conducted for more than five years and involved high biosolids application rates and four field crops - corn, wheat, orchard grass and brome grass. Results indicated no evidence for crop yield reductions from cumulative biosolids applications ranging up to 499 tonnes/ha dry weight and there were only minor increases of heavy metal concentrations in the plant materials. However, there was a potential for nitrate-N contamination of groundwater when biosolids application was in excess of that required to supply the nitrogen requirement of the growing crop (Soon et al. 1978a, 1978 b and 1980; Webber et al, 1981). These authors concluded that biosolids application to land according to Ontario guidelines (MOEE & OMAFRA 1996) which limit nitrogen and heavy metal loadings to soil would not reduce the yield or quality of the four test crops nor would it reduce groundwater quality. Hampton Roads Sanitation District (HRSD) has established an extensive monitoring program on its own farm (known as the Progress Farm) to document the long-term effects of applying biosolids. The Progress Farm has been in operation for over 15 years. HRSD gathered comprehensive data on soil, groundwater and surface water quality on the Progress Farm for two years prior to applying biosolids. These data have provided a scientific baseline to study the long-term effects of biosolids land application. All monitoring data continue to confirm that biosolids are a safe and effective source of nutrients and organic matter. Much of the initial research conducted on the farm was done in conjunction with VPI and the Virginia Cooperative Extension. Continued research and demonstrations in cooperation with regional universities confirm the advantages and safety of biosolids (http://www.hrsd.state.va.us/biosolidsprogram.htm, 2003).
It can be seen from the above discussion that land application of biosolids is safe from the perspective of soil microbial activity and metals leaching and consequently, it seems safe to assume that landfilling of biosolids would not have any adverse effects on leachate quality.
4.3.4 Impact on Gas Production Introduction of biosolids into landfills will accelerate waste degradation. The
additional input of moisture from biosolids accelerates the process of waste stabilization and gas production. It has been shown that gas production in bioreactor landfills is greatly increased as a result of more optimum environmental conditions for microorganisms and the return of organic matter to the landfills through leachate recirculation and moisture addition. An experiment was conducted by the Delaware Solid Waste Association to compare conventional and bioreactor landfills and a 12-fold increase in gas production was seen in the wet cells as compared to the dry cells (Reinhart et al., 1997). In a recirculating landfill at Alachua County, Florida, it was seen

62
that gas production in the wet areas in the landfills was twice the gas production in its dry areas (Reinhart et al., 1997).
Twenty eight experimental sanitary landfill cells were constructed to study the
effect of co-disposal of MSW and biosolids on leachate and gas quality (Kinman et al., 1982). The 28 cells comprised of biosolids only, biosolids and MSW, and MSW-only landfills. Strict anaerobic conditions were maintained in the cells. As a result, gas generation occurred almost immediately. Regular venting of the gases produced was required in all 28 cells in the first year. A summary of gas quantity data revealed that gas production was significantly increased by the addition of biosolids to MSW and that MSW cells lagged in gas production behind co-disposal cells by two years.
It has thus been conclusively shown that the introduction of biosolids to landfills
enhances gas production. However, this fact has positive implications only if the gases are captured. Landfill operators must anticipate an early and greater production of gas and make arrangements to harness this valuable source of energy.
4.3.5 Impact on Geotechnical Stability
Evaluation of the impact of co-disposal of biosolids and MSW on the geotechnical stability of landfills through laboratory experiments was conducted in parallel to this research (Koodathinkal, 2003). The results are reported in two sections, one being from the experimental data acquired from laboratory testing of waste and sludges and the other from the slope stability analysis conducted on landfill models to determine the effect of various parameters on the stability of the landfill.
4.3.5.1 Results from Laboratory Experiments
The tests conducted in the laboratory included moisture content of the biosolids
and lime sludge received. These tests were followed by the modified compaction tests on the waste, with various percentages by weight of biosolids and lime sludges. Compaction testing was done to determine the optimum value that can be achieved and the corresponding optimum moisture content. The direct shear test was then performed to determine the shear strength of the waste. These tests were described in Chapter 3. The results from each of these tests are discussed below.
4.3.5.1.1 Moisture Content
The moisture content of biosolids and lime sludge were determined using ASTM
D-2216 and these moisture and solids contents were used to identify percentages by weight of biosolids and sludges that were mixed with the MSW. It may be concluded from the results shown in Table 4.3 that the biosolids had more moisture than lime sludge and hence for the same percent weight of biosolids and lime sludges, lime sludge had more solids contributing to the mixture with MSW. Details of the moisture content tests may be found in K.
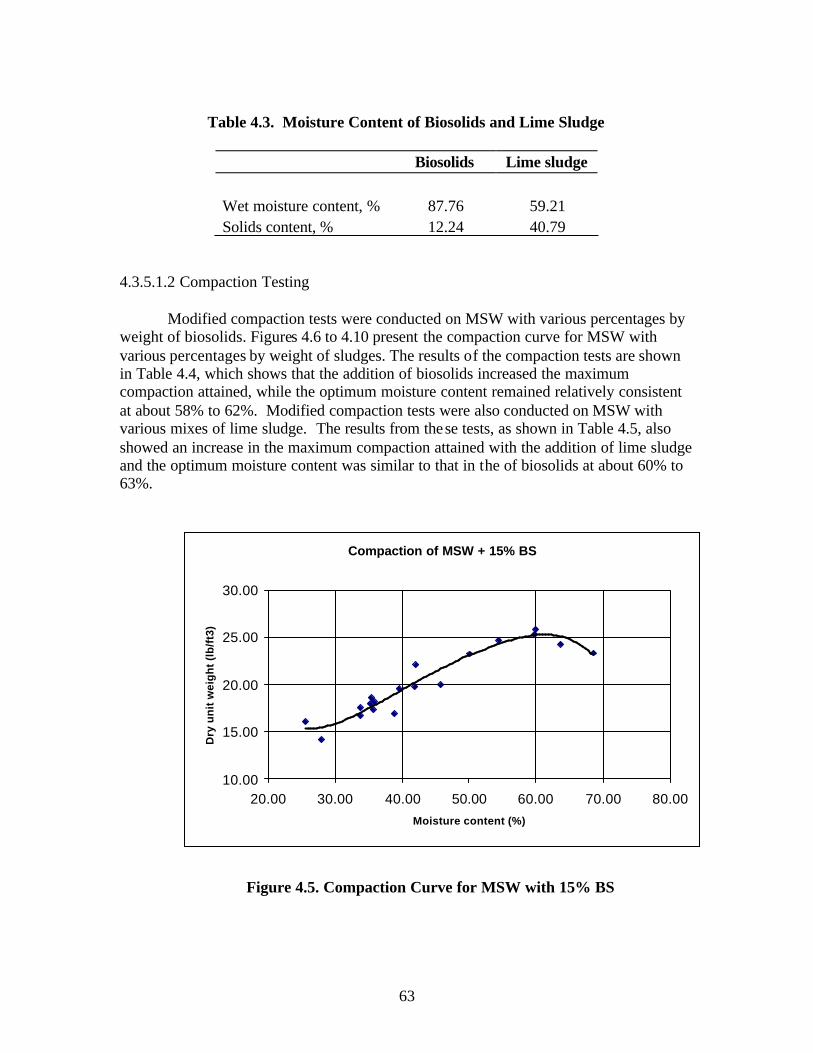
63
Table 4.3. Moisture Content of Biosolids and Lime Sludge
Biosolids Lime sludge
Wet moisture content, % 87.76 59.21 Solids content, % 12.24 40.79
4.3.5.1.2 Compaction Testing
Modified compaction tests were conducted on MSW with various percentages by
weight of biosolids. Figures 4.6 to 4.10 present the compaction curve for MSW with various percentages by weight of sludges. The results of the compaction tests are shown in Table 4.4, which shows that the addition of biosolids increased the maximum compaction attained, while the optimum moisture content remained relatively consistent at about 58% to 62%. Modified compaction tests were also conducted on MSW with various mixes of lime sludge. The results from these tests, as shown in Table 4.5, also showed an increase in the maximum compaction attained with the addition of lime sludge and the optimum moisture content was similar to that in the of biosolids at about 60% to 63%.
Figure 4.5. Compaction Curve for MSW with 15% BS
Compaction of MSW + 15% BS
10.00
15.00
20.00
25.00
30.00
20.00 30.00 40.00 50.00 60.00 70.00 80.00Moisture content (%)
Dry
un
it w
eig
ht
(lb
/ft3
)

64
Figure 4.6. Compaction Curve for MSW with 30% BS
Figure 4.7. Compaction Curve for MSW with 50% BS
Compaction of MSW + 30% BS
15.00
20.00
25.00
30.00
20.00 30.00 40.00 50.00 60.00 70.00
Moisture content(%)
Dry
uni
t wei
ght (
lb/ft
3)
Compaction of MSW + 50% BS
15.00
20.00
25.00
30.00
30.00 40.00 50.00 60.00 70.00
Moisture content (%)
Dry
un
it w
eig
ht
(lb
/ft3
)

65
Figure 4.8. Compaction Curve for MSW with 15% LS
Figure 4.9. Compaction Curve for MSW with 30% LS
Compaction of MSW + 15% LS
R2 = 0.6052
15.00
20.00
25.00
30.00
20.00 30.00 40.00 50.00 60.00 70.00
Moisture content(%)
Dry
uni
t wei
ght (
lb/ft
3)
Compaction of MSW + 30% LS
R2 = 0.8976
15.00
20.00
25.00
30.00
20.00 30.00 40.00 50.00 60.00 70.00
Moisture content(%)
Dry
uni
t wei
ght (
lb/ft
3)

66
Figure 4.10. Compaction Curve for MSW with 50% LS
Table 4.4. Maximum Compacted Unit Weight and Optimum Moisture Content for MSW and Biosolids Mixture
Max unit weight (lb/ft3)
Optimum moisture content
(%) MSW only 19.0 60.0 MSW with 15% BS 26.0 62.0 MSW with 30% BS 28.0 60.0
MSW with 50% BS 28.0 58.0
Table 4.5. Maximum compacted unit weight and optimum moisture content for
MSW and lime sludge mixture
Max unit weight
(lb/ft3)
Optimum moisture content
(%) MSW only 19.0 60.0
MSW with 15% LS 26.5 63.0 MSW with 30% LS 27.2 63.0 MSW with 50% LS 26.9 61.0
Compaction of MSW + 50% LS
R2 = 0.674
15.00
20.00
25.00
30.00
20.00 30.00 40.00 50.00 60.00 70.00
Moisture content(%)
Dry
uni
t wei
ght (
lb/ft
3)

67
Hence, it may be concluded that it is the moisture content that determined the maximum compaction attained and the presence of biosolids or lime sludge does not play an important role in the compaction of MSW. The details of all the compaction test results can be found in Koodathinkal (2003). Direct shear tests were conducted at the moisture content of around 60% for both biosolids and lime sludge.
4.3.5.1.3 Direct shear test
Direct shear tests were conducted on the large-scale mold as discussed in Chapter
3. The tests were conducted at a moisture content of around 60%, which was obtained from compaction tests. Table 4.6 shows the results of the direct shear tests on MSW alone and MSW with addition of biosolids in increasing percentage of weight. The details of the direct shear tests are provided in Koodathinkal (2003).
Table 4.6. Cohesion and Internal Friction Angle of MSW with Increase in Biosolids
Content
MSW only MSW + 15%
BS MSW + 30%
BS MSW + 50%
BS
Cohesion, c (psi) 4.25 6.33 4.68 5.77 Internal Friction Angle, F 28.10 12.29 11.21 11.93
The results showed that there was no substantial change in the cohesion with the
addition of biosolids and it remained at around 4.25 psi to 6.33 psi. On the other hand, the internal friction angle (F) dropped significantly with the addition of biosolids. It dropped from 28.1 degrees for MSW only to around 12.0 degrees with the addition of biosolids. This shows a drastic reduction in the shear strength of MSW with the addition of biosolids. It may be noted from Table 4.7 tha t the shear stress increases with the increase in the normal stress and increase in strain.
Table 4.8 shows the results of the direct shear test conducted on MSW with
varying fractions of lime sludge. It can be noted that the strength of MSW is not greatly affected by the addition of lime sludge. The values of cohesion and internal friction angle remain relatively constant. This observation suggests that the addition of lime sludge to MSW does not adversely affect the strength of MSW as much as the addition of biosolids.
The unit weight of the samples calculated during the direct shear test was found to
be around 60 pcf, which was within the range of the actual unit weight of landfill (40 to 75 pcf) as reported by Landva and Clark (1990). Thus we can conclude that the direct shear tests were representative of conditions as that found in landfills and hence the results are comparable to the actual shear strength of MSW in landfills.

68
Table 4.7. Shear Stress with Increase in Normal Stress and Strain
Shear Stress (psi) for MSW only Strain 10% 12.7% 20% 26%
Normal Stress (psi)
3.74 5.40 5.90 6.37 6.25 10.73 7.03 7.68 9.08 9.98 15.95 8.25 9.01 11.10 12.77
Shear Stress (psi) MSW + 15% BS
Strain 10% 12.7% 20% 26% Normal Stress (psi)
3.74 4.37 4.94 6.27 7.29 10.73 6.37 6.89 7.95 8.31 15.95 7.86 8.35 9.20 10.00
Shear Stress (psi) for MSW + 30% BS
Strain 10% 12.7% 20% 26% Normal Stress (psi)
3.74 3.56 3.93 4.72 5.42 10.73 4.89 5.41 6.41 6.81 15.95 5.88 6.51 7.67 7.84
Shear Stress (psi) for MSW + 50% BS
Strain 10% 12.7% 20% 26% Normal Stress (psi)
3.74 4.84 5.16 5.96 6.56 10.73 5.81 6.29 7.29 8.04 15.95 6.53 7.13 8.28 9.14
Table 4.8. Cohesion and Internal Friction Angle of MSW with Lime Sludge Content
MSW only MSW + 15% LS MSW + 50% LS
Cohesion, c (psi) 4.25 3.56 2.52 Internal Friction Angle, F 28.10 29.40 23.15
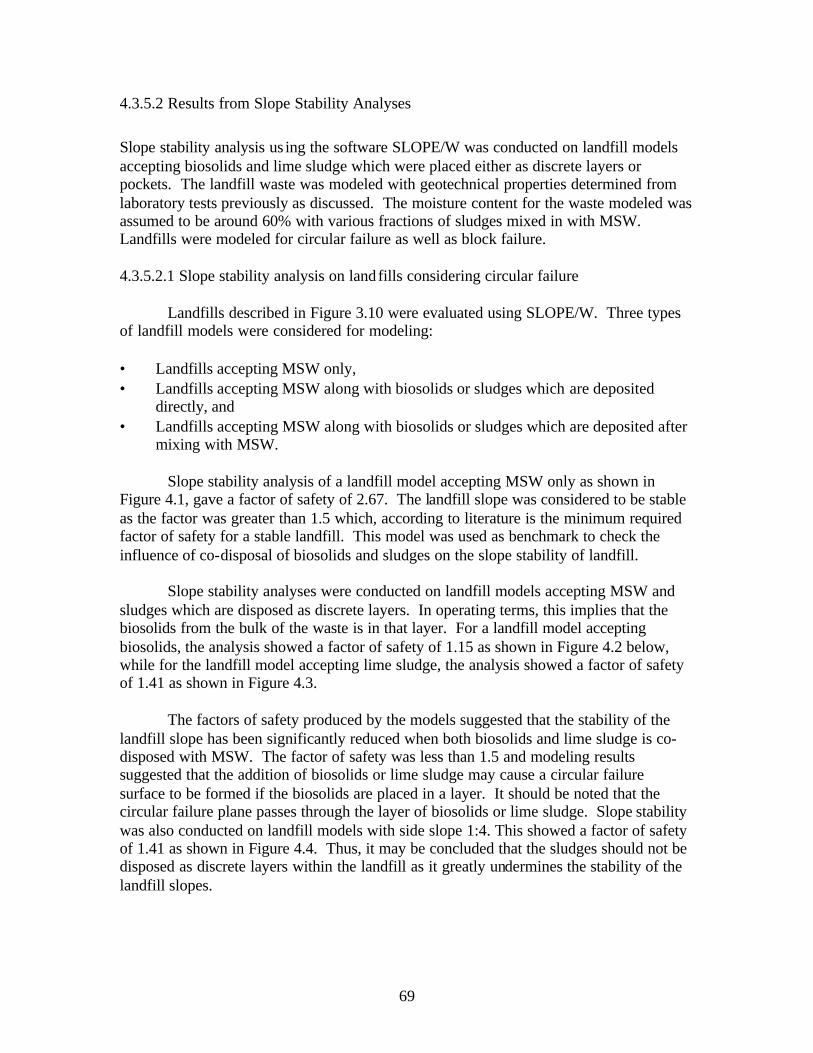
69
4.3.5.2 Results from Slope Stability Analyses
Slope stability analysis us ing the software SLOPE/W was conducted on landfill models accepting biosolids and lime sludge which were placed either as discrete layers or pockets. The landfill waste was modeled with geotechnical properties determined from laboratory tests previously as discussed. The moisture content for the waste modeled was assumed to be around 60% with various fractions of sludges mixed in with MSW. Landfills were modeled for circular failure as well as block failure. 4.3.5.2.1 Slope stability analysis on landfills considering circular failure
Landfills described in Figure 3.10 were evaluated using SLOPE/W. Three types of landfill models were considered for modeling: • Landfills accepting MSW only, • Landfills accepting MSW along with biosolids or sludges which are deposited
directly, and • Landfills accepting MSW along with biosolids or sludges which are deposited after
mixing with MSW.
Slope stability analysis of a landfill model accepting MSW only as shown in Figure 4.1, gave a factor of safety of 2.67. The landfill slope was considered to be stable as the factor was greater than 1.5 which, according to literature is the minimum required factor of safety for a stable landfill. This model was used as benchmark to check the influence of co-disposal of biosolids and sludges on the slope stability of landfill.
Slope stability analyses were conducted on landfill models accepting MSW and
sludges which are disposed as discrete layers. In operating terms, this implies that the biosolids from the bulk of the waste is in that layer. For a landfill model accepting biosolids, the analysis showed a factor of safety of 1.15 as shown in Figure 4.2 below, while for the landfill model accepting lime sludge, the analysis showed a factor of safety of 1.41 as shown in Figure 4.3.
The factors of safety produced by the models suggested that the stability of the
landfill slope has been significantly reduced when both biosolids and lime sludge is co-disposed with MSW. The factor of safety was less than 1.5 and modeling results suggested that the addition of biosolids or lime sludge may cause a circular failure surface to be formed if the biosolids are placed in a layer. It should be noted that the circular failure plane passes through the layer of biosolids or lime sludge. Slope stability was also conducted on landfill models with side slope 1:4. This showed a factor of safety of 1.41 as shown in Figure 4.4. Thus, it may be concluded that the sludges should not be disposed as discrete layers within the landfill as it greatly undermines the stability of the landfill slopes.

70
Figure 4.11. Stability Analysis of a Landfill Model Accepting MSW only Considering Circular Failure
1.2
00
1.300
1.3
00
1.3
00
1.3
00
1.300
1.40
0
1.4
00
1.4
00
1.40
0
1.500
1.5
00
1.153
Description: MSW onlySoil Model: Shear/Normal Fn.Unit Weight: 59 (SD=5)
Reliability Index: 3.674Standard Dev.: 0.042
Factor of Safety: 1.153
Side slope 1:3
Description: MSW + 30% BSSoil Model: Mohr-CoulombUnit Weight: 63 (SD=5)Cohesion: 674 (SD=72)Phi: 11.21 (SD=1)
Description: MSW + 15% BSSoil Model: Mohr-CoulombUnit Weight: 61 (SD=5)Cohesion: 911 (SD=72)Phi: 12.29 (SD=1)
Description: BS onlySoil Model: No StrengthUnit Weight: 35 (SD=5)
Landfill accepting biosolids which is filled as a discrete layer
Horizontal Distance (ft) (x 1000)
0.00 0.05 0.10 0.15 0.20 0.25 0.30 0.35 0.40 0.45 0.50 0.55 0.60 0.65 0.70 0.75 0.80 0.85 0.90 0.95 1.00 1.05 1.10 1.15
Ver
tical
hei
ght (
ft)
0
50
100
150
200
250
300
350
400
450
500

71
2.700
2.70
0
2.7
00
2.800
2.8
00
2.8
00
2.900
2.9
00
2.9
00
3.0
00
2.667Description: MSW onlySoil Model: Shear/Normal Fn.Unit Weight: 59 (SD=5)
Factor of Safety: 2.667
Reliability Index: 34.571Standard Dev.: 0.048
Landfill accepting MSW only with change in shear with normal stress
Side slope 1:3
Horizontal Distance (ft) (x 1000)0.00 0.05 0.10 0.15 0.20 0.25 0.30 0.35 0.40 0.45 0.50 0.55 0.60 0.65 0.70 0.75 0.80 0.85 0.90 0.95 1.00
Ver
tical
hei
ght (
ft)
0
50
100
150
200
250
300
350
400
450
500
Figure 4.12. Stability analysis of a landfill model accepting MSW and biosolids disposed as discrete layers considering circular failure

72
1.500
1.6
00
1.7
00
1.7
00
1.7
00
1.80
0
1.8
00
1.800
1.8
00
1.8
00
1.90
0
1.90
0
1.9
00
1.9
00
2.000
2.000 2
.100
1.493
Factor of Safety: 1.493
Side slope 1:3
Description: MSW onlySoil Model: Shear/Normal Fn.Unit Weight: 59 (SD=5)
Description: Sand LinerSoil Model: Mohr-CoulombUnit Weight: 30 (SD=3)Cohesion: 0 (SD=0)Phi: 40 (SD=5)
Description: MSW + 50% LSSoil Model: Mohr-CoulombUnit Weight: 64 (SD=5)
Reliability Index: 10.293Standard Dev.: 0.048
Landfill accepting lime sludge which are disposed as discrete layers
Horizontal Distance (ft) (x 1000)
0.00 0.05 0.10 0.15 0.20 0.25 0.30 0.35 0.40 0.45 0.50 0.55 0.60 0.65 0.70 0.75 0.80 0.85 0.90 0.95 1.00 1.05 1.10 1.15
Ver
tical
hei
ght (
ft)
0
50
100
150
200
250
300
350
400
450
500
Figure 4.13. Stability Analysis of a Landfill Model Accepting MSW and Lime Sludge Disposed as Discrete Layers Considering Circular Failure

73
1.5
00
1.5
00
1.500
1.60
0
1.6
00
1.6
00
1.600
1.70
0
1.7
00
1.7
00
1.7
00
1.800
1.800
1.8
00
1.8
00
1.900
1.9
00
1.414
Description: MSW onlySoil Model: Shear/Normal Fn.Unit Weight: 59 (SD=5)
Reliability Index: 9.89Standard Dev.: 0.042
Factor of Safety: 1.414
Landfill accepting biosolids disposed as discrete layers
Description: MSW + 30% BSSoil Model: Mohr-CoulombUnit Weight: 63 (SD=5)Cohesion: 674 (SD=72)Phi: 11.21 (SD=1)
Description: MSW + 15% BSSoil Model: Mohr-CoulombUnit Weight: 61 (SD=5)Cohesion: 911 (SD=72)Phi: 12.29 (SD=1)
Description: BS onlySoil Model: No StrengthUnit Weight: 35 (SD=5)
Side Slope 1:4
Horizontal Distance (ft) (x 1000)0.00 0.05 0.10 0.15 0.20 0.25 0.30 0.35 0.40 0.45 0.50 0.55 0.60 0.65 0.70 0.75 0.80 0.85 0.90 0.95 1.00 1.05 1.10 1.15
Ver
tical
hei
ght (
ft)
0
50
100
150
200
250
300
350
400
450
500
Figure 4.14. Stability Analysis of a Landfill Model accepting MSW and Biosolids Disposed as Discrete Layers Considering Circular Failure with Side Slope 1:4

74
It was known from the previous models that when biosolids or lime sludge was disposed as discrete layers, they reduced the factor of safety considerably. The next set of models was developed such that the sludges were mixed in various percentages by weight with MSW and landfilled as discrete layers in order to study the effect of increasing the amount of biosolids in the landfill. Figure 4.5 and Figure 4.6 show analysis results on landfill models accepting sludges which are disposed in landfills as discrete layers after mixing with MSW at 15% by weight, while Figure 4.7 and Figure 4.7 show analysis results for landfill models accepting sludges which are disposed in landfills as discrete layers after mixing with MSW at 50% by weight
It may be concluded from the above slope stability analysis that the mixing of sludges with MSW results in an increase in the slope stability of the landfill due to the increase in the moisture content. Table 4.9 shows the factor of safety for different landfill models accepting MSW and sludges which are disposed as discrete layers.
Table 4.9. Factor of Safety for Landfill Models accepting MSW and Sludges Disposed as Discrete Layers.
Description of Landfill Model
Factor of Safety for
Model Accepting Biosolids
Factor of Safety for
Model Accepting
Lime Sludge
1 Landfill accepting MSW only with change in shear with normal stress 2.67 2.67
2 Landfill accepting sludges which is filled as a discrete layer 1.15 1.41
3 Landfill accepting sludges which are filled as layers after mixing with MSW at 15% by weight 1.53 2.45
4
Landfill accepting sludges which are filled as a discrete layer after mixing it with MSW at 50% by weight 1.48 1.86

75
1.60
0
1.6
00
1.6
00
1.6
00
1.700
1.7
00
1.7
00
1.7
00
1.7
00
1.800
1.8
00
1.8
00
1.800
1.900
2.000
1.525
Reliability Index: 5.766Standard Dev.: 0.091
Factor of Safety: 1.525
Side slope 1:3
Landfills accepting biosolids which are disposed as layers after mixing with MSw at 15% by weight
Description: MSW + 15% BSSoil Model: Mohr-CoulombUnit Weight: 61 (SD=5)Cohesion: 911 (SD=72)Phi: 12.29 (SD=1)Pore-Air Pressure: 0
Horizontal Distance (ft) (x 1000)0.00 0.05 0.10 0.15 0.20 0.25 0.30 0.35 0.40 0.45 0.50 0.55 0.60 0.65 0.70 0.75 0.80 0.85 0.90 0.95 1.00 1.05 1.10 1.15
Ver
tical
hei
ght (
ft)
0
50
100
150
200
250
300
350
400
450
500
Figure 4.15. Stability Analysis of a Landfill Model Accepting MSW and Biosolids Disposed as Discrete Layers after Mixing With MSW at 15% by Weight

76
2.453
Description: MSW onlySoil Model: Shear/Normal Fn.Unit Weight: 59 (SD=5)
Description: MSW + 15% LSSoil Model: Mohr-CoulombUnit Weight: 61 (SD=5)
Reliability Index: 19.325Standard Dev.: 0.075
Factor of Safety: 2.453
Landfill accepting lime sludge which are disposed as layers after mixing with MSW at 15% by weight
Horizontal Distance (ft) (x 1000)0.00 0.05 0.10 0.15 0.20 0.25 0.30 0.35 0.40 0.45 0.50 0.55 0.60 0.65 0.70 0.75 0.80 0.85 0.90 0.95 1.00 1.05 1.10 1.15
Ver
tical
hei
ght (
ft)
0
50
100
150
200
250
300
350
400
450
500
Figure 4.16. Stability Analysis of a Landfill Model Accepting MSW and Lime Sludge Which are Disposed As Discrete Layers after Mixing with MSW at 15% by
Weight
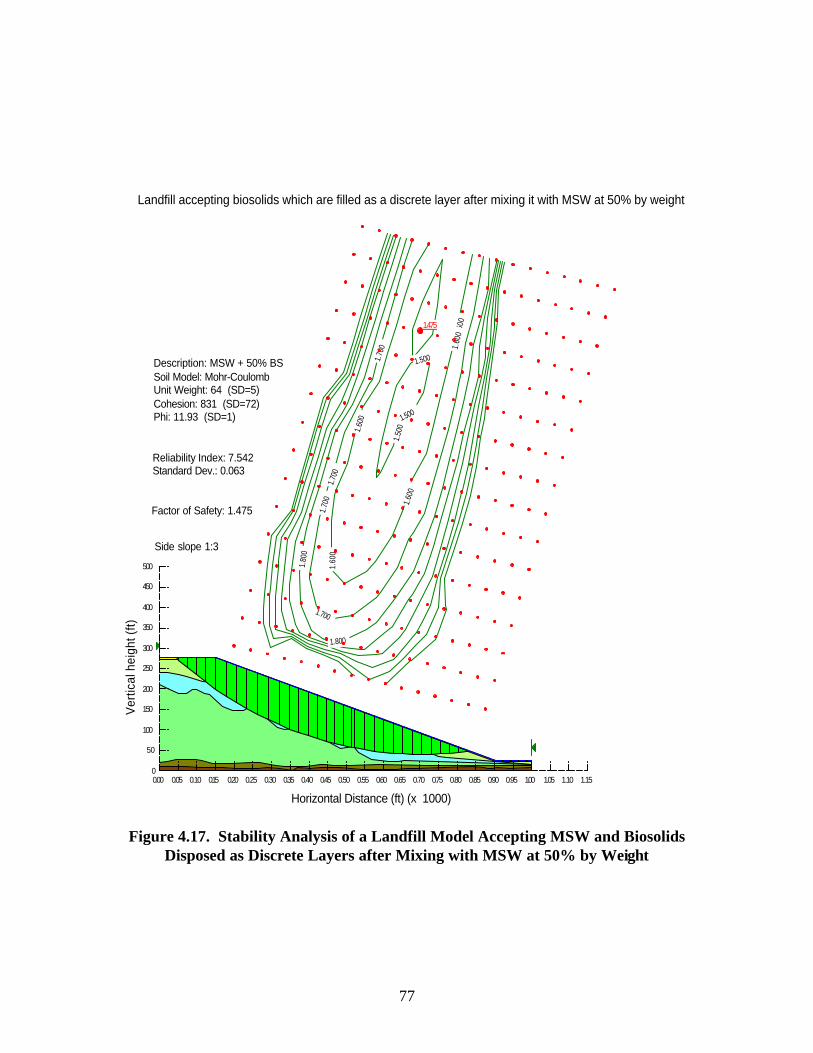
77
1.5
00 1.500
1.500
1.6
00
1.6
00
1.6
00
1.6
00
1.6
00
1.700
1.7
00
1.70
0
1.7
00
1.800
1.8
00
1.475
Factor of Safety: 1.475
Reliability Index: 7.542Standard Dev.: 0.063
Description: MSW + 50% BSSoil Model: Mohr-CoulombUnit Weight: 64 (SD=5)Cohesion: 831 (SD=72)Phi: 11.93 (SD=1)
Landfill accepting biosolids which are filled as a discrete layer after mixing it with MSW at 50% by weight
Side slope 1:3
Horizontal Distance (ft) (x 1000)
0.00 0.05 0.10 0.15 0.20 0.25 0.30 0.35 0.40 0.45 0.50 0.55 0.60 0.65 0.70 0.75 0.80 0.85 0.90 0.95 1.00 1.05 1.10 1.15
Ver
tical
hei
ght (
ft)
0
50
100
150
200
250
300
350
400
450
500
Figure 4.17. Stability Analysis of a Landfill Model Accepting MSW and Biosolids Disposed as Discrete Layers after Mixing with MSW at 50% by Weight
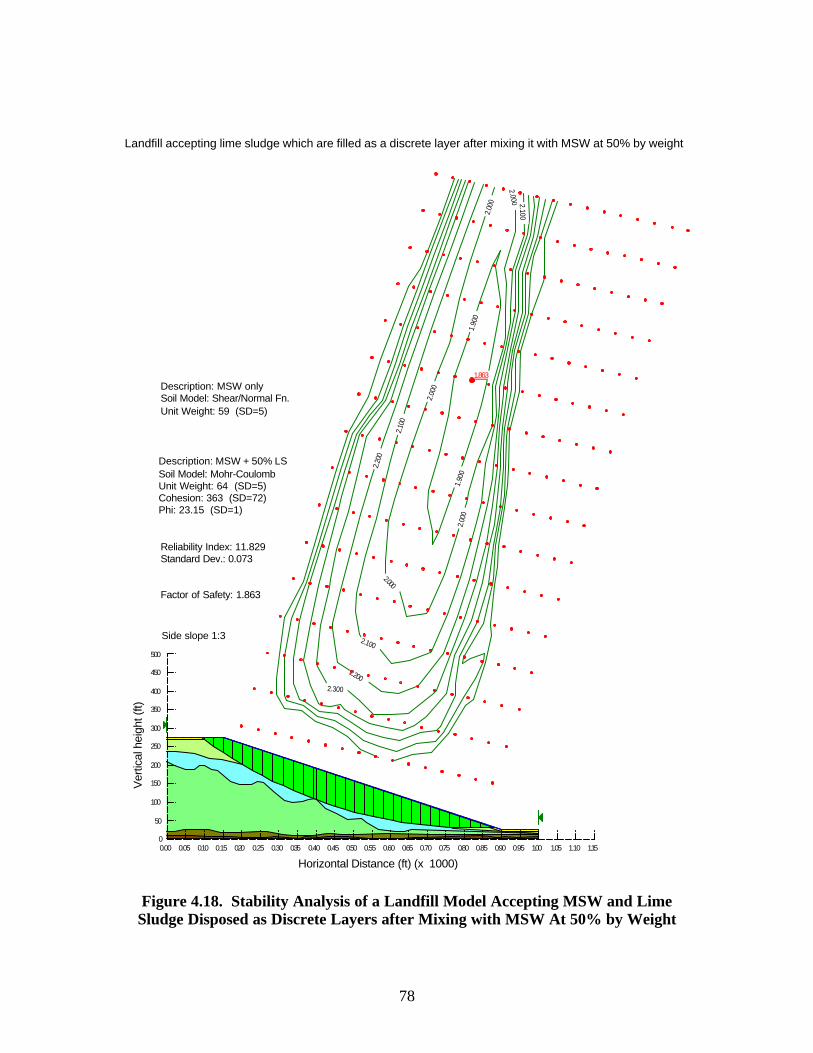
78
1.9
00
1.9
00
2.000
2.0
00
2.0
00
2.0
00
2.000
2.100
2.1
00
2.100
2.200
2.2
00
2.300
1.863
Factor of Safety: 1.863
Reliability Index: 11.829Standard Dev.: 0.073
Description: MSW + 50% LSSoil Model: Mohr-CoulombUnit Weight: 64 (SD=5)Cohesion: 363 (SD=72)Phi: 23.15 (SD=1)
Landfill accepting lime sludge which are filled as a discrete layer after mixing it with MSW at 50% by weight
Side slope 1:3
Description: MSW onlySoil Model: Shear/Normal Fn.Unit Weight: 59 (SD=5)
Horizontal Distance (ft) (x 1000)0.00 0.05 0.10 0.15 0.20 0.25 0.30 0.35 0.40 0.45 0.50 0.55 0.60 0.65 0.70 0.75 0.80 0.85 0.90 0.95 1.00 1.05 1.10 1.15
Ver
tical
hei
ght (
ft)
0
50
100
150
200
250
300
350
400
450
500
Figure 4.18. Stability Analysis of a Landfill Model Accepting MSW and Lime Sludge Disposed as Discrete Layers after Mixing with MSW At 50% by Weight

79
The factor of safety for landfill accepting biosolids which are mixed with MSW at 15% by weight and disposed as a discrete layer was found to be 1.525 and the factor of safety for the same landfill with biosolids mixed at 50% by weight was found to be 1.475. The factor of safety for landfill accepting lime sludge which are mixed with MSW at 15% by weight and disposed as a discrete layer was found to be 2.45 and the factor of safety for the same landfill with lime sludge mixed at 50% by weight was found to be 1.865.
Landfills disposing biosolids after mixing with MSW at both 15% and 50% by weight showed factors of safety close to 1.5 which is the minimum required, therefore disposing of biosolids in discrete layers is not recommended even if it is disposed after mixing with MSW as this practice creates a weak continuous layer which becomes a potential failure plane. On the other hand, in the case of lime sludge being disposed as discrete layers after mixing with MSW at both 15% and 50% by weight, a factor of safety of more than 1.5 was predicted, thus suggesting that it is safer to dispose lime sludge in landfills as discrete layers due to the high shear strength of lime sludge mixed with MSW.
It was concluded from the previous analysis that disposing of biosolids as discrete
layers is not a safe practice. Hence it was decided to conduct more analys is on landfills accepting biosolids which are disposed as pockets of biosolids within the landfill as shown in Figure 4.9. Analysis was also conducted on landfills accepting lime sludge as shown in Figure 4.10.
Analysis of landfill models accepting biosolids showed a factor of safety of 2.27
which was considerably higher than that shown by the landfill model with biosolids disposed as a discrete layer. This was also the case with landfill models accepting lime sludge which showed a factor of safety of 2.36.
The landfill slope was considered to be stable for both cases: biosolids and lime
sludge. The landfill models disposing sludges as discrete pockets were found to be more stable than landfill models disposing sludges as layers. It should be noted in this case that the circular failure plane tends to pass through an imaginary plane joining the sludge pockets.
It was observed from the previous model, that when the sludges are disposed as
pockets, the landfill slope is stable with a relatively high factor of safety. The next step was to conduct more stability analysis on landfill models accepting sludges which are mixed with MSW at different percentages by weight and disposed as pockets.
Figure 4.11 and Figure 4.12 show landfill models accepting sludges which are
disposed after mixing with MSW at 15% by weight, while Figure 4.13 and Figure 4.14 show the analysis results for the same landfill models but with sludges mixed with MSW at 50% by weight.

80
2.300
2.3
00
2.40
0
2.400
2.400
2.4
00
2.4
00
2.4
00
2.50
0
2.5
00
2.500
2.6
00
2.600
2.267
Description: MSW onlySoil Model: Shear/Normal Fn.Unit Weight: 59 (SD=5)
Reliability Index: 34.968Standard Dev.: 0.036
Factor of Safety: 2.267
Landfill accepting biosolids which is filled as pockets of biolsolids in the landfill
Side slope 1:3
Description: BS onlySoil Model: No StrengthUnit Weight: 35 (SD=5)
Horizontal Distance (ft) (x 1000)0.00 0.05 0.10 0.15 0.20 0.25 0.30 0.35 0.40 0.45 0.50 0.55 0.60 0.65 0.70 0.75 0.80 0.85 0.90 0.95 1.00 1.05 1.10 1.15
Ver
tical
hei
ght (
ft)
0
50
100
150
200
250
300
350
400
450
500
Figure 4.19. Stability Analysis of a Landfill Model Accepting MSW and Biosolids
Disposed as Pockets within the Landfill

81
2.400
2.500
2.5
00 2
.500
2.500
2.6
00
2.600
2.700
2.700
2.800
2.900
2.900
2.358
Description: MSW + 50% LSSoil Model: Mohr-CoulombUnit Weight: 64 (SD=5)
Reliability Index: 42.382Standard Dev.: 0.032
Factor of Safety: 2.358
Landfill accepting lime sludge which is filled as pockets in the landfill
Side slope 1:3
Horizontal Distance (ft) (x 1000)0.00 0.05 0.10 0.15 0.20 0.25 0.30 0.35 0.40 0.45 0.50 0.55 0.60 0.65 0.70 0.75 0.80 0.85 0.90 0.95 1.00 1.05 1.10 1.15
Ver
tical
hei
ght (
ft)
0
50
100
150
200
250
300
350
400
450
500
Figure 4.20. Stability Analysis of a Landfill Model Accepting MSW and Lime Sludge Disposed as Pockets within the Landfill

82
2.400
2.500
2.5
00
2.500
2.6
00
2.6
00
2.374
Factor of Safety: 2.374
Reliability Index: 35.517Standard Dev.: 0.039
Description: MSW onlySoil Model: Shear/Normal Fn.Unit Weight: 59 (SD=5)Shear/Normal Fn. #: 1
Description: MSW + 15% BSSoil Model: Mohr-CoulombUnit Weight: 61 (SD=5)Cohesion: 911 (SD=72)Phi: 12.29 (SD=1)
Side slope 1:3
Landfill accepting biosolids which are filled as pockets after being mixed with MSW at 15% by weight
Horizontal Distance (ft) (x 1000)0.00 0.05 0.10 0.15 0.20 0.25 0.30 0.35 0.40 0.45 0.50 0.55 0.60 0.65 0.70 0.75 0.80 0.85 0.90 0.95 1.00 1.05 1.10 1.15
Ver
tical
hei
ght (
ft)
0
50
100
150
200
250
300
350
400
450
500
Figure 4.21. Stability Analysis of a Landfill Model Accepting MSW and Biosolids Disposed as Pockets after Mixing with MSW at 15% by Weight

83
2.617
Factor of Safety: 2.617
Reliability Index: 46.756Standard Dev.: 0.035
Description: MSW onlySoil Model: Shear/Normal Fn.Unit Weight: 59 (SD=5)Shear/Normal Fn. #: 1
Description: MSW + 15% LSSoil Model: Mohr-CoulombUnit Weight: 64 (SD=5)Cohesion: 513 (SD=72)Phi: 29.4 (SD=1)
Side slope 1:3
Landfill accepting lime sludge which are filled as pockets after being mixed with MSW at 15% by weight
Horizontal Distance (ft) (x 1000)0.00 0.05 0.10 0.15 0.20 0.25 0.30 0.35 0.40 0.45 0.50 0.55 0.60 0.65 0.70 0.75 0.80 0.85 0.90 0.95 1.00 1.05 1.10 1.15
Ver
tical
hei
ght (
ft)
0
50
100
150
200
250
300
350
400
450
500
Figure 4.22. Stability Analysis of a Landfill Model Accepting MSW and Lime Sludge Disposed as Pockets after Mixing with MSW at 15% by Weight
84
2.50
0
2.5
00
2.500
2.6
00
2.600
2.361
Factor of Safety: 2.361
Reliability Index: 31.797Standard Dev.: 0.043
Description: MSW + 50% BSSoil Model: Mohr-CoulombUnit Weight: 64 (SD=5)Cohesion: 831 (SD=72)Phi: 11.93 (SD=1)
Landfill accepting biosolids which are filled as pockets after mixing with MSW at 50% by weight
Side slope 1:3
Horizontal Distance (ft) (x 1000)
0.00 0.05 0.10 0.15 0.20 0.25 0.30 0.35 0.40 0.45 0.50 0.55 0.60 0.65 0.70 0.75 0.80 0.85 0.90 0.95 1.00 1.05 1.10 1.15
Ver
tical
hei
ght (
ft)
0
50
100
150
200
250
300
350
400
450
500
Figure 4.23. Stability Analysis of a Landfill Model Accepting MSW and Biosolids Disposed as Pockets of Biosolids after Mixing with MSW at 50% by Weight

85
2.60
0
2.6
00
2.500
Factor of Safety: 2.5
Reliability Index: 25.598Standard Dev.: 0.059
Description: Sand LinerSoil Model: Mohr-CoulombUnit Weight: 30 (SD=3)Cohesion: 0 (SD=0)Phi: 40 (SD=5)
Landfill accepting limesludge which are filled as pockets after mixixng with MSW at 50% by weight
Description: MSW + 50% LSSoil Model: Mohr-CoulombUnit Weight: 64 (SD=5)Cohesion: 363 (SD=72)Phi: 23.15 (SD=1)
Horizontal Distance (ft) (x 1000)
0.00 0.05 0.10 0.15 0.20 0.25 0.30 0.35 0.40 0.45 0.50 0.55 0.60 0.65 0.70 0.75 0.80 0.85 0.90 0.95 1.00 1.05 1.10 1.15
Ver
tical
hei
ght
(ft)
0
50
100
150
200
250
300
350
400
450
500
Figure 4.24. Stability Analysis of a Landfill Model Accepting MSW and Lime Sludge Disposed as Pockets of Biosolids after Mixing with MSW at 50% by Weight
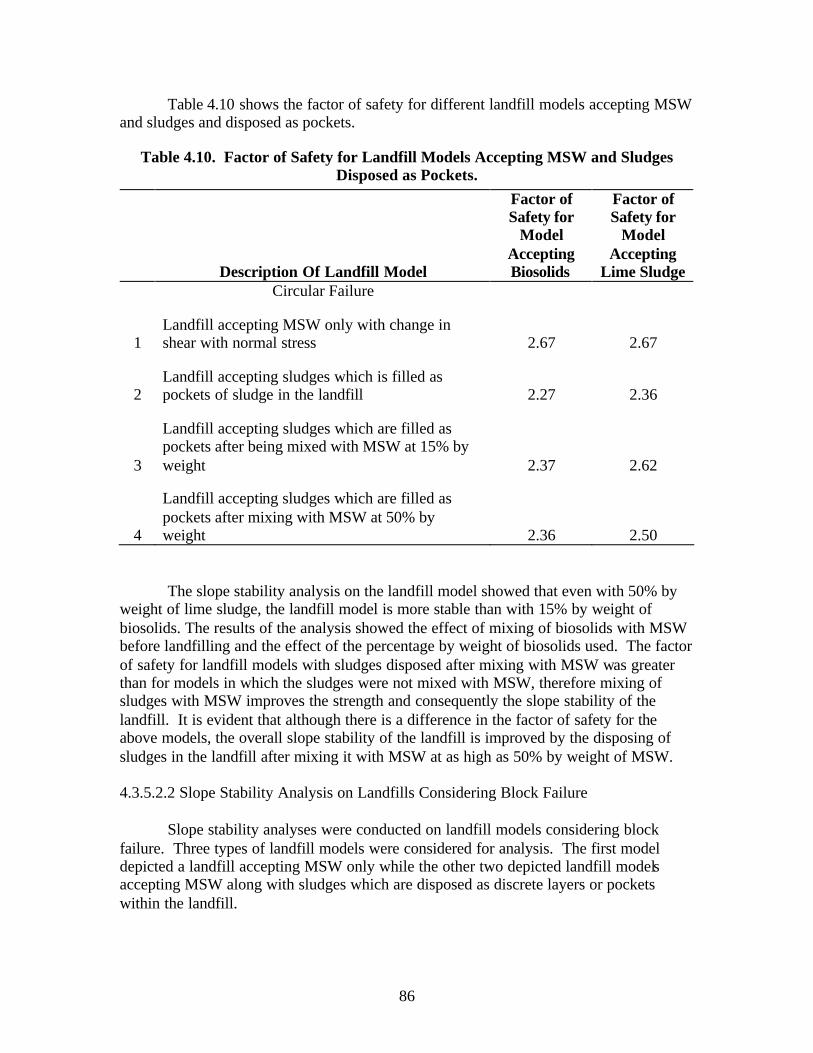
86
Table 4.10 shows the factor of safety for different landfill models accepting MSW and sludges and disposed as pockets.
Table 4.10. Factor of Safety for Landfill Models Accepting MSW and Sludges Disposed as Pockets.
Description Of Landfill Model
Factor of Safety for
Model Accepting Biosolids
Factor of Safety for
Model Accepting
Lime Sludge Circular Failure
1 Landfill accepting MSW only with change in shear with normal stress 2.67 2.67
2 Landfill accepting sludges which is filled as pockets of sludge in the landfill 2.27 2.36
3
Landfill accepting sludges which are filled as pockets after being mixed with MSW at 15% by weight 2.37 2.62
4
Landfill accepting sludges which are filled as pockets after mixing with MSW at 50% by weight 2.36 2.50 The slope stability analysis on the landfill model showed that even with 50% by
weight of lime sludge, the landfill model is more stable than with 15% by weight of biosolids. The results of the analysis showed the effect of mixing of biosolids with MSW before landfilling and the effect of the percentage by weight of biosolids used. The factor of safety for landfill models with sludges disposed after mixing with MSW was greater than for models in which the sludges were not mixed with MSW, therefore mixing of sludges with MSW improves the strength and consequently the slope stability of the landfill. It is evident that although there is a difference in the factor of safety for the above models, the overall slope stability of the landfill is improved by the disposing of sludges in the landfill after mixing it with MSW at as high as 50% by weight of MSW. 4.3.5.2.2 Slope Stability Analysis on Landfills Considering Block Failure
Slope stability analyses were conducted on landfill models considering block
failure. Three types of landfill models were considered for analysis. The first model depicted a landfill accepting MSW only while the other two depicted landfill models accepting MSW along with sludges which are disposed as discrete layers or pockets within the landfill.

87
Slope stability analysis of a landfill model accepting MSW only yielded a factor of safety of 2.72 considering block failure as shown in Figure 4.25. This factor of safety was close to the landfill model accepting MSW only considering circular failure which showed a factor of safety of 2.67. Thus the two potential methods of failure seem to converge quite well.
The landfill slope was considered to be stable as the factor was greater than 1.5
which is the minimum required factor of safety for the stability of a landfill. This model also showed that the circular failure was slightly more critical than block failure for this model of landfill accepting MSW only.
2.716
Factor of Safety: 2.716
Reliability Index: 43.021Standard Dev.: 0.04
Description: MSW onlySoil Model: Shear/Normal Fn.Unit Weight: 59 (SD=5)Shear/Normal Fn. #: 1
Landfill accepting MSW only with change in shear with normal stress
Side slope 1:3
Horizontal Distance (ft) (x 1000)
0.00 0.05 0.10 0.15 0.20 0.25 0.30 0.35 0.40 0.45 0.50 0.55 0.60 0.65 0.70 0.75 0.80 0.85 0.90 0.95 1.00
Ver
tical
hei
ght (
ft)
0
50
100
150
200
250
300
350
400
450
500
Figure 4.25. Stability Analysis of a Landfill Model Accepting MSW only Considering Block Failure
Slope stability analysis of a landfill model accepting MSW and biosolids which
are disposed as discrete layers gave a factor of safety of 1.301 considering block failure, while landfill models accepting lime sludge showed a factor of safety of 1.708. Figure 4.26 and Figure 4.27 show the analysis of landfill models accepting biosolids and lime sludges which are disposed as discrete layers.
The analyses suggested that the landfill slope is not stable in case of biosolids as
the factor of safety was less than 1.5, while in case of lime sludge it is barely stable. The values of factor of safety is slightly higher than in the same models considering circular failure, thus reconfirming our conclusion that the circular type of failure is more critical.
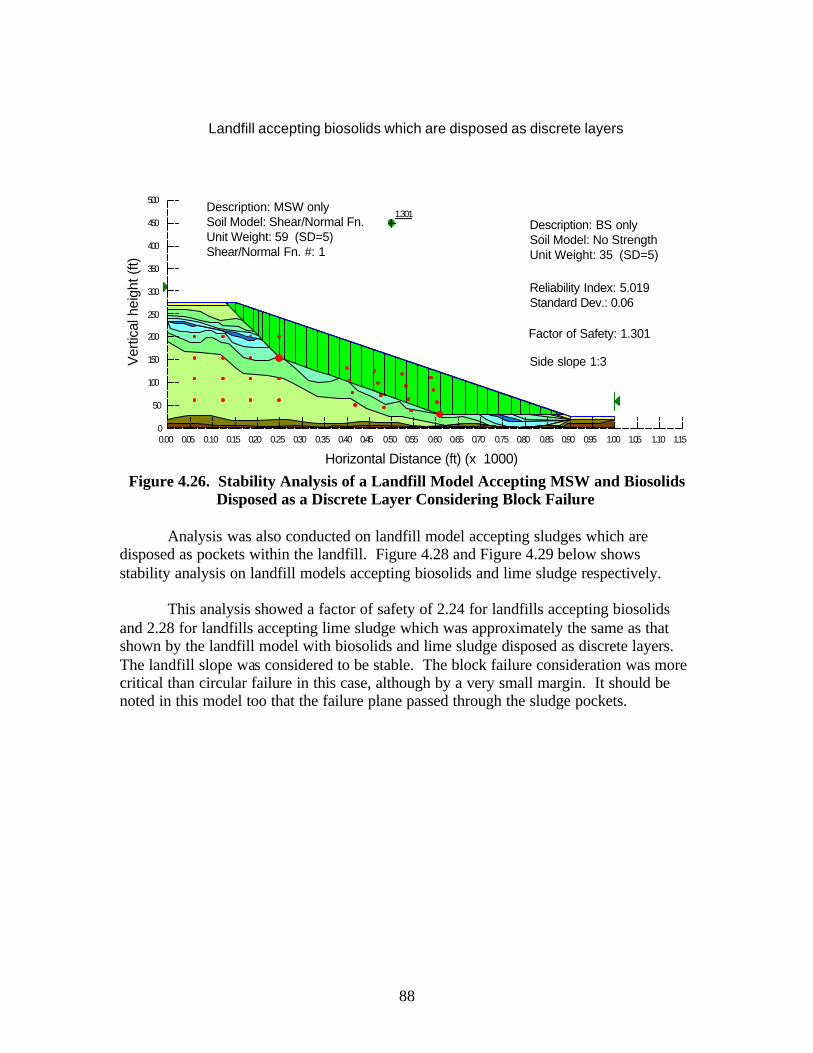
88
1.301Description: MSW onlySoil Model: Shear/Normal Fn.Unit Weight: 59 (SD=5)Shear/Normal Fn. #: 1
Description: BS onlySoil Model: No StrengthUnit Weight: 35 (SD=5)
Reliability Index: 5.019Standard Dev.: 0.06
Factor of Safety: 1.301
Landfill accepting biosolids which are disposed as discrete layers
Side slope 1:3
Horizontal Distance (ft) (x 1000)0.00 0.05 0.10 0.15 0.20 0.25 0.30 0.35 0.40 0.45 0.50 0.55 0.60 0.65 0.70 0.75 0.80 0.85 0.90 0.95 1.00 1.05 1.10 1.15
Ver
tical
hei
ght (
ft)
0
50
100
150
200
250
300
350
400
450
500
Figure 4.26. Stability Analysis of a Landfill Model Accepting MSW and Biosolids
Disposed as a Discrete Layer Considering Block Failure
Analysis was also conducted on landfill model accepting sludges which are disposed as pockets within the landfill. Figure 4.28 and Figure 4.29 below shows stability analysis on landfill models accepting biosolids and lime sludge respectively.
This analysis showed a factor of safety of 2.24 for landfills accepting biosolids and 2.28 for landfills accepting lime sludge which was approximately the same as that shown by the landfill model with biosolids and lime sludge disposed as discrete layers. The landfill slope was considered to be stable. The block failure consideration was more critical than circular failure in this case, although by a very small margin. It should be noted in this model too that the failure plane passed through the sludge pockets.

89
1.708
Side slope 1:3
Reliability Index: 13.579Standard Dev.: 0.052
Factor of Safety: 1.708
Description: MSW + 15% LSSoil Model: Mohr-CoulombUnit Weight: 61 (SD=5)Cohesion: 513 (SD=72)Phi: 29.4 (SD=1)
Description: MSW + 50% LSSoil Model: Mohr-CoulombUnit Weight: 64 (SD=5)Cohesion: 363 (SD=72)Phi: 23.15 (SD=1)
Description: LS onlySoil Model: No StrengthUnit Weight: 35 (SD=5)
Landfill accepting lime sludge which are disposed as discrete layers
Horizontal Distance (ft) (x 1000)
0.00 0.05 0.10 0.15 0.20 0.25 0.30 0.35 0.40 0.45 0.50 0.55 0.60 0.65 0.70 0.75 0.80 0.85 0.90 0.95 1.00 1.05 1.10 1.15
Ver
tical
hei
ght (
ft)
0
50
100
150
200
250
300
350
400
450
500
Figure 4.27. Stability Analysis of a Landfill Model Accepting MSW and Lime Sludge Disposed as a Discrete Layer Considering Block Failure

90
2.241
Landfill accepting biosolids which are disposed as pockets within the landfill
Factor of Safety: 2.241
Reliability Index: 34.37Standard Dev.: 0.036
Side slope 1:3
Horizontal Distance (ft) (x 1000)0.00 0.05 0.10 0.15 0.20 0.25 0.30 0.35 0.40 0.45 0.50 0.55 0.60 0.65 0.70 0.75 0.80 0.85 0.90 0.95 1.00 1.05 1.10 1.15
Ver
tical
hei
ght (
ft)
0
50
100
150
200
250
300
350
400
450
500
Figure 4.28. Stability Analysis of a Landfill Model Accepting MSW and Biosolids Disposed as Pockets within the Landfill Considering Block Failure.

91
2.279
Landfill accepting lime sludge which are disposed aas pockets
Factor of Safety: 2.279
Reliability Index: 31.494Standard Dev.: 0.041
Side slope 1:3
Description: MSW onlySoil Model: Shear/Normal Fn.Unit Weight: 59 (SD=5)
Description: MSW + 15% LSSoil Model: Mohr-CoulombUnit Weight: 64 (SD=5)Cohesion: 911 (SD=72)Phi: 12.29 (SD=1)
Description: MSW + 50% LSSoil Model: Mohr-CoulombUnit Weight: 64 (SD=5)Cohesion: 831 (SD=72)Phi: 11.93 (SD=1)
Description: LS onlySoil Model: No StrengthUnit Weight: 35 (SD=5)
Horizontal Distance (ft) (x 1000)0.00 0.05 0.10 0.15 0.20 0.25 0.30 0.35 0.40 0.45 0.50 0.55 0.60 0.65 0.70 0.75 0.80 0.85 0.90 0.95 1.00 1.05 1.10 1.15
Ver
tical
hei
ght
(ft)
0
50
100
150
200
250
300
350
400
450
500
Figure 4.29. Stability Analysis of a Landfill Model Accepting MSW and Lime
Sludge Disposed as Pockets within the Landfill Considering Block Failure
4.3.5.2.3 Sensitivity Analysis A sensitivity analysis was carried out on landfill models accepting MSW. As discussed before, two type of failure functions were considered to model the material behavior, namely the shear-normal function and the Mohr-Coulomb function. The present section discussed the analysis conducted to study the sensitivity of the model to change in its input parameters such as unit weight of MSW, cohesion and friction angle. Figure 4.30 below shows the sensitivity analysis of unit weight conducted for a landfill model accepting MSW only, with failure criteria for waste defined by the shear-normal function. It is evident from Figure 4.30 that the FS decreases rapidly with increase in unit weight since the mass of the material is increasing and becoming heavier. This causes an increase in the forces that will move the material internally to shear and fail. However, after the unit weight reaches a value of about 50 lb/ft3 the FS remains almost constant.

92
0.0
1.0
2.0
3.0
4.0
5.0
0 20 40 60 80 100 120 140 160
Wet Unit Weight (pcf)
Fact
or o
f S
afet
y
Figure 4.30. Variation of Factor of Safety with Unit Weight of MSW (MSW Failure
Model: Shear-Normal Function) Figure 4.31, 4.32 and 4.33 below shows the sensitivity of the factor of safety to the input parameters: unit weight, cohesion and the friction angle respectively, for a landfill model accepting MSW only. The failure criterion for waste in this model was defined by the Mohr-Coulomb model.
Figure 4.31 displays the tendency of the FS to decrease with increase in wet unit weight similar to the previous case. In fact, the results of the two soil material models – shear normal function and Mohr Coulomb function are quite similar as seen from comparing Figures 4.30 and 4.31 which provides additional verification of the results.
From Figures 4.32 and 4.33, it is clear that there is a linear relationship between the FS and the values of cohesion and angle of internal friction respectively. As expected, increase in cohesion of the material or an increase in its angle of friction provides more strength to the material and results in an increase in its shear strength which in turn translates to a higher factor of safety against slope failure.

93
Unit Weight
R2 = 1
00.5
11.5
22.5
33.5
44.5
5
0 50 100 150 200
Unit weight (pcf)
Fac
tor
of
Saf
ety
Figure 4.31. Variation of Factor of Safety with Unit Weight of MSW (MSW Failure
Model: Mohr-Coulomb Function)
Cohesion
R2 = 0.9999
0
0.5
1
1.5
2
2.5
3
3.5
0 500 1000 1500
Cohesion (psf)
Fac
tor
of S
afet
y
Figure 4.32. Sensitivity Analysis of Cohesion of MSW for Landfill Accepting MSW
(MSW Failure Model: Mohr-Coulomb Function)

94
Friction Angle
R2 = 1
00.5
11.5
22.5
33.5
44.5
0 10 20 30 40 50
Friction Angle
fact
or
of
Saf
ety
Figure 4.33. Sensitivity Analysis of Friction Angle of MSW for Landfill Accepting
MSW (MSW Failure Model: Mohr-Coulomb Function)
4.3.5.2.4 Summary of Slope Stability Analyses
From the laboratory testing it was evident tha t lime sludge has more strength than
biosolids. The landfills modeled with disposal of lime sludge showed more stability as compared to the landfill models with disposal of biosolids. Table 4.11 shows the various landfill models considered and the corresponding factor of safety with co-disposal of biosolids and lime sludge.
It should be noted from Table 4.11 that for each of the cases, the landfill accepting lime sludge has a higher factor of safety than the ones accepting biosolids. This is probably because the total solid content of lime sludge is greater than biosolids.

95
Table 4.11. Landfill Models Considered for Slope Stability Analysis and the Corresponding Factor of Safety for Co-Disposal of Biosolids and Lime Sludge
Description of Landfill Model
Factor of Safety for
Model Accepting Biosolids
Factor of Safety for
Model Accepting
Lime Sludge Circular Failure
1 Landfill accepting MSW only with change in shear with normal stress 2.67 2.67
2 Landfill accepting sludges which is filled as a discrete layer 1.15 1.41
3 Landfill accepting sludges which are filled as layers after mixing with MSW at 15% by weight 1.53 2.45
4
Landfill accepting sludges which are filled as a discrete layer after mixing it with MSW at 50% by weight 1.48 1.87
5 Landfill accepting sludges which is filled as pockets of sludge in the landfill 2.27 2.36
6
Landfill accepting sludges which are filled as pockets after being mixed with MSW at 15% by weight 2.37 2.62
7
Landfill accepting sludges which are filled as pockets after mixing with MSW at 50% by weight 2.36 2.50
Block failure
8 Landfill accepting MSW only with change in shear with normal stress 2.72 2.72
9 Landfill accepting sludges which are disposed as discrete layers 1.30 1.71
10 Landfill accepting sludges which are disposed as pockets within the landfill 2.24 2.28

96
4.4 Economic Analysis
Another factor that influences the use of landfilling as a feasible disposal option for residuals is economics. This section will cover the following points:
• Air space issues, and • Economic comparison of land application of biosolids versus landfilling
The section will also include a case study which compares landfilling and land application costs for a specific community.
4.4.1 Air Space Issues One of the concerns expressed by landfill operators and owners is that residuals take up valuable air space causing a reduction in the benefit to the landfills. An attempt was made to investigate this claim during geotechnical laboratory experimentation. The Modified Proctor Compaction test discussed in Section 4.5.5.1 addressed this issue. The experiments showed that the density of MSW and biosolids mixture increases as the percentage of biosolids in the mixture increases. Thus, the volume occupied by a given weight of the mixture is reduced as the quantity of biosolids increases. Also, it has been shown in the previous sections that the introduction of biosolids in landfills leads to faster waste degradation and stabilization. This process reduces the volume of waste and will actually generate air space in time. These arguments seem to put to rest any fears of biosolids occupying extra air space that would otherwise be used by MSW.
4.4.2 Alternative Comparison
An economic analysis for this research was performed (Yeats, 2003). The following scenarios were considered:
• Landfilling of biosolids • Class A biosolids treatment and disposal options – Aerated static pile composting and
compost drying/spreading • Class B biosolids treatment and disposal options
- Aerobic digestion, thickening of biosolids to 6% dry solids and hauling to land application sites for disposal
- Thickening of biosolids to 3% dry solids, lime stabilization and hauling to land application sites for disposal
- Lime stabilization of waste sludge at 1.5% dry solids and hauling to land application sites for disposal
Table 4.12 presents a summary of the economic analysis.

97
Table 4.12. Cost Summary of Various Treatment and Disposal Options for Biosolids
Treatment Option Treatment and Hauling Cost ($/wet ton)
Composting and Land Application (Class A)
Aerated Static Pile Composting and compost spreading/drying
66
Land Application (Class B) Aerobic Digestion, Thickening of biosolids to 6% dry solids and hauling to land application sites for disposal
52
Land Application (Class B) Thickening of biosolids to 3% dry solids, lime stabilization and hauling to land application sites for disposal
42
Land Application (Class B) Lime stabilization of waste sludge at 1.5% dry solids and hauling to land application sites for disposal
60
Landfilling 16% dry solids hauling costs 20 + tipping fees * * $32 - $45 per wet ton (landfill surveys)
Tipping fees used in Table 4.12 for landfills were obtained from surveys returned
and were in the range of $32 - $45 per wet ton. Consequently, the total disposal costs for landfilling were in the range of $52 - $65 per wet ton. The costs have been calculated on a 30-year present worth basis for a round trip hauling distance of 40 miles and a treatment plant capacity of 1 MGD.
It can be seen from the Table 4.12 that landfilling offers a competitive price range for disposal of biosolids. This price would become even more attractive if landfills reduced the tipping fees charged for biosolids. Given the economic advantages associated with the additional liquids provided by the biosolids, a reduced tipping fee may be justified. 4.4.2.1 Case Study
A case study has been included in this section as an exercise to demonstrate two features, the water balance of a co-disposal landfill and the costs for each of the disposal options.
Table 4.13 provides details of the calculations for examining biosolids disposal
(for more detailed calculations refer to Appendix D) for a 1 MGD wastewater treatment facility and a community in Central Florida contributing to this WWTP. It has been assumed that the wastewater production per person per day in the US is about 150 gallons (www.epa.gov). From this information, the population of the community was calculated. In the US, the average per capita per day production of MSW is 4.3 lb (Vesilind et al., 2002). It is assumed that a 1 MGD treatment plant generates about 0.85 tons of dry biosolids (Yeats, 2003), from which the relative percentages of biosolids and MSW
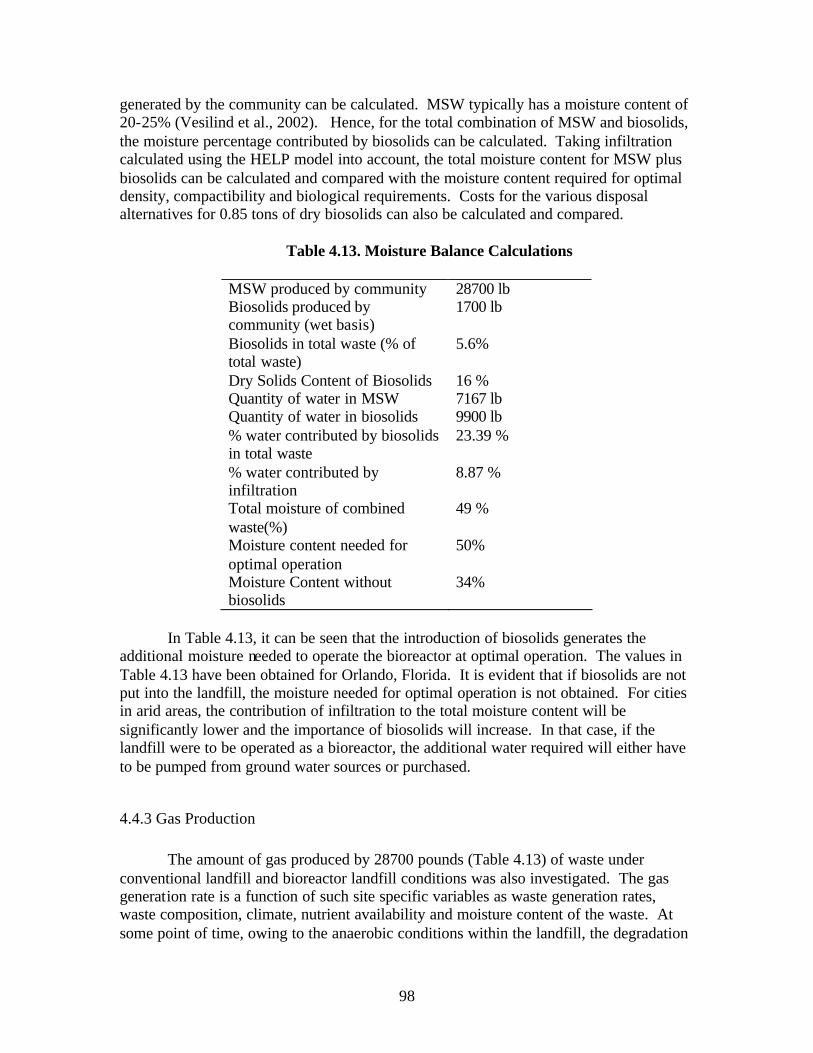
98
generated by the community can be calculated. MSW typically has a moisture content of 20-25% (Vesilind et al., 2002). Hence, for the total combination of MSW and biosolids, the moisture percentage contributed by biosolids can be calculated. Taking infiltration calculated using the HELP model into account, the total moisture content for MSW plus biosolids can be calculated and compared with the moisture content required for optimal density, compactibility and biological requirements. Costs for the various disposal alternatives for 0.85 tons of dry biosolids can also be calculated and compared.
Table 4.13. Moisture Balance Calculations
MSW produced by community 28700 lb Biosolids produced by community (wet basis)
1700 lb
Biosolids in total waste (% of total waste)
5.6%
Dry Solids Content of Biosolids 16 % Quantity of water in MSW 7167 lb Quantity of water in biosolids 9900 lb % water contributed by biosolids in total waste
23.39 %
% water contributed by infiltration
8.87 %
Total moisture of combined waste(%)
49 %
Moisture content needed for optimal operation
50%
Moisture Content without biosolids
34%
In Table 4.13, it can be seen that the introduction of biosolids generates the
additional moisture needed to operate the bioreactor at optimal operation. The values in Table 4.13 have been obtained for Orlando, Florida. It is evident that if biosolids are not put into the landfill, the moisture needed for optimal operation is not obtained. For cities in arid areas, the contribution of infiltration to the total moisture content will be significantly lower and the importance of biosolids will increase. In that case, if the landfill were to be operated as a bioreactor, the additional water required will either have to be pumped from ground water sources or purchased.
4.4.3 Gas Production The amount of gas produced by 28700 pounds (Table 4.13) of waste under
conventional landfill and bioreactor landfill conditions was also investigated. The gas generation rate is a function of such site specific variables as waste generation rates, waste composition, climate, nutrient availability and moisture content of the waste. At some point of time, owing to the anaerobic conditions within the landfill, the degradation

99
of waste will lead to the production of methane. Application of appropriate first-order kinetics parameters yielded gas production curves for both instances. The values of landfill gas generation rate constant (k) and methane generation potential (Lo) were calculated at the Orange County, Florida Landfill. Three cells were considered since 1973, two of which are closed and one is still receiving waste. Gas quantification data from the three cells were monitored and analyzed using regression analys is to yield a k of 0.04 yr-1 and Lo of 100m3/Mg. Data from ten full-scale landfills were analyzed to yield the values of k and Lo in bioreactor landfills (Reinhart et al., 2003). Table 4.14 gives details of the kinetic parameters used and the gas produced in a ten-year period for a conventional and a bioreactor landfill.
Table 4.14. Gas Production in a Conventional Landfill and a Bioreactor
Year Flow Rate for Conventional
Landfill (m3 /year) (k=0.04/year, Lo = 100m3/Mg)
Flow Rate for Bioreactor Landfill (m3/year)
(k=0.67/year, Lo = 96 m3/Mg) 2000 12200 1550000 2001 218000 1841000 2002 210000 942000 2003 202000 482000 2004 194000 247000 2005 186000 126000 2006 179000 64600 2007 172000 33000 2008 165000 16900 2009 159000 8700 2010 152000 4400 Sum
Figure 4.20 shows the gas production graphs for conventional and bioreactor.
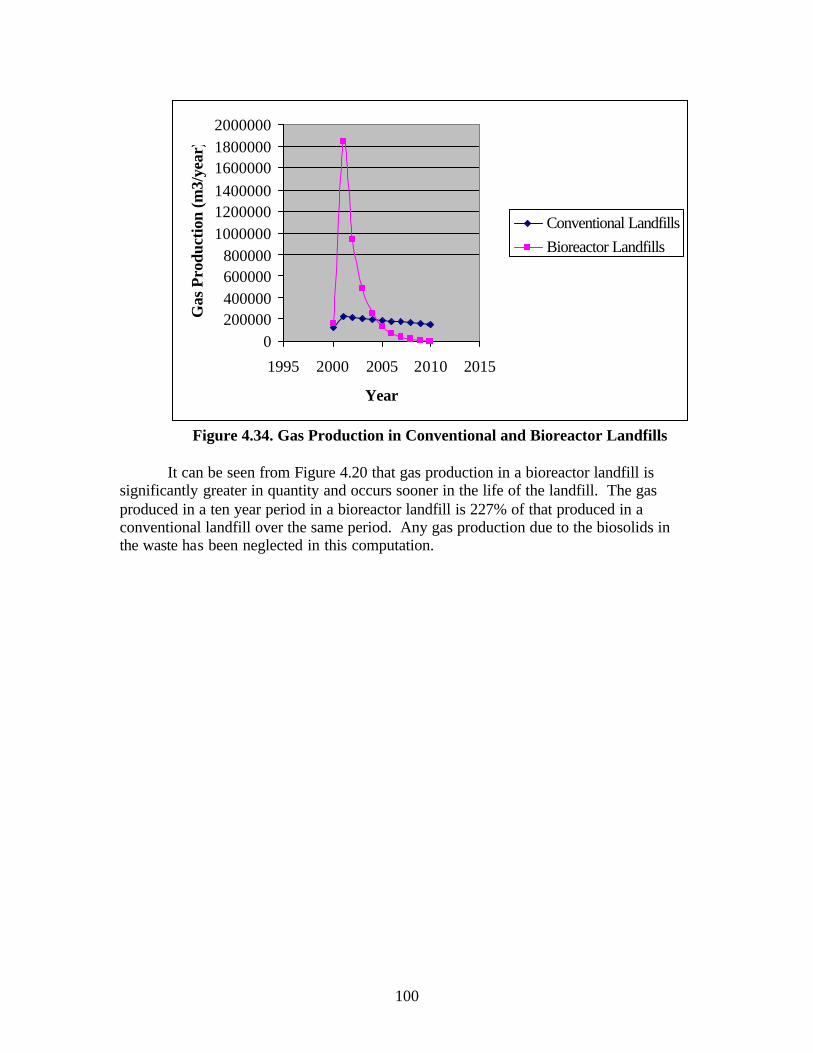
100
0200000400000600000800000
100000012000001400000160000018000002000000
1995 2000 2005 2010 2015
Year
Gas
Pro
duct
ion
(m3/
year
)
Conventional LandfillsBioreactor Landfills
Figure 4.34. Gas Production in Conventional and Bioreactor Landfills
It can be seen from Figure 4.20 that gas production in a bioreactor landfill is
significantly greater in quantity and occurs sooner in the life of the landfill. The gas produced in a ten year period in a bioreactor landfill is 227% of that produced in a conventional landfill over the same period. Any gas production due to the biosolids in the waste has been neglected in this computation.

101
CHAPTER 5 CONCLUSIONS AND RECOMMENDATIONS
5.1 Conclusions The purpose of this research was to compare landfilling of residuals with other
disposal options. Various issues associated with landfilling of biosolids such as impact on leachate quality, impact on geotechnical stability, impact on gas production, operational issues, air space issues and the relative economics of various disposal options were addressed in the course of this research. Leachate data were obtained from the Florida Department of Environmental Protection and subjected to a statistical analysis to evaluate the impact of co-disposal on leachate quality. Also, an economic analysis was conducted to compare the costs of various disposal options. Based on the outcome of these analyses and literature review, the following conclusions can be made:
• Co-disposal of biosolids with MSW leads to operational issues such as difficulty in
compaction, formation of localized soft spots, and odors. These challenges can be rectified by adding compounds or dry MSW to biosolids which will reduce their moisture content and increase their solids content, in the process making them easier to handle and less odorous. However, if the purpose is to operate the landfill as a bioreactor, reducing the moisture content of the biosolids will eliminate the benefit of greater moisture input. In that case, the landfill operators would probably have to take extra care to mix the biosolids well with the MSW and cover the biosolids as quickly as possible.
• Co-disposal of biosolids with MSW was not found to have an adverse impact on
leachate quality. Because of the variability in the data, a statistical analysis was not very conclusive. However, a comparison of the average values of various parameters of landfills that accept biosolids with landfills that do not indicated that in most cases, there was no difference in leachate quality. This conclusion may be due to the fact that the percentage of biosolids is extremely small in comparison to the percentage of MSW thus making the effect of biosolids negligible. A literature review substantiates the fact that there is very little leaching of metals from biosolids in land application sites. If it is safe to land apply biosolids, it is probably safe to landfill them at reasonable rates. However, statistical analysis shows that landfills accepting biosolids have a higher concentration of mercury in their leachate. This observation might be attributed to the variability of the leachate data and the corresponding inaccuracies in the analysis. However, this is an issue that should be addressed further.
• Literature has shown that biosolids accelerate waste stabilization and consequently,
gas production. Studies have shown that MSW-only landfill cells lag in gas production behind co-disposal landfills by almost two years. This observation has positive implications if arrangements are made to capture and utilize the gas produced.

102
• Air space issues were investigated and it was found that the air space required by the MSW-biosolids mixture is less than the air space required by MSW alone. This may be because the introduction of biosolids increases the compactibility and consequently, the density of the waste thus reducing the associated volume. Also, biosolids accelerate waste stabilization and hence facilitate volume reduction.
• Relatively little information is available regarding the disposal of water treatment
residuals in landfills. It appears that because they have increased geotechnical strength and reduced potential for odor, their co-disposal would have advantages over biosolids disposal.
• From the geotechnical investigation involving extensive laboratory testing of waste
and slope stability analysis, the following conclusions may be drawn:
• Laboratory testing showed that lime sludge has more inherent shear strength than biosolids.
• Landfills accepting lime sludge have a higher factor of safety than the ones accepting biosolids.
• The addition of biosolids and lime sludge reduces the strength of the landfill. • The effect of biosolids is more prominent than lime sludge in reducing the
stability of the landfill. • The stability of the landfill is more adversely affected when the sludges are
placed as discrete layers as compared to placement as pockets. • Mixing the sludges with MSW helps in increasing the slope stability of the fill
as compared with direct landfilling, although it is still very much governed by the placement of the mixture.
• The economic analysis showed that landfilling offers competitive prices when
contrasted with alternate biosolids disposal options. Landfilling of biosolids is less expensive than treating biosolids to Class A standards and land applying and nearly equal in cost to aerobic digestion of biosolids at 6% solids and land applying and lime stabilization of biosolids at 1.5% dry solids. The economics will improve if landfill owners reduce the tipping fees for biosolids keeping in mind the fact that the savings due to the use of biosolids as a moisture source could offset the reduced tipping fee.
Based on the above conclusions, it seems that co-disposal of biosolids and MSW in a landfill is a feasible method of biosolids disposal.
5.2 Recommendations One of the advantages of land application of biosolids is resource recovery. The
reason this method of disposal is so popular is that biosolids can be used as fertilizers and can convert large tracts of land to farmland. However, it is possible that land application poses health hazards due to the high pathogen content of biosolids, their heavy metals content and the presence of organic matter such as dioxins, furans and polychlorinated biphenyls which are possible carcinogens and endocrine disruptors. Landfills, on the

103
other hand, provide a safe containment option for biosolids. Further, disposing biosolids in landfills enables its use as a bioreactor. Co-disposal accelerates gas production allowing improved efficiency and the economics of the use of gas. Also, landfills have great attenuation capacity for organic matter and heavy metals. Thus, the potential for soil and groundwater contamination from biosolids in landfills is reduced compared to land application. Also, in the long run, the waste is converted to compost in the landfills. This compost can be recovered and sold bringing economic benefit to the landfills along with the possibility of reuse of the site. In light of all these factors, co-disposal of biosolids is a beneficial option for landfill owners.
Compiling and analyzing data from the FDEP files was a laborious task. Values
for such parameters as BOD and COD needed for determining the landfill age were often missing. Also, only limited data points were available. These shortcomings could have affected the conclusions drawn from the results. It is recommended the FDEP mandate the monitoring of critical leachate parameters and the submission of monitoring reports in a standard electronic format. Data submitted in this format will be easier for researchers to access and compile. This research had to be confined to landfills in only two districts because of the difficulties in accessing data from other districts. This problem would be solved if the data were available in disks which could be easily transported or mailed to researchers.
Also, regular monitoring of critical parameters such as COD and BOD would
greatly enhance the accuracy of analyses and enable researchers to make more conclusive statements about the feasibility of co-disposal. These parameters are crucial in the determination of the age of the landfill and their absence has been the source of one possible inaccuracy in the analysis.
Operational challenges exist in the co-disposal of MSW and biosolids. It is
recommended that field experiments be conducted to closely monitor a co-disposal site. Leachate from this landfill could actually be tested in the laboratory and compared to leachate from non co-disposal sites to realistically evaluate the impact of co-disposal on leachate quality. Similarly, field experiments could also be conducted to evaluate the impact of co-disposal on gas production and geotechnical stability.
It has been found that the concentration of mercury in leachate from landfills
accepting biosolids is statistically significantly greater than the concentration of mercury in leachate from landfills not accepting biosolids. This might be because of the large variations in data and the corresponding inaccuracies in the analysis. However, given the biotoxicity of mercury, this is an aspect of co-disposal that should be investigated with great care and in depth.
The following are the recommendations for geotechnical investigations in further studies:
1. Due to the limitations discussed previously for the size of mold for direct shear test, direct shear tests should be conducted in a larger mold with a sample size of around 1

104
m x 1 m x 1 m. This large sample size would ensure that the waste need not be shredded and waste from landfills may be used for testing to get accurate properties.
2. Results from laboratory testing for shear strength of waste should be compared with results from field testing like the cone penetration test.
3. For stability analysis, it is recommended that landfills be modeled with variations in moisture content and with regions of saturated waste.

105
REFERENCES Anderson David R., Sweeney Dennis J. and Williams Thomas A. Introduction to Statistics An Applications Approach West Publishing Company, 1981. Blakley, N.C., “Co disposal of Sewage Sludge and Domestic Waste in Landfills; Laboratory and Field Trials”, Water Research Center, Buckinghamshire, UK, 1989. Christen Kris, “NRC: Science Behind 40 CFR 503 Needs Updating,” Water Environment and Technology, 2002.
Cornwell, D.A., Cline, G.C., Przybyla, J.M. & Tippin, D., Demonstration Testing of Alum Recovery by Liquid Ion Exchange. Journ. AWWA, 73:6:326, 1981.
Cornwell, D.A., Mutter, R. & Vandermeyden, C., Commercial Application and Marketing of Water Plant Residuals. AWWA Research Foundation, Denver, 2000.
Copeland, A., Vandermeyden, C. & Cornwell, D.A., Beneficial Use Alternatives For Water Treatment Plant Residuals. Proc. 1994 Critical Issues in Water and Wastewater Treatment, Boulder, Colorado, 1994.
Das, B.M., Principles of Geotechnical Engineering, Fifth Edition, Brooks/Cole, 2002. De Bekker P.H.A.M.J. and J.J. Van Den Berg, “Landfilling with Sewage Sludge”, Grontmij, De bilt, The Netherlands, 1993 . Dietrich M.Andrea, Chesnutt A. Sheryl, Stone A. Lori, “Determination of Organic Pollutants in Land Applied Municipal Wastewater Sludges by Toxicity Characteristic Leaching Procedure (TCLP) and Extraction Procedure (EP) Toxicity Test,” Water Environment Research, Vol.65, 1993. Dowd E. Scott, Gerba P. Charles, Pepper L. Ian et al.., “ Bioaerosol Transport Modeling and Risk Assessment in Relation to Biosolids Placement,” Journal of Environmental Quality, Vol. 29, No.1, 2000. Eid, H.T., Stark, T.D., Evans, W.D. and Sherry, P., “Municipal Solid Waste Landfill Slope Failure I: Foundation and Waste Properties”, Journal of Geotechnical and Geoenvironmental Engineering, ASCE Vol.126, No. 5, May, pp 397-407, 2000.
Elliot, H.A., Dempsey, B.A., Hamilton, D.W. & DeWolfe, J.R., Land Application of Water Treatment Sludges: Impacts and Management. AWWA Research Foundation, Denver, 1990.
EPA Office of Water, “Frequently Asked Questions,” 2001.

106
Epstein Eliot, Land Application of Sewage Sludge and Biosolids, Lewis Publishers, 1929. Fackelmann Kathleen, “Some fear that using sludge as fertilizer is a public health hazard,” USA Today, 2002. Franklin Ralph, “Land Application of Sewage Sludge,” MS Thesis, Clemson University, 2001. Gabr, M.A., Hossain, M.S. and Barlaz, M.A., “Shear Strength Parameters of Municipal Solid Waste with Leachate Recirculation”, The second International Landfill Research Symposium, Asheville, NC, 2002. Gabr, M.A. and Valero, S.N., “Geotechnical Properties of Municipal Solid Waste, Geotechnical Testing Journal”, GTJODJ, Vol. 18, No. 2, pp. 241 – 251, 1995. GEO-SLOPE International Ltd., “Teaching guide for SLOPE/W”, 1999. Hall J.E, Alternative Uses for Sewage Sludge, Pergamon Press, 1991. Kavazanjian, E. Jr., Matasovic, N., Bonaparte, R., and Schmertmann, G.R., “Evaluation of MSW Properties for Seismic Analysis”, Geoenvironment 2000, ASCE Geotechnical Publications No. 46, Volume 2, 1995. Kinman Riley at al, “Impact of POTW Sludge on Municipal Sanitary Landfills,” 1992. Koenig, A., Kay, J.N. and Wan, I.M., “Physical Properties of Dewatered Wastewater Sludge for Landfilling”, Water Science Tech. Vol. 34, No. 3 - 4, pp. 533-540, 1996. Koodathinkal B., “Stability of Slopes in a Class I Landfills with Co-disposal of Biosolids and Sludge,” Masters Thesis, University of Central Florida, 2003. Krogman Uta, “Land Application of Sewage Sludge(Biosolids) #7 Organic Contaminants,” Rutgers Co-operative Extension, 2002. Krogman Uta, Boyles S. Lisa, Bamka J. William et al.., “Biosolids and Sludge Management,” Water Environment Research, Vol 71, No.5, 1999. Lambert S.D et al., “Can stored sludge cake be deodorized by chemical or biological treatment?,” Water Science and Technology Volume 41, n 6, 2000. Landers Jay, “Biosolids Rule Adequate but Needs Update, Study Says,” Civil Engineering, 2002.
107
Landva, A.O. and Clarke, J.I., “Geotechnics of Waste Fill - Theory and Practice”, ASTM STP 1070, Philadelphia, Pennsylvania, 1990. McFadden P. David, Proctor L. James, Krouskop J. Dirk, “Evaluation of Dioxin Mobility and Spoils Leaching in a Surface Coal Mine Reclaimed with Bleached Kraft pulp and Paper Mill Biosolids,” Water Environment Research, Vol. 67, 1995. Oklahoma Department of Environmental Quality, “Sludge Management in Oklahoma, What is Land Application of Sludge,” 2001. Pollution Technology Review No.58 Sludge Disposal by Landspreading Techniques, Noyes Data “Corporation, New Jersey, 1979. Qian, X., Koerner, R.M. and Gray, D.H., “Geotechnical Aspects of Landfill Design and Construction”, Prentice Hall Publications, 2002. Reinhart Debra R. et al. “The Impact of Leachate Recirculation on Municipal Solid Waste Landfill Operating Characteristics,” Waste Management and Research, 1996. Reinhart Debra R. “Full-Scale Experiences with Leachate Recirculating Landfills: Case Studies,” Waste Management and Research, 1996. Rosenfield Paul E. et al. “Wood Ash Control of Biosolids from Biosolids Application,” Journal of Environmental Quality Volume 29, n 5, 2000. Sadek, S., Abou-Ibrahim, A., Manasseh, C. and El-Fadel, M., “Stability of Solid Waste Sea fills: Shear Strength Determination and Sensitivity Analysis”, Dept. of Civil and Environmental Engineering, American University of Beirut, Beirut (Lebanon), 2000.
Schmitt, C.R. & Hall, J.E., 1975. Analytical Characterization of Water-Treatment-Plant Sludge. Journ. AWWA, 67:1:40.
Shafer, A.L., Hargrove, J.Q. and Harris, J.M., “Stability Analysis for Bioreactor Landfill Operations”, private communication, 2003. Shaun, A.P., Valsangkar, A.J. and Landva, A., “Shear Displacement Dependent Strength of Municipal Solid Waste and Its Major Constituents”, Geotechnical Testing Journal, GTJODJ, Vol. 24, No. 4, pp. 381 – 390, 2001. Skinner H. John, “Re: EPA Request for Comment on Bioreactor Landfills,” Solid Waste Association of North America (SWANA), 2000. Singh, S and Murphy, B., “Evaluation of the Stability of Sanitary Landfills”, ASTM STP 1070, Philadelphia, Pennsylvania, 1990. Spellman Frank R. Incinerating Biosolids, Technomic Publishing Co. Inc., 1997.

108
Task Force on Beneficial Use Programs for Biosolids Management Beneficial Use Programs for Biosolids Management ,Water Environment Federation, 1994. Tchobanoglous, G., Theisen, H. and Eliassen, R., “Solid Waste: Engineering Principles and Management Issues”, McGraw Hill series in Waste Resources and Environmental Engineering, 2000 Timothy, D.S., “Leachate Recirculation and Slope Stability”, Designing and Operating Bioreactor Landfills, Madison, Wisconsin, 2001. USEPA, “Biosolids Generation, Use and Disposal in the United States,” 1999.
USEPA (1996). Technology transfer handbook: management of water treatment plant residuals. US EPA/625/R-95/008.
Waite, T.D. & Dharmappa, H.B., 1993. Optimal Management of Water Treatment Plant Residuals: Technical and Commercial Review. CRC for Waste Management and Pollution Control Limited., Sydney, Australia.
Wan, I.M., Koenig, A. and Kay J.N., “Geotechnical Aspects of Dewatered Wastewater Sludge for Landfill Disposal”, Engineering Technics Press, Edinburgh, 1996. http://www.hrsd.state.va.us/biosolidsprogram.htm www.epa.gov

109
APPENDICES Appendix A Land Application Pollution Limits for Sewage Sludges Appendix B Landfill Operators Survey Appendix C Landfill Data Appendix D Detailed Calculations for Moisture Input and Costs