epic research special report of 05 oct 2015
TRANSCRIPT

DAILY REPORT
05th
OCT. 2015
YOUR MINTVISORY Call us at +91-731-6642300
Global markets at a glance
Japanese stocks ended flat in thin trade on Friday as inves-
tors were reluctant to take large positions before a key U.S.
jobs report due later in the day. The Nikkei share average
edged up 0.02 % to 17,725.13. For the week, it dropped 0.9
%, falling for the third straight week. The broader Topix
dropped 0.2 % to 1,444.92, with 1.887 billion shares chang-
ing hands, the lowest level since Sept. 14. The JPX-Nikkei
Index 400 fell 0.1 % to 12,927.84. Markets in China remain
closed until Wednesday for National Day holidays.
US stocks closed more than 1 percent higher following the
report, with major averages ending the week up more than
1 percent.
European shares closed higher on Friday, as firmer utility
stocks and gains on the Lisbon bourse before weekend
elections in Portugal propped up markets in spite of weak
U.S. jobs data. The pan-European FTSEurofirst 300 index
closed up 0.5 %, while the euro zone's blue-chip Euro
STOXX 50 index finished 0.6 % higher. Portugal's PSI-20 in-
dex was the best-performing market in Europe, climbing
2.1 % as Portugal's prime minister made a final push on
Friday to boost his chances of not only winning this week-
end's election but also of securing an absolute majority and
a more stable government.
Previous day Roundup
The BSE Sensex relinquished most of its gains to close mar-
ginally higher at 26227 and the Nifty ended marginally
down at 7946.10. The BSE midcap and smallcap index were
far more robust unlike their larger peers. However, the in-
dices closed marginally higher. For most part of the day the
larger market traded flat-to-positive although it opened by
testing the 8000 level as overnight US stocks ended higher.
Lupin closed the day top grosser on the Sensex with over 4
% gains. Other contributors to the 30-stock index were
Infosys, Reliance, Larsen and TCS.
Index stats
The Market was very volatile in last session. The sartorial
indices performed as follow; Consumer Durables [down
pts], Capital Goods [up 110.89pts], PSU [down 6.97pts],
FMCG [up 18.23pts], Realty [down 25.41pts], Power [down
10.21pts], Auto [down 78.81Pts], Healthcare [up
260.11Pts], IT [down 27.25pts], Metals [down 8.32pts],
TECK [up 15.30pts], Oil& Gas [up 8.91pts].
World Indices
Index Value % Change
D J l 16472.37 +1.23
S&P 500 1951.36 +1.43
NASDAQ 4707.77 +1.74
FTSE 100 6129.98 +0.95
Nikkei 225 17941.62 +1.22
Hong Kong 21892.04 +1.79
Top Gainers
Company CMP Change % Chg
ULTRACEMCO 2,776.00 102.60 3.84
LUPIN 2,099.10 65.10 3.20
ZEEL 401.55 9.10 2.32
SUNPHARMA 888.20 19.80 2.28
ADANIPORTS 305.35 6.35 2.12
Top Losers
Company CMP Change % Chg
HCLTECH 859.00 123.15 -12.54
BHEL 198.80 6.75 -3.28
GAIL 293.50 8.80 -2.91
MARUTI 4,579.00 106.60 -2.28
VEDL 83.45 1.25 -1.48
Stocks at 52 Week’s HIGH
Symbol Prev. Close Change %Chg
AARTIIND 560.00 9.75 1.77
DISHMAN 353.80 34.10 10.67
INFY 1,173.05 11.10 0.96
LUPIN 2,099.10 65.10 3.20
GMBREW 488.30 -2.35 -0.48
Indian Indices
Company CMP Change % Chg
NIFTY 7950.90 2.00 +0.03
SENSEX 26220.95 +66.12 +0.25
Stocks at 52 Week’s LOW
Symbol Prev. Close Change %Chg
GUJGASLTD 484.00 -34.60 -6.67
IDFC 60.80 -8.35 -12.08
ADLABS 110.00 -2.15 -1.92
TITAN 327.50 9.65 3.04
DAILY REPORT
05th
OCT. 2015
YOUR MINTVISORY Call us at +91-731-6642300
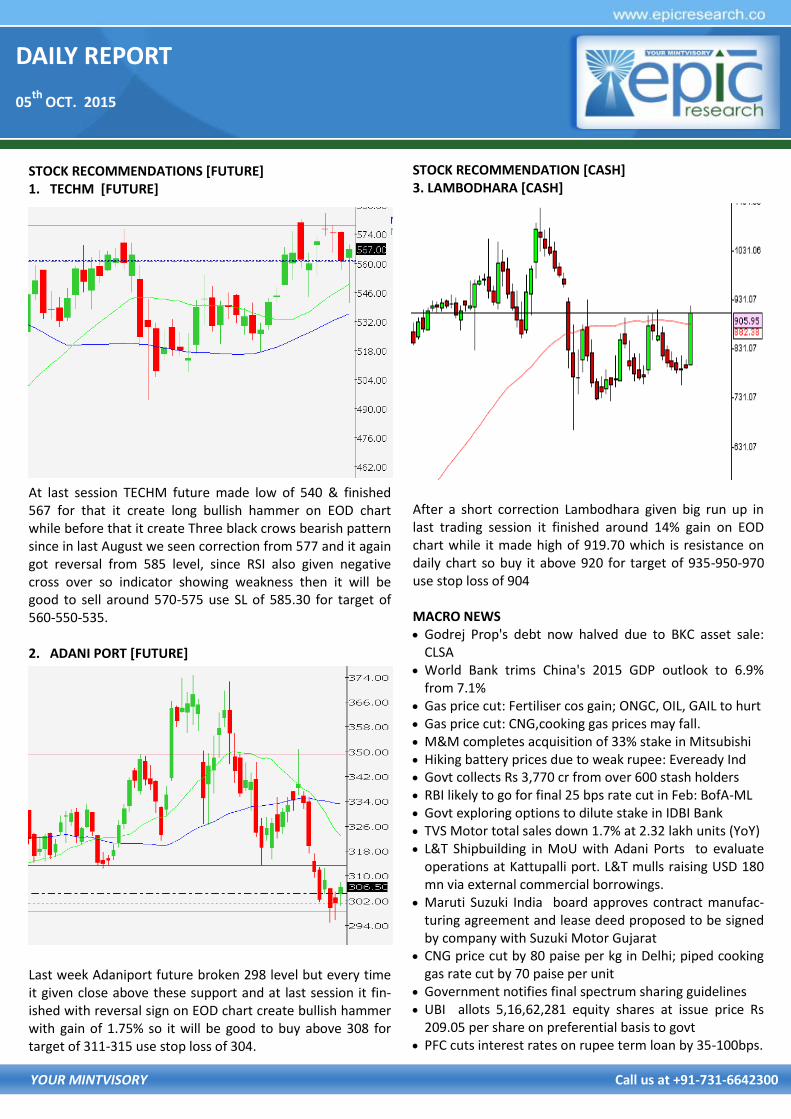
STOCK RECOMMENDATION [CASH] 3. LAMBODHARA [CASH]
After a short correction Lambodhara given big run up in last trading session it finished around 14% gain on EOD chart while it made high of 919.70 which is resistance on daily chart so buy it above 920 for target of 935-950-970 use stop loss of 904 MACRO NEWS Godrej Prop's debt now halved due to BKC asset sale:
CLSA World Bank trims China's 2015 GDP outlook to 6.9%
from 7.1% Gas price cut: Fertiliser cos gain; ONGC, OIL, GAIL to hurt Gas price cut: CNG,cooking gas prices may fall. M&M completes acquisition of 33% stake in Mitsubishi Hiking battery prices due to weak rupee: Eveready Ind Govt collects Rs 3,770 cr from over 600 stash holders RBI likely to go for final 25 bps rate cut in Feb: BofA-ML Govt exploring options to dilute stake in IDBI Bank TVS Motor total sales down 1.7% at 2.32 lakh units (YoY) L&T Shipbuilding in MoU with Adani Ports to evaluate
operations at Kattupalli port. L&T mulls raising USD 180 mn via external commercial borrowings.
Maruti Suzuki India board approves contract manufac-turing agreement and lease deed proposed to be signed by company with Suzuki Motor Gujarat
CNG price cut by 80 paise per kg in Delhi; piped cooking gas rate cut by 70 paise per unit
Government notifies final spectrum sharing guidelines UBI allots 5,16,62,281 equity shares at issue price Rs
209.05 per share on preferential basis to govt PFC cuts interest rates on rupee term loan by 35-100bps.
STOCK RECOMMENDATIONS [FUTURE] 1. TECHM [FUTURE]
At last session TECHM future made low of 540 & finished 567 for that it create long bullish hammer on EOD chart while before that it create Three black crows bearish pattern since in last August we seen correction from 577 and it again got reversal from 585 level, since RSI also given negative cross over so indicator showing weakness then it will be good to sell around 570-575 use SL of 585.30 for target of 560-550-535. 2. ADANI PORT [FUTURE]
Last week Adaniport future broken 298 level but every time it given close above these support and at last session it fin-ished with reversal sign on EOD chart create bullish hammer with gain of 1.75% so it will be good to buy above 308 for target of 311-315 use stop loss of 304.

DAILY REPORT
05th
OCT. 2015
YOUR MINTVISORY Call us at +91-731-6642300
FUTURE & OPTION
MOST ACTIVE PUT OPTION
Symbol Op-
tion
Type
Strike
Price
LTP Traded
Volume
(Contracts)
Open
Interest
NIFTY CE 8,200 55.90 4,46,824 41,67,100
NIFTY CE 8,000 141.00 3,77,660 46,22,800
BANKNIFTY CE 18,000 188.00 47,945 6,13,800
IDFC CE 70 0.95 10,719 45,40,000
IDFC CE 75 0.40 8,647 27,54,000
LT CE 1,500 47.50 5,663 2,09,625
HCLTECH CE 900 24.00 4,047 2,75,000
SBIN CE 250 4.50 3,925 34,43,000
MOST ACTIVE CALL OPTION
Symbol Op-
tion
Type
Strike
Price
LTP Traded
Volume
(Contracts)
Open
Interest
NIFTY PE 7,800 96.00 3,52,548 39,19,025
NIFTY PE 7,900 126.90 3,19,799 22,33,450
BANKNIFTY PE 16,500 232.00 25,061 3,10,700
IDFC PE 60 2.95 5,325 14,96,000
RELIANCE PE 840 14.10 2,407 4,24,250
LT PE 1,450 31.40 2,322 1,35,375
INFY PE 1,100 21.30 1,819 2,69,000
HCLTECH PE 860 40.00 1,734 94,250
FII DERIVATIVES STATISTICS
BUY OPEN INTEREST AT THE END OF THE DAY SELL
No. of
Contracts Amount in
Crores No. of
Contracts Amount in
Crores No. of
Contracts Amount in
Crores NET AMOUNT
INDEX FUTURES 100685 2163.15 53304 1199.49 803434 17915 963.6611
INDEX OPTIONS 423159 9893.77 428954 9870.96 1922747 60142.5 22.8085
STOCK FUTURES 85657 2265.14 95627 2395.71 1783689 44988.2 -130.573
STOCK OPTIONS 53493 1351.13 54063 1371.19 60218 1566.96 -20.0593
TOTAL 835.83
STOCKS IN NEWS Allahabad Bank, SBBJ, Yes Bank and Kotak Mahindra
Bank cut base rate by 0.25 per cent Govt infuses Rs 13,955 crore capital into 8 PSU banks IDBI Bank cuts base rate by 0.25% to 9.75% Repo rate cut, a major relief for textile industry: SIMA GCIL builds Rs 800-crore transmission line linking West
Bengal, Bihar Sterlite Grid, Burns & McDonnell tie up for implement-
ing transmission projects NIFTY FUTURE
Nifty Future in yesterday trading session opened higher and came down immediately in first few hours and for the rest of the day it remained flat to negative. For next session we advise to buy Nifty for RSI and weekly close suggest a little upside, atleast upto 8150. So Buy it around 7950-7960 for the targets of 8070-8170 with strict stop loss of 7750
INDICES R2 R1 PIVOT S1 S2
NIFTY 8,040.00 7,995.00 7,962.00 7,917.00 7,884.00
BANK NIFTY 17,497.00 17,323.00 17,217.00 17043.00 16,937.00

DAILY REPORT
05th
OCT. 2015
YOUR MINTVISORY Call us at +91-731-6642300
RECOMMENDATIONS
GOLD
TRADING STRATEGY:
BUY GOLD OCT ABOVE 26500 TGTS 26580,26670 SL BE-
LOW 26400
SELL GOLD OCT BELOW 26200 TGTS 25620,25530 SL
ABOVE 25800
SILVER
TRADING STRATEGY:
BUY SILVER DEC ABOVE 35100 TGTS 35300,35600 SL BE-
LOW 34800
SELL SILVER DEC BELOW 34700 TGTS 34500,34200 SL
ABOVE 35000
COMMODITY ROUNDUP
A promising spurt was witnessed in gold on 2nd October 2015 as the US nonfarm payrolls came in less than ex-pected. Strong physical demand for gold from major con-suming nations also supported the yellow metal. Gold is expected to seek cues from the US economy in the near term and unenthusiastic economic data can offer good sup-port to the yellow metal. Global growth outlook is likely to be revised down due to weak expansion in emerging econo-mies. COMEX Gold hit a one month high of $1156 per ounce, breaking above the 100 day EMA. However, contin-ued selling pressure in global crude oil prices and a modest recovery in global equities pulled gold back.
WTI crude oil futures continued to witness bargain buying in dips amid supportive Chinese and US consumer confidence data. The WTI crude futures continued to witness bargain buying around $44 per barrel mark while MCX Crude eyed Rs 3000 mark as a key pivot point. The latest US nonfarm payrolls data also supported oil. US consumers' outlook on US economy improved in September. The Conference Board, a private research group, said its index of consumer confidence increased to 103.0 in September from a revised 101.3 in August. The initial August reading was 101.5. The present situation index rose to 121.1from a 115.8. The ini-tial August reading was 115.1. Meanwhile, the board's con-sumer expectations for economic activity over the next six months dropped to 91.0 from a revised91.6.
Silver futures moved in tune with the gold prices.MCX Silver futures for December extended a slide after testing highs near Rs 36700 per kg levels in the middle of last week and plummeted once Rs 36000 mark gave up. The counter tested lows near Rs 34400 per kg levels and should rise back towards Rs 35000 mark following the recovery in global prices. Global Silver futures recovered after witnessing con-tinued bargain buying around $14.40 per ounce levels. The metal could extend these gains provided global copper and crude oil prices also maintain their upsides.
The prices of major nonferrous are expected to remain dull and weak in the month of October 2015. So far the per-formance has remained far from being jovial and September was again a month of heavy losses in nonferrous metals compared to last year. The metal has been facing heat from the Chinese data that has dismantled the process of growth. Copper prices in September 2015 settled at $ 5208 per tonne, down 24% from last year. The prices were $ 6868 per tonne during same time last year.

DAILY REPORT
05th
OCT. 2015
YOUR MINTVISORY Call us at +91-731-6642300
NCDEX
NCDEX ROUNDUP Cardamom prices rose by 0.40% to Rs 812 per kg in futures trade as speculators built up fresh positions after demand picked up in the spot market. At MCX cardamom for deliv-ery in October edged up by Rs 3.20, or 0.40%, to Rs 812 per kg in a business turnover of 129 lots. Similarly, the spice for delivery in Nov traded higher by 50 paise, or 0.06%, to Rs 833 per kg in 35 lots. Fresh positions built up by traders due to pick up in demand in the spot market amid restricted supplies from producing region mainly led to the rise in car-damom prices at futures trade. Chana prices jumped by 2.25% to Rs 4,912 per quintal in futures market as traders enlarged positions amid fall in supplies from producing belts at the spot market against rising demand. At NCDEX chana for delivery in Oct shot up by Rs 108, or 2.25%, to Rs 4,912 per quintal with OI of 13,670 lots. The commodity for delivery in November traded higher by Rs 93, or 1.89%, to Rs 5,026 per quintal in 87,590 lots. Speculators enlarged positions supported by rising demand in the spot market amid lower arrivals from producing belts which mainly influenced chana prices. Tea production in India is likely to fall this year according to the latest trend in production. Production is slated to fall after a gap of five years. Mentha oil remained higher for the second straight day and prices advanced by 0.23% to Rs 904.90 per kg in futures trade owing to rising demand from consuming industries in the spot market. Besides, tight stocks position in the physi-cal market on restricted arrivals from producing regions, supported the upside. At MCX mentha oil for delivery in Oct gained Rs 2.10, or 0.23%, to Rs 904.90 per kg in a business turnover of 203 lots.
NCDEX INDICES
Index Value % Change
CAETOR SEED 4108 -0.32
CHANA 4952 +3.08
CORIANDER 11182 -0.08
COTTON SEED 1593 +2.12
GUAR SEED 3836 +1.11
JEERA 15670 +0.10
MUSTARDSEED 4562 +3.26
REF. SOY OIL 605.75 +1.29
TURMERIC 7492 -0.08
WHEAT 1551 -0.19
RECOMMENDATIONS
DHANIYA
BUY CORIANDER OCT ABOVE 11350 TARGET 11377 11457
SL BELOW 11323
SELL CORIANDER OCT BELOW 11150 TARGET 11123 11043
SL ABOVE 11177
GUARSGUM
BUY GUARGUM OCT ABOVE 8300 TARGET 8350 8420 SL
BELOW 8240
SELL GUARGUM OCT BELOW 8180 TARGET 8130 8060 SL
ABOVE 8240

DAILY REPORT
05th
OCT. 2015
YOUR MINTVISORY Call us at +91-731-6642300
RBI Reference Rate
Currency Rate Currency Rate
Rupee- $ 65.5540 Yen-100 54.5400
Euro 73.0796 GBP 99.1701
CURRENCY
USD/INR
BUY USD/INR OCT ABOVE 65.9 TARGET 66.03 66.18 SL BE-
LOW 65.7
SELL USD/INR OCT BELOW 65.78 TARGET 65.65 65.5 SL
ABOVE 65.98
EUR/INR
BUY EUR/INR OCT ABOVE 73.6 TARGET 73.75 73.95 SL BE-
LOW 73.4
SELL EUR/INR OCT BELOW 73.2 TARGET 73.05 72.85 SL
ABOVE 73.4
CURRENCY MARKET UPDATES:
The rupee extended gains for the fourth straight day against the US currency Thursday, advancing by 7 paise to close at 65.51 per dollar on selling of dollar by banks and exporters on hopes of more foreign capital inflows into equity market. FPIs net bought shares worth Rs 116.08 cr yesterday, as per the provisional figures issued by stock exchanges. The rupee resumed steady at 65.58 per dollar at the Interbank Forex market in view of cautious ap-proach. It moved in a range of 65.48 per dollar and 65.67 per dollar before ending at 65.51 per dollar, showing a gain of seven paise or 0.11%. It has gained 65 paise or 0.98 per-cent in the last four sessions. The rupee hardened further against the pound sterling to finish at 99.23 from yester-day's close of 99.58 and also firmed up further against the Euro to 73.09 from 73.51. However, it dropped against the Japanese currency to settle at 54.71 per 100 yen from 54.52 yesterday.
The concept of rupee-denominated bonds or “masala bonds” seems to be gaining currency, aided in good meas-ure by rupee bond offerings made by the International Fi-nance Corporation. IFC, an arm of the World Bank and a major global financial institution that fosters private sector development in developing countries, has seen its rupee-denominated borrowing in international markets during fiscal 2015.
The dollar nursed losses on Monday, edging away from a nearly two-week low against a basket of currencies marked in the previous session after weak U.S. jobs data led trad-ers to pare bets that the Federal Reserve was poised to hike interest rates as early as this month. The key nonfarm payrolls report showed that employers added only 142,000 jobs last month, falling far short of economists' consensus expectation for a rise of 203,000 jobs, according to a Reuters poll. Moreover, the August figures were revised sharply lower. That raised doubts that the U.S. economy was strong enough to justify the Fed's long-awaited inter-est rate increase, which would be the first since 2006.
The dollar index .DXY slid to 95.218, its lowest level since Sept. 21. It last stood at 95.887, up about 0.1 percent.

DAILY REPORT
05th
OCT. 2015
YOUR MINTVISORY Call us at +91-731-6642300
CALL REPORT
PERFORMANCE UPDATES
Date Commodity/ Currency
Pairs Contract Strategy Entry Level Target Stop Loss Remark
01/10/15 NCDEX DHANIYA OCT. BUY 8200 8250-8320 8140 SL TRIGGERED
01/10/15 NCDEX DHANIYA OCT. SELL 8130 8080-8010 8190 NOT EXECUTED
01/10/15 NCDEX GUARGUM OCT. BUY 11277 11304-11384 11250 BOOKED FULL PROFIT
01/10/15 NCDEX GUARGUM OCT. SELL 11160 11133-11053 11187 SL TRIGGERED
01/10/15 MCX GOLD OCT. BUY 26000 26080-26170 25900 BOOKED PROFIT
01/10/15 MCX GOLD OCT. SELL 25700 25620-25530 25800 NOT EXECUTED
01/10/15 MCX SILVER DEC. BUY 34700 34900-35200 34700 NP PROFIT NO LOSS
01/10/15 MCX SILVER DEC. SELL 34400 34200-33900 34700 NOT EXECUTED
01/10/15 USD/INR OCT. BUY 65.95 66.08-66.23 65.75 NOT EXECUTED
01/10/15 USD/INR OCT. SELL 66.86 66.73-66.58 67.06 NOT EXECUTED
01/10/15 EUR/INR OCT. BUY 73.90 74.05-74.25 73.70 NOT EXECUTED
01/10/15 EUR/INR OCT. SELL 73.80 73.65-73.45 74.00 BOOKED FULL PROFIT
Date Scrip
CASH/
FUTURE/
OPTION
Strategy Entry Level Target Stop Loss Remark
01/10/15 NIFTY FUTURE SELL 7990-8000 7890-7750 8200 NO PROFIT NO LOSS
01/10/15 TECHM FUTURE SELL 570-575 560-550-535 585.30 NOT EXECUTED
01/10/15 SKSMICRO FUTURE BUY 413 419-427-435 406 BOOKED PROFIT
01/10/15 JUBILANT CASH BUY 389 394-400-410 384 NOT EXECUTED
30/09/15 NIFTY FUTURE SELL 7950 7850-7750 8200 NO PROFIT NO LOSS

DAILY REPORT
05th
OCT. 2015
YOUR MINTVISORY Call us at +91-731-6642300
NEXT WEEK'S U.S. ECONOMIC REPORTS
ECONOMIC CALENDAR
The information and views in this report, our website & all the service we provide are believed to be reliable, but we do not accept any responsibility (or
liability) for errors of fact or opinion. Users have the right to choose the product/s that suits them the most. Sincere efforts have been made to present the
right investment perspective. The information contained herein is based on analysis and up on sources that we consider reliable. This material is for per-
sonal information and based upon it & takes no responsibility. The information given herein should be treated as only factor, while making investment
decision. The report does not provide individually tailor-made investment advice. Epic research recommends that investors independently evaluate par-
ticular investments and strategies, and encourages investors to seek the advice of a financial adviser. Epic research shall not be responsible for any trans-
action conducted based on the information given in this report, which is in violation of rules and regulations of NSE and BSE. The share price projec-
tions shown are not necessarily indicative of future price performance. The information herein, together with all estimates and forecasts, can change
without notice. Analyst or any person related to epic research might be holding positions in the stocks recommended. It is understood that anyone who is
browsing through the site has done so at his free will and does not read any views expressed as a recommendation for which either the site or its owners
or anyone can be held responsible for . Any surfing and reading of the information is the acceptance of this disclaimer. All Rights Reserved. Investment
in equity & bullion market has its own risks. We, however, do not vouch for the accuracy or the completeness thereof. We are not responsible for any
loss incurred whatsoever for any financial profits or loss which may arise from the recommendations above epic research does not purport to be an invi-
tation or an offer to buy or sell any financial instrument. Our Clients (Paid or Unpaid), any third party or anyone else have no rights to forward or share
our calls or SMS or Report or Any Information Provided by us to/with anyone which is received directly or indirectly by them. If found so then Serious
Legal Actions can be taken.
Disclaimer
TIME REPORT PERIOD ACTUAL CONSENSUS
FORECAST PREVIOUS
MONDAY, OCT. 05
10 AM ISM NONMANUFACTURING INDEX SEPT. 57.5% 59.0%
TUESDAY, OCT. 06
8:30 AM TRADE DEFICIT AUG. -$48.1 BLN -$41.9 BLN
WEDNESDAY, OCT. 07
3 PM CONSUMER CREDIT AUG. -- $19 BLN
THURSDAY, OCT. 08
8:30 AM WEEKLY JOBLESS CLAIMS OCT. 3 271,000 277,000
2 PM FOMC MINUTES SEPT. 17
FRIDAY, OCT. 09
8:30 AM IMPORT PRICE INDEX SEPT. -- -1.8%
10 AM WHOLESALE INVENTORIES AUG. -- -0.1%