epic research special report of 28 oct 2015
TRANSCRIPT

DAILY REPORT
28th
OCT. 2015
YOUR MINTVISORY Call us at +91-731-6642300
Global markets at a glance US stocks slipped on Tuesday on uncertainty over the US rate outlook and disappointing results from Ford and other companies. Upbeat results from Apple after hours, how-ever, could give the market a boost on Wednesday. Shares of Apple, the biggest company by market capitalization, rose 2.8 % to USD 116.89 after it reported higher-than-expected earnings and revenue. Apple's stock ended the regular session down 0.6% at USD 114.55. Nasdaq 100 e-mini futures NQc1 also edged up after Apple's results. The DJI average fell 41.62pts, or 0.24%, to 17,581.43, the S&P 500 lost 5.29 points, or 0.26%, to 2,065.89 and Nasdaq Composite dropped 4.56pts, or 0.09 %, to 5,030.15. The S&P 500 posted 14 new 52-week highs and 13 new lows; Nasdaq recorded 56 new highs and 122 new lows. About 7.3bn shares changed hands on US exchanges, compared with the 7.2bn daily average for the past 20 trading days European stock markets fell further from last week's two-month high on Tuesday after a drop in BASF and Novartis shares and a weaker Wall Street opening. The pan-European FTSEurofirst 300 index closed down 1 % at 1,469.82 points, extending losses in late trade as Wall Street fell following weak economic data and as oil compa-nies' shares were hit by tumbling Brent crude prices. Japanese stocks rose during light trading on Wednesday morning as earnings-related news nudged share prices higher, The Nikkei share average gained 0.6 percent to end the morning session at 18,890.21 Previous day Roundup It was a second day of consolidation while the market ended with minor losses. The Sensex slipped 108.52pts or 0.4% at 27253.44 and the Nifty was down 27.65 points or 0.3 % at 8232.90. About 1264 shares advanced, 1446 shares declined, and 142 shares were unchanged. Laurence Balanco, CLSA says short-term pullbacks are likely to be only a partial retracement of the Sept. lows before another advance phase takes price action higher into the year-end. Most of the market action yesterday was dominated by mixed corporate results by few index heavyweights. Index stats The sartorial indices performed as follow; Consumer Dur-ables [down 187.93pts], Capital Goods [down 110.18pts], PSU [down 46.30pts], FMCG [up 7.75Pts], Realty [down 0.18pts], Power [down 5.32pts], Auto [up 69.79Pts], Healthcare [down 34.77Pts], IT [down pts], Metals [down 35.93pts], TECK [down 2.02pts], Oil& Gas [down 61.30 pts].
World Indices
Index Value % Change
D J l 17581.43 -0.24
S&P 500 2063.89 -0.26
NASDAQ 5030.15 -0.09
FTSE 100 6365.27 -0.81
Nikkei 225 18877.21 +0.53
Hong Kong 23022.50 -0.52
Top Gainers
Company CMP Change % Chg
MARUTI 4,517.00 131.85 3.01
SUNPHARMA 911.00 22.20 2.50
ULTRACEMCO 2,905.00 59.90 2.11
BPCL 916.55 12.80 1.42
ASIANPAINT 829.05 11.35 1.39
Top Losers
Company CMP Change % Chg
LUPIN 1,940.00 111.60 -5.44
ONGC 247.50 8.95 -3.49
GAIL 319.60 9.45 -2.87
HDFC 1,277.15 35.55 -2.71
BANKBARODA 168.40 3.65 -2.12
Stocks at 52 Week’s HIGH
Symbol Prev. Close Change %Chg
AUROPHARMA 848.00 15.25 1.83
BSL 69.30 -7.70 -10.00
IDBI 86.60 1.90 2.24
JUBILANT 427.05 13.85 3.35
KRBL 222.00 2.15 0.98
NIITTECH 580.50 27.05 4.89
RUSHIL 291.50 27.35 10.35
Indian Indices
Company CMP Change % Chg
NIFTY 8232.90 -27.65 -0.33
SENSEX 27253.44 -108.52 -0.40
Stocks at 52 Week’s LOW
Symbol Prev. Close Change %Chg
IDFC 59.55 -0.50 -0.83
OIL 409.00 -8.15 -1.95

DAILY REPORT
28th
OCT. 2015
YOUR MINTVISORY Call us at +91-731-6642300
STOCK RECOMMENDATION [CASH] 3. SKSMICRO [CASH]
SKSMICRO FUTURE continuously facing selling pressure from last six session, at last session it break important level of 406 where it started raly since Oct expiry is near for that we can see more given weakness so we advise to sell it below 398 for target of 393 388 380 use stop loss 405. MACRO NEWS Results today: Ambuja Cements, Dabur India, Sun TV
Network, Amara Raja Batteries, Jet Airways, Syndicate Bank, Just Dial, JK Tyre & Ind, Torrent Power, TCI, Excel Crop Care, Exide Ind, HT Media, JSW Energy, MCX, Pidilite Ind, Raymond, Shriram City Union Finance, On-Mobile Global, KEC Int, TATA ELXSI, Jubilant Ind, Green-ply Ind, Aditya Birla Money, ELANTAS BECK, Elecon Eng, Emco, Federal-Mogul, Hikal, INDIAN HUME PIPE, Kirlos-kar Oil Engines, NELCO, Next Mediaworks, Piramal Phy-tocare, Shanthi Gears, Thirumalai Chem, TRF
CEAT Q2 Cons Net Profit Up 30.5% At `107.4 Cr Vs `82.3 Cr (YoY) Cons Total Income Down 2% At `1,409.4 Cr Vs `1,437.8 Cr (YoY)
Essar Oil, NHPC Make It To Top 50 Fastest Growing Cos RIL Pips ONGC To Regain 1 Rank In Asia Pacific, 14 In World ONGC Ranked 2nd In Asia Pacific; 17th In World Coal India Climbs 9 Spots To Global Rank Of 38 NTPC Drops 6 Spots To 56; IOC Drops 23 Spots To 66 Cairn In-dia Dropped 35 Spots To Global Rank
Moody’s revises JSW Steel’s outlook to ‘negative’ from ‘stable’
Petronet faces `10,000 cr hit on costly RasGas contract Siemens arm leases 3.5 lk sq ft at Cummin India Campus
in Pune for over `25 cr annual rent
STOCK RECOMMENDATIONS [FUTURE] 1. BHEL [FUTURE]
BHEL Future end with bearish Harami candle pattern on EOD chart while on daily chart it forming in pennant pattern whose breakdown will be below 211 so we advise to sell it around 216-217 use stop loss of 220.60 for target of 213-211-207.
2. EROSMEDIA [FUTURE]
Before previous session EROSMEDIA breached around 20% % while in last session it open with gap despite of that it could not sustain at higher at last it end near to days low since volume still high so we advise to sell it below 364 for target of 360-355-350 use stop loss of 370

DAILY REPORT
28th
OCT. 2015
YOUR MINTVISORY Call us at +91-731-6642300
FUTURE & OPTION
MOST ACTIVE CALL OPTION
Symbol Op-
tion
Type
Strike
Price
LTP Traded
Volume
(Contracts)
Open
Interest
NIFTY CE 8,300 12.85 12,91,033 47,89,075
NIFTY CE 8,200 55.70 6,71,509 29,74,700
BANKNIFTY CE 18,000 56.50 1,09,021 6,70,025
MARUTI CE 4,500 49.00 17,035 2,23,375
MARUTI CE 4,600 14.40 10,865 2,44,625
LUPIN CE 2,000 6.50 9,293 1,83,125
RELIANCE CE 960 1.20 8,516 8,75,500
AXISBANK CE 530 2.75 8,052 16,82,000
MOST ACTIVE PUT OPTION
Symbol Op-
tion
Type
Strike
Price
LTP Traded
Volume
(Contracts)
Open
Interest
NIFTY PE 8,200 19.90 11,00,258 49,34,625
NIFTY PE 8,100 4.70 5,69,712 44,94,900
BANKNIFTY PE 17,500 35.00 71,311 5,69,575
LUPIN PE 1,900 17.35 11,459 4,73,500
LUPIN PE 1,950 36.80 8,567 1,84,625
MARUTI PE 4,400 6.45 7,980 1,60,625
AXISBANK PE 500 1.05 5,760 8,73,500
RELIANCE PE 940 6.00 5,294 6,65,000
FII DERIVATIVES STATISTICS
BUY OPEN INTEREST AT THE END OF THE DAY SELL
No. of
Contracts Amount in
Crores No. of
Contracts Amount in
Crores No. of
Contracts Amount in
Crores NET AMOUNT
INDEX FUTURES 167021 5713.96 171786 5089.69 895664 28107.7 624.2796
INDEX OPTIONS 407309 11959.9 476281 13047.3 2230056 75410.4 -1087.42
STOCK FUTURES 454415 15392.2 454167 16037.2 1478678 52005.1 -644.998
STOCK OPTIONS 102775 3101.64 100890 3039.17 141506 3876.32 62.4655
TOTAL -1045.67
STOCKS IN NEWS Lupin Q2 profit tanks 35% on lower EBITDA; US, Japan
biz hit Axis Bank Q2 meets forecast, net rises 19%, revenue up
15% Maruti Suzuki Q2 profit jumps 42%, EBITDA beats esti-
mates Govt to consider repealing retrospective tax: Sources Jubilant Life To Consider Proposal To Raise `1,300Cr Via
Issue Of Securities On October 29 Gammon India To Transfer Part Of Its T&D Undertaking
To Transrail Lighting NIFTY FUTURE
Like previous other sessions Nifty again lacked move-ment and remained stagnant to only 29 points. Nifty took support of 100 EMA near 8200 and it has resistance of 200 EMA around 8400. So we advise you to buy Nifty around 8260 for small target of 8330 and 8400 with strict stop loss of 8150
INDICES R2 R1 PIVOT S1 S2
NIFTY 8,255.00 8,243.00 8,230.00 8,218.00 8,205.00
BANK NIFTY 17,918.00 17,862.00 17,800.00 17,744.00 17,682.00

DAILY REPORT
28th
OCT. 2015
YOUR MINTVISORY Call us at +91-731-6642300
RECOMMENDATIONS
GOLD
TRADING STRATEGY:
BUY GOLD DEC ABOVE 26900 TGTS 26980,27070 SL BE-
LOW 26800
SELL GOLD DEC BELOW 26700 TGTS 26620,26530 SL
ABOVE 25800
SILVER
TRADING STRATEGY:
BUY SILVER DEC ABOVE 37100 TGTS 37300,37700 SL BE-
LOW 36600
SELL SILVER DEC BELOW 36800 TGTS 36600,36300 SL
ABOVE 36900
COMMODITY ROUNDUP
Lack of fresh triggers in the markets led the traders to re-main sidelined for fresh positions in Copper. The prices mostly remained rangebound with difference between high and lows only to the tune of Rs 4. The prospects as per trad-ing fraternity for coming days are positive due to the fact that prices have already faced lot of pain. A sharp decline in copper prices over the last twelve months negatively im-pacted the results of Freeport's mining operations. Free-port's average realized price for copper sales stood at $2.38 per pound in Q3 2015, around 24% lower than the figure reported in the corresponding period of 2014. Freeport's copper production declined slightly to 1 billion pounds in Q3 2015, down from 1.03 billion pounds in the corresponding period of 2014. MCX Copper was trading at Rs 342.30 per kg, up 0.66%. The prices tested a high of Rs 343.65 per kg and a low of Rs 340.30 per kg.
Gold continued to suffer from lack of movement. However, losses were curtailed on strong Chinese gold import data and ideas that Indian retail demand would remain firm ahead of the peak festive season. Equities mostly eased. Investors are contemplating whether US Federal Reserve might refrain from raising rates on Wednesday. COMEX Gold is quoting at $1163 per ounce, down 0.20% on the day. MCX Gold futures are trading at Rs26824 per 10 grams with almost no change on the day.
China’s net imports of gold from Hong Kong increased for the third month in September amid low prices. Net pur-chases jumped to 96.6 tonnes from54.7 tonnes in August and 61.7 tonnes a year earlier, according to data from the Hong Kong Census and Statistics Department. Indian de-mand is also looking good as spot prices have recovered from a three year lows mark under Rs 25000 per 10 grams.
U.S. crude futures fell sharply to slump to near-two months low on Tuesday, as investors awaited the release of the American Petroleum Institute's weekly crude stockpile re-port after the bell for further indications on the supply-demand imbalance in domestic energy markets. On the NY-MEX WTI crude for December delivery traded in a broad range between $42.60 and $43.91 a barrel, before settling at $43.20, down 0.78 or 1.77% on the session. At one point, Texas Long Sweet futures crashed to their lowest level since August 28. U.S. crude futures have fallen by more than 1% in three of their last four sessions. U.S. crude production, meanwhile, remained unchanged for the week at 9.096 mil-lion barrels per day.
DAILY REPORT
28th
OCT. 2015
YOUR MINTVISORY Call us at +91-731-6642300
NCDEX
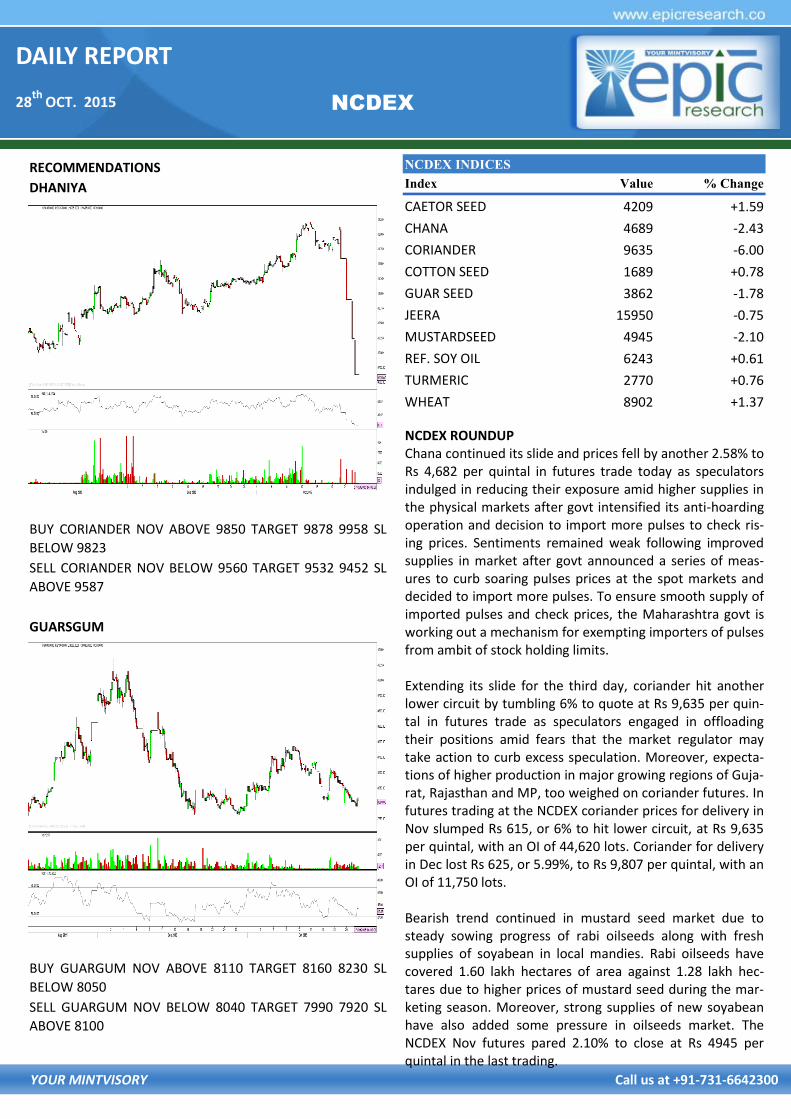
NCDEX ROUNDUP Chana continued its slide and prices fell by another 2.58% to Rs 4,682 per quintal in futures trade today as speculators indulged in reducing their exposure amid higher supplies in the physical markets after govt intensified its anti-hoarding operation and decision to import more pulses to check ris-ing prices. Sentiments remained weak following improved supplies in market after govt announced a series of meas-ures to curb soaring pulses prices at the spot markets and decided to import more pulses. To ensure smooth supply of imported pulses and check prices, the Maharashtra govt is working out a mechanism for exempting importers of pulses from ambit of stock holding limits. Extending its slide for the third day, coriander hit another lower circuit by tumbling 6% to quote at Rs 9,635 per quin-tal in futures trade as speculators engaged in offloading their positions amid fears that the market regulator may take action to curb excess speculation. Moreover, expecta-tions of higher production in major growing regions of Guja-rat, Rajasthan and MP, too weighed on coriander futures. In futures trading at the NCDEX coriander prices for delivery in Nov slumped Rs 615, or 6% to hit lower circuit, at Rs 9,635 per quintal, with an OI of 44,620 lots. Coriander for delivery in Dec lost Rs 625, or 5.99%, to Rs 9,807 per quintal, with an OI of 11,750 lots. Bearish trend continued in mustard seed market due to steady sowing progress of rabi oilseeds along with fresh supplies of soyabean in local mandies. Rabi oilseeds have covered 1.60 lakh hectares of area against 1.28 lakh hec-tares due to higher prices of mustard seed during the mar-keting season. Moreover, strong supplies of new soyabean have also added some pressure in oilseeds market. The NCDEX Nov futures pared 2.10% to close at Rs 4945 per quintal in the last trading.
NCDEX INDICES
Index Value % Change
CAETOR SEED 4209 +1.59
CHANA 4689 -2.43
CORIANDER 9635 -6.00
COTTON SEED 1689 +0.78
GUAR SEED 3862 -1.78
JEERA 15950 -0.75
MUSTARDSEED 4945 -2.10
REF. SOY OIL 6243 +0.61
TURMERIC 2770 +0.76
WHEAT 8902 +1.37
RECOMMENDATIONS
DHANIYA
BUY CORIANDER NOV ABOVE 9850 TARGET 9878 9958 SL
BELOW 9823
SELL CORIANDER NOV BELOW 9560 TARGET 9532 9452 SL
ABOVE 9587
GUARSGUM
BUY GUARGUM NOV ABOVE 8110 TARGET 8160 8230 SL
BELOW 8050
SELL GUARGUM NOV BELOW 8040 TARGET 7990 7920 SL
ABOVE 8100

DAILY REPORT
28th
OCT. 2015
YOUR MINTVISORY Call us at +91-731-6642300
RBI Reference Rate
Currency Rate Currency Rate
Rupee- $ 64.9553 Yen-100 53.8300
Euro 71.8406 GBP 99.7324
CURRENCY
USD/INR
BUY USD/INR OCT ABOVE 65.03 TARGET 65.16 65.31 SL BE-
LOW 64.83
SELL USD/INR OCT BELOW 64.9 TARGET 64.77 64.62 SL
ABOVE 65.1
EUR/INR
BUY EUR/INR OCT ABOVE 71.9 TARGET 72.05 72.25 SL BE-
LOW 71.7
SELL EUR/INR OCT BELOW 71.8 TARGET 71.65 71.45 SL
ABOVE 72
CURRENCY MARKET UPDATES: The Indian rupee on Tuesday closed flat against the US dol-lar as traders avoided long positions ahead of US Federal Reserve’s two-day meeting that starts from Tuesday. The home currency closed at 64.96, little changed from its pre-vious close of 64.97. The local unit opened at 64.98 per US dollar and touched a high and a low of 64.94 and 64.99, respectively. Bank of Japan policymakers will meet for a crucial rate re-view on 30 October as growing signs of recession and slumping oil prices challenge the scenario that the world’s third-largest economy is on track to hit an ambitious 2% inflation target, Reuters reported. The yield on India’s 10-year benchmark bond closed at 7.604% compared with its Monday’s close of 7.611%. Bond yields and prices move in opposite directions. Since the beginning of this year, the rupee has lost 3%, FIIs have bought $4.59 billion from local equity and $9.01 billion from bond markets. Most Asian currencies closed higher. Japanese yen was up 0.63%, South Korean won 0.27% and Indonesian rupiah 0.18%. However, Malaysian ringgit was down 0.7%, while Philippines peso shed 0.36%. The dollar index was trading at 96.769, down 0.12% from its previous close of 96.861 The dollar rose slightly Wednesday against a basket of cur-rencies as weak U.S. data and a wait-and-see approach to the Federal Reserve's Wednesday policy announcement buoyed the greenback. The dollar stayed stronger against the euro, British pound and Swiss franc as traders brushed off two disappointing U.S. reports that included a 1.2 % drop in durable goods for September and a surprise drop in consumer confidence in October. EUR/USD fell slightly on Tuesday, as currency traders await the conclusion of the Federal Open Market Committee's two-day October meeting on Wednesday afternoon for further indications on the timing of an interest rate hike by the U.S. central bank.

DAILY REPORT
28th
OCT. 2015
YOUR MINTVISORY Call us at +91-731-6642300
CALL REPORT
PERFORMANCE UPDATES
Date Commodity/ Currency
Pairs Contract Strategy Entry Level Target Stop Loss Remark
27/10/15 NCDEX DHANIYA NOV. BUY 10350 10378-10458 10323 NOT EXECUTED
27/10/15 NCDEX DHANIYA NOV. SELL 10200 10172-10092 10227 BOOKED FULL PROFIT
27/10/15 NCDEX GUARGUM NOV. BUY 8280 8330-8400 8220 NOT EXECUTED
27/10/15 NCDEX GUARGUM NOV. SELL 8060 8010-7940 8120 BOOKED FULL PROFIT
27/10/15 MCX GOLD DEC. BUY 26900 2690-27070 26800 NO PROFIT NO LOSS
27/10/15 MCX GOLD DEC. SELL 26700 26620-26530 25800 NOT EXECUTED
27/10/15 MCX SILVER DEC. BUY 37100 37300-37700 36600 NO PROFIT NO LOSS
27/10/15 MCX SILVER DEC. SELL 36800 36600-36300 36900 NO PROFIT NO LOSS
27/10/15 USD/INR OCT. BUY 65.03 65.16-65.31 64.83 NOT EXECUTED
27/10/15 USD/INR OCT. SELL 64.85 64.72-64.57 65.05 NOT EXECUTED
27/10/15 EUR/INR OCT. BUY 71.80 71.95-72.15 71.60 NO PROFIT NO LOSS
27/10/15 EUR/INR OCT. SELL 71.60 71.45-71.25 71.80 NOT EXECUTED
Date Scrip
CASH/
FUTURE/
OPTION
Strategy Entry Level Target Stop Loss Remark
27/10/15 NIFTY FUTURE SELL 8340-8350 8260-8150 8450 NOT EXECUTED
27/10/15 CROMPTON
GREAVES FUTURE SELL 182.5 180.5-178 186.60 CALL OPEN
27/10/15 KSCL FUTURE BUY 525 535-545 514 SL TRIGGERED
27/10/15 NDL CASH BUY 136 138.5-142 135 CALL OPEN

DAILY REPORT
28th
OCT. 2015
YOUR MINTVISORY Call us at +91-731-6642300
NEXT WEEK'S U.S. ECONOMIC REPORTS
ECONOMIC CALENDAR
The information and views in this report, our website & all the service we provide are believed to be reliable, but we do not accept any
responsibility (or liability) for errors of fact or opinion. Users have the right to choose the product/s that suits them the most. Sincere ef-
forts have been made to present the right investment perspective. The information contained herein is based on analysis and up on sources
that we consider reliable. This material is for personal information and based upon it & takes no responsibility. The information given
herein should be treated as only factor, while making investment decision. The report does not provide individually tailor-made invest-
ment advice. Epic research recommends that investors independently evaluate particular investments and strategies, and encourages in-
vestors to seek the advice of a financial adviser. Epic research shall not be responsible for any transaction conducted based on the infor-
mation given in this report, which is in violation of rules and regulations of NSE and BSE. The share price projections shown are not nec-
essarily indicative of future price performance. The information herein, together with all estimates and forecasts, can change without no-
tice. Analyst or any person related to epic research might be holding positions in the stocks recommended. It is understood that anyone
who is browsing through the site has done so at his free will and does not read any views expressed as a recommendation for which either
the site or its owners or anyone can be held responsible for . Any surfing and reading of the information is the acceptance of this dis-
claimer. All Rights Reserved. Investment in equity & bullion market has its own risks. We, however, do not vouch for the accuracy or the
completeness thereof. We are not responsible for any loss incurred whatsoever for any financial profits or loss which may arise from the
recommendations above epic research does not purport to be an invitation or an offer to buy or sell any financial instrument. Our Clients
(Paid or Unpaid), any third party or anyone else have no rights to forward or share our calls or SMS or Report or Any Information Pro-
vided by us to/with anyone which is received directly or indirectly by them. If found so then Serious Legal Actions can be taken.
Disclaimer
TIME REPORT PERIOD ACTUAL CONSENSUS
FORECAST PREVIOUS
MONDAY, OCT. 26
10 AM NEW HOME SALES SEPT. 550,000 552,000
TUESDAY, OCT. 27
8:30 AM DURABLE GOODS ORDERS SEPT. -1.5% -2.3%
10 AM CONSUMER CONFIDENCE INDEX OCT. 101.0 103.0
WEDNESDAY, OCT. 28
8:30 AM ADVANCED TRADE IN GOODS SEPT. -$64.8 BLN -$67.2 BLN
THURSDAY, OCT. 29
8:30 AM WEEKLY JOBLESS CLAIMS OCT. 17 N/A N/A
8:30 AM GROSS DOMESTIC PRODUCT 3Q 2.1% 3.9%
FRIDAY, OCT. 30
8:30 AM PERSONAL INCOME SEPT. 0.2% 0.3%
8:30 AM CONSUMER SPENDING SEPT. 0.1% 0.4%
8:30 AM CORE INFLATION SEPT. 0.2% 0.1%
8:30 AM EMPLOYMENT COST INDEX 3Q 0.6% 0.2%
10 AM CONSUMER SENTIMENT INDEX OCT. -- 92.1