epic research special report of 20 oct 2015
TRANSCRIPT

DAILY REPORT
20th
OCT. 2015
YOUR MINTVISORY Call us at +91-731-6642300
Global markets at a glance
Advances in top tech and biotech names helped US stocks to end with slight gains on Monday, while caution at the start of a heavy week of earnings kept a lid on the market. The Dow and S&P 500 pared losses late in the session while the Nasdaq added to gains. Nike, up 2.1%, helped the Dow, while gains in Apple and Intel supported all three major indexes. During the regular session, the Nasdaq Biotech Index was up 0.6 %. The energy index fell 1.9 % as US crude oil fell 2.9 %.
DJI average rose 14.57pts, or 0.08 %, to 17,230.54, the S&P 500 gained 0.55pts, or 0.03 %, to 2,033.66 and Nasdaq added 18.78 points, or 0.38 %, to 4,905.47. US stocks posted their third straight week of gains on Friday. The S&P 500 posted 22 new 52-week highs and 3 new lows; Nasdaq recorded 53 new highs and 40 new lows. About 6bn shares changed hands on US exchanges, compared with the 7.3bn daily average for the past 20 trading days
Asian equities fell across the board on Tuesday after com-modity prices languished in wake of China growth woes and dampened risk sentiment. MSCI's broadest index of Asia-Pacific shares outside Japan shed 0.4%. Shanghai shares dropped 0.4% and South Korea's Kospi dipped 0.1%. Nikkei bucked the trend and gained 0.3%. Australian stocks lost 0.4% as worries about China weighed on mining and energy stocks following Monday's China GDP data.
Previous day Roundup
The market started off week on a positive note with Sensex rising more than 150pts. The rally was mainly led by index heavyweights Reliance Industries and Infosys along with Bharti, FMCG and pharma stocks. However, fall in metals and banking stocks capped upside. The Sensex rallied 150.32 points to 27364.92 and the Nifty rose 36.90 points to 8275.05. The broader markets marginally outperformed benchmarks with BSE Midcap and Smallcap indices gaining 0.7% and 0.8%, respectively. The market has gradually been rising for last couple of weeks, which may take Nifty towards 8400, the immediate resistance.
Index stats
The Market was very volatile in last session. The sartorial indices performed as follow; Consumer Durables [down 43.19pts], Capital Goods [down 146.88pts], PSU [down 16.87pts], FMCG [up 66.02Pts], Realty [up 36.56pts], Power [down 4.82pts], Auto [down 66.07Pts], Healthcare [up 228.34Pts], IT [up 21.68pts], Metals [down 42.33pts], TECK [up 81.93pts], Oil& Gas [up 100.17pts].
World Indices
Index Value % Change
D J l 17230.54 +0.08
S&P 500 2033.66 +0.03
NASDAQ 4905.47 +0.38
FTSE 100 6352.33 -0.40
Nikkei 225 18182.59 +0.28
Hong Kong 22944.11 -0.57
Top Gainers
Company CMP Change % Chg
RELIANCE 962.30 50.15 5.50
BHARTIARTL 363.10 13.45 3.85
HCLTECH 859.00 17.85 2.12
HINDUNILVR 794.00 15.85 2.04
INFY 1,114.70 19.80 1.81
Top Losers
Company CMP Change % Chg
ONGC 258.00 6.10 -2.31
TATASTEEL 247.85 5.05 -2.00
TATAMOTORS 378.85 7.35 -1.90
ULTRACEMCO 2,900.25 54.40 -1.84
ADANIPORTS 317.85 5.85 -1.81
Stocks at 52 Week’s HIGH
Symbol Prev. Close Change %Chg
CADILAHC 433.50 15.00 3.58
DHAMPURSUG 54.10 -1.40 -2.52
DRREDDY 4,333.10 68.15 1.60
ESCORTS 181.20 11.15 6.56
KAJARIACER 893.00 14.25 1.62
RUSHIL 251.00 20.85 9.06
ZEEL 429.25 5.80 1.37
Indian Indices
Company CMP Change % Chg
NIFTY 8275.05 +36.90 +0.45
SENSEX 27364.92 +150.32 +0.55
Stocks at 52 Week’s LOW
Symbol Prev. Close Change %Chg
IDFC 60.00 -0.20 -0.33

DAILY REPORT
20th
OCT. 2015
YOUR MINTVISORY Call us at +91-731-6642300
STOCK RECOMMENDATION [CASH] 3. LAMBODHARA [CASH]
LAMBODHARA continuously facing selling pressure at last session maximum time it traded near to days low while last week it made low of 339 so we advise to sell it below 339 for target of 335-330-325 use stop loss at 345 MACRO NEWS Results Today: ACC, Hero Motocorp, Biocon, Syngene
International, MphasiS, Bajaj Finance, Bajaj Finserv, Con-tainer Corporation, BayerCrop, Federal Bank, Adani Transmission, Can Fin Homes, Dewan Housing, Everest Industries, GM Breweries, BASF India, International Pa-per APPM, Jyothy Laboratories, Kajaria Ceramics, Ortel Communications, Rane, Sanofi India, State Bank of Bi-kaner and Jaipur, Welspun India, Zee Media Corporation, Zensar Technologies, Adani Transmission
S&P's Ratings Services affirmed its 'BBB-' longterm and 'A-3' short-term sovereign credit ratings on India
ATC to acquire 51% in Viom Networks in Rs 20k cr deal: RBI's Rajan urges IMF to act against 'extreme' policies Indian media industry may grow over 3-fold in next 10yrs BSE Revises Circuit Filter In 13 Stocks w.e.f October 20 Govt Raises Basic Customs Duty On Wheat From 10% To
25% RBI Signs MoU On ‘Supervisory Cooperation & Exchange
Of Supervisory Info’ With Central Bank Of UAE DoT May Conduct Special Audit Of Telcos From 2008 On-
wards LIC Housing to further trim bank borrowings to 11-12 per
cent: CEO Electronics import may rise to $40 billion in FY16 due to
smartphone-led surge GAIL will deploy drones to guard gas pipelines to raise
safety standards
STOCK RECOMMENDATIONS [FUTURE] 1. ZEEL [FUTURE]
ZEEL FUTURE again made new life time high of 432.40 and on EOD chart it finished, according to trend line we can see level up to 845 in current bull run so we advise to buy it above 432.50 use stop loss of 425 for target of 438 445 455.
2. HCLTECH [FUTURE]
HCLTECH FUTURE announced Q2 number where they put growth but number is weak as expected despite of that it maintain bottom level 811 and finished at 854 with gain of 1.77% while in last week it return from 857 so we advise to buy it above 858 for target of 860-875-890 use stop loss of 836.

DAILY REPORT
20th
OCT. 2015
YOUR MINTVISORY Call us at +91-731-6642300
FUTURE & OPTION
MOST ACTIVE CALL OPTION
Symbol Op-
tion
Type
Strike
Price
LTP Traded
Volume
(Contracts)
Open
Interest
NIFTY CE 8,300 61.40 6,16,138 57,83,575
NIFTY CE 8,200 118.45 3,49,381 48,01,825
BANKNIFTY CE 18,000 200.00 62,141 5,81,275
RELIANCE CE 960 16.70 20,110 8,77,250
RELIANCE CE 980 8.90 10,837 5,87,250
IFCI CE 30 1.10 6,264 65,44,000
HCLTECH CE 840 26.00 6,113 2,74,250
HCLTECH CE 860 16.00 5,161 3,76,250
MOST ACTIVE PUT OPTION
Symbol Op-
tion
Type
Strike
Price
LTP Traded
Volume
(Contracts)
Open
Interest
NIFTY PE 8,200 47.55 5,71,190 44,53,975
NIFTY PE 8,100 25.85 3,96,551 43,52,550
BANKNIFTY PE 17,500 129.15 46,900 4,50,475
RELIANCE PE 900 2.00 12,783 9,24,750
RELIANCE PE 940 6.80 8,481 6,87,000
TATAMOTOR PE 820 7.00 3,234 2,30,750
HCLTECH PE 380 10.75 2,722 9,49,000
FII DERIVATIVES STATISTICS
BUY OPEN INTEREST AT THE END OF THE DAY SELL
No. of
Contracts Amount in
Crores No. of
Contracts Amount in
Crores No. of
Contracts Amount in
Crores NET AMOUNT
INDEX FUTURES 36874 1043.9 62104 1446.79 994067 25057.4 -402.889
INDEX OPTIONS 317458 8375.8 294739 7896.33 2384588 75914.5 479.4695
STOCK FUTURES 101011 2826.62 89711 2588.7 1801492 48950 237.9243
STOCK OPTIONS 75582 1927.54 74499 1890.52 129118 3515.71 37.022
TOTAL 479.46
STOCKS IN NEWS SKS Micro Q2 net rises 37% to Rs 78 crore Rel Power’s abandoned Tilaiya UMPP may be auc-
tioned afresh Nestle’s advertising volumes to double as co readies
for re-launch of noodles Apollo Health (subsidiary of Apollo Hospitals) hires
Spark Cap to manage 25% stake sale Tata Communications to recalibrate investments to
improve product and solutions L&T dispatches first consignment of ITER cryostat NIFTY FUTURE
In yesterday trading session Nifty stayed steady to bullish and rose gradually in last hour to keep the trend upside for the next session. So we advise you to buy Nifty Fu-ture around 8240 for the targets of 8340 and 8450 with strict stop loss of 8090.
INDICES R2 R1 PIVOT S1 S2
NIFTY 8,311.00 8,293.00 8,226.00 8,248.00 8,221.00
BANK NIFTY 18,014.00 17,934.00 17,876.00 17,796.00 17,738.00

DAILY REPORT
20th
OCT. 2015
YOUR MINTVISORY Call us at +91-731-6642300
RECOMMENDATIONS
GOLD
TRADING STRATEGY:
BUY GOLD OCT ABOVE 27100 TGTS 27180,27270 SL BE-
LOW 26900
SELL GOLD OCT BELOW 26900 TGTS 26820,26730 SL
ABOVE 27100
SILVER
TRADING STRATEGY:
BUY SILVER DEC ABOVE 37100 TGTS 37300,37600 SL BE-
LOW 37800
SELL SILVER DEC BELOW 36800 TGTS 36600,36300 SL
ABOVE 37100
COMMODITY ROUNDUP MCX Gold futures slipped under Rs 27000 per 10 grams mark before recovering as the global prices moderated amid profit selling after recent surge. Stocks stayed mixed as investors eyed the China economic data. Recent gains also capped buying in major indices. Gold soared to highest levels in nearly four months last week following a break above the100 day EMA amid excellent spot market demand and rising global commodity prices. COMEX Gold futures are trading at $1176 per ounce, down 0.60% on the day. MCX Gold futures are trading at Rs 27039 per 10 grams, down 0.415 on the day after testing a low of Rs 26925 ear-lier. The yellow metal witnessed good buying with the re-cent upside convincing traders that major bottom has been carved out in Gold. Idea that the US Fed is likely to go easy on the proposed rate hike is benefitting gold immensely. The Chief of the Federal Reserve Bank of New York said that a Federal Reserve rate hike remain likely this year but the final decision would continue to be based on how the econ-omy continues to perform and would remain data depend-ent. Gold speculator and large futures traders sharply in-creased their gold bullish positions higher last week for a fourth straight week Deceleration in China's economic growth as President focus from investment to consumption-led growth to avoid any hard landing for the world's second largest economy has meant the cycle of capacity, production and demand for the world steel industry has come to an end. Indian steel de-mand in 2015 is to rise to 81.5 mt from 75.9 mt in 2014. WSA says its use will further improve by 7.6% to 87.6 mt next year. Hopefully, the three-year high of 6.4 per cent rise in industrial growth in August, supported by good showing in manufacturing, mining and electricity, will be sustained to generate good demand for steel in the months ahead. WTI Crude oil futures dropped today amid broad demand worries and soft Chinese economic growth data. Equities were mixed with a bearish tinge and WTI futures fell through $47 per barrel mark to pare nearly two % in intra-day moves. The counter is currently trading at $46.42 per barrel, down 1.80% on the day. MCX Crude oil futures are trading at Rs 3011per barrel, down 1.44% on the day. The latest sell off is threatening to drag oil towards its two week low yet again. Indian Copper futures were down 0.72% at Rs 344 per kg. The prices tested a low of Rs 343.80 per kg and a high of Rs 345.90 per kg.
DAILY REPORT
20th
OCT. 2015
YOUR MINTVISORY Call us at +91-731-6642300
NCDEX
NCDEX ROUNDUP Chana prices hit the lower circuit on NCDEX on hurried sell-ing by traders following the central government’s decision on a stock limit for pulses held by big importers and retail-ers. All contracts of chana slumped by four per cent or about Rs 200 a quintal in early Monday trade. i.e. chana for delivery in Nov fell by Rs 212 to Rs 5,092 a quintal. A similar trend was seen in spot market, as well as with tur in the benchmark Latur (Maharashtra) wholesale market, which fell by 14% or Rs 20 to Rs 115 a kg. The impact on urad (black gram) and tur dal was not that much; their prices fell by Rs 10 and Rs 1 to Rs 115 a kg and Rs 50 a kg, respectively. Mustardseed prices were down by Rs 88 to Rs 4,920 per quintal in future trading after traders trimmed positions, taking weak cues from spot market. NCDEX mustardseed for delivery in Nov contract fell Rs 88, or 1.76% to Rs 4,920 per quintal, with an OI of 59,300 lots. Mustardseed for delivery in current month lost Rs 57, or 1.16% to Rs 4,851 per quin-tal, having an OI of 570 lots. Apart from pickup in arrivals from growing regions, slackened demand from oil mills and vanaspati units at higher levels in physical markets mainly led to the fall in mustardseed prices at futures trading. Refined soya oil prices were down 0.87 per cent to Rs 620.90 per 10 kg in futures trade after participants reduced their exposure amid fall in demand in the spot market against adequate stocks. At NCDEX, refined soya oil for de-livery in Nov month fell by Rs 5.45, or 0.87% to Rs 620.90 per 10 kg with an OI of 75,330 lots. The October contract shed Rs 1.25, or 0.20% to Rs 633.50 per 10 kg in 5,865 lots. Besides fall in demand in the spot market, adequate stocks position on higher supplies from growing regions mainly pulled down refined soya oil prices at futures trade.
NCDEX INDICES
Index Value % Change
CAETOR SEED 4030 +1.38
CHANA 5005 -3.97
CORIANDER 11750 -0.44
COTTON SEED 1702 +1.79
GUAR SEED 1800 -2.55
JEERA 4785 -2.05
MUSTARDSEED 4785 -2.51
REF. SOY OIL 631.85 -0.46
TURMERIC 2780 -0.04
WHEAT 6150 +2.57
RECOMMENDATIONS
DHANIYA
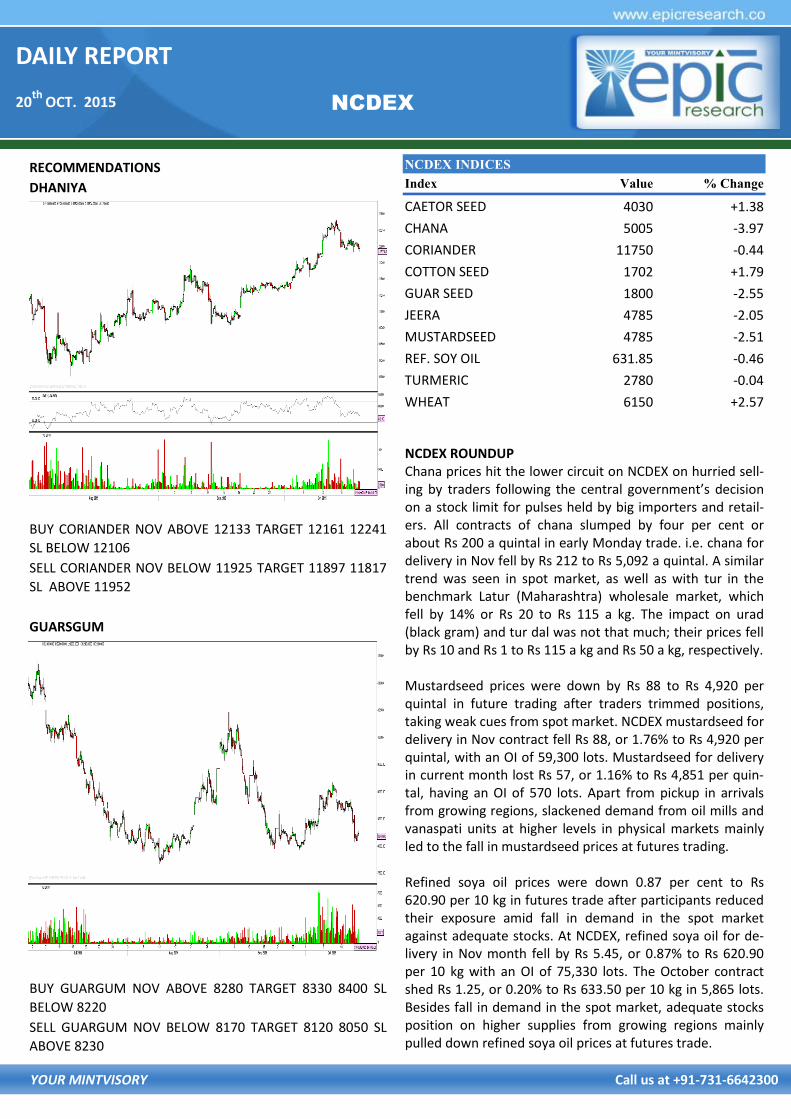
BUY CORIANDER NOV ABOVE 12133 TARGET 12161 12241
SL BELOW 12106
SELL CORIANDER NOV BELOW 11925 TARGET 11897 11817
SL ABOVE 11952
GUARSGUM
BUY GUARGUM NOV ABOVE 8280 TARGET 8330 8400 SL
BELOW 8220
SELL GUARGUM NOV BELOW 8170 TARGET 8120 8050 SL
ABOVE 8230

DAILY REPORT
20th
OCT. 2015
YOUR MINTVISORY Call us at +91-731-6642300
RBI Reference Rate
Currency Rate Currency Rate
Rupee- $ 64.8178 Yen-100 54.3600
Euro 73.7497 GBP 100.1176
CURRENCY
USD/INR
BUY USD/INR OCT ABOVE 64.94 TARGET 65.07 65.22 SL BE-
LOW 64.74
SELL USD/INR OCT BELOW 64.8 TARGET 64.67 64.52 SL
ABOVE 65
EUR/INR
BUY EUR/INR OCT ABOVE 73.6 TARGET 73.75 73.95 SL BE-
LOW 73.4
SELL EUR/INR OCT BELOW 73.2 TARGET 73.05 72.85 SL
ABOVE 73.4
CURRENCY MARKET UPDATES:
The Indian rupee pared its early gains, but was still trading up by 2 paise at 64.79 against the US currency in late-morning deals on bouts of dollar selling by banks and ex-porters. Earlier, the domestic unit opened higher at 64.77 per dollar as against last Friday’s closing level of 64.81 at the Interbank Forex market. Later, it fell on fresh dollar demand by importers to Rs 64.85 before quoting at 64.79 at 1030 hours. The domestic unit is hovering in a range of 64.85 to 64.73 during the morning deals.
The US dollar pared some of its early gains against a basket of currencies in subdued trades on Monday, as sentiment on the greenback was still fragile after the release of mixed U.S. economic reports last week. The dollar index, which measures the greenback's strength against a trade-weighted basket of six major currencies, was up 0.09% at 94.84. The preliminary reading of the University of Michi-gan's consumer sentiment index came in at 92.1 on Friday, compared to forecasts of 89 and up from 87.2 in Septem-ber. But another report showed that U.S. industrial produc-tion declined 0.2% in September, pressured lower by weakness in the oil and gas sector.
The dollar index is currently trading down by 0.02 per cent at 94.66 as against a basket of six currencies.
The European unit was lower against the dollar, down 0.11% at 1.1333. Meanwhile, demand for the safe-haven yen strengthened after data on Monday showed that China's economic growth slowed to 6.9% in the third quar-ter, down from 7% in the previous quarter. The figure is the country's slowest growth rate since 2009. A separate report showed that Chinese industrial production rose at a year-on-year rate of 5.7% in September, disappointing ex-pectations for a 6.0% gain. The dollar was steady against the yen, with USD/JPY at 119.40. As against the pound, the dollar was lower with GBP/USD gaining 0.30% to 1.5486.
The Canadian dollar, already under pressure from sliding crude oil prices, faced extra headwinds as Canada's Liberal Party, was tipped to won Monday's general election which would pave the way for increased government spending.

DAILY REPORT
20th
OCT. 2015
YOUR MINTVISORY Call us at +91-731-6642300
CALL REPORT
PERFORMANCE UPDATES
Date Commodity/ Currency
Pairs Contract Strategy Entry Level Target Stop Loss Remark
16/10/15 NCDEX DHANIYA NOV. BUY 12120 12148-12228 12093 NOT EXECUTED
16/10/15 NCDEX DHANIYA NOV. SELL 11900 11872-11792 11927 NOT EXECUTED
16/10/15 NCDEX GUARGUM NOV. BUY 8500 8550-8620 8440 NOT EXECUTED
16/10/15 NCDEX GUARGUM NOV. SELL 8410 8360-8290 8470 BOOKED FULL PROFIT
16/10/15 MCX GOLD OCT. BUY 27400 27480-27570 27300 NOT EXECUTED
16/10/15 MCX GOLD OCT. SELL 27100 27020-26930 27200 BOOKED FULL PROFIT
16/10/15 MCX SILVER DEC. BUY 37500 37700-38000 37200 NOT EXECUTED
16/10/15 MCX SILVER DEC. SELL 37200 37000-36700 37500 NOT EXECUTED
16/10/15 USD/INR OCT. BUY 64.95 65.08-65.23 64.75 NOT EXECUTED
16/10/15 USD/INR OCT. SELL 64.77 64.64-64.49 64.97 NOT EXECUTED
16/10/15 EUR/INR OCT. BUY 73.81 73.96-74.16 73.61 SL TRIGGERED
16/10/15 EUR/INR OCT. SELL 73.66 73.51-73.31 73.86 BOOKED PROFIT
Date Scrip
CASH/
FUTURE/
OPTION
Strategy Entry Level Target Stop Loss Remark
16/10/15 NIFTY FUTURE BUY 8200-8230 8330-8450 8000 NOT EXECUTED
16/10/15 APOLLOHOSP FUTURE SELL 1435 1420-1400 1451 BOOKED PROFIT
16/10/15 ALBK FUTURE BUY 78 79.25-80.75 78 CALL OPEN
16/10/15 SCI CASH SELL 81 80-78.5 83 NOT EXECUTED
16/10/15 NIFTY FUTURE SELL 8250-8300 8150-8000 8400 NO PROFIT NO LOSS
09/10/15 NIFTY FUTURE SELL 8190 8070-7950 8380 CALL OPEN
09/10/15 NIFTY FUTURE SELL 8180 8100-7050 8350 CALL OPEN

DAILY REPORT
20th
OCT. 2015
YOUR MINTVISORY Call us at +91-731-6642300
NEXT WEEK'S U.S. ECONOMIC REPORTS
ECONOMIC CALENDAR
The information and views in this report, our website & all the service we provide are believed to be reliable, but we do not accept any
responsibility (or liability) for errors of fact or opinion. Users have the right to choose the product/s that suits them the most. Sincere ef-
forts have been made to present the right investment perspective. The information contained herein is based on analysis and up on sources
that we consider reliable. This material is for personal information and based upon it & takes no responsibility. The information given
herein should be treated as only factor, while making investment decision. The report does not provide individually tailor-made invest-
ment advice. Epic research recommends that investors independently evaluate particular investments and strategies, and encourages in-
vestors to seek the advice of a financial adviser. Epic research shall not be responsible for any transaction conducted based on the infor-
mation given in this report, which is in violation of rules and regulations of NSE and BSE. The share price projections shown are not nec-
essarily indicative of future price performance. The information herein, together with all estimates and forecasts, can change without no-
tice. Analyst or any person related to epic research might be holding positions in the stocks recommended. It is understood that anyone
who is browsing through the site has done so at his free will and does not read any views expressed as a recommendation for which either
the site or its owners or anyone can be held responsible for . Any surfing and reading of the information is the acceptance of this dis-
claimer. All Rights Reserved. Investment in equity & bullion market has its own risks. We, however, do not vouch for the accuracy or the
completeness thereof. We are not responsible for any loss incurred whatsoever for any financial profits or loss which may arise from the
recommendations above epic research does not purport to be an invitation or an offer to buy or sell any financial instrument. Our Clients
(Paid or Unpaid), any third party or anyone else have no rights to forward or share our calls or SMS or Report or Any Information Pro-
vided by us to/with anyone which is received directly or indirectly by them. If found so then Serious Legal Actions can be taken.
Disclaimer
TIME REPORT PERIOD ACTUAL CONSENSUS
FORECAST PREVIOUS
MONDAY, OCT. 19
10 AM HOME BUILDERS' INDEX OCT. 62 62
TUESDAY, OCT. 20
8:30 AM HOUSING STARTS SEPT. 1.131 MLN 1.126 MLN
WEDNESDAY, OCT. 21
NONE SCHEDULED
THURSDAY, OCT. 22
8:30 AM WEEKLY JOBLESS CLAIMS OCT. 10 N/A N/A
10 AM EXISTING HOME SALES SEPT. 5.31 MLN 5.31 MLN
FRIDAY, OCT. 23
NONE SCHEDULED