formal and informal institutional influences on
TRANSCRIPT

Kennesaw State UniversityDigitalCommons@Kennesaw State University
Dissertations, Theses and Capstone Projects
4-1-2013
Formal and Informal Institutional Influences onMultinational Enterprise Social Responsibility:Two Empirical StudiesDawn L. KeigKennesaw State University
Follow this and additional works at: http://digitalcommons.kennesaw.edu/etdPart of the Business Administration, Management, and Operations Commons
This Dissertation is brought to you for free and open access by DigitalCommons@Kennesaw State University. It has been accepted for inclusion inDissertations, Theses and Capstone Projects by an authorized administrator of DigitalCommons@Kennesaw State University.
Recommended CitationKeig, Dawn L., "Formal and Informal Institutional Influences on Multinational Enterprise Social Responsibility: Two EmpiricalStudies" (2013). Dissertations, Theses and Capstone Projects. Paper 537.
FORMAL AND INFORMAL INSTITUTIONAL INFLUENCES ON
MULTINATIONAL ENTERPRISE SOCIAL RESPONSIBILITY:
TWO EMPIRICAL STUDIES
by
Dawn L. Keig
A Dissertation
Presented in Partial Fulfillment of Requirements for the
Degree of
Doctor of Business Administration
in the
Coles College of Business
Kennesaw State University
Kennesaw, GA
2013


Copyright by
Dawn L. Keig
2013

iv
DEDICATION
To Steve, my rock for over twenty-five years, making everything possible.

v
ACKNOWLEDGEMENTS
I would like to acknowledge the help I received from others in making this lifelong
dream a reality. At the top of that list is my dissertation supervisor, major professor, and
scholarly mentor, Dr. Lance Brouthers. Lance, when we first met I could never have
predicted what a tremendously important person you would become in my life. You have
not only taught me what research excellence really means, but you have inspired me to
love ideas and to embrace the art of thinking. We have developed a unique relationship,
and you have helped set my academic career off in exciting directions. For your
investment in me, I am truly grateful.
I would also like to thank my other dissertation committee members, Keith Brouthers and
Raj Veliyath, for their support in helping me polish my ideas into a finished product. And
I appreciate Vic Marshall’s valuable statistics support and advice. I could not have
navigated those Econometrics textbooks without your help!
I am thankful for the shared experience and friendship of my DBA Cohort 2 colleagues
over the past three years. In particular, I acknowledge my dearest friend Bob Reich.
Bobski, you and I were friends and colleagues a long time before arriving at KSU, and it
is still one of my favorite life coincidences that we both independently and unknowingly
applied to the same program at the same time! I could not have done this without your
love and support and am glad our families will be friends for life.
I am also appreciative of the support of my colleagues at Brenau University. You
believed in me and supported me with friendly guidance, flexible scheduling, and lots of
Pilates and yoga sessions to help me maintain sanity throughout the dissertation process.
In particular I appreciate the beautiful friendship and support of Jeannie Gaines, a truly
understanding friend who always made sure my family was well cared for while my head
was in my computer!
And most importantly, I would like to thank my amazingly supportive family. Steve, you
have never let me down. I cannot imagine the pain of having to listen to a doctoral-
seeking spouse’s constant theoretical and statistical dribble. And considering the amount
of technical data support you generously donated to my cause, your name should go on
that degree as much as mine! Montana and Colton, your support of the wild ambitions of
your dear old “Dr. Mom” is one of the purest joys of my life. And to my Mom and Dad,
thank you for inspiring me to take this opportunity to make you proud – I don’t think I’ll
ever get too old for that.

vi
ABSTRACT
FORMAL AND INFORMAL INSTITUTIONAL INFLUENCES ON
MULTINATIONAL ENTERPRISE SOCIAL RESPONSIBILITY:
TWO EMPIRICAL STUDIES
by
Dawn L. Keig
How do environmental institutional influences in a multinational enterprise’s
(MNE’s) total portfolio of locations affect its social responsibility (and irresponsibility)?
To begin to answer this question, I engaged in two complementary empirical research
studies, each exploring a particular subset of the MNE portfolio environment-social
responsibility dynamic.
The first study applies the concept of institutional distance from the international
business literature to examine how the differences in formal and informal institutional
environments across a firm’s full portfolio of operating locations can affect its social
performance. I hypothesize and find that firms with greater informal institutional distance
within their locations will have lower overall levels of corporate social performance. I
also suggest that greater average formal institutional distance within the MNE’s portfolio
will moderate the social responsibility benefits associated with greater international
scope. These hypotheses were tested and found to be supported using secondary data on a
sample of 408 firms headquartered throughout Europe, Asia, and North America.

vii
The second study also explores the institutional environment of MNEs and social
responsibility, but from a different perspective. This study looks at the influence of
institutionalized corruption on firms’ corporate social irresponsibility (CSiR). Consistent
with institutional theory, I conceptualize corruption as having both a formal and informal
component and hypothesize that operating in portfolios of locations with greater formal
and/or informal corruption environments may lead MNEs to have higher levels of social
irresponsibility. Furthermore, I explore the relationship between irresponsible behavior
and firm performance, finding that higher levels of firm CSiR are related to lower
performance. Support for my social irresponsibility hypotheses was confirmed using a
sample of 699 MNEs operating throughout the world.
It has been noted that institutions matter to international business. These two
studies help us better understand the complex institutional environments of MNEs and
how specific institutional environments can matter to MNE social responsibility-related
outcomes, providing guidance related to country selection for MNE managers concerned
about maintaining high corporate social performance and minimizing incidents of social
irresponsibility in their firms.
Keywords: corporate social responsibility (CSR), corporate social performance (CSP),
corporate social irresponsibility (CSiR), institutional theory, institutional distance,
corruption, multinational enterprise (MNE), portfolio, absorptive capacity

viii
TABLE OF CONTENTS
Dedication ......................................................................................................................... iv
Acknowledgements ............................................................................................................. v
Dissertation Abstract ......................................................................................................... vi
List of Tables .................................................................................................................... ix
List of Figures ..................................................................................................................... x
CHAPTER 1: Research Summary .................................................................................... 11
CHAPTER 2: THE IMPACT OF MNE PORTFOLIO FORMAL AND ......................... 20
INFORMAL INSTITUTIONAL DISTANCE ON CORPORATE
SOCIAL PERFORMANCE (Paper 1)
Abstract ............................................................................................................................. 20
Introduction ....................................................................................................................... 21
Theory and Hypotheses..................................................................................................... 26
Methodology ..................................................................................................................... 44
Results ............................................................................................................................... 62
Discussion ......................................................................................................................... 69
References ......................................................................................................................... 78
CHAPTER 3: FORMAL AND INFORMAL CORRUPTION ENVIRONMENTS ........ 88
AND MULTINATIONAL ENTERPRISE SOCIAL
IRRESPONSIBILITY (Paper 2)
Abstract ............................................................................................................................. 88
Introduction ....................................................................................................................... 89
Theory and Hypotheses..................................................................................................... 94
Methodology ................................................................................................................... 111
Results ............................................................................................................................. 126
Discussion ....................................................................................................................... 136
References ....................................................................................................................... 143
APPENDIX A: Overview of the Dissertation Findings ................................................. 154
APPENDIX B: Secondary Data Collection Methodology ............................................. 157

ix
LIST OF TABLES
CHAPTER 2: THE IMPACT OF MNE PORTFOLIO FORMAL AND INFORMAL
INSTITUTIONAL DISTANCE ON CORPORATE SOCIAL
PERFORMANCE (Paper 1)
Table
2.1 Sample description by headquarters country .............................................................. 47
2.2 Sample description by industry sector and headquarters region ................................. 48
2.3 CSRHub social responsibility rating dimensions and sub-categories......................... 49
2.4 Exploratory factor analysis CSRHub Overall CSR Index .......................................... 50
2.5 EPI environmental performance policy categories and indicators ............................. 55
2.6 Sample headquarters country 2010 EPI scores ........................................................... 56
2.7 Variables, measures, and sources of data .................................................................... 61
2.8 Descriptive statistics ................................................................................................... 62
2.9 Correlations of variables ....................................................................................... 63-64
2.10 Hierarchical regression results .................................................................................. 65
2.11 Simple slope analysis results .................................................................................... 69
CHAPTER 3: FORMAL AND INFORMAL CORRUPTION ENVIRONMENTS AND
MULTINATIONAL ENTERPRISE SOCIAL IRRESPONSIBILITY
(Paper 2)
Table
3.1 KLD social irresponsibility weakness items representing firm CSiR ...................... 114
3.2 Perceptual informal corruption items on Global Corruption Barometer .................. 116
3.3 Exploratory factor analysis formal corruption environment (FCE) .......................... 122
3.4 KLD social responsibility strength items representing firm CSR ............................ 124
3.5 Variables, measures, and sources of data .................................................................. 125
3.6 Description and correlations of variables ......................................................... 129-130
3.7 Regression results for Stage 1 (Hypotheses 1 and 2) ................................................ 131
3.8 Regression results for Stage 2 (Hypothesis 3) .......................................................... 134
APPENDICES
Table
A.1 Dissertation findings and associated managerial and research implications ... 155-156
B.1 Country-level data elements and sources used to create portfolio measures ........... 162
B.2 Total count of records created in preparation of dissertation samples ..................... 163

x
LIST OF FIGURES
CHAPTER 2: THE IMPACT OF MNE PORTFOLIO FORMAL AND INFORMAL
INSTITUTIONAL DISTANCE ON CORPORATE SOCIAL
PERFORMANCE (Paper 1)
Figure
2.1 Conceptual research model ......................................................................................... 32
2.2 Interaction of portfolio formal institutional distance (PFID) and international scope on
firm CSP............................................................................................................................ 68
CHAPTER 3: FORMAL AND INFORMAL CORRUPTION ENVIRONMENTS AND
MULTINATIONAL ENTERPRISE SOCIAL IRRESPONSIBILITY
(Paper 2)
Figure
3.1 Conceptual research model ......................................................................................... 99
APPENDICES
Figure
B.1 Logical data model ................................................................................................... 159

11
CHAPTER 1
RESEARCH SUMMARY
As multinational enterprises (MNEs) diversify internationally they face a variety
of regulatory and cultural expectations in the foreign operating environments into which
they are expanding (McWilliams, Siegel, & Wright, 2006; Mohan, 2006). This may
include specific local expectations related to corporate social responsibility (CSR)
(Campbell, 2007). Despite the potential environmental complexity facing MNEs, existing
social responsibility research tends to concentrate on domestic issues and contexts
(Aguinis & Glavas, 2012). Prior research has not yet helped MNE managers understand
how the integration of a particular set of countries into their operational scope might
positively or negatively affect their social responsibility-related outcomes.
This represents a potentially significant problem for MNEs that have identified
social responsibility as a strategic imperative. This gap in the literature inspired this
dissertation to consider addressing the core question: How do environmental institutional
influences in a MNE’s total portfolio of locations affect its overall social responsibility
(and irresponsibility)?
To begin to explore portfolio institutional links to social responsibility and
irresponsibility, this dissertation incorporates two independent, but complementary,
empirical research studies. The studies are independent in that each empirical study
explores a particular subset of relationships between MNE institutional environments and

12
social responsibility-related outcomes. Each study also promotes and tests a unique
research model and does so using completely separate constructs, variables, sample
frames and samples, secondary data collections, and analytical techniques. This overall
research design maximizes the value of the multi-paper dissertation format and enables
the exploration of a more diverse set of international institutional-social responsibility
dynamics.
The two studies are also complementary in that they are tied together by three key
thematic and conceptual commonalities. First, both studies look at the antecedents of
social responsibility in an international context. Only a small percentage of CSR studies
have examined firm social responsibility as a dependent variable (Margolis & Walsh,
2003). Similarly, truly international social responsibility and irresponsibility research
remains a relative rarity (Arthaud-Day, 2005; Egri & Ralston, 2008; Mohan, 2006). Both
of my proposed studies examine specific environmental antecedents to social
responsibility-related outcomes for MNEs, and each uses a wide sample of firms
headquartered in and/or operating in all parts of the world.
Second, both dissertation studies share a common theoretical foundation,
institutional theory. Institutional theory recognizes that firms seek legitimacy within the
their target markets (Scott, 2008) and rely on cues from both formal and informal
institutions in their environments to understand and respond appropriately (North, 1990).
Establishing legitimacy can become even more complex for MNEs who operate in
multiple countries with potentially widely diverse institutional expectations (Kostova,
Roth, & Dacin, 2008). National institutions can be strong determinants of firm-level
social responsibility practices (Ioannou & Serafeim, 2012; Jackson & Apostolakou,

13
2010). Thus, an institutional lens is used in both studies to examine the impact of a
variety of environmental conditions on the social responsibility-related outcomes of
MNEs.
Third, both studies draw upon a paradigm used in the international business
literature that conceptualizes the MNE as a unique portfolio of locations (Chao & Kumar,
2010; Gomez-Mejia, Makri, & Kintana, 2010; Gomez-Mejia & Palich, 1997; Kim &
Park, 2002; Nachum & Song, 2011; Zaheer & Hernandez, 2011). In contrast to studies
that focus specifically on home country or particular home-host dyads, this portfolio
perspective incorporates the entire set of subsidiary locations which comprise a MNE’s
operating portfolio, resulting in a more holistic consideration of the variety of
environmental influences potentially affecting firm social responsibility outcomes. I
propose that an MNE’s overall social responsibility posture and results can be expected
to be influenced by the characteristics of its entire portfolio of locations, not just its
headquarters country.
Paper 1, “The Impact of MNE Portfolio Formal and Informal Institutional
Distance on Corporate Social Performance”, applies the concept of institutional distance
from the international business literature to examine how the institutional environments
of a firm’s entire set of operating locations can affect its social performance. Institutional
distance describes the similarities or differences between institutional elements in
different countries (Kostova, 1999). Utilizing a portfolio conceptualization, formal and
informal institutional distances are calculated based on the average differences between
institutional attributes of the firm’s home country compared to corresponding attributes
of all of the firm’s operating subsidiary locations.

14
I hypothesize and find that firms with greater informal institutional distance
within their locations will have lower overall levels of corporate social performance.
Informal institutions are driven largely by culture (Peng, Wang, & Jiang, 2008). Because
each country represents a unique set of cultural attributes (Hofstede, 1980), the greater
the differences between country cultures, the greater the difficulties a firm can expect in
learning and meeting the unique local expectations (Kostova, 1999; Xu & Shenkar, 2002)
including what constitutes socially responsible behavior.
I also relate institutional distance to another firm characteristic that has been
found to have a relationship to social responsibility: international scope. Greater
international scope has been linked to higher levels of overall firm social responsibility
(Bansal, 2005; Bansal & Hunter, 2003; Déniz-Déniz & Garcia-Falcon, 2002; Kang, 2013;
Kennelly & Lewis, 2002; Strike, Gao, & Bansal, 2006). I hypothesize and find that
greater average formal institutional distance within the MNE’s portfolio will moderate
the social responsibility benefits associated with greater international scope and argue
that the absorptive capacity developed through greater experience enables firms from
high CSR countries to more readily build upon and leverage their prior knowledge in
lower-standard environments (Cohen & Levinthal, 1990). To reflect and maintain its
hierarchical nature, formal institutional distance is conceptualized asymmetrically, and
the sign/direction of formal distance is retained in the measurement model and analysis.
The results, tested using multiple hierarchical regressions on a sample of 408 firms
headquartered throughout Europe, Asia, and North America, support the hypothesis:
greater formal and informal institutional distance between the MNE’s portfolio of
locations impacts CSP.

15
Paper 2, “Formal and Informal Corruption Environments and Multinational
Enterprise Social Irresponsibility”, also explores the institutional environment of MNEs
and social responsibility, but from a different perspective. This study looks at the
institutional influences of corruption on firms’ corporate social irresponsibility (CSiR).
CSiR is more than just a lack of CSR (Lange & Washburn, 2012). CSiR reflects a
specific action that “negatively affects an identifiable social stakeholder’s legitimate
claims” (Strike, et al., 2006).
Consistent with institutional theory (North, 1990), I conceptualize the institution
of corruption as having both a formal and informal component. This conceptualization
considers not only public sector corruption levels (formal corruption environment), but
also the permeation of corruption into the general culture (informal corruption
environment). I hypothesize and find that operating in portfolios of locations with greater
formal and/or informal corruption environments leads MNEs to have higher levels of
social irresponsibility.
Furthermore, I investigate the normative aspects of firm social irresponsibility by
exploring the relationship between CSiR and firm performance. Irresponsible behavior
may expose a firm to pressures from both private (e.g. non-governmental organization)
and public (e.g. regulatory) constituents, requiring actions and resources to address the
irresponsible behavior and stakeholder harm. Not only can reacting to irresponsibility be
a drain on firm resources, but a pattern of socially irresponsible actions may put the
firm’s legitimacy with its stakeholders at risk. Therefore I hypothesize and find that firms
with higher CSiR will be outperformed by more socially responsible firms that do not

16
have to contend with these added risks and costs. My hypotheses are tested and supported
using two-stage least squares (2SLS) regression on a sample of 699 MNEs.
With one empirical study examining MNE institutional distance and corporate
social performance and a second study exploring the institution of corruption and MNE
social irresponsibility and related firm performance, the two studies individually
contribute to what we know about social responsibility in an international context and
together can help us better understand the complex institutional environments of MNEs
and social responsibility outcomes. It has been noted that “institutions matter” to business
strategy (Peng, Sunny, Pinkham, & Hao, 2009, p. 65). This dissertation’s findings help us
better understand how institutional environments can matter to MNE social
responsibility-related strategy. The results provide specific guidance related to country
selection and social responsibility strategy for MNE managers concerned about
maintaining high CSP and minimizing incidents of CSiR. Selecting countries that
minimize formal and informal institutional distance as well as formal and informal
corruption environments can reduce the negative impact to firm social responsibility-
related outcomes.

17
REFERENCES
Aguinis, H., & Glavas, A. (2012). What we know and don't know about corporate social
responsibility: A review and research agenda. Journal of Management, 38(4),
932-968.
Arthaud-Day, M. L. (2005). Transnational corporate social responsibility: A tri-
dimensional approach to international CSR research. Business Ethics Quarterly,
15(1), 1-22.
Bansal, P. (2005). Evolving sustainably: A longitudinal study of corporate sustainable
development. Strategic Management Journal, 26(3), 197-218.
Bansal, P., & Hunter, T. (2003). Strategic explanations for the early adoption of ISO
14001. Journal of Business Ethics, 46(3), 289-299.
Campbell, J. L. (2007). Why would corporations behave in socially responsible ways? An
institutional theory of corporate social responsibility. Academy of Management
Review, 32(3), 946-967.
Chao, M. C. H., & Kumar, V. (2010). The impact of institutional distance on the
international diversity-performance relationship. Journal of World Business,
45(1), 93-103.
Cohen, W. M., & Levinthal, D. A. (1990). Absorptive capacity: A new perspective on
learning and innovation. Administrative Science Quarterly, 35(1), 128-152.
Déniz-Déniz, M. C., & Garcia-Falcon, J. M. (2002). Determinants of the multinationals'
social response: Empirical application to international companies operating in
Spain. Journal of Business Ethics, 38(4), 339-370.
Egri, C., & Ralston, D. (2008). Corporate responsibility: A review of international
management research from 1998 to 2007. Journal of International Management,
14(4), 319-339.
Gomez-Mejia, L. R., Makri, M., & Kintana, M. L. (2010). Diversification decisions in
family-controlled firms. Journal of Management Studies, 47(2), 223-252.

18
Gomez-Mejia, L. R., & Palich, L. E. (1997). Cultural diversity and the performance of
multinational firms. Journal of International Business Studies, 28(2), 309-335.
Hofstede, G. (1980). Culture’s consequences: National differences in thinking and
organizing. Beverly Hills, CA: Sage Publications.
Ioannou, I., & Serafeim, G. (2012). What drives corporate social performance? The role
of nation-level institutions. Journal of International Business Studies, 43(9), 834-
864.
Jackson, G., & Apostolakou, A. (2010). Corporate social responsibility in Western
Europe: An institutional mirror or substitute? Journal of Business Ethics, 94(3),
371-394.
Kang, J. (2013). The relationship between corporate diversification and corporate social
performance. Strategic Management Journal, 34, 94-109.
Kennelly, J. J., & Lewis, E. E. (2002). Degree of internationalization and corporate
environmental performance: Is there a link? International Journal of
Management, 19(3), 478-489.
Kim, K., & Park, J.-H. (2002). The determinants of value creation for partner firms in the
global alliance context. Management International Review, 42(4), 361-384.
Kostova, T. (1999). Transnational transfer of strategic organizational practices: A
contextual perspective. Academy of Management Review, 24(2), 308-324.
Kostova, T., Roth, K., & Dacin, M. (2008). Institutional theory in the study of
multinational corporations: A critique and new directions. Academy of
Management Review, 33(4), 994-1006.
Lange, D., & Washburn, N. T. (2012). Understanding attributions of corporate social
irresponsibility. Academy of Management Review, 37(2), 300-326.
Margolis, J. D., & Walsh, J. P. (2003). Misery loves companies: Rethinking social
initiatives by business. Administrative Science Quarterly, 48(2), 268-305.

19
McWilliams, A., Siegel, D. S., & Wright, P. M. (2006). Corporate social responsibility:
Strategic implications. Journal of Management Studies, 43(1), 1-18.
Mohan, A. (2006). Global corporate social responsibilities management in MNCs.
Journal of Business Strategies, 23(1), 9–32.
Nachum, L., & Song, S. (2011). The MNE as a portfolio: Interdependencies in MNE
growth trajectory. Journal of International Business Studies, 42(3), 381-405.
North, D. C. (1990). Institutions, institutional change, and economic performance.
Cambridge: Cambridge University Press.
Peng, M. W., Sunny, L. S., Pinkham, B., & Hao, C. (2009). The institution-based view as
a third leg for a strategy tripod. Academy of Management Perspectives, 23(3), 63-
81.
Peng, M. W., Wang, D. Y. L., & Jiang, Y. (2008). An institution-based view of
international business strategy: A focus on emerging economies. Journal of
International Business Studies, 39(5), 920-936.
Scott, W. (2008). Institutions and organizations: Ideas and interests (3rd ed.). Thousand
Oaks, CA: Sage Publications.
Strike, V. M., Gao, J., & Bansal, P. (2006). Being good while being bad: Social
responsibility and the international diversification of US firms. Journal of
International Business Studies, 37(6), 850-862.
Xu, D., & Shenkar, O. (2002). Institutional distance and the multinational enterprise.
Academy of Management Review, 27(4), 608-618.
Zaheer, A., & Hernandez, E. (2011). The geographic scope of the MNC and its alliance
portfolio: Resolving the paradox of distance. Global Strategy Journal, 1(1‐2),
109-126.

20
CHAPTER 2 (Paper 1)
THE IMPACT OF MNE PORTFOLIO FORMAL AND INFORMAL
INSTITUTIONAL DISTANCE ON CORPORATE SOCIAL PERFORMANCE
Abstract
Does country selection affect the corporate social performance (CSP) of
multinational enterprises (MNEs)? In this study I argue that greater diversity within an
MNE’s operating environment may adversely affect its ability to maintain higher levels
of CSP. Using institutional distance as my theoretical lens, I investigate the impact of
institutional differences on CSP. Following prior international business studies, I
conceptualize the MNE as a unique portfolio of locations and use the MNE’s entire
operating footprint to explore the effects of average portfolio formal and informal
institutional distances on CSP. I hypothesize and find that firms with greater average
informal institutional distance within their portfolios have lower overall levels of CSP.
Findings also confirm that due to absorptive capacity and the asymmetric nature of
formal institutional distance, greater average formal institutional distance within the
MNE portfolio moderates the CSP benefits of international scope.
Keywords: corporate social responsibility (CSR), corporate social performance (CSP),
institutional theory, institutional distance, multinational enterprise (MNE), portfolio,
absorptive capacity

21
INTRODUCTION
Social responsibility recognizes that a firm’s stakeholder expectations extend
beyond purely economic obligations to include certain social and environmental
responsibilities (Campbell, 2007). Corporate social performance (CSP) represents an
aggregated view of the degree to which a firm has employed socially responsible
principles, processes, policies, and programs and achieved associated observable social
outcomes (Wood, 1991). The availability and transparency of tangible CSP information
helps investors, consumers, communities, and other stakeholders better understand and
compare the social performance of firms (Chatterji, Levine, & Toffel, 2009).
CSP assessments can have important consequences for businesses. Chatterji et al.
(2009) point out that the largest retirement fund in the U.S.,TIAA-CREF, sold over $50
million in Coca-Cola stock in 2006 after one CSP rating agency downgraded Coca-Cola’s
social responsibility score. Research investigating the relationship between CSP ratings
and stock prices has found that removal from social responsibility stock indices can have
a detrimental impact on firm stock price, and strong CSP ratings can minimize these
negative effects (Doh, Howton, Howton, & Siegel, 2010). Aided by a growing public
interest and visibility, CSP remains a topic of strategic relevance to both practitioners and
academics (Carroll & Shabana, 2010).
Existing CSP research tends to concentrate on domestic issues and contexts, as
confirmed by a recent systematic review of the management literature (Aguinis &
Glavas, 2012). Even within international management journals, more than half of the
empirical social responsibility studies are purely domestic in nature (Egri & Ralston,
2008). However, prior research has confirmed that greater international scope can lead to

22
higher CSP (Bansal, 2005; Bansal & Hunter, 2003; Déniz-Déniz & Garcia-Falcon, 2002;
Kang, 2013; Kennelly & Lewis, 2002; Strike, Gao, & Bansal, 2006).
Multinational enterprises (MNEs) may face particular challenges in maintaining
high levels of CSP due in part to the diversity of their operating environments (Mohan,
2006). As Campbell points out, CSP “may mean different things in different places to
different people and at different times” (2007, p. 950). This variation in attitudes may be
exhibited in a wide range of externally-driven pressures related to socially responsible
business practices across countries (Matten & Moon, 2008). Host country CSP
expectations may conflict with well-established home country norms and standards or
require the MNE to develop new capabilities and resources (Arthaud-Day, 2005). Such
conflicts/differences may influence MNE host country selection or the impact of host
country selection on CSP perceptions.
Despite this potential conflict, much of the prior international CSP research
focuses on firms’ home-country characteristics (Gjolberg, 2009; Ho, Wang, & Vitell,
2012; Ioannou & Serafeim, 2012; Jackson & Apostolakou, 2010; Ringov & Zollo, 2007;
Waldman, de Luque, Washburn, & House, 2006). This results in at least two
shortcomings relevant to the exploration of CSP in the multi-country context of MNEs.
First, while prior research has looked at home country influences on firm CSP,
prior research has not yet investigated how differences between MNE’s headquarters and
subsidiary country choices affect overall CSP. Prior empirical research has failed to
consider that key differences between specific countries for MNEs operating in variety of
home/host country environments might be an antecedent of social responsibility-themed
outcomes. This study is the first to examine directly the role that multiple home and host
country environmental differences have on overall CSP for MNEs.

23
Second, MNEs are a portfolio of investments (Nachum & Song, 2011). Each
MNE creates its own unique operational portfolio based on its chosen combination of
operating countries. Research has not yet looked at how key characteristics of the total
portfolio of an MNE might influence its CSP. Examinations that are limited to a
particular subset of locations can result in an incomplete view of potentially relevant
stakeholder influences.
As MNEs diversify internationally they may face a variety of new regulatory and
cultural expectations in the foreign operating environments into which they are
expanding (McWilliams, Siegel, & Wright, 2006; Mohan, 2006). This may include
specific expectations related to social responsibility (Campbell, 2007). To fully examine
a firm’s overall CSP requires consideration of the cumulative environmental
heterogeneity from all of its home and foreign operating locations. Taken as a whole,
prior research has not yet helped MNE managers understand how the integration of
particular countries into their operational scope might positively or negatively affect their
CSP. This represents a potentially significant problem for firms that have identified high
CSP as a strategic imperative.
Following prior international business researchers (Dunning & Lundan, 2008;
Estrin, Baghdasaryan, & Meyer, 2009; Holmes Jr, Miller, Hitt, & Salmador, 2012; Peng,
Sunny, Pinkham, & Hao, 2009; Peng, Wang, & Jiang, 2008), I use an institutional theory
perspective developed by North (1990) and theorize that both formal and informal
institutional distance within the MNE’s portfolio of locations can influence the firm’s
CSP. Institutions represent the “rules of the game in a society” (North, 1990, p. 3). These
“rules” encompass formal constraints and regulations as well as informal culturally-
influenced behavioral norms and conventions. Each country represents a unique

24
combination of institutional elements (Kogut, 1991). Institutional distance describes
similarities or differences between institutional elements in different countries (Kostova,
1999), and larger institutional distances increase risk and uncertainty, making it more
difficult for firms to effectively operate across diverse countries (Xu & Shenkar, 2002).
In addition in this paper I draw upon a paradigm from the international business
literature that conceptualizes the MNE as a unique portfolio of locations (Chao & Kumar,
2010; Gomez-Mejia, Makri, & Kintana, 2010; Gomez-Mejia & Palich, 1997; Kim &
Park, 2002; Nachum & Song, 2011; Zaheer & Hernandez, 2011). This portfolio
perspective incorporates the entire set of subsidiary locations which comprise the MNE’s
operating portfolio, resulting in a more holistic consideration of the variety of
environmental influences potentially affecting firm CSP.
Specifically, I hypothesize that greater informal institutional distances in the
portfolio of countries in which an MNE is collectively operating negatively influence the
firm’s CSP. Because informal institutional pressures are driven largely by culture (Peng,
et al., 2008), and each country represents a unique set of national cultural attributes
(Hofstede, 1980), firms entering new countries are faced with new informal institutional
expectations for which their prior experience has not necessarily prepared them. The
greater the differences between home and host cultures, the greater the difficulties a firm
can expect in learning and meeting the unique local expectations (Kostova, 1999; Xu &
Shenkar, 2002) as to what constitutes socially responsible behavior.
I also hypothesize that formal institutional distance in the MNE location portfolio,
reflecting differences in codified expectations, rules, and standards affects firm CSP. In
this regard the formal institutional distance is theorized to be asymmetric. I hypothesize
that the positive CSP benefits of international expansion (Bansal, 2005; Bansal & Hunter,

25
2003; Déniz-Déniz & Garcia-Falcon, 2002; Kang, 2013; Strike, et al., 2006) are
moderated by formal institutional distance.
I propose that an MNE expanding into countries with significantly higher formal
institutional social responsibility standards than its home country will obtain less of an
increase in CSP than an MNE expanding into countries with standards that are more
similar to (or lower than) its home country standard. This moderating impact occurs
because absorptive capacity developed through experience enables firms from high CSP
countries to more readily build upon and leverage their prior knowledge in lower-
standard environments (Cohen & Levinthal, 1990).
In contrast, firms from lower CSP countries will have more difficulties in building
upon their prior experience to fully absorb and apply the learning associated with
increased international scope in higher CSP locations. These firms will not realize the full
CSP benefits from the organizational learning associated with increased scope. I tested
and confirmed my portfolio distance hypotheses on a sample of 408 firms headquartered
throughout Europe, Asia, and North America.
My study contributes to a growing understanding of the antecedents of social
responsibility in an international context by exploring how formal and informal
institutional differences within an MNE’s portfolio of location selections can affect the
firm’s social responsibility outcomes. I suggest that stakeholders in different countries
may expect varying socially responsible practices for firms operating within their
borders. Based on this logic I propose that an MNE’s overall CSP postures can be
expected to be influenced by the differences inherent in its entire location portfolio, not
just its headquarters country. Thus, I take a holistic view of the MNE and consider the
impact of its unique portfolio of investment choices on its CSP results.

26
THEORY AND HYPOTHESES
Prior international CSP research has recognized a relationship between greater
international scope of experience and the social and environmental performance of MNEs
(Bansal, 2005; Bansal & Hunter, 2003; Déniz-Déniz & Garcia-Falcon, 2002; Kang, 2013;
Kennelly & Lewis, 2002; Strike, et al., 2006). Researchers provide two possible
explanations for these results.
One explanation is rooted in organizational learning and the resource-based view
of the firm. Organizational learning may be accelerated as firms expand internationally
because they are exposed to different ideas from diverse contexts (Chang, 1995; Hitt,
Tihanyi, Miller, & Connelly, 2006; Zahra, Ireland, & Hitt, 2000). “Learning is fostered
by diversity in experience” (Barkema & Vermeulen, 1998, p. 7). Because each foreign
environment in which the firm is operating may reflect different sets of social and
cultural expectations (McWilliams, et al., 2006; Mohan, 2006), social responsibility in an
international context can foster development of new knowledge and capabilities which
the firm can then deploy and leverage (Bansal, 2005; Kennelly & Lewis, 2002). Greater
international experience and diversification, therefore, provides enhanced opportunities
for organizational learning and adaptation, which in turn can lead to higher levels of firm
social performance (Strike, et al., 2006).
A second related explanation for why greater international scope has been found
to lead to higher levels of CSP is attributed to influences in the MNE’s institutional
environment and the firm’s associated drive for legitimacy with local stakeholders. Firms
with greater international experience may have a heightened general awareness of the
relative importance of social and environmental responsibility in local markets, helping to
offset their liabilities of foreignness (Bansal, 2005; Bansal & Roth, 2000). The pursuit of

27
local legitimacy can lead firms to expend the resources and take tangible actions
necessary to increase their local social responsibility credibility and visibility (Bansal &
Hunter, 2003). More internationally-experienced firms will be better equipped to assess
and respond to local expectations, but they will also have to make a greater effort to
maintain their local legitimacy across diverse environments (Déniz-Déniz & Garcia-
Falcon, 2002).
Other international CSP research has examined how national characteristics of
MNE home countries may account for different levels of firm social responsibility
investment and results (Ioannou & Serafeim, 2012). For example, an examination of
national political-economic systems found that nations characterized as welfare states,
with high instances of corporatist arrangements, and those with highly political cultures
exhibited higher standards of social responsibility (Gjolberg, 2009). Likewise, Matten
and Moon (2008) contend that differences in national business systems can explain
differences in firm CSP, encompassing much of the variation between firms
headquartered in the United States and Europe. In support of this line of thinking,
Jackson and Apostolakou (2010) compared firms headquartered in more coordinated
market economies (e.g. continental Europe) and firms from more liberal Anglo Saxon-
based market economies (e.g. United Kingdom) and empirically found that the degree of
institutionalized coordination amongst home country stakeholders has a negative
influence on the firm’s level of social responsibility.
Multiple studies have also confirmed a variety of sometimes conflicting
relationships between national culture attributes of firm headquarters countries and firm
CSP. Utilizing both Hofstede (1980) and GLOBE (House, Javidan, Hanges, & Dorfman,
2002) scales of national culture, Ringov and Zollo (2007) performed an analysis of 457

28
global firms and found that firms headquartered in countries with high power distance
and masculinity had lower CSP. Using a broad set of firms from 49 different countries,
Ho, Wang, and Vitell (2012) found linkages between all four core Hofstede (1980)
national culture attributes of the headquarters country and firm CSP. Waldman, de
Luque, Washburn, and House’s (2006) comprehensive survey of 561 firms headquartered
in 15 different countries analyzed national culture as it affects individual leaders’ values
and attitudes and found that managers’ home country power distance and individualism
measures were again related to a devaluation of social responsibility. On the other hand,
Ioannou and Serafeim (2012) found that both power distance and individualism were
related to higher levels of CSP.
In summary, prior research has confirmed a positive relationship between MNE
international scope and social performance and has also established that home country
characteristics can be relevant to firm social responsibility attitudes, strategies, and
outcomes. Taken as a whole, however, these studies do not consider how differences in
the institutional environment between countries that comprise the MNE’s international
scope might influence firm CSP. Additionally, they do not consider CSP from the
institutional context of the MNE’s entire portfolio of locations.
Institutional Distance and Corporate Social Performance
Institutional theory suggests firms rely upon institutional cues in their external
environments to identify accepted and expected behavior and to establish legitimacy in
their markets (DiMaggio & Powell, 1983; Scott, 1987). These external influences take
the form of formal rules and informal constraints (North, 1990). Formal institutions
include laws, regulations, and other codified societal constraints. They are explicit in

29
nature and can be measured and enforced by regulatory bodies. Formal institutions are
complemented by informal institutions, which provide additional structure and help
further reduce uncertainty by filling the gaps where there are no formalized institutional
guidelines for expected behavior. Typically not codified (Helmke & Levitsky, 2004),
informal institutions are transmitted socially and reflect behavioral norms, cultural
standards, and related codes of conduct.
Each country has its own unique institutional environment (Kogut, 1991), and
institutional distance is used to represent the difference between the institutional
profiles of different countries (Kostova, 1999). Home-host country differences may
make it more difficult for firms to effectively operate across countries (Xu & Shenkar,
2002). A large institutional distance may represent a challenge for firms to overcome as
they seek to establish legitimacy and adapt their domestic practices to a foreign market
(Kostova & Zaheer, 1999; Xu & Shenkar, 2002). This becomes even more important
and difficult for MNEs who must balance multiple (potentially conflicting) foreign
institutional environments and expectations as they seek host country legitimization
(Kostova, Roth, & Dacin, 2008).
Institutional distance is often conceptualized as cultural distance, a method of
representing the cultural similarity or difference between countries that has become a
staple in international business research (Shenkar, 2001). A larger cultural distance
introduces a degree of incremental complexity and uncertainty, increasing risk (Shane,
Venkataraman, & MacMillan, 1995). One of the advantages of institutional distance over
purely culturally-based distance is that institutional distance can encompass both
regulatory (formal) and cultural (informal) institutional components. Thus, according to

30
Berry et al., an institutionally-grounded approach to distance is preferable to a purely
cultural view of distance because it can incorporate an additional dimension (2010).
Large institutional differences between countries can create a liability of
foreignness that must be overcome to optimize performance in new markets (Zaheer,
1995). CSP may be affected by liability of foreignness issues because: (1) what
constitutes socially responsible behavior can vary significantly between countries
(Campbell, 2007; Mohan, 2006); and (2) CSP is socially constructed and context-
dependent (Ringov & Zollo, 2007).
Despite a call for research attention to better understanding the institutional
antecedents of corporate social responsibility (Campbell, 2007), I have been able to find
only two published articles to date which examine the influence of institutional distance
on any kind of social responsibility outcome. The first study (Campbell, Eden, & Miller,
2012) explored the contention that greater headquarters-subsidiary distance motivates
firms to invest in social responsibility as a means of overcoming their liabilities of
foreignness.
Using lending practice ratings of foreign bank subsidiaries in the U.S. (above,
below, or on par with U.S. standards) as a proxy for social responsibility, the researchers
applied a series of home-host distance measures inspired by Ghemawat’s (2001) CAGE
framework. The findings indicate that cultural, administrative (regulatory), geographic,
and economic distances all have negative impacts on affiliate bank lending, and some
negative effects of distance can be offset by positive firm social responsibility reputation.
Although this study helps shed light on the impact of distance on lending
practices, it has the limitation of being focused on the dyadic relationships between sets
of headquarters-U.S. subsidiary locations only. Thus, my study provides a much more
31
comprehensive treatment of social responsibility and distance. It does so by examining
the entire MNE portfolio of locations across multiple host countries (rather than specific
dyads and a single host country) and by considering the firm’s overall CSP (rather than a
specific practice, such as lending).
A second study examined the standardization of MNE environmental practices to
determine whether firms benefit from smaller institutional distances as a way of gaining
local social responsibility legitimacy and a resource-based competitive advantage
(Aguilera-Caracuel, Aragón-Correa, Hurtado-Torres, & Rugman, 2012). Tests of 210
MNE headquarters-subsidiary dyads spanning five home and host countries indicate that
lower environmental institutional distances are positively related to firm environmental
practice standardization.
Once again these findings were based only upon specific and artificially limited
dyads of headquarters and subsidiaries rather than the entire operating “footprint” of the
MNE. Additionally, because the research question involved only five countries and one
particular subset of the broad topic of social responsibility (environmental
standardization), the findings have limited generalizability when it comes to predicting
overall firm CSP results. While Aguilera-Carcuel et al. (2012) and Campbell et al. (2012)
do offer some initial insights into potential relationships between institutional distance
and MNE environmental responsibility, neither study examines overall firm CSP nor do
either of these studies consider the social responsibility impacts of the MNE’s entire
location footprint.
Thus, research has not yet applied the concept of institutional distance to the study
of MNE social performance. No study to date has considered how institutional distance
measured across the entire portfolio of an MNE influences its overall CSP. Yet

32
understanding the dynamics associated with social responsibility results requires
consideration of how home and host country influences may interact to affect firm social
responsibility strategies and outcomes (Jamali, 2010). Therefore my research model (as
indicated in Figure 2.1) draws a distinction between formal and informal institutional
distances that is consistent with institutional theory’s framework of formal rules and
informal constraints (North, 1990). Below I develop and test a theory of MNE portfolio
institutional distance and CSP.
Firm Corporate
Social Performance
(CSP)
Control Variables
Firm size
Firm experience
Industry
HQ region
HQ power distance
InternationalScope
Formal
Institutional
Distance
Informal
Institutional
Distance
-
+
-
FIGURE 2.1. Conceptual research model
Informal Institutional Distance and CSP
Informal institutions represent “codes of conduct, norms of behavior, and
conventions” (North, 1990, p. 36), informal constraints are closely related to culture, and
national culture is commonly used as a proxy measure for informal institutions (Dikova,
2009; Peng, et al., 2008; Redding, 2005; Singh, 2007). Informal institutional distance,

33
therefore, reflects the similarity or dissimilarity between countries’ cultural environments
(Kostova, 1999; Kostova & Zaheer, 1999).
As firms diversify internationally into new host countries, they face new informal
institutional environments based on unique country histories, cultures and social norms.
Although learning about any new host country cultural environment takes time
(Wilkinson, Peng, Brouthers, & Beamish, 2008), the larger the informal institutional
distance between a firm’s headquarters and subsidiary locations, the greater the
difficulties the firm can expect in terms of learning the new subsidiary country culture
and its associated standards and behavioral norms (Kostova, 1999; Xu & Shenkar, 2002).
One possible reason why firms accept the additional responsibilities associated
with social responsibility is that they are driven by the cultural influences of the countries
in which they are operating (Park, Russell, & Lee, 2007; Ringov & Zollo, 2007;
Waldman, et al., 2006). Local market informal social norms will reflect certain social
responsibility expectations, and exhibiting locally-appropriate socially responsible
behavior is becoming increasingly important to the local legitimization of MNEs (Matten
& Moon, 2008). Because of this, firms may face CSP consequences (either positive or
negative) based on the cultural distinctiveness of their target market compared to their
home market (Peters & Vassar, 2009). Firms operating in countries that are highly
culturally different from their home country may find themselves at a disadvantage in
terms of CSP results.
Additionally, firm CSP may be affected by related informal institutional
pressures exerted by external organizations in the foreign operating environments that
can drive the MNE’s conformance to certain social performance standards and practices
(Campbell, 2007). Local and industry social values and norms regarding social
34
responsibility expectations may be reflected in the actions of non-governmental
organizations (NGOs) and other private, independent organizations (Delmas & Toffel,
2004) such as “watch dog” and activist groups.
Industry trade associations in host countries may actively promote social and
environmental agendas with their members (Fox, 2004). Corporate managers may be
influenced by the messages and mindsets that are promoted in local professional
publications and business education (Campbell, 2007). All of these represent potential
social responsibility-relevant informal institutional forces that can vary between
countries.
The informal institutional differences between countries can be particularly
important to MNEs, because they may have to navigate a variety of informal institutional
environments via their operations in multiple countries. Thus, MNEs are comprised of a
portfolio of different country selections (Nachum & Song, 2011), with each subsidiary
location representing a corresponding institutional distance from the home country. A
portfolio-level informal institutional distance for the firm can be represented by
averaging the informal institutional distances between the home country and each of the
MNE subsidiary location countries (Chao & Kumar, 2010). In this aggregated form, I
expect the average portfolio informal institutional distance to have a negative effect on
overall firm CSP; the greater the average difference in cultures, the greater this impact is
expected to be for the following reasons.
First, greater informal institutional distance reflects a higher degree of ambiguity
for the firm. Informal institutions are not standardized or formalized; they represent tacit
social conventions and codes of conduct (North, 1990). Because informal institutions
lack codification, when informal institutional distance within the firm’s portfolio is

35
greater, the firm can expect to face more uncertainty in terms of clearly understanding
what is expected by each local market. This ambiguity can limit the firm’s ability to
recognize different unstated informal institutional expectations and priorities, further
compromising their ability to reconcile and respond appropriately in terms of social
responsibility innovations.
Second, large informal institutional distances may represent greater stakeholder
diversity, increasing complexity for the firm. Informal institutions are driven largely by
culture. Although two countries may share certain similar national culture attributes, each
country ultimately represents a unique combination of cultural attributes (Hofstede,
1980). Thus, a larger informal institutional distance between the MNE’s headquarters and
portfolio of subsidiary locations equates to a greater degree of potential diversity in terms
of how the firm’s stakeholders define a socially responsible enterprise. Stakeholder
considerations are the “cornerstone” of social responsibility (Barnett, 2007, p. 796).
However, the more diverse the set of stakeholders to which the MNE is beholden, the
more likely the scenario that one set of firm stakeholder’s expectations will conflict with
another, resulting in potential trade-off problems that can ultimately hurt the firm’s CSP
(Barnett, 2007).
Third, because every culture is unique, MNE experience with the social
responsibility expectations of one country may not directly transfer to another. Each
country has a unique history, culture, and customs, and firm experience with one
country’s informal institutions typically does not translate into understanding the
informal institutions of a second country, even if the countries are geographically
adjacent. For this reason, experience in one country does not necessarily automatically
translate to ready-experience in another country (O'Grady & Lane, 1996). For example,

36
although the cultural profile of the U.S. is relatively similar to the profiles of other native
English-speaking countries, there are distinct differences in transacting business in
Canada, Australia, or the United Kingdom vs. the U.S. Firms must gain specific
experience with each country in which they operate. Developing these capabilities
requires more effort when the cultural distance to be overcome represents a larger gap.
Finally, MNE subsidiaries may find that culturally-driven informal institutional
influences of their portfolio of subsidiary markets conflict with internal institutionalized
expectations of the parent company. Institutional duality recognizes that MNEs are faced
with the challenge of both obtaining legitimacy with their external (host country)
environments and also maintaining it internally within the firm (and its home country
environment) (Kostova & Roth, 2002). While the firm may value enterprise-level
operating consistency based on home country standards, the subsidiary may be drawn
toward actions which drive local acceptance (Rosenzweig & Singh, 1991). Local host
culture social responsibility expectations may be left unfulfilled or contradicted as the
subsidiary succumbs to the legitimate practices of the parent company (Jamali & Neville,
2011). The greater the diversity between home and host cultures, the more likely this type
of violation may take place.
An example can help illustrate why larger informal institutional distances may
negatively affect firm CSP. Consider the case of a hypothetical MNE headquartered in
China with subsidiary locations in northern European countries, such as Sweden and
Norway. The cultural profile of China, characterized by extremely high power distance,
masculinity, and collectivism, is vastly different than Sweden and Norway, both of which
are low power distance, highly feminine, and individualistic cultures (Hofstede, 1980).
37
The average informal institutional distance within this firm’s portfolio is
therefore expected to be relatively high, resulting in higher degrees of ambiguity and
uncertainty. Detecting and fully understanding the tacit requirements in terms of what
comprise legitimate levels of social responsibility in the northern European market may
be more difficult for the Chinese MNE compared to firms from countries more culturally
similar to Sweden and Norway. Furthermore, once recognized, these new requirements
will have to be reconciled with the MNE’s home-country norms, inevitably requiring
further investment in learning and response strategies. These dynamics may strain the
limited resources and focus of the MNE and increase the likelihood that the firm’s overall
CSP may suffer as a result.
In contrast, consider a U.S.-based MNE with subsidiary locations in Australia.
Australia has a very similar cultural profile to the U.S., resulting in a relatively lower
average portfolio informal institutional distance for this firm. Although the U.S. firm still
has to learn Australia’s idiosyncratic expectations related to social responsibility, because
of the cultural similarities, the differences are not expected to be as dramatic in terms of
recognition, reconciliation, and response. There is a high likelihood that many of the
firm’s current strategies to satisfy the informal institutional expectations of the U.S.
market will satisfy the culturally similar Australian subsidiary locations. Because there is
less ambiguity and less uncertainty inherent in its mix of countries, the informal
institutional distance in this firm’s portfolio is not expected to drag down the MNE’s
overall CSP.
Therefore, multiple factors may lead MNEs with higher average informal
institutional distance within their subsidiary portfolios to experience lower overall firm
CSP. The tacit nature of informal institutions makes them difficult to recognize and fully
38
understand in host environments that vary significantly from the home culture. MNEs
with wider diversity in informal stakeholder expectations may have to make tough
choices when one stakeholder’s claim conflicts with another’s, and firm CSP may suffer
as a result. Overcoming limitations in transferability of prior country experience due to
the cultural uniqueness of new country environments taxes a firm’s resources, as does
resolving potential conflicts associated with external-internal institutional duality. For
these reasons, I suggest that the difficulty in recognizing, reconciling, and responding to
different informal institutional profiles of culturally diverse operating environments can
result in lower CSP for the MNE. Thus, I hypothesize:
Hypothesis 1: An MNE with higher average informal institutional distance within
its operating portfolio will have lower CSP (than an MNE with lower average
informal institutional distance).
Formal Institutional Distance, International Scope, and CSP
Although previous research has found that greater international scope can lead to
higher CSP (Bansal, 2005; Bansal & Hunter, 2003; Déniz-Déniz & Garcia-Falcon, 2002;
Kang, 2013; Kennelly & Lewis, 2002; Strike, et al., 2006), I propose that this effect will
be moderated by the distance between formal institutions in the MNE’s headquarters and
portfolio of subsidiaries. Formal institutions reflect regulatory expectations and
conventions formally embedded within the structures of a society (North, 1990). Formal
institutions in a firm’s operating environment can influence social responsibility
investment decisions and outcomes. Firms may face increased (decreased) regulatory
pressures including stakeholder monitoring requirements related to social responsibility
compliance (Matten & Moon, 2008), such as in environmental and labor practices, as

39
they expand abroad. Such regulatory-related formal institutional pressures can have an
impact on firm CSP (Campbell, 2007).
Formal institutional distance describes differences in the formal institutional
environments between countries. In this study I focus on the national standards of social
responsibility in each country as a relevant representation of formal institutional
differences. Examining the relative social responsibility standards of different countries
highlights a wide variation in formal institutional environments faced by MNEs. Not all
countries necessarily value or require the same levels of CSP from the firms operating
within their borders (Campbell, 2007). International firms are therefore faced with the
challenge of reconciling differing formalized social responsibility standards for each host
country market in which they have a presence. Firms must determine when to adapt to
local formal CSP expectations, recognizing some host country CSP standards may
conflict with or be beyond the home country-driven capabilities of the firm (Arthaud-
Day, 2005).
I conceptualize formal institutional distance in this study as being asymmetric.
One weakness of prior distance research is that distance is too commonly conceived to be
an absolute value or squared difference between two points (Shenkar, 2001; Zaheer,
Schomaker, & Nachum, 2012). Institutional distance from Country A to Country B is
typically treated as equivalent to the distance from Country B to A. This study moves
beyond this non-directional dyadic view and instead considers the actual difference
between the CSP standards of the MNE’s portfolio subsidiary location countries as
compared to its home country in such a way as to maintain directionality in the formal
distance measurement.
40
Because some countries have high CSP standards and other countries have
relatively lower CSP standards, the resulting portfolio formal institutional distance of a
given MNE can be a positive number or a negative number. A MNE headquartered in a
country with a lower CSP standard than its subsidiary portfolio countries could face a
very large (positive) formal institutional distance. In contrast, a MNE headquartered in a
country with higher CSP standards than its average subsidiary portfolio can be expected
to have a very small or negative formal institutional distance with which to contend.
When a MNE enters markets with higher CSP formal institutional standards, the
firm may need to develop new skills related to social responsibility strategy and
implementation. These new skills might include the firm having to learn to manage
complex country-specific regulations, maintain multiple governmental relationships,
and/or learn to reconcile home- and host-country CSP standard differences (Strike, et al.,
2006). Through experience MNEs develop or acquire the needed resources and
capabilities to meet the specific formal institutional expectations of their target operating
locations (Kostova & Zaheer, 1999). Prior research has therefore confirmed a positive
relationship between international scope and firm CSP (Bansal, 2005; Bansal & Hunter,
2003; Déniz-Déniz & Garcia-Falcon, 2002; Kang, 2013; Kennelly & Lewis, 2002; Strike,
et al., 2006).
These positive CSP benefits related to international scope may be moderated by
the formal institutional distance between the MNE’s headquarters and subsidiary
portfolio countries. The reason for this is that larger (positive) formal institutional
distances represent a gap between the MNE’s subsidiary CSP expectations and
headquarters CSP knowledge, making it difficult for the firm to understand and
internalize a more diverse set of (higher) formal institutional requirements.

41
When the new knowledge the firm is presented with is highly institutionally
different from (represented by a greater formal institutional distance) the firm’s
headquarters standards, the firm may struggle in understanding, absorbing, and applying
the new knowledge. The firm will still get some of the CSP benefits associated with
increased international scope, but not necessarily the full benefit as international scope
CSP researchers assume.
Some of the benefit will be lost through the challenges of absorptive capacity.
Absorptive capacity refers to the “ability of a firm to recognize the value of new, external
information, assimilate it, and apply it” (Cohen & Levinthal, 1990, p. 128). It enables
firms to learn new things related to things they have already mastered (Lane, Koka, &
Pathak, 2006). As firms learn more in a specific domain (e.g. social responsibility) and
increase their base of knowledge and become more absorptive related to that domain,
they are subsequently better positioned to leverage and continue to build upon that
knowledge and domain (Zahra & George, 2002).
Absorptive capacity develops cumulatively, building on prior knowledge. When a
firm is presented with new external knowledge that is very different from its base of prior
experience (as in the case of a MNE facing new, higher CSP standards in its host
countries), this large difference can become a limiting factor in the firm’s ability to fully
assimilate and exploit the new knowledge (Lane, et al., 2006).
Because of the hierarchical nature of formal institutions, once a firm has
successfully obtained a given level of capability that meets social responsibility pressures
in one country, the firm is able to apply and leverage this capability in subsequent
country expansions. If the firm has met the world’s most stringent CSP standard, it can
more easily meet less stringent country standards. Formal institutional experience can

42
transfer from one country to another, if the MNE’s experiential scope is at least as
stringent as the new country’s requirements.
When a firm incorporates countries into its location portfolio that result in a small
(or negative) formal institutional distance absorptive capacity will be less of a challenge;
the requirements are much more similar to the firm’s prior experience and knowledge.
Small (or negative) portfolio formal institutional distances are expected to have a
negligible effect and will not erode the CSP benefits of increased international scope;
such new knowledge can be absorbed and transformed into new knowledge and
capability more easily.
In contrast, an MNE with a portfolio of locations that results in a large (positive)
portfolio formal institutional distance will receive less of a CSP benefit from its
international scope than the firm operating in the same number of countries but having a
small (or negative) portfolio formal institutional distance. The large (positive) portfolio
formal institutional distance reflects external CSP expectations that exceed the MNE’s
home country standards, representing a lack of knowledge complementarity with the
firm’s prior experience, affecting the firm’s ability to absorb, integrate, and apply the
external knowledge associated with the different (higher) social responsibility standards
(Pinkse, Kuss, & Hoffmann, 2010). When the MNE’s portfolio of locations has an
average formal institutional standard that exceeds the home country standards, the firm
faces additional challenges in applying its previously obtained knowledge to recognizing
and responding to unfamiliar (higher) host country expectations.
For instance, Swedish environmental regulations can be extremely stringent,
ensuring the lowest environmental impact from manufacturing (e.g. nine out of a possible
10). In contrast, in some areas of Asia there may be only limited environmental

43
guidelines (e.g. two out of 10) or even no specific requirements at all. The extreme
simplified example of a firm headquartered in China with all of its subsidiaries located in
Sweden would therefore have an average portfolio formal institutional distance that is a
high (large positive) number (9 – 2 = 7).
The opposite hypothetical firm headquartered in Sweden with all subsidiaries in
China would have a very small (actually a large negative) portfolio formal institutional
distance (2 – 9 = -7). Prior research has confirmed that both of these firms can expect to
see some CSP benefits associated with their international scope (Bansal, 2005; Bansal &
Hunter, 2003; Déniz-Déniz & Garcia-Falcon, 2002; Kang, 2013; Kennelly & Lewis,
2002; Strike, et al., 2006). The first firm faces a greater hurdle because its portfolio of
subsidiary locations have higher average social responsibility standards than the firm’s
home country standards, as reflected by the larger formal institutional distance. This firm
will still see CSP improvements from the organizational learning associated with
international expansion. Due to absorptive capacity the first firm will see fewer CSP
improvements because of the larger formal institutional distance that it must overcome;
this firm has more learning to do and more obstacles to overcome. The social
responsibility standards of the second firm’s home location already far exceed the
subsidiary portfolio’s average social responsibility expectations; therefore, the second
firm will see very little erosion in the CSP benefits it receives from international scope.
Prior research has assumed that as an MNE expands its international scope, the
more it will learn from the new country environments, subsequently leading to an
increase in firm knowledge and CSP. However, in some instances the learning (and
subsequent CSP benefit) may be less than the international scope alone predicts. This is

44
due to the hierarchical nature of formal institutions and the firm’s absorptive capacity for
learning.
When a MNE’s home country formal institutional standard exceeds the
corresponding average standard of its portfolio of locations, the firm is readily able to
leverage its absorptive capacity in learning and adapting to new requirements; they are
more similar in nature to the firm’s prior experience and knowledge. When the MNE’s
portfolio of locations has an average formal institutional standard that exceeds the home
country standards, the firm faces additional challenges in applying its previously obtained
knowledge to recognizing and responding to unfamiliar (higher) host country
expectations. Greater average formal institutional distance inherent within the firm’s
overall operating portfolio erodes some of the learning benefits associated with increased
international scope. Thus, I propose that:
Hypothesis 2: The relationship between a MNE’s international scope and its CSP
is moderated by the average formal institutional distance in the MNE’s subsidiary
portfolio such that the benefits of increased international scope are reduced when
average formal institutional distance is higher.
METHODOLOGY
Sample
Few empirical social responsibility studies to date have been truly international
(Arthaud-Day, 2005; Mohan, 2006). A review of the social responsibility literature found
only 13% of the 242 empirical CSR studies published in international business journals
1998-2007 included six or more countries; only 7% used 25 or greater countries (Egri &
Ralston, 2008). One of the key objectives underpinning my study’s research design is to
help fill this void by maximizing global coverage, which translates to a desired sample

45
spanning at least 25 different countries in multiple regions of the world. Archival data
sources are used to ensure the broadest possible country representation.
The CSRHub sustainability rating database serves as the sample frame for this
study. As the term “hub” implies, CSRHub is widely used by institutional investors
because it normalizes and aggregates global information from a wide variety of
environmental, social, and governance research firms, governmental agencies, and
NGOs to provide consolidated access to more than 125 sources of information in
support of socially responsible investment practices for over 5,000 publicly-traded firms
headquartered in 65 countries.
I introduce this new dataset that has not previously been used in social
responsibility research for two reasons. First, CSRHub is a “born global” social
responsibility ratings service. Unlike the more popular Kinder, Lydenberg, Domini
Research & Analytics (KLD, now part of MSCI Inc.) or Fortune Magazine’s “Most
Admired Companies” ratings, for example, the CSRHub sustainability rating database
has been comprised of global data from its inception. CSRHub’s global coverage
includes not only a wide diversity of firm headquarters locations, but it also incorporates
relevant data points from any/all countries in which that firm is doing business into its
aggregate measurements. In contrast, the KLD social responsibility dataset, the most
widely used rating data for social responsibility research purposes, has a distinctly North
American heritage (Wood, 2010). Although KLD has made in-roads since 2001 toward
expanded global coverage, over 85% of the almost 3,000 firms available in the 2010-11
KLD dataset represent US-headquartered firms.
The second reason for the choice of sample frame is that CSRHub provides open
public access to a comprehensive and rigorous set of international firm CSP indices. The

46
proprietary, subscription-based CSP datasets commonly used in research studies, such
as KLD, are only available to those who can afford to pay for them, representing a
substantial access barrier. Therefore, CSRHub’s open access format allows a wider
variety of other researchers to be able to replicate and expand upon my results.
The sample for this study was randomly selected from the more than 5,600 firms
available in the CSRHub database. Based on the total number of variables in the
research model (20) and a desired observation-variable ratio of 20:1 (Hair, Black, Babin,
& Anderson, 2010, p. 176), a desired sample size of approximately 400 firms was
targeted for this analysis. To ensure the final sample size threshold would be
maintained, I randomly selected 450 firms from CSRHub with the expectation that some
observations would have to be dropped from the sample per missing data. Firms which
were found to be purely domestic (operating in only one country) or for which complete
data was unavailable were eliminated from the sample.
Geographic and industry distribution of the final sample is summarized in Tables
2.1 and 2.2. The sample was comprised of 408 firms headquartered in all three major
economic regions: Europe (50%), Asia (30%), and North America (20%). The most
prevalent headquarters countries are Japan (24.8%), the United Kingdom (16.2%), and
the United States (15.7%), with a total of 27 different headquarters countries represented
in the sample. The MNEs in the final sample have operations located in a range from
two to 106 different countries, with an average of 126 subsidiaries dispersed across an
average of 20 different countries per firm. The final sample includes a total of 52,897
firm-location observations.
Firms from a broad range of both manufacturing and service industries are
included in the sample. The largest industry sector represented is Industrials (aerospace,

47
construction and engineering services, machinery, commercial and professional
services, and transportation, comprising 22% of the total sample) followed by
Financials (banks, financial services, insurance, and real estate, 17%) and Materials
(industrial components and packaging, construction materials, metals and mining, paper
and forest products, 16%).
TABLE 2.1. Sample description by headquarters country
Country Count Country Count
Australia 13 (3.2) Luxembourg 2 (0.5)
Belgium 4 (1.0) Malaysia 1 (0.2)
Canada 18 (4.4) Netherlands 9 (2.2)
China 1 (0.2) Norway 7 (1.7)
Denmark 5 (1.2) Poland 1 (0.2)
Finland 7 (1.7) Portugal 5 (1.2)
France 19 (4.7) Singapore 1 (0.2)
Germany 21 (5.1) Spain 11 (2.7)
Greece 6 (1.5) Sweden 20 (4.9)
India 1 (0.2) Switzerland 12 (2.9)
Ireland 3 (0.7) Thailand 1 (0.2)
Italy 4 (1.0) United
Kingdom
66 (16.2)
Japan 101 (24.8) United States 64 (15.7)
S. Korea 5 (1.2)
(Percentages of total sample in parentheses)

48
TABLE 2.2. Sample description by industry sector and headquarters region
Industry Sector Asia Europe N. America Total
Consumer Discretionary 24 (44) 27 (50) 3 (6) 54
Consumer Staples 3 (10) 20 (65) 8 (26) 31
Energy 6 (25) 6 (25) 12 (50) 24
Financials 16 (23) 41 (58) 14 (20) 71
Healthcare 6 (32) 6 (32) 7 (37) 19
Industrials 29 (33) 45 (51) 14 (16) 88
Information Technology 12 (46) 7 (27) 7 (27) 26
Materials 23 (34) 32 (48) 12 (18) 67
Telecommunication Services 1 (11) 7 (78) 1 (1) 9
Utilities 4 (20) 11 (58) 4 (20) 20
Total 124 202 82 408
(Percentages of industry in parentheses)
Dependent Variable
There are a variety of approaches to measuring firm-level social responsibility
including firm self-reported data, reputational indexes, and social rating agencies (Wood,
2010). Social rating agency data minimizes firm self-reporting bias by aggregating data
from public and surveyed sources. In this study CSP for each firm is measured via the
overall CSR index obtained from the CSRHub sustainability ratings database. The 2011
CSRHub overall CSR index is an interval scale numeric score (0 to 100) reflecting the
overall social responsibility rating for each firm, encompassing four social responsibility
dimensions: community relations, governance, employee relations, and environmental
performance. The sub-categories associated with each dimension are summarized in
Table 2.3. It has been noted, however, that although third-party social responsibility
ratings, such as CSRHub, remain among the most widely-used types of CSP measures
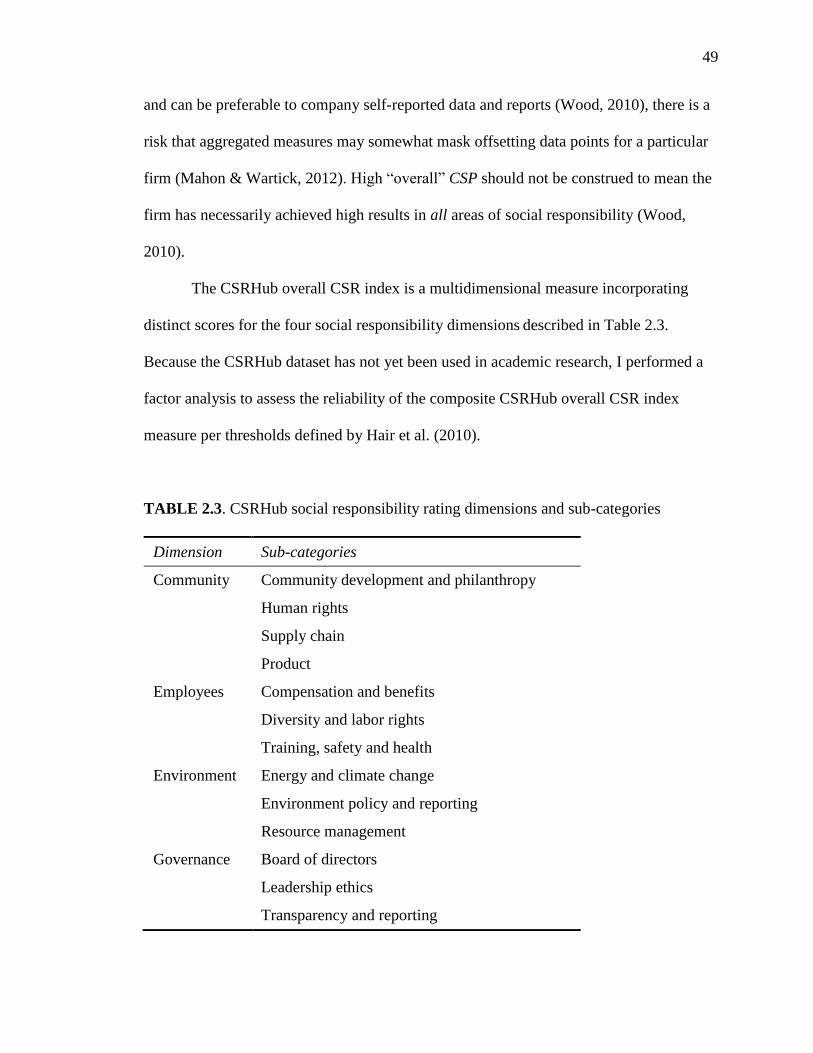
49
and can be preferable to company self-reported data and reports (Wood, 2010), there is a
risk that aggregated measures may somewhat mask offsetting data points for a particular
firm (Mahon & Wartick, 2012). High “overall” CSP should not be construed to mean the
firm has necessarily achieved high results in all areas of social responsibility (Wood,
2010).
The CSRHub overall CSR index is a multidimensional measure incorporating
distinct scores for the four social responsibility dimensions described in Table 2.3.
Because the CSRHub dataset has not yet been used in academic research, I performed a
factor analysis to assess the reliability of the composite CSRHub overall CSR index
measure per thresholds defined by Hair et al. (2010).
TABLE 2.3. CSRHub social responsibility rating dimensions and sub-categories
Dimension Sub-categories
Community Community development and philanthropy
Human rights
Supply chain
Product
Employees Compensation and benefits
Diversity and labor rights
Training, safety and health
Environment Energy and climate change
Environment policy and reporting
Resource management
Governance Board of directors
Leadership ethics
Transparency and reporting
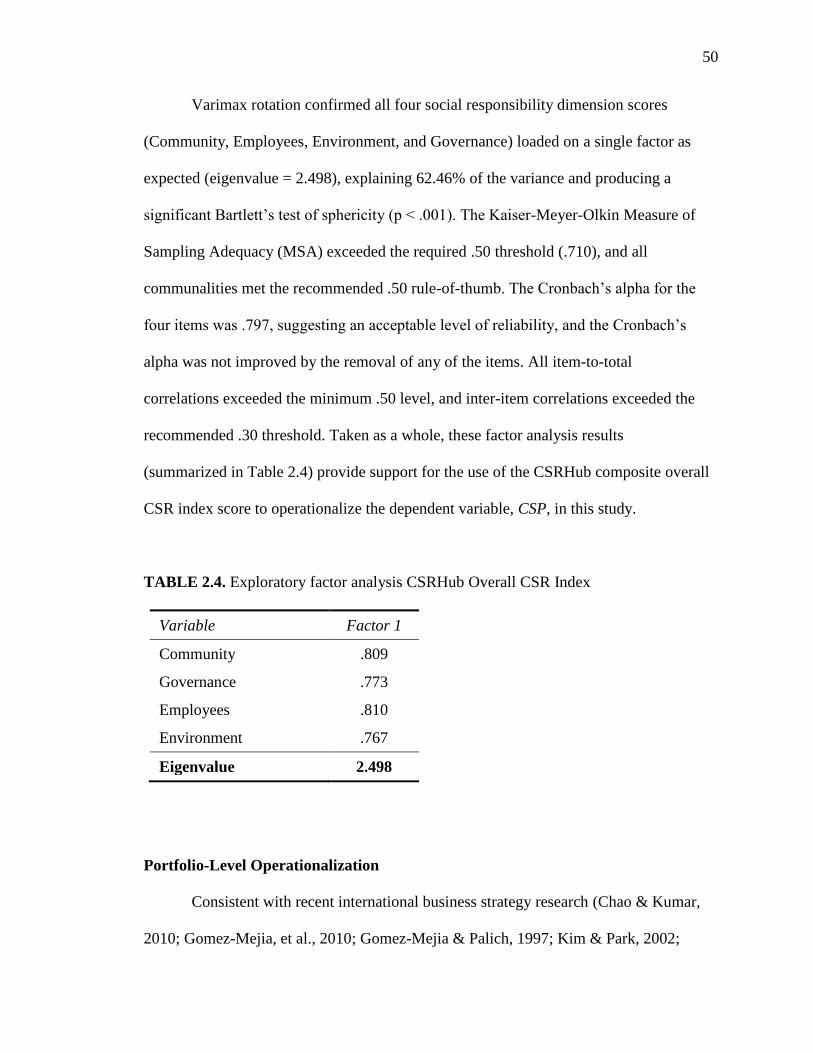
50
Varimax rotation confirmed all four social responsibility dimension scores
(Community, Employees, Environment, and Governance) loaded on a single factor as
expected (eigenvalue = 2.498), explaining 62.46% of the variance and producing a
significant Bartlett’s test of sphericity (p < .001). The Kaiser-Meyer-Olkin Measure of
Sampling Adequacy (MSA) exceeded the required .50 threshold (.710), and all
communalities met the recommended .50 rule-of-thumb. The Cronbach’s alpha for the
four items was .797, suggesting an acceptable level of reliability, and the Cronbach’s
alpha was not improved by the removal of any of the items. All item-to-total
correlations exceeded the minimum .50 level, and inter-item correlations exceeded the
recommended .30 threshold. Taken as a whole, these factor analysis results
(summarized in Table 2.4) provide support for the use of the CSRHub composite overall
CSR index score to operationalize the dependent variable, CSP, in this study.
TABLE 2.4. Exploratory factor analysis CSRHub Overall CSR Index
Variable Factor 1
Community .809
Governance .773
Employees .810
Environment .767
Eigenvalue 2.498
Portfolio-Level Operationalization
Consistent with recent international business strategy research (Chao & Kumar,
2010; Gomez-Mejia, et al., 2010; Gomez-Mejia & Palich, 1997; Kim & Park, 2002;

51
Nachum & Song, 2011; Zaheer & Hernandez, 2011), I conceptualize the MNE as a
portfolio and average the institutional distance measures at a portfolio level. It is
relatively rare to find studies which take the MNE’s entire portfolio of locations into
consideration. It is much more common to see research models which focus on either 1)
the headquarters locations; or 2) specific dyadic relationships between the headquarters
location and one other specific location (such as the home-host dyad in associated with a
foreign entry mode decision). This over-reliance on the home country and/or home-host
dyad can be limiting, because as the resource-based view of the firm suggests, MNEs
represent a bundle of resources, capabilities, locations, and knowledge (Barney, 1991;
Wernerfelt, 1984). Failure to consider the MNE’s full portfolio may result in an
incomplete or at worst an incorrect perspective regarding the firm.
To operationalize institutional distances in a way that accounts for the MNE’s
total operating environment, I adopt a portfolio-level measurement technique established
in prior international business literature. Portfolio-level measures are constructed by
aggregating and averaging country-level characteristics or distances across all locations
that comprise a MNE’s subsidiary portfolio. Each resulting portfolio measure represents a
weighted average of the country attribute(s) it is measuring, weighted such that multiple
locations operating in the same country are each included in the portfolio-level average
calculations. This portfolio measurement technique has been used to evaluate a variety of
MNE phenomena, including: the target location-to-portfolio fit and country entry/exit
decisions (Nachum & Song, 2011); the relationship between the geographic distance
within the MNE’s location portfolio and firm profitability (Zaheer & Hernandez, 2011);
and the moderating influence of institutional distance within the location portfolio on the
international diversity-performance relationship. This portfolio measurement approach

52
allows for the formation of firm-specific measurements based on the MNE’s unique
portfolio of locations (Nachum & Song, 2011). This provides advantages over purely
dyadic distance calculations. “The adoption of a dyadic perspective would not reveal the
impact of the benefits and costs of distance aggregated at the level of the firm as a whole
because of trade-offs and spillovers that may be involved both within and across
portfolios” (Zaheer & Hernandez, 2011, p. 123).
Independent Variables
Portfolio informal institutional distance (PIID): As in Xu and Shenkar (2002),
Informal institutional distance is measured via cultural distance. I differ from their study
by averaging cultural distance at a portfolio level. To accomplish this, the cultural
distance between each headquarters-subsidiary dyad is first calculated following the
widely adopted formula set forth by Kogut and Singh (1988), using four dimensions
taken from Hofstede’s (1980) national culture scale: power distance, individualism-
collectivism, uncertainty avoidance, and masculinity-femininity. The four attribute-level
dyadic cultural distances are then averaged to arrive at an average overall cultural
distance for each headquarters-subsidiary pair, again consistent with Kogut and Singh
(1988).
Second, following prior international business studies (Chao & Kumar, 2010;
Gomez-Mejia, et al., 2010; Gomez-Mejia & Palich, 1997; Kim & Park, 2002; Nachum &
Song, 2011; Zaheer & Hernandez, 2011), the distances for all headquarters-subsidiary
dyads are then averaged to create an overall portfolio-level measure of informal
institutional distance for the MNE. The firm’s resulting average portfolio informal
institutional distance represents a weighted average of the cultural distance between all

53
subsidiary countries and the headquarters locations such that multiple subsidiaries
operating in the same country are each included in the average calculation for the firm.
The overall measurement of each firm’s portfolio informal institutional distance (PIID) is
reflected in the following formula:
PIID Firm =
[ ∑ [
(𝑃𝐷𝐼𝐻𝑄−𝑃𝐷𝐼𝑖)2
𝑉𝑎𝑟𝑃𝐷𝐼+
(𝐼𝑁𝐷𝐻𝑄−𝐼𝑁𝐷𝑖)2
𝑉𝑎𝑟𝐼𝑁𝐷 +
(𝑈𝐴𝐼𝐻𝑄−𝑈𝐴𝐼𝑖)2
𝑉𝑎𝑟𝑈𝐴𝐼+
(𝑀𝐴𝑆𝐻𝑄−𝑀𝐴𝑆𝑖)2
𝑉𝑎𝑟𝑀𝐴𝑆]
𝑁𝑆𝑢𝑏𝑖=1
4 ∙ 𝑁𝑆𝑢𝑏
]
(2.1)
where:
PIIDFirm = The firm’s average Portfolio Informal Institutional Distance
i = Suffix indicating the different subsidiaries
NSub = Number of subsidiaries in the firm’s portfolio
PDIHQ = Hofstede Power Distance value for the firm’s headquarters (HQ) country
PDIi = Hofstede Power Distance value for the firm’s ith subsidiary’s country
VarPDI = Variance across all available countries for Hofstede Power Distance values
INDHQ = Hofstede Individualism-Collectivism value for the firm’s HQ’s country
INDi = Hofstede Individualism-Collectivism value for the firm’s ith subsidiary’s
country
VarIND = Variance across available countries for Hofstede Individualism-Collectivism
UAIHQ = Hofstede Uncertainty Avoidance value for the firm’s HQ’s country
UAIi = Hofstede Uncertainty Avoidance value for the firm’s ith subsidiary’s country
VarUAI = Variance across all available countries for Hofstede Uncertainty Avoidance
MASHQ = Hofstede Masculinity-Femininity value for the firm’s HQ’s country
MASi = Hofstede Masculinity-Femininity value for the firm’s ith subsidiary’s country
VarMAS = Variance across all available countries for Hofstede Masculinity-Femininity
values

54
Portfolio formal institutional distance (PFID): The Portfolio formal
institutional distance reflects the differences in regulatory institutional stringency
between the firm’s subsidiary and headquarters locations. One of the most important
and tangible areas of formal institutionalized regulation related to corporate social
responsibility is the environmental dimension (Kolk & Pinkse, 2008). Environmental
performance is considered one of the foundational pillars in the “triple bottom line” of
corporate social responsibility (Bansal, 2004) and was one of the earliest areas of firm
social responsibility explored by researchers, aided by the availability of tangible
measurements (Rugman & Verbeke, 1998; Russo & Fouts, 1997) . Because of the
maturity, measurability, and relevance of environmental performance to MNE CSP, in
this study I follow Aguilera-Caracuel et al. (2012) and measure the formal institutional
distance of each firm based on country-level environmental performance standards.
Consistent with prior environmental institutional distance measurements
(Aguilera-Caracuel, et al., 2012), country-level environmental social responsibility
standards data is obtained from the World Economic Forum’s 2010 Environmental
Performance Index (EPI), published by Yale Center for Environmental Law and Policy
and the Center for International Earth Science Information Network (Emerson et al.,
2010). The EPI has been subjected to thorough validity testing and has been confirmed
to provide a reliable country-level comparison of environmental performance reflecting
the respective stringency and effectiveness of regulatory policies and institutions in 163
countries (Saisana & Saltelli, 2010). By providing insights into the relative stringency of
environmental regulatory institutions in a broad range of countries, the EPI is used as
the basis to measure the formal institutional distance of the MNE’s portfolio of locations
in this study.

55
To create country-level scores that measure the stringency of environmental
policy and physical conditions that MNEs may be subjected to, the EPI aggregates
detailed environmental data points from a wide range of different governmental,
international organization, NGO, and academic sources. The 10 environmental policy
categories are tracked via 25 indicators, summarized in Table 2.5.
TABLE 2.5. EPI environmental performance policy categories and indicators
Policy categories Indicators
Climate change Greenhouse gas emissions
Electricity carbon intensity
Industrial carbon intensity
Air pollution (effects on humans) Urban particulates
Indoor air pollution
Air pollution (effects on
ecosystems)
Sulfur dioxide emissions
Nitrogen oxide emissions
Ozone levels
Water quality index
Agriculture Pesticide regulation
Agricultural water quality
Agricultural subsidies
Environmental burden of disease Environmental burden of disease
Water (effects on humans) Access to drinking water
Access to sanitation
Water (effects on ecosystems) Water quality index
Water stress
Water scarcity index
Biodiversity & habitat Biome protection
Critical habitat protection
Marine protected areas
Forestry Growing stock
Forest cover
Fisheries Marine trophic index
Trawling intensity
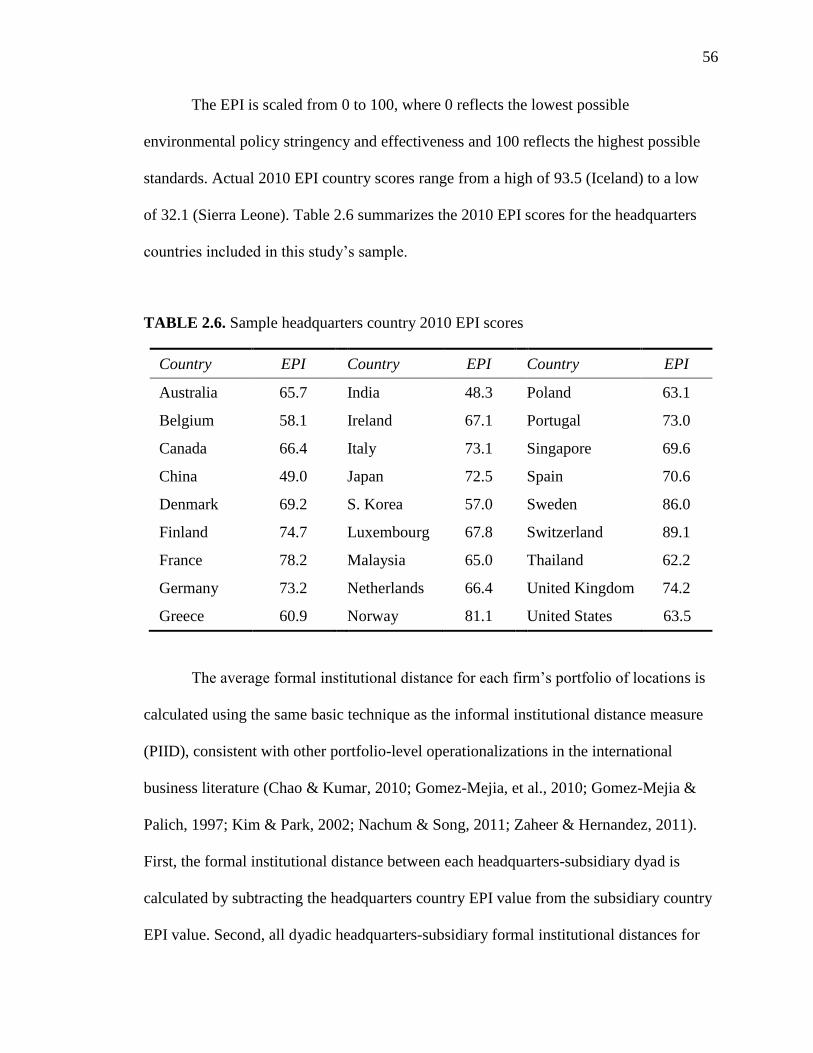
56
The EPI is scaled from 0 to 100, where 0 reflects the lowest possible
environmental policy stringency and effectiveness and 100 reflects the highest possible
standards. Actual 2010 EPI country scores range from a high of 93.5 (Iceland) to a low
of 32.1 (Sierra Leone). Table 2.6 summarizes the 2010 EPI scores for the headquarters
countries included in this study’s sample.
TABLE 2.6. Sample headquarters country 2010 EPI scores
Country EPI Country EPI Country EPI
Australia 65.7 India 48.3 Poland 63.1
Belgium 58.1 Ireland 67.1 Portugal 73.0
Canada 66.4 Italy 73.1 Singapore 69.6
China 49.0 Japan 72.5 Spain 70.6
Denmark 69.2 S. Korea 57.0 Sweden 86.0
Finland 74.7 Luxembourg 67.8 Switzerland 89.1
France 78.2 Malaysia 65.0 Thailand 62.2
Germany 73.2 Netherlands 66.4 United Kingdom 74.2
Greece 60.9 Norway 81.1 United States 63.5
The average formal institutional distance for each firm’s portfolio of locations is
calculated using the same basic technique as the informal institutional distance measure
(PIID), consistent with other portfolio-level operationalizations in the international
business literature (Chao & Kumar, 2010; Gomez-Mejia, et al., 2010; Gomez-Mejia &
Palich, 1997; Kim & Park, 2002; Nachum & Song, 2011; Zaheer & Hernandez, 2011).
First, the formal institutional distance between each headquarters-subsidiary dyad is
calculated by subtracting the headquarters country EPI value from the subsidiary country
EPI value. Second, all dyadic headquarters-subsidiary formal institutional distances for

57
the firm are then averaged to create the MNE’s average portfolio formal institutional
distance (PFID), reflected by the following formula:
PFID Firm =
[∑ [𝐸𝑃𝐼𝑆𝑢𝑏− 𝐸𝑃𝐼𝐻𝑄]
𝑁𝑆𝑢𝑏𝑖=1
𝑁𝑆𝑢𝑏]
(2.2)
where:
PFIDFirm = The firm’s average Portfolio Formal Institutional Distance
i = Suffix indicating the different subsidiaries
NSub = Number of subsidiaries in the firm’s portfolio
EPISub = EPI value for the firm’s ith subsidiary’s country
EPIHQ = EPI value for the firm’s headquarters (HQ) country
Several aspects of this operationalization of portfolio formal institutional
distance are notable. Shenkar (2001) and Zaheer et al. (2012) have pointed out faulty
assumptions commonly made by international business researchers in the
conceptualization and operationalization of distance (including, but not limited to,
institutional distance). Two such weaknesses include assuming symmetry between
distance components and neglecting to consider directionality within the distance
measure. Most distance measures take the absolute value or square of differences such
that the distance from Country A to Country B is typically treated as equivalent to the
distance from Country B to A (Zaheer, et al., 2012).
Based on the theoretical model presented, this study makes no such assumptions
regarding the average portfolio formal institutional distance. Due to the hierarchical
nature of formal institutions, my measurement of formal institutional distance considers
both sign and direction. A large, positive portfolio formal institutional distance reflects a

58
firm whose subsidiaries are (on average) operating in locations which have much higher
CSP expectations than the firm’s headquarter location: e.g. the Chinese firm
establishing subsidiaries in northern Europe. Conversely, a smaller or negative portfolio
formal institutional distance reflects a firm whose headquarters location has higher CSP
expectations than the countries in which its subsidiary locations are operating: e.g. a
U.S.-based firm expanding into Asia. A firm headquartered in a country with low CSP
expectations based on a low country EPI is more likely to have a relative high formal
institutional distance, depending on the specific locations reflected in its portfolio of
locations.
International scope: In this study International scope reflects the dispersion of
firm operations across multiple national markets. Consistent with prior international
social responsibility research (Bansal, 2005; Bansal & Hunter, 2003; Brammer, Pavelin,
& Porter, 2006; Déniz-Déniz & Garcia-Falcon, 2002; Strike, et al., 2006), I measure
each MNE’s international scope as the number of unique countries in which the firm
operates, reflecting both headquarters as well as subsidiary locations.
International scope is recognized as one of several different dimensions that
comprise a firm’s overall international experience (Chetty, Eriksson, & Lindbergh,
2006) and is closely related to other elements of international experience such as
duration of time since the firm began international activity (Brouthers, O'Donnell, &
Hadjimarcou, 2005) and international intensity, typically measured as a ratio of foreign
to domestic sales (Hultman, Katsikeas, & Robson, 2011). Some CSR studies have also
measured the firm’s international presence by the percentage or number of foreign
subsidiaries (Kennelly & Lewis, 2002; Strike, et al., 2006).

59
However, this study is specifically interested in the firm’s exposure to foreign
markets as a result of the geographic scope of its international experience. Other
international experience measures (such as FSTS, international duration, or foreign
subsidiaries) are more focused on the depth or intensity of MNE international
experience (Chetty, et al., 2006; Strike, et al., 2006), as opposed to the geographic
dispersion. For this reason, this study focuses on international scope as measured by
number of countries.
It should be noted that international scope is also sometimes measured at a
regional level, reflecting the number of unique geographic regions (as opposed to
countries) in which the firm operates (Chetty, et al., 2006; Kennelly & Lewis, 2002).
The country-level variable was selected for this study because it provides more
information and is more commonly used in both the social responsibility and general
international business literature. To calculate each firm’s international scope, all
subsidiary locations and the headquarters location associated with each MNE were
obtained from Standard and Poor’s Capital IQ (S&P Capital IQ) database. The
international scope represents the log of the count of the number of distinct countries in
which the MNE has at least one location.
Control Variables
A number of control variables found to predict CSP in previous social
responsibility research were used. Unless otherwise noted, all control variables were
obtained from the S&P Capital IQ database.
Following prior studies which identified a relationship between the size of a firm
and CSP (Johnson & Greening, 1999; Strike, et al., 2006; Udayasankar, 2008), Firm size

60
is measured as the log of the number of employees. Following Barnea and Rubin (2010),
Firm experience is measured as the log of age of the firm since its founding, in years.
Industry dummies were coded to distinguish industry sectors provided by S&P Capital
IQ: consumer discretionary, consumer staples, energy, financials, healthcare, industrials,
information technology, materials, telecommunication services and utilities.
Social responsibility patterns can vary significantly between different geographic
regions (McWilliams, et al., 2006). Additionally, the sample selection in this study
resulted in a relatively large presence in three specific countries, with Japan, United
Kingdom, and United States accounting for over 60% of the sample. Therefore I
controlled for firm headquarters Region in this study. Dummy indicators were created for
the three regions in the sample: Asian, European, and the North American. Because
Europe was the most prevalent region in the sample, the dummy variable for Europe was
omitted in the regression analyses.
The Home country power distance reflects the degree to which the headquarters
country national culture is generally accepting of authority and power distribution
inequality within the society. Prior studies examining the relationship of national culture
attributes to CSP have consistently found power distance to be a significant predictor of
corporate social responsibility outcomes at the country, firm, and managerial levels of
analysis (Ioannou & Serafeim, 2012; Park, et al., 2007; Ringov & Zollo, 2007; Waldman,
et al., 2006). The Hofstede national culture power distance value (Hofstede, 1980) for
each firm’s headquarters country is used to measure the home country power distance
control variable for each firm. Table 2.7 lists all variable definitions and data sources.
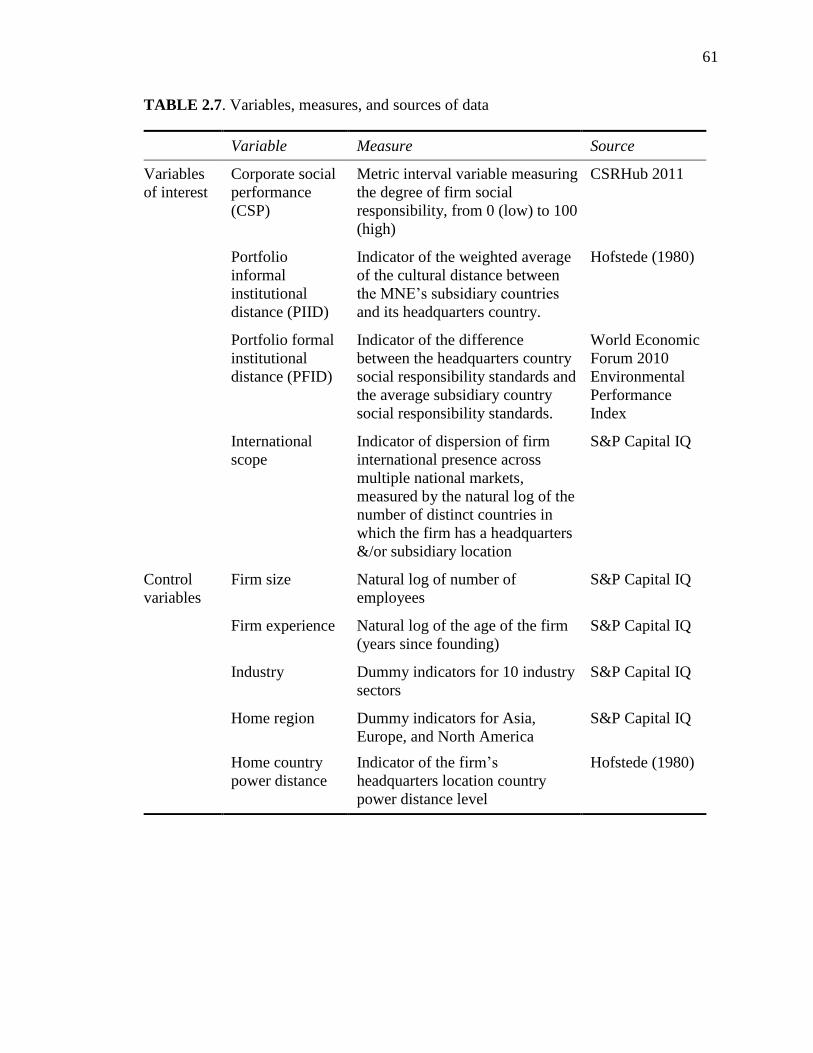
61
TABLE 2.7. Variables, measures, and sources of data
Variable Measure Source
Variables
of interest
Corporate social
performance
(CSP)
Metric interval variable measuring
the degree of firm social
responsibility, from 0 (low) to 100
(high)
CSRHub 2011
Portfolio
informal
institutional
distance (PIID)
Indicator of the weighted average
of the cultural distance between
the MNE’s subsidiary countries
and its headquarters country.
Hofstede (1980)
Portfolio formal
institutional
distance (PFID)
Indicator of the difference
between the headquarters country
social responsibility standards and
the average subsidiary country
social responsibility standards.
World Economic
Forum 2010
Environmental
Performance
Index
International
scope
Indicator of dispersion of firm
international presence across
multiple national markets,
measured by the natural log of the
number of distinct countries in
which the firm has a headquarters
&/or subsidiary location
S&P Capital IQ
Control
variables
Firm size
Natural log of number of
employees
S&P Capital IQ
Firm experience Natural log of the age of the firm
(years since founding)
S&P Capital IQ
Industry Dummy indicators for 10 industry
sectors
S&P Capital IQ
Home region Dummy indicators for Asia,
Europe, and North America
S&P Capital IQ
Home country
power distance
Indicator of the firm’s
headquarters location country
power distance level
Hofstede (1980)

62
RESULTS
Because (1) the dependent variable is measured via a single, metric interval scale
variable and (2) the research model includes moderation, hypotheses were tested using
hierarchical moderated regression (Cohen, Cohen, West, & Aiken, 2003). One-tailed tests
were used for all regression variables because the hypotheses are directional. Sample
skewness and kurtosis levels were confirmed to be within recommended thresholds (Hair,
et al., 2010). Table 2.8 summarizes the descriptive statistics of the study’s sample.
TABLE 2.8. Descriptive statistics
Variables Mean SD Min Max Skewness Kurtosis
Firm CSP 55.48 6.556 33 71 -.423 .273
International Scope 20.46 17.107 2 106 -.208 † -.602 †
Portfolio Formal
Institutional Distance -3.47 5.578 -27.37 11.72 -.969 2.068
Portfolio Informal
Institutional Distance 5.87 2.437 .0246 12.42 -.120 -.161
Firm Size 48,360 71,045 1,328 472,000 .107 † -.494 †
Firm Experience 93.4 61.641 3 539 -1.178 † 1.457 †
HQ Power Distance 44.42 11.906 18 104 .762 .716
n = 408.
† Statistics represent variable post logarithmic transformation.
Prior to running the regression equations, bivariate correlations were examined
(Table 2.9). None of the significant correlations between the independent variables
exceeded the recommended 0.70 co-linearity threshold (Hair, et al., 2010).
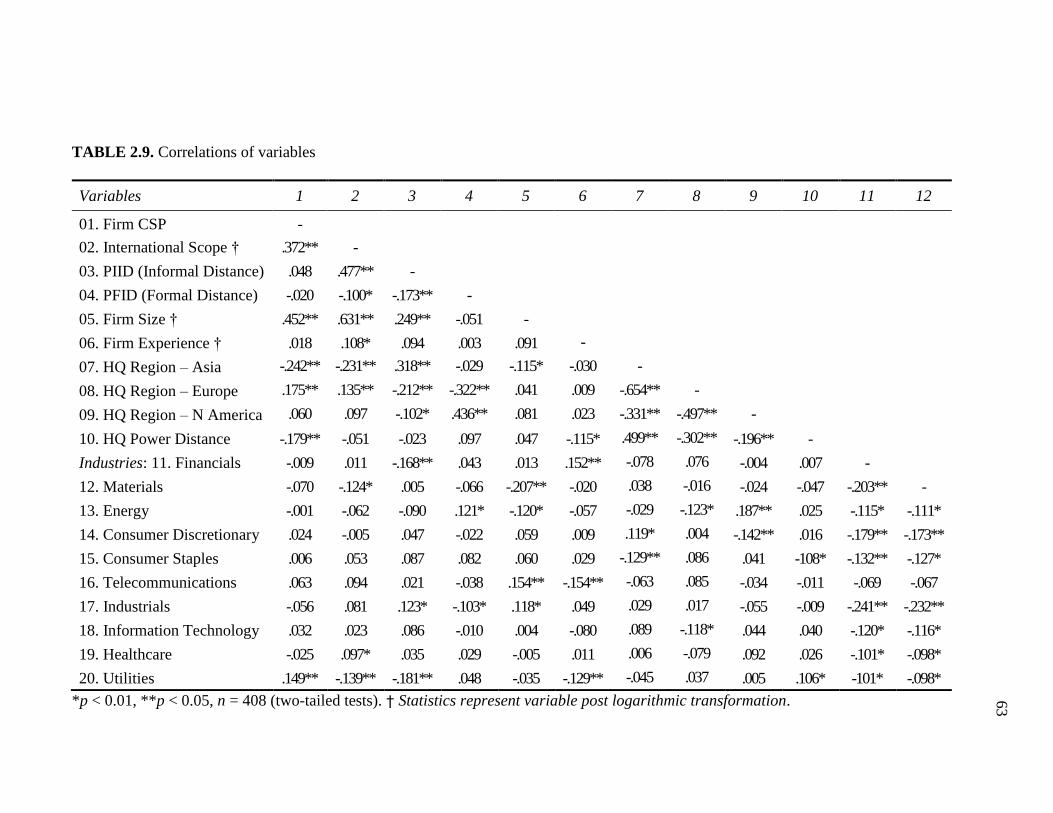
63
TABLE 2.9. Correlations of variables
Variables 1 2 3 4 5 6 7 8 9 10 11 12
01. Firm CSP -
02. International Scope † .372** -
03. PIID (Informal Distance) .048 .477** -
04. PFID (Formal Distance) -.020 -.100* -.173** -
05. Firm Size † .452** .631** .249** -.051 -
06. Firm Experience † .018 .108* .094 .003 .091 -
07. HQ Region – Asia -.242** -.231** .318** -.029 -.115* -.030 -
08. HQ Region – Europe .175** .135** -.212** -.322** .041 .009 -.654** -
09. HQ Region – N America .060 .097 -.102* .436** .081 .023 -.331** -.497** -
10. HQ Power Distance -.179** -.051 -.023 .097 .047 -.115* .499** -.302** -.196** -
Industries: 11. Financials -.009 .011 -.168** .043 .013 .152** -.078 .076 -.004 .007 -
12. Materials -.070 -.124* .005 -.066 -.207** -.020 .038 -.016 -.024 -.047 -.203** -
13. Energy -.001 -.062 -.090 .121* -.120* -.057 -.029 -.123* .187** .025 -.115* -.111*
14. Consumer Discretionary .024 -.005 .047 -.022 .059 .009 .119* .004 -.142** .016 -.179** -.173**
15. Consumer Staples .006 .053 .087 .082 .060 .029 -.129** .086 .041 -108* -.132** -.127*
16. Telecommunications .063 .094 .021 -.038 .154** -.154** -.063 .085 -.034 -.011 -.069 -.067
17. Industrials -.056 .081 .123* -.103* .118* .049 .029 .017 -.055 -.009 -.241** -.232**
18. Information Technology .032 .023 .086 -.010 .004 -.080 .089 -.118* .044 .040 -.120* -.116*
19. Healthcare -.025 .097* .035 .029 -.005 .011 .006 -.079 .092 .026 -.101* -.098*
20. Utilities .149** -.139** -.181** .048 -.035 -.129** -.045 .037 .005 .106* -101* -.098*
*p < 0.01, **p < 0.05, n = 408 (two-tailed tests). † Statistics represent variable post logarithmic transformation.

64
TABLE 2.9. Correlations of variables (continued)
Variables 13 14 15 16 17 18 19 20
13. Energy -
14. Cons. Discretionary -.098* -
15. Consumer Staples -.072 -.112* -
16. Telecommunications -.038 -.059 -.043 -
17. Industrials -.131** -.205** -.150** -.079 -
18. Info Technology -.065 -.102* -.075 -.039 -.137** -
19. Healthcare -.055 -.086 -.063 -.033 -.116* -.058 -
20. Utilities -.055 -.086 -.063 -.033 -.116* -.058 -.049 -
*p < 0.01, **p < 0.05, n = 408 (two-tailed tests).
In order to test Hypothesis 2 (examining the moderating effects of the MNE’s
Portfolio formal institutional distance on the relationship between International scope
and CSP) an interaction variable was created. The interaction variable was calculated by
multiplying International scope (number of discrete countries in which the firm is
operating) and Portfolio formal institutional distance (the difference between the
headquarters country social responsibility standard and the firm subsidiary portfolio’s
average country social responsibility standard). To minimize multicollinearity, variables
used to create the interaction term were centered prior to the calculation and subsequent
regressions (Cohen, et al., 2003).
Table 2.10 shows the hierarchical regression results of the three models used to
test the hypothesized relationships between the portfolio institutional distance variables
and firm CSP levels. Variance inflation factor scores (VIFs) reported in the results of all
three regression models were inspected and compared to the conservative low-end
threshold of 3.0 (Hair, et al., 2010, p. 204). With the exception of the Industry dummy

65
TABLE 2.10. Hierarchical regression results
Variables Model 1 Model 2 Model 3
Intercept 33.75 (3.51) 41.10 (4.22) 40.94 (4.20)
Firm Size 6.03*** (.56) 4.89*** (.67) 4.86*** (.69)
Firm Experience -.27 (.79) -.34 (.78) -.31 (.78)
HQ Region – Asia -1.73** (.75) -.57 (.91) -.51 (.90)
HQ Region – N. America -1.20* (.75) -1.54* (.85) -1.34* (.85)
HQ Power Distance -.10*** (.03) -.12*** (.03) -.12*** (.03)
Industries:
Consumer Discretionary 1.21 (2.05) 1.13 (2.03) 1.15 (2.03)
Consumer Staples -.09 (2.15) -.03 (2.14) -.03 (2.13)
Energy 3.06* (2.26) 2.83 (2.25) 2.63 (2.24)
Financials .87 (2.04) .61 (2.02) .39 (2.02)
Healthcare .87 (2.31) .31 (2.30) .19 (2.29)
Industrials -.27 (2.00) -.26 (1.98) -.27 (1.97)
Information Technology 2.43 (2.20) 2.32 (2.18) 2.60 (2.18)
Materials 1.54 (2.05) 1.53 (2.04) 1.73 (2.03)
Utilities 6.47*** (2.30) 6.78*** (2.28) 6.73*** (2.28)
International Scope - 3.60*** (1.17) 3.82*** (1.17)
PIID - -.26** (.16) -.25* (.16)
PFID - .06 (.06) .09* (.06)
PFID x International Scope - - -.30** (.15)
Overall model R-square .308 .326 .333
Adjusted R-square .283 .296 .302
Change in R-square
-
.018 .007
F-value for change in R2 - 3.401 4.350
F-value sig for in R2 - .018 .038
Overall F-value 12.488*** 11.073*** 10.790***
Dependent variable = CSP in all models. n = 408 in all models.
*p < 0.1 **p < 0.05 ***p < 0.01 (one-tailed tests).
Unstandardized coefficients with corresponding standard errors in parentheses.
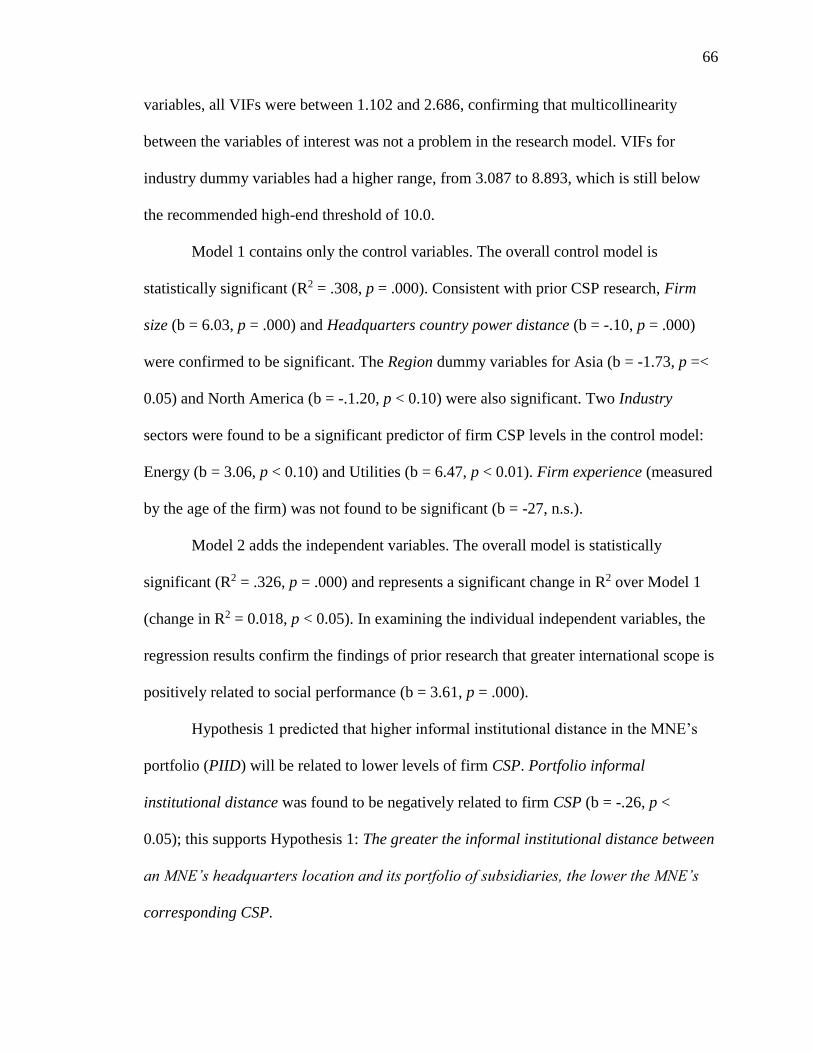
66
variables, all VIFs were between 1.102 and 2.686, confirming that multicollinearity
between the variables of interest was not a problem in the research model. VIFs for
industry dummy variables had a higher range, from 3.087 to 8.893, which is still below
the recommended high-end threshold of 10.0.
Model 1 contains only the control variables. The overall control model is
statistically significant (R2 = .308, p = .000). Consistent with prior CSP research, Firm
size (b = 6.03, p = .000) and Headquarters country power distance (b = -.10, p = .000)
were confirmed to be significant. The Region dummy variables for Asia (b = -1.73, p =<
0.05) and North America (b = -.1.20, p < 0.10) were also significant. Two Industry
sectors were found to be a significant predictor of firm CSP levels in the control model:
Energy (b = 3.06, p < 0.10) and Utilities (b = 6.47, p < 0.01). Firm experience (measured
by the age of the firm) was not found to be significant (b = -27, n.s.).
Model 2 adds the independent variables. The overall model is statistically
significant (R2 = .326, p = .000) and represents a significant change in R2 over Model 1
(change in R2 = 0.018, p < 0.05). In examining the individual independent variables, the
regression results confirm the findings of prior research that greater international scope is
positively related to social performance (b = 3.61, p = .000).
Hypothesis 1 predicted that higher informal institutional distance in the MNE’s
portfolio (PIID) will be related to lower levels of firm CSP. Portfolio informal
institutional distance was found to be negatively related to firm CSP (b = -.26, p <
0.05); this supports Hypothesis 1: The greater the informal institutional distance between
an MNE’s headquarters location and its portfolio of subsidiaries, the lower the MNE’s
corresponding CSP.

67
Model 3 tests the interaction effect of Portfolio formal institutional distance and
International scope on CSP posited by Hypothesis 2. Model 3 is statistically significant
(R2 = .333, p = .000) and represents a significant change in R2 over the Model 2 main
effects (change in R2 = 0.007, p < 0.05). Model 3 regression coefficients show that the
interaction of MNE’s International scope and Portfolio formal institutional distance is
negative and significant (b = -.30, p < 0.05). This provides initial support for the presence
of moderation and Hypothesis 2: The relationship between international scope and MNE
CSP is moderated by formal institutional distance such that the benefits of increased
international scope are reduced when formal institutional distances within the MNE
portfolio are higher.
To interpret the interaction between Portfolio formal institutional distance and
International scope, I drew an interaction plot using values of one standard deviation
above and below the mean of each interaction variable per Aiken & West (1991). I
defined firms operating in a number of countries at least one standard deviation above the
mean number of countries as having high international scope; firms in a number of
countries less than one standard deviation below the mean number of countries were
defined as having low international scope. Likewise, I used one standard deviation above
and below the mean portfolio formal institutional distance measure to identify firms with
high and low portfolio formal institutional distance respectively.
Figure 2.2 graphically illustrates the nature of the interaction. With respect to
CSP, all firms tend to benefit from increased international scope. Under both low formal
institutional distance and high formal institutional distance conditions, greater
international scope results in higher firm CSP. However, as evidenced by the steeper

68
slope of the low formal institutional distance line, firms with higher portfolio formal
institutional distance do not receive as great of a CSP benefit from increased international
expansion as firms with lower formal institutional distance. Firms with high portfolio
formal institutional distance have higher subsidiary country CSP standards than are
expected by their home country; this distance negatively affects the expected CSP
benefits of increased international scope.
FIGURE 2.2: Interaction of portfolio formal institutional distance (PFID) and
international scope on firm CSP
Following the recommended methods for testing the interaction between
continuous variables (Aiken & West, 1991; Cohen, et al., 2003), I also conducted a
simple slope analysis to test whether the slope of the interaction lines were significantly
different from zero under a variety of levels of the moderating variable. The results are
summarized in Table 2.11. For firms with low PFID (one standard deviation below the
36
37
38
39
40
41
42
43
Low International Scope High International Scope
Corp
ora
te S
oci
al
Per
form
an
ce
Low PFID
High PFID

69
mean), the results of the simple slope test were significantly different from zero (simple
slope = 5.513, t = 3.719, p = .000). The simple slope test for firms with medium levels of
PFID (equal to the mean) was also significantly different from zero (simple slope =
3.823, t = 3.258, p < 0.01). However, at high levels of PFID (one standard deviation
above the mean), the simple slope test was not significant (simple slope = 2.133, t =
1.563, n.s.).
These results indicate that while the overall interaction of International scope and
PFID on CSP is significant, we have highest confidence that the dependent variable,
CSP, increases with increased international scope at lower levels of PFID. As we move
to firms with higher levels of PFID, however, CSP may not be affected by a firm’s
international scope.
TABLE 2.11. Simple slope analysis results †
Conditions PFID
value
Simple
slope t P
Low PFID -5.57765 5.513 3.719 .000
Medium PFID 0 3.823 3.258 .001
High PFID 5.57765 2.133 1.563 .119
† Interaction of Portfolio formal institutional distance (PFID) and International scope on
firm CSP.
DISCUSSION
I began this study by considering how formal and informal institutional distances
within a MNE’s portfolio of locations might influence the firm’s overall CSP.
Institutional theory recognizes the unique environmental pressures that influence a

70
firm’s drive toward local legitimacy. Large institutional distance represents a large
discrepancy between home and host institutional environments. Previous research has
focused on how specific headquarters-based institutional and cultural factors may affect
CSP levels. Here I advance the CSP literature by theorizing and empirically examining
how formal and informal institutional distance in the firm’s overall portfolio of
operating locations affects MNE CSP.
I theorized that the informal and formal components of institutional distance can
negatively influence firm CSP in two different ways. First, I hypothesized that firm CSP
would be negatively affected by greater average informal institutional distance between
its headquarters and full set of subsidiary locations, as measured by the firm’s portfolio-
level aggregate cultural distance. Additionally, I hypothesized that greater formal
institutional distance within the firm’s operating portfolio reduces the CSP benefits of
greater international scope.
I tested my institutional distance hypotheses on a broad sample of 408 firms
headquartered in 27 different countries spanning the European, Asian, and North
American regions. As expected, I found that firm MNE CSP suffers when the aggregate
cultural distance between the headquarters location and portfolio of subsidiary locations
is high, reflecting a large portfolio-level informal institutional disparity between the
countries in which the firm is operating.
In my second hypothesis I explored the moderating influence of home-host
country formal institutional distance and the firm’s international scope. I found that firms
with greater formal institutional distance, as reflected in the country social responsibility
standards differences between headquarters and portfolio of locations, experience fewer

71
CSP benefits from increased international scope. These findings reflect the challenges
firms can expect to face in understanding and responding to local formal CSP
expectations that are very different from their headquarters location.
These results suggest that MNEs headquartered in countries with relatively
stronger formal institutions that emphasize CSP, such as Sweden, are at an advantage in
terms of the CSP benefits associated with international expansion compared to firms
headquartered in countries with relatively lower CSP standards, such as China. Because
the Swedish firm’s home country high CSP standards meet or exceed most subsidiary
location standards, its portfolio formal institutional distance will generally be a very
small or negative number; that is the Swedish firm is able to apply its high standards of
CSP experience to other locations, gaining the CSP benefits associated with greater
international scope.
Conversely, CSP standards are generally lower in Asia than in other regions of the
globe. When a firm headquartered in China chooses to expand internationally, it can be
expected to encounter subsidiary locations with higher CSP expectations than its Chinese
home country standards. As a result the Chinese firm will have a greater formal
institutional distance to overcome as it expands geographically, leading to lower CSP
benefits associated with greater international scope. These results supporting Hypothesis
2 suggest that the typical Chinese firm cannot expect to receive as great a CSP benefit
from expanding into additional countries as a typical Swedish firm due to the larger
portfolio formal institutional distance. Thus firms from higher CSP countries will on
average tend to benefit more from international expansion that firms from lower CSP
nations, from a CSP perspective.
72
Contribution
One unique research contribution of this study is the application of the concept
of the MNE operating portfolio. The operating portfolio is based on a consideration of
the full set of subsidiary operating locations specific to a given MNE and may provide a
useful vantage point from which to explore institutional influences on MNEs. The
international business literature has used the distance between sets of two specific
countries, typically a headquarters/subsidiary combination or a home country/target host
country dyad to study numerous phenomena of interest to MNEs. However, this study
considers the entire set of operating locations particular to a MNE when evaluating the
effects of distance on CSP. The portfolio conceptualization recognizes that both the
number of countries and corresponding institutional profiles of the specific countries in
which a MNE is operating play a role in defining the MNE’s unique challenges and
opportunities. The MNE portfolio may provide insights that can overcome some of the
limitations of applying institutional theory to MNEs and represents a paradigm that may
offer unique insights if applied in other international business research areas.
Another research contribution of this study is its asymmetric conceptualization of
formal institutional distance. Distance in international business research is most
commonly conceived as the absolute value of the difference between two points
(Shenkar, 2001; Zaheer, et al., 2012); that is, the institutional distance from Country A to
Country B is typically treated as equivalent to the distance from Country B to A.
This study moves beyond this non-directional dyadic view and instead considers
the difference between the CSP standards of the MNE’s subsidiary location countries as
compared to its home country to operationalize the firm’s formal institutional distance.

73
Unlike informal institutional distance, the firm’s portfolio formal institutional distance is
assumed to be neither symmetrical nor bidirectional.
The theoretical foundation for this operationalization was found in an examination
of the inherent differences between formal and informal institutional distances. Informal
institutional differences cannot necessarily be overcome with experience; each country
has a unique culture. In contrast, formal institutional requirements are both finite and
hierarchical; once a firm has met a high, stringent formal institutional level, that
experience can be leveraged for subsequent country expansions.
Therefore, a MNE headquartered in a country with a lower CSP standard than its
subsidiary portfolio countries could face a very large formal institutional distance. In
contrast, a MNE headquartered in a country with higher CSP standards than the MNE’s
subsidiary portfolio can be expected to have a very small or negative formal institutional
distance with which to contend. This research contribution helps address some of the
criticisms that have been levied against the typical application of distance in international
business research (Shenkar, 2001; Zaheer, et al., 2012). Other international business
studies that utilize institutional distance may also want to consider whether the dynamics
of formal vs. informal institutional distance may also be different in other research
settings.
Managerial Implications
This research contributes to the international business and CSP literature by
highlighting how firm CSP may be affected by formal and informal institutional distance
within the firm’s total operating portfolio. As firms expand internationally into new

74
country markets, managers may want to consider the implications of the institutional
distances created by their country selections. Managers may want to consider the
potential CSP effects of expanding into target countries that are institutionally distant
from their home environment. This may be especially important for firms headquartered
in regions that have low CSP standards, such as emerging market firms, looking to
expand to countries with higher CSP standards, such as into more institutionally-
developed economic regions. Managers have an opportunity to make decisions which
minimize the potential negative effects on CSP.
A firm headquartered in a country that has relatively higher standards of social
responsibility practices will have developed specific capabilities to achieve compliance
with high levels of formal institutional regulation. As the firm expands into countries
with relatively lower regulatory CSP expectations, their already-developed capabilities
may supersede the requirements of the new country. Therefore, formal institutional
distance (regardless of the extent of the firm’s other international experience) between the
home and host countries may become a non-issue for these firms. Conversely, the formal
institutional distance and corresponding international scope can be very relevant for a
firm headquartered in a country with relatively lower standards of social responsibility
practices. This firm may not yet have faced the more stringent regulatory expectations
that the target host country requires. Such a firm may find the higher standards adversely
affect its CSP.
Limitations
This proposed study has several limitations which may offer opportunities for
future streams of research building upon this study’s findings. Although the research

75
design includes the holistic consideration of the MNE as a portfolio, the scope of the
portfolio used in this study is limited to company subsidiary locations. The portfolio
operationalization does not consider non-subsidiary alliance partners and the associated
resources and potential influences from this broader network of relationships. Recent
research has indicated that these networks may be important considerations to capture the
full dynamics affecting MNEs (Johanson & Vahlne, 2009; Zaheer & Hernandez, 2011).
It should also be noted that in measuring the institutional distances at a portfolio
level, all subsidiaries are weighted equally, consistent with the approach used in other
recent portfolio-level studies (Chao & Kumar, 2010; Gomez-Mejia, et al., 2010; Gomez-
Mejia & Palich, 1997; Kim & Park, 2002; Nachum & Song, 2011; Zaheer & Hernandez,
2011). Future research may be able to incorporate theory that could further delineate and
weight subsidiaries based upon other factors, such as the percent of revenue or number of
employees associated with each subsidiary.
There are also opportunities for future research associated with the specific
choices of nation-level institutional measurements. Additional measures of formal and
informal institutions relevant to the domain of CSP could also be incorporated into the
research model. The country-level attributes used to calculate the institutional distances
do not account for possible within-country variance (Egri & Ralston, 2008), so it is
possible that as more within-country institutional measures become available, this
research could be expanded to incorporate them.
Furthermore, this study is cross-sectional. A longitudinal research design could be
used to explore whether the CSP effects of institutional distance diminish over time, as

76
has been found to be the case of cultural distance effects on subsidiary control
mechanisms (Wilkinson, et al., 2008), for example.
The Environmental Performance Index used to measure the formal institutional
distance within the firm’s portfolio of locations in this study is based on only one of the
foundational pillars of social responsibility, the environment. As reliable country-level
indicators for broad ranges of countries that encompass more of the dimensions of CSP
(such as social and employee-related) become available, these dimensions could be
incorporated into the formal distance measurement.
One of the general limitations prevalent in much social responsibility research is
the lack of standardization of CSP rating methodologies in use (Márquez & Fombrun,
2005; Turker, 2009; Wood, 2010). Future studies could replicate this study’s findings
using alternative CSP rating data sources or disaggregated rating subsets. Future research
could examine the influence of formal and informal institutional distance on one or more
dimensions of corporate social responsibility, such as firm environmental performance,
labor relations, or governance practices. Future research could also incorporate
performance outcomes to determine if either of the CSP-related institutional distance
measures have a relationship with firm financial performance.
Conclusion
This study’s findings indicate that institutional distance matters to firm CSP.
Operating in countries which are very different culturally or which have higher CSP
expectations as compared to the firm home country location may compromise the firm’s
overall CSP results. If the firm’s goal is to have a strong CSP, managers should select
77
countries which have similar formal and informal institutional profiles to their home
country to minimize the negative influence of institutional distance on firm CSP.
The findings suggest that institutional distance may be particularly relevant (and
disadvantageous) for firms headquartered in countries with relatively lower CSP
standards, such as emerging market firms. Firms from countries with higher formal
institutional standards can more readily transfer their experience to countries with lower
standards. However firms from countries with lower formal institutional standards cannot
necessarily transfer their experience to countries with higher standards. Hence, when
institutional distance is greater, firms from countries with higher formal institutional
standards with greater international experience will be less negatively affected than those
with less international experience.
78
REFERENCES
Aguilera-Caracuel, J., Aragón-Correa, J. A., Hurtado-Torres, N. E., & Rugman, A. M.
(2012). The effects of institutional distance and headquarters' financial
performance on the generation of environmental standards in multinational
companies. Journal of Business Ethics, 105(4), 461-474.
Aguinis, H., & Glavas, A. (2012). What we know and don't know about corporate social
responsibility: A review and research agenda. Journal of Management, 38(4),
932-968.
Aiken, L. S., & West, S. G. (1991). Multiple regression: Testing and interpreting
interactions. Thousand Oaks, CA: Sage Publications.
Arthaud-Day, M. L. (2005). Transnational corporate social responsibility: A tri-
dimensional approach to international CSR research. Business Ethics Quarterly,
15(1), 1-22.
Bansal, P. (2004). Evolving sustainably: A longitudinal study of corporate sustainable
development. Strategic Management Journal, 26(3), 197-218.
Bansal, P. (2005). Evolving sustainably: A longitudinal study of corporate sustainable
development. Strategic Management Journal, 26(3), 197-218.
Bansal, P., & Hunter, T. (2003). Strategic explanations for the early adoption of ISO
14001. Journal of Business Ethics, 46(3), 289-299.
Bansal, P., & Roth, K. (2000). Why companies go green: A model of ecological
responsiveness. Academy of Management Journal, 43(4), 717-736.
Barkema, H. G., & Vermeulen, F. (1998). International expansion through start up or
acquisition: A learning perspective. Academy of Management Journal, 41(1), 7-
26.
Barnea, A., & Rubin, A. (2010). Corporate social responsibility as a conflict between
shareholders. Journal of Business Ethics, 97(1), 71-86.

79
Barnett, M. L. (2007). Stakeholder influence capacity and the variability of financial
returns to corporate social responsibility. Academy of Management Review, 32(3),
794-816.
Barney, J. B. (1991). Firm resources and sustained competitive advantage. Journal of
Management, 17(1), 99-120.
Berry, H., Guillén, M. F., & Zhou, N. (2010). An institutional approach to cross-national
distance. Journal of International Business Studies, 41(9), 1460-1480.
Brammer, S. J., Pavelin, S., & Porter, L. A. (2006). Corporate social performance and
geographical diversification. Journal of Business Research, 59(9), 1025-1034.
Brouthers, L. E., O'Donnell, E., & Hadjimarcou, J. (2005). Generic product strategies for
emerging market exports into Triad nation markets: A mimetic isomorphism
approach. Journal of Management Studies, 42(1), 225-245.
Campbell, J. L. (2007). Why would corporations behave in socially responsible ways? An
institutional theory of corporate social responsibility. Academy of Management
Review, 32(3), 946-967.
Campbell, J. T., Eden, L., & Miller, S. R. (2012). Multinationals and corporate social
responsibility in host countries: Does distance matter? Journal of International
Business Studies, 43(1), 84-106.
Carroll, A. B., & Shabana, K. M. (2010). The business case for corporate social
responsibility: A review of concepts, research and practice. International Journal
of Management Reviews, 12(1), 85-105.
Chang, S. J. (1995). International expansion strategy of Japanese firms: Capability
building through sequential entry. Academy of Management Journal, 38(2), 383-
407.
Chao, M. C. H., & Kumar, V. (2010). The impact of institutional distance on the
international diversity-performance relationship. Journal of World Business,
45(1), 93-103.

80
Chatterji, A. K., Levine, D. I., & Toffel, M. W. (2009). How well do social ratings
actually measure corporate social responsibility? Journal of Economics &
Management Strategy, 18(1), 125-169.
Chetty, S., Eriksson, K., & Lindbergh, J. (2006). The effect of specificity of experience
on a firm's perceived importance of institutional knowledge in an ongoing
business. Journal of International Business Studies, 37(5), 699-712.
Cohen, J., Cohen, P., West, S. G., & Aiken, L. S. (2003). Applied multiple
regression/correlation analysis for the behavioral sciences (3rd ed.). New York,
NY: Routledge - Taylor & Francis Group.
Cohen, W. M., & Levinthal, D. A. (1990). Absorptive capacity: A new perspective on
learning and innovation. Administrative Science Quarterly, 35(1), 128-152.
Delmas, M., & Toffel, M. (2004). Stakeholders and environmental management
practices: An institutional framework. Business Strategy and the Environment,
13(4), 209-222.
Déniz-Déniz, M. C., & Garcia-Falcon, J. M. (2002). Determinants of the multinationals'
social response: Empirical application to international companies operating in
Spain. Journal of Business Ethics, 38(4), 339-370.
Dikova, D. (2009). Performance of foreign subsidiaries: Does psychic distance matter?
International Business Review, 18(1), 38-49.
DiMaggio, P. J., & Powell, W. W. (1983). The iron cage revisited: Institutional
isomorphism and collective rationality in organizational fields. American
Sociological Review, 48(2), 147-160.
Doh, J. P., Howton, S. D., Howton, S. W., & Siegel, D. S. (2010). Does the market
respond to an endorsement of social responsibility? The role of institutions,
information, and legitimacy. Journal of Management, 36(6), 1461-1465.
Dunning, J. H., & Lundan, S. M. (2008). Institutions and the OLI paradigm of the
multinational enterprise. Asia Pacific Journal of Management, 25(4), 573-593.

81
Egri, C., & Ralston, D. (2008). Corporate responsibility: A review of international
management research from 1998 to 2007. Journal of International Management,
14(4), 319-339.
Emerson, J., Esty, D. C., Levy, M. A., Kim, C. H., V., M., de Sherbinin, A., &
Srebotnjak, T. (2010). Environmental Performance Index. New Haven: Yale
Center for Environmental Law and Policy.
Estrin, S., Baghdasaryan, D., & Meyer, K. E. (2009). The impact of institutional and
human resource distance on international entry strategies. Journal of Management
Studies, 46(7), 1171-1196.
Fox, T. (2004). Corporate social responsibility and development: In quest of an agenda.
Development, 47(3), 29-36.
Ghemawat, P. (2001). Distance still matters. Harvard Business Review, 79(8), 137-147.
Gjolberg, M. (2009). The origin of corporate social responsibility: Global forces or
national legacies? Socio-Economic Review, 7(4), 605-637.
Gomez-Mejia, L. R., Makri, M., & Kintana, M. L. (2010). Diversification decisions in
family-controlled firms. Journal of Management Studies, 47(2), 223-252.
Gomez-Mejia, L. R., & Palich, L. E. (1997). Cultural diversity and the performance of
multinational firms. Journal of International Business Studies, 28(2), 309-335.
Hair, J., Black, W., Babin, B., & Anderson, R. (2010). Multivariate data analysis (7th
ed.). Upper Saddle River, NJ: Pearson Prentice Hall.
Helmke, G., & Levitsky, S. (2004). Informal institutions and comparative politics: A
research agenda. Perspectives on Politics, 2(4), 725-740.
Hitt, M. A., Tihanyi, L., Miller, T., & Connelly, B. (2006). International diversification:
Antecedents, outcomes, and moderators. Journal of Management, 32(6), 831-867.
Ho, F. N., Wang, H. M. D., & Vitell, S. J. (2012). A global analysis of corporate social
performance: The effects of cultural and geographic environments. Journal of
Business Ethics, In press.

82
Hofstede, G. (1980). Culture’s consequences: National differences in thinking and
organizing. Beverly Hills, CA: Sage Publications.
Holmes Jr, R. M., Miller, T., Hitt, M., & Salmador, M. P. (2012). The Interrelationships
among informal institutions, formal institutions, and inward foreign direct
investment. Journal of Management, In press.
House, R., Javidan, M., Hanges, P., & Dorfman, P. (2002). Understanding cultures and
implicit leadership theories across the globe: An introduction to project GLOBE.
Journal of World Business, 37(1), 3-10.
Hultman, M., Katsikeas, C. S., & Robson, M. J. (2011). Export promotion strategy and
performance: The role of international experience. Journal of International
Marketing, 17-39.
Ioannou, I., & Serafeim, G. (2012). What drives corporate social performance? The role
of nation-level institutions. Journal of International Business Studies, 43(9), 834-
864.
Jackson, G., & Apostolakou, A. (2010). Corporate social responsibility in Western
Europe: An institutional mirror or substitute? Journal of Business Ethics, 94(3),
371-394.
Jamali, D. (2010). The CSR of MNC subsidiaries in developing countries: Global, local,
substantive or diluted? Journal of Business Ethics, 93(2), 181-200.
Jamali, D., & Neville, B. (2011). Convergence versus divergence of CSR in developing
countries: An embedded multi-layered institutional lens. Journal of Business
Ethics, 102(4), 599-621.
Johanson, J., & Vahlne, J. E. (2009). The Uppsala internationalization process model
revisited: From liability of foreignness to liability of outsidership. Journal of
International Business Studies, 40(9), 1411-1431.
Johnson, R. A., & Greening, D. W. (1999). The effects of corporate governance and
institutional ownership types on corporate social performance. Academy of
Management Journal, 42(5), 564-576.

83
Kang, J. (2013). The relationship between corporate diversification and corporate social
performance. Strategic Management Journal, 34, 94-109.
Kennelly, J. J., & Lewis, E. E. (2002). Degree of internationalization and corporate
environmental performance: Is there a link? International Journal of
Management, 19(3), 478-489.
Kim, K., & Park, J.-H. (2002). The determinants of value creation for partner firms in the
global alliance context. Management International Review, 42(4), 361-384.
Kogut, B. (1991). Country capabilities and the permeability of borders. Strategic
Management Journal, 12(S1), 33-47.
Kogut, B., & Singh, H. (1988). The effect of national culture on the choice of entry
mode. Journal of International Business Studies, 19(3), 411-432.
Kolk, A., & Pinkse, J. (2008). A perspective on multinational enterprises and climate
change: Learning from “an inconvenient truth”? Journal of International Business
Studies, 39(8), 1359-1378.
Kostova, T. (1999). Transnational transfer of strategic organizational practices: A
contextual perspective. Academy of Management Review, 24(2), 308-324.
Kostova, T., & Roth, K. (2002). Adoption of an organizational practice by subsidiaries of
multinational corporations: Institutional and relational effects. Academy of
Management Journal, 45(1), 215-233.
Kostova, T., Roth, K., & Dacin, M. (2008). Institutional theory in the study of
multinational corporations: A critique and new directions. Academy of
Management Review, 33(4), 994-1006.
Kostova, T., & Zaheer, S. (1999). Organizational legitimacy under conditions of
complexity: The case of the multinational enterprise. Academy of Management
Review, 24(1), 64-81.
Lane, P. J., Koka, B. R., & Pathak, S. (2006). The reification of absorptive capacity: A
critical review and rejuvenation of the construct. Academy of Management
Review, 31(4), 833-863.

84
Mahon, J., & Wartick, S. L. (2012). Corporate social performance profiling: Using
multiple stakeholder perceptions to assess a corporate reputation. Journal of
Public Affairs, 12(1), 12-28.
Márquez, A., & Fombrun, C. J. (2005). Measuring corporate social responsibility.
Corporate Reputation Review, 7(4), 304-308.
Matten, D., & Moon, J. (2008). "Implicit" and "explicit" CSR: A conceptual framework
for a comparative understanding of corporate social responsibility. Academy of
Management Review, 33(2), 404-424.
McWilliams, A., Siegel, D. S., & Wright, P. M. (2006). Corporate social responsibility:
Strategic implications. Journal of Management Studies, 43(1), 1-18.
Mohan, A. (2006). Global corporate social responsibilities management in MNCs.
Journal of Business Strategies, 23(1), 9–32.
Nachum, L., & Song, S. (2011). The MNE as a portfolio: Interdependencies in MNE
growth trajectory. Journal of International Business Studies, 42(3), 381-405.
North, D. C. (1990). Institutions, institutional change, and economic performance.
Cambridge: Cambridge University Press.
O'Grady, S., & Lane, H. W. (1996). The psychic distance paradox. Journal of
International Business Studies, 27(2), 309-333.
Park, H., Russell, C., & Lee, J. (2007). National culture and environmental sustainability:
A cross-national analysis. Journal of Economics and Finance, 31(1), 104-121.
Peng, M. W., Sunny, L. S., Pinkham, B., & Hao, C. (2009). The institution-based view as
a third leg for a strategy tripod. Academy of Management Perspectives, 23(3), 63-
81.
Peng, M. W., Wang, D. Y. L., & Jiang, Y. (2008). An institution-based view of
international business strategy: A focus on emerging economies. Journal of
International Business Studies, 39(5), 920-936.
85
Peters, R., & Vassar, J. A. (2009). The international flavours of corporate social
responsibility. International Journal of Management and Enterprise
Development, 7(4), 382-393.
Pinkse, J., Kuss, M. J., & Hoffmann, V. H. (2010). On the implementation of a
'global'environmental strategy: The role of absorptive capacity. International
Business Review, 19(2), 160-177.
Redding, G. (2005). The thick description and comparison of societal systems of
capitalism. Journal of International Business Studies, 36(2), 123-155.
Ringov, D., & Zollo, M. (2007). The impact of national culture on corporate social
performance. Corporate Governance, 7(4), 476-485.
Rosenzweig, P. M., & Singh, J. V. (1991). Organizational environments and the
multinational enterprise. Academy of Management Review, 16(2), 340-361.
Rugman, A. M., & Verbeke, A. (1998). Corporate strategy and international
environmental policy. Journal of International Business Studies, 29(4), 819-833.
Russo, M. V., & Fouts, P. A. (1997). A resource-based perspective on corporate
environmental performance and profitability. Academy of Management Journal,
40(3), 534-559.
Saisana, M., & Saltelli, A. (2010). Uncertainty and Sensitivity Analysis of the 2010
Environmental Performance Index. Luxembourg: European Commision Joint
Research Centre.
Scott, W. (1987). The adolescence of institutional theory. Administrative Science
Quarterly, 32(4), 493-511.
Shane, S., Venkataraman, S., & MacMillan, I. (1995). Cultural differences in innovation
championing strategies. Journal of Management, 21(5), 931-952.
Shenkar, O. (2001). Cultural distance revisited: Towards a more rigorous
conceptualization and measurement of cultural differences. Journal of
International Business Studies, 32(3), 519-535.

86
Singh, K. (2007). The limited relevance of culture to strategy. Asia Pacific Journal of
Management, 24(4), 421-428.
Strike, V. M., Gao, J., & Bansal, P. (2006). Being good while being bad: Social
responsibility and the international diversification of US firms. Journal of
International Business Studies, 37(6), 850-862.
Turker, D. (2009). Measuring corporate social responsibility: A scale development study.
Journal of Business Ethics, 85(4), 411-427.
Udayasankar, K. (2008). Corporate social responsibility and firm size. Journal of
Business Ethics, 83(2), 167-175.
Waldman, D., de Luque, M., Washburn, N., & House, R. (2006). Cultural and leadership
predictors of corporate social responsibility values of top management: A GLOBE
study of 15 countries. Journal of International Business Studies, 37(6), 823-837.
Wernerfelt, B. (1984). A resource-based view of the firm. Strategic Management
Journal, 5(2), 171-180.
Wilkinson, T. J., Peng, G. Z., Brouthers, L. E., & Beamish, P. W. (2008). The
diminishing effect of cultural distance on subsidiary control. Journal of
International Management, 14(2), 93-107.
Wood, D. J. (1991). Corporate social performance revisited. Academy of Management
Review, 16(4), 691-718.
Wood, D. J. (2010). Measuring corporate social performance: A review. International
Journal of Management Reviews, 12(1), 50-84.
Xu, D., & Shenkar, O. (2002). Institutional distance and the multinational enterprise.
Academy of Management Review, 27(4), 608-618.
Zaheer, A., & Hernandez, E. (2011). The geographic scope of the MNC and its alliance
portfolio: Resolving the paradox of distance. Global Strategy Journal, 1(1‐2),
109-126.

87
Zaheer, S. (1995). Overcoming the liability of foreignness. Academy of Management
Journal, 38(2), 341-363.
Zaheer, S., Schomaker, M. S., & Nachum, L. (2012). Distance without direction:
Restoring credibility to a much-loved construct. Journal of International Business
Studies, 43(1), 18-27.
Zahra, S. A., & George, G. (2002). Absorptive capacity: A review, reconceptualization,
and extension. Academy of Management Review, 27(2), 185-203.
Zahra, S. A., Ireland, R. D., & Hitt, M. A. (2000). International expansion by new
venture firms: International diversity, mode of market entry, technological
learning, and performance. Academy of Management Journal, 43(5), 925-950.

88
CHAPTER 3 (Paper 2)
FORMAL AND INFORMAL CORRUPTION ENVIRONMENTS AND
MULTINATIONAL ENTERPRISE SOCIAL IRRESPONSIBILITY
Abstract
In this study I examine the underexplored antecedents and consequences of
multinational enterprise (MNE) corporate social irresponsibility (CSiR) by theorizing and
empirically examining how levels of corruption in a MNE’s external environment affect
the firm’s level of CSiR and subsequent performance. Using an institutional theory
framework developed by North (1990), corruption is conceptualized as having both
formal and informal dimensions. Applying a portfolio approach used in prior
international business studies to view an MNE’s environment as the sum of all of its
geographic locations, I hypothesize and find that higher levels of formal and/or informal
corruption environments are related to higher levels of MNE CSiR. I also explore the
normative aspects of social irresponsibility and find that firms with higher CSiR will be
outperformed by less socially irresponsible firms. The results support the notion that
there are institutionally-driven ties between formal and informal corruption, social
irresponsibility, and firm performance.
Keywords: corporate social responsibility (CSR), corporate social irresponsibility
(CSiR), institutional theory, multinational enterprise (MNE), portfolio, corruption, two-
stage least squares regression (2SLS)

89
89 89
89 89 89 89 89
89 89
INTRODUCTION
While research concerning corporate social responsibility (CSR) continues to
grow (Aguinis & Glavas, 2012), there has been relatively little scholarly interest in
examining corporate social irresponsibility (CSiR). CSR is associated with doing ‘good
deeds’; conversely CSiR reflects a firm’s ‘bad deeds’ (Muller & Kräussl, 2011). CSiR
can result from a firm strategy, decision, and/or action that “negatively affects an
identifiable social stakeholder's legitimate claims (in the long run)” (Strike, Gao, &
Bansal, 2006, p. 852). More negative actions on the part of the firm can result in higher
levels of social irresponsibility. Thus, CSiR is more than simply a firm’s failure to act in
a responsible manner (Lange & Washburn, 2012).
It may be tempting to regard CSR and CSiR as opposite ends of the same
continuum, but CSiR is a concept distinct from CSR (Lange & Washburn, 2012;
Mattingly & Berman, 2006; Wood, 2010). Simply interpreting CSiR as a low level of
overall firm CSR is not sufficient (McGuire, Dow, & Argheyd, 2003; Muller & Kräussl,
2011). This is because firms can potentially exhibit both CSR and CSiR behavior
simultaneously (Strike, et al., 2006). A firm might have a strong record in one area of
social responsibility but act irresponsibly in another area. For example, per the 2010
Kinder, Lydenberg, Domini Research & Analytics social responsibility ratings, Starbucks
exhibited high levels of CSR in the categories of environmental sustainability and
community relations. At the same time, concerns regarding labor practices within
Starbucks’ supply chain resulted in high employee relations-related irresponsibility levels
(MSCI, 2010). Firms may even invest in more ‘good’ to compensate for their past or
current irresponsibility practices (Kotchen & Moon, 2011) or to act as a type of insurance

90
90 90
90 90 90 90 90
90 90
against future irresponsibility (Godfrey, Merrill, & Hansen, 2009; Minor & Morgan,
2011).
In addition, a given action may be seen as socially responsible from one
stakeholder perspective but irresponsible from another (Wood, 2010). When Shell Oil
was removed from the Dow Jones Sustainability Index in 2010 because of environmental
and human rights irresponsibility in its Nigerian operations, exiting the country was
considered to be the socially responsible decision to eliminate these violations
(Datamonitor, 2011). The Nigerian exit option was also viewed as potentially
irresponsible due to concerns that Shell’s presence would only be replaced with even less
environmentally and human rights-sensitive state-owned Chinese oil companies. CSR
and CSiR have unique dynamics and therefore deserve disparate consideration.
Compared to CSR, there has been scant focus on the antecedents and
consequences of CSiR behavior (Greenwood, 2007; Lange & Washburn, 2012). Aside
from the isolated insights that greater international diversification can lead to higher
CSiR (Strike, et al., 2006) and certain executive compensation structures can be
associated with higher levels of firm CSiR (McGuire, et al., 2003), what we know about
social irresponsibility is extremely limited. This is surprising, since “perceptions of social
irresponsibility are likely to generate stronger observer reactions and ultimately loom
much larger for the firm than perceptions of social responsibility” (Lange & Washburn,
2012, p. 301). The reverberations associated with incidents of and reputations for CSiR
can have a greater (negative) influence on the value of the firm than any positive
increases associated with CSR (Doh, Howton, Howton, & Siegel, 2010; Frooman, 1997;
Muller & Kräussl, 2011).

91
91 91
91 91 91 91 91
91 91
The lack of prior research attention to CSiR offers opportunities to explore the
potential CSiR implications of a variety of institutional environmental factors external to
the firm. One institutional environmental influence that has not yet been considered
within the context of overall firm CSiR is corruption. Like social irresponsibility,
corruption is a non-market force that has ethical implications for the firm and can have a
potential negative impact on organizations (Rodriguez, Siegel, Hillman, & Eden, 2006).
Because different countries exhibit different levels of public and private corruption
(Cuervo-Cazurra, 2006), a consideration of corruption’s relationship to CSiR may be
particularly relevant to multinational enterprises (MNEs), which are subject to a wide
variety of different external influences stemming from their diverse, multiple, country-
spanning operating environments (Kostova, Roth, & Dacin, 2008).
International business research has confirmed that firms headquartered in
countries characterized by lower corruption have higher levels of social responsibility
(Ioannou & Serafeim, 2012). Additionally, previous research within the economics
literature has found negative relationships between corruption and the stringency of
country-level environmental policy and country environmental performance (Damania,
Fredriksson, & List, 2003; Doig & Mclvor, 1999; Lopez & Mitra, 2000; Morse, 2006;
Welsch, 2004). These studies provide prima facie support for the notion that corruption
may be linked to some aspects of CSiR.
In this paper I use an institutional theory lens to examine the impact of both
formal and informal aspects of corruption on corporate social irresponsibility in an
international context. Institutional theory recognizes that firms strive to align themselves
within their external institutional environment (Kostova, et al., 2008). This institutional
environment is comprised of both formal institutions, which include codified regulations

92
92 92
92 92 92 92 92
92 92
and laws, and informal institutions, which encompass the more tacit cultural and
behavioral norms (North, 1990).
I conceptualize the MNE as a portfolio of international locations and take into
account corruption characteristics of all locations in which the MNE has an operating
presence. Building on institutional theory, I develop theory that suggests a firm’s
operating environment is comprised of both a formal corruption environment (FCE) and
an informal corruption environmental (ICE) component. The FCE reflects the level of
corruption within the country’s public sector, encompassing corruption inherent in formal
governmental, political, and administrative institutions. The ICE captures the general
public’s views on and experiences with corruption in their everyday lives, reflecting the
more general national penetration of corruption in the country’s culture. I hypothesize
that due to formal and informal institutional influences, higher FCE and/or ICE in the
portfolio of countries in which a MNE is operating will be related to higher levels of firm
CSiR.
Further, I investigate the normative aspects of social irresponsibility by
investigating the question of whether CSiR is related to MNE performance. Prior
research has established a variety of relationships between CSR and firm financial
performance (Margolis, Elfenbein, & Walsh, 2009; Margolis & Walsh, 2003; Orlitzky,
Schmidt, & Rynes, 2003; Peloza, 2009), but we do not yet know if CSiR is related to firm
performance. I develop theory that suggests CSiR is related to performance for a number
of reasons. CSiR may draw attention from both private (e.g. non-governmental
organization) and public (e.g. regulatory) constituents, pressuring the firm to expend
resources to rectify its irresponsible behavior and address resulting stakeholder harm,
reducing performance. Additionally, not only can reacting to CSiR be a drain on firm
93
93 93
93 93 93 93 93
93 93
resources, but a pattern of socially irresponsible actions may put the firm’s legitimacy
with its stakeholders at risk, reducing firm sales. For these reasons I hypothesize that
firms with higher CSiR will be outperformed by firms that do not have to contend with
these added costs and risks.
Hence, I contribute to the international business and social responsibility
literatures in several ways. First, this study is unique in that it is the first to explore the
impact of a MNE’s overall social irresponsibility on its performance. Understanding the
harmful results of corrupt and irresponsible behavior is an open issue in the social
responsibility literature (Putrevu, McGuire, Siegel, & Smith, 2012). This study’s results
provide new strategic insights into the importance and relevance of the consequences of
CSiR to MNEs by linking CSiR and firm performance.
I also examine antecedents of CSiR by testing the impacts of corruption levels
evident the firm’s institutional environment. In doing so, my conceptualization of
corruption as having both a formal and informal component is a novel contribution.
Research typically limits the focus to formal (public sector) corruption. This study
expands beyond formal corruption by highlighting the incremental influence of the
under-emphasized general permeation of corruption in a society with the inclusion of the
informal corruption environment. Finally, by regarding the entire location footprint of the
MNE as a holistic unit, I am the first to examine social irresponsibility in a way that
incorporates the corruption influences of the MNE’s entire portfolio of operating
locations.

94
94 94
94 94 94 94 94
94 94
THEORY AND HYPOTHESES
Institution-Based View
I build on institutional theory in this study to explain how and why an external
environmental force, such as corruption, affects firm behavior, specifically CSiR
behavior. Institutional theory recognizes that firms seek legitimacy within their target
markets (Scott, 2008). That is, they want their actions to be perceived as being “desirable,
proper, or appropriate within some socially constructed system of norms, values, beliefs,
and definitions” (Suchman, 1995, p. 574).
Firms rely on institutional cues to provide both explicit and implicit direction
regarding what constitutes legitimacy. These cues can come from both formal and
informal institutions, essentially defining the “rules of the game” for individuals and
businesses (North, 1990, p. 3). North’s model specifies that formal institutions include
governing structures such as political, judicial, and economic rules, regulations, and other
formalized behavioral guidelines. Informal institutions permeate an individual’s full
range of daily interactions. Interactions between family members, coworkers, and
strangers are subject to certain informal constraints in the forms of expected behavioral
norms, codes of conduct, and cultural norms and conventions.
Despite their tacit and relatively ambiguous nature, informal institutions can be
particularly important behavioral influences (North, 1990). This is because of a
fundamental difference between formal and informal institutions. The clarity and strength
of formal institutions varies between countries. Firms will be subject to greater formal
institutional pressures in environments where those formal institutions are strong and
well-developed. For example, emerging economies tend to have more underdeveloped
formal institutional environments (Peng, Wang, & Jiang, 2008).

95
95 95
95 95 95 95 95
95 95
In contrast, all locations exert some form of informal institutional influence on
their inhabitants. One country’s overall informal institutional environment is not
necessarily “stronger” or “weaker” than another; it is simply different. For example,
China and Sweden have very different cultural norms, but one would not characterize
either country as having “more” or “less” culture than the other. Where formal
institutional structures are weak, informal constraints tend to play an even larger role in
influencing firm behavior (Peng & Heath, 1996).
Formal and informal institutional norms are more than mere “background
conditions” or contextual factors; they can be key drivers of strategic decisions (Peng,
Sunny, Pinkham, & Hao, 2009). Institutional pressures provide direction that can help
firms reduce uncertainty (Scott, 2008). The ability to understand and respond to the
expectations of the institutional environment can drive a firm’s success (or failure)
(Henisz & Swaminathan, 2008; Peng & Pleggenkuhle Miles, 2009). Achieving
institutional legitimacy can enhance the prospects for the firm’s very survival (Kostova,
et al., 2008).
Establishing legitimacy within formal and informal institutional environments can
become even more complex for MNEs who by definition operate in multiple countries
with potentially diverse institutional expectations (Kostova, et al., 2008). Legitimacy may
take different forms in different countries, conditions, and contexts. This dynamic can be
particularly salient for MNEs doing business in emerging economies, where institutional
environments may be in a state of transition (Peng, et al., 2009).
Institutional theory is a particularly appropriate lens through which to view firm
behavior with regards to social responsibility-related outcomes because social
responsibility cues commonly emerge from the formal and informal institutions within

96
96 96
96 96 96 96 96
96 96
which the firm interacts (Campbell, 2007). MNEs may use such social responsibility cues
to meet specific legitimacy expectations of their local stakeholders (Matten & Moon,
2008). MNEs may tailor social responsibility investments and priorities to align with the
institutional environment in a given host country market (Chiu & Sharfman, 2011; Yang
& Rivers, 2009).
Institutionalized Corruption
In this study I focus on one particular dimension of the MNE’s institutional
environment: corruption. Much of the corruption research to date has emphasized public
sector corruption, consistent with a definition of corruption as “the use of public office
for private gain” (Gray & Kaufmann, 1998). In this study I conceptualize corruption
more broadly, expanding the consideration of corruption beyond the public sector and
conceiving it as “the misuse of entrusted [emphasis added] power for private gain”
(Transparency International, 2010). Consistent with institutional theory, this broader
definition recognizes that corruption can be promoted via both formal (public sector) and
informal (culturally-reinforcing) mechanisms.
Including an informal corruption component is an important distinction compared
to typical corruption studies which focus primarily or solely on formal corruption in the
public sector. The intent is to expand our conceptualization of corruption and its impacts.
Without minimizing the significant global economic impact of corrupt commercial
interactions involving public officials (Transparency International, 2010), the ubiquity of
corruption into the general society can also be a factor affecting MNEs. The informal
component of corruption captures this penetration of corruption into citizens’ everyday
lives. Though not as codified or clearly structured as formal institutions, the informal
97
97 97
97 97 97 97 97
97 97
aspect of institutional pressures are still critical influences of what constitutes legitimacy
(North, 1990). For this reason, I develop theory to explain how both the formal and
informal aspects of corruption can influence CSiR.
Corruption and Social Responsibility
Corruption and social responsibility are related phenomena (Rodriguez, et al.,
2006). Both concepts represent unique non-market aspects of societies and recognize that
firms are subject to formal and informal institutional influences found in their operating
environments. Both corruption and social responsibility pressures may influence how
firms interact with and respond to the expectations of governments, communities, and
other local stakeholders. Though rarely studied together (Rodriguez, et al., 2006), prior
research has begun to explore relationships between corruption and social responsibility
upon which this study builds.
Prior literature demonstrates the existence of relationships between corruption and
certain aspects of social responsibility. For instance, firms headquartered in countries
where their managers are expected to experience higher levels of corruption in their
interactions with public officials have been shown to have correspondingly lower levels
of positive social performance (Ioannou & Serafeim, 2012). Researchers have also found
a negative relationship between corruption levels and environmental policy and
performance (Damania, et al., 2003; Doig & Mclvor, 1999; Lopez & Mitra, 2000; Morse,
2006; Welsch, 2004).
There is also some evidence that operating in environments that are perceived to
have higher levels of corruption may lead firms to invest less in social responsibility.
Using a sample of MNEs with subsidiary locations operating in China, Luo (2006) found

98
98 98
98 98 98 98 98
98 98
that firms’ philanthropic contributions decrease in higher corruption environments. Firms
are less likely to contribute socially when they perceive that their investments have a
higher likelihood of being embezzled or misapplied by corrupt public officials.
These few studies provide initial support for the notion that there are ties between
corruption and social responsibility. But these studies have several shortcomings. First,
whereas these studies explore CSR outcomes (environmental performance, philanthropy),
they do not specifically examine corruption as a possible antecedent of socially
irresponsible behavior, as I do here. Furthermore, these studies focus on formalized
corruption within the public sector, whereas I conceptualize corruption as a multi-
dimensional construct with both formal (public) and informal (private) components.
Finally, these studies do not take into account how the corrupt influences of a MNE’s
entire portfolio of locations might impact the firm, focusing instead on individual country
effects. In this study I contribute to this emerging area of research by theoretically and
empirically exploring the relationships between MNE portfolio formal and informal
corruption environments and firm social irresponsibility and performance as shown in
Figure 3.1, advancing the international business and social responsibility literatures.
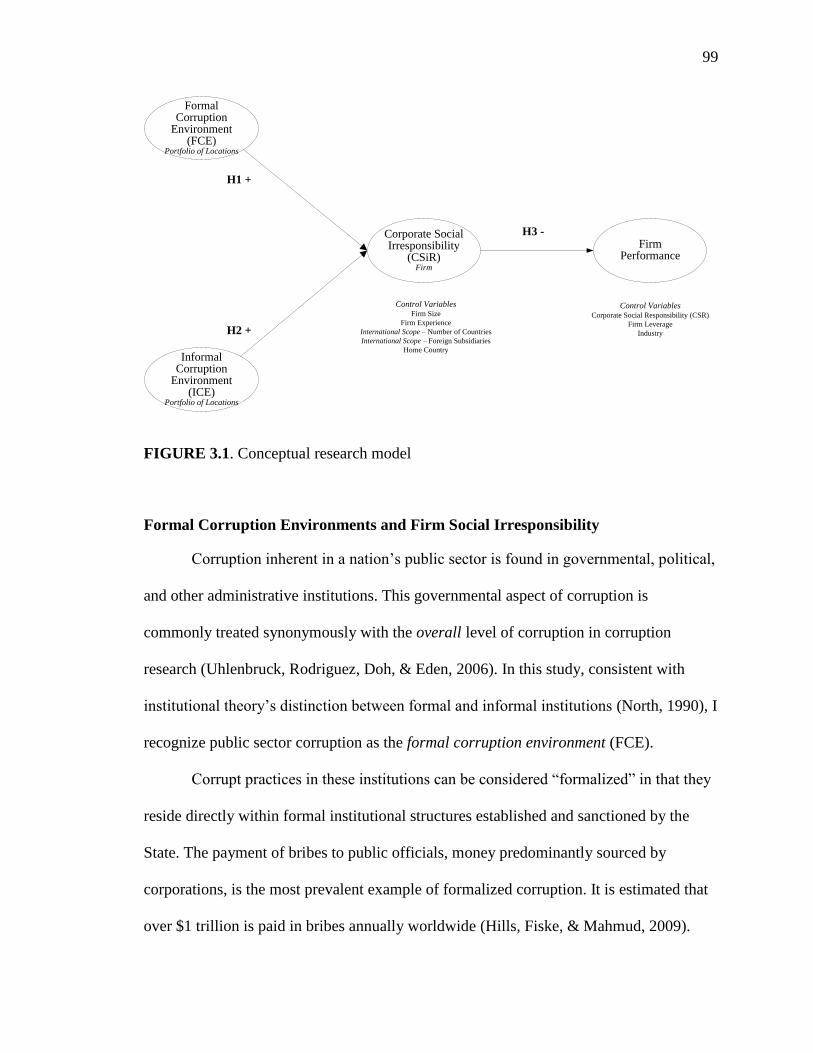
99
99 99
99 99 99 99 99
99 99
Control VariablesFirm Size
Firm Experience
International Scope – Number of Countries
International Scope – Foreign Subsidiaries
Home CountryInformal
CorruptionEnvironment
(ICE)Portfolio of Locations
FormalCorruption
Environment (FCE)
Portfolio of Locations
Corporate Social Irresponsibility
(CSiR)Firm
FirmPerformance
H1 +
H2 +
H3 -
Control VariablesCorporate Social Responsibility (CSR)
Firm Leverage
Industry
FIGURE 3.1. Conceptual research model
Formal Corruption Environments and Firm Social Irresponsibility
Corruption inherent in a nation’s public sector is found in governmental, political,
and other administrative institutions. This governmental aspect of corruption is
commonly treated synonymously with the overall level of corruption in corruption
research (Uhlenbruck, Rodriguez, Doh, & Eden, 2006). In this study, consistent with
institutional theory’s distinction between formal and informal institutions (North, 1990), I
recognize public sector corruption as the formal corruption environment (FCE).
Corrupt practices in these institutions can be considered “formalized” in that they
reside directly within formal institutional structures established and sanctioned by the
State. The payment of bribes to public officials, money predominantly sourced by
corporations, is the most prevalent example of formalized corruption. It is estimated that
over $1 trillion is paid in bribes annually worldwide (Hills, Fiske, & Mahmud, 2009).

100
100 100
100 1
00 100 100 100
100 100
Firms interact with public officials and formal institutional processes in a variety
of ways in establishing and managing their local operations. An institutional framework
put forth by Rodriguez, Uhlenbruck, and Eden (2005) suggests in doing so firms can
expect to be confronted with a higher degree of corrupt officials in some countries than
others. They coin the term corruption pervasiveness as a reflection of the firm’s
“expectation of the proportion of interactions with the state that will entail corrupt
transactions” (Rodriguez, et al., 2005, p. 385).
Institutional theory posits that cues from formal institutions influence a firm’s
behavior, and a firm’s activities reflect the formalized norms of its operating environment
(North, 1990). If formal institutional cues include corrupt or unethical practices, they are
likely to have an impact on a firm’s actions in its search for institutional legitimacy. A
more pervasive FCE increases the likelihood that the firm will encounter corruption
within their public sector interactions, resulting in more opportunities for the firm to act
in a corrupt manner (Argandoña, 2007), likewise leading to greater firm participation in
corruption (Uhlenbruck, et al., 2006).
This dynamic is even more complex for MNEs, firms that operate in multiple
countries representing a potentially wide variety of institutional environments (Kostova
& Roth, 2002). Different countries may have different levels of formalized corruption
within their public sector institutions (Rodriguez, et al., 2005). For instance, corruption
levels have been found to be higher in emerging economies because of weaknesses in
institutional infrastructures (Hellman, Jones, Kaufmann, & Schankerman, 2000;
Kaufmann, 2004; Li, 2009; Venard & Hanafi, 2008). Corrupt practices may also be
imitated by and copied between countries (Argandoña, 2007). Thus, each country within
a MNE’s set of subsidiary locations may present the firm with a unique FCE within
101
101 101
101 1
01 101 101 101
101 101
which the firm acts. From an institutional perspective, firm behavior may therefore be
influenced by the FCE of the collective set of locations within which they have chosen to
operate, their operating portfolio (Nachum & Song, 2011).
Corruption and social irresponsibility are closely related in that they both
represent non-market forces that impact the actions of MNEs; “the non-market
environment offers both opportunities and risks for MNEs” (Rodriguez, et al., 2006, p.
734). I argue that firms that establish and maintain operational legitimacy in portfolios of
locations characterized by high FCEs may be more likely to act irresponsibly. There are
several reasons for this.
First, high FCEs may allow or even encourage MNE managers to side-step
socially responsible behavior, resulting in CSiR. In environments where formal
corruption flourishes due to lack of controls, MNEs “may become motivated to lower
ethical standards, ranging from environmental negligence and abusive labor practice to
corrupt human resource management” (Tan, 2009, p. 174). Take, for example, the case of
a MNE who bribes local environmental officials to overlook an environmental violation,
rather than investing in a CSR-enhancing control that could have prevented the pollution
issue in the first place. By leaning on corrupt practices in place of socially responsible
ones, the MNE may effectively increase its risk of producing irresponsible outcomes.
Second, when corruption is deeply embedded in a given society, MNE managers may
want to avoid damaging the firm’s reputation by associating too closely with known corrupt
public officials. Luo (2006) suggests that this may result in the use of more arms-length
relationship management techniques in highly corrupt environments. These arms-length
strategies may hamper the firm’s ability to clearly understand and respond appropriately to
stakeholders’ specific social responsibility expectations and priorities (Matten & Moon,

102
102 102
102 1
02 102 102 102
102 102
2008). This lack of stakeholder engagement can lead the firm to make decisions contrary to
local moral norms (Greenwood, 2007), thus increasing the risks and costs of CSiR for the
firm.
Third, economic and competitive pressures associated with corrupt business
practices may also result in socially irresponsible behavior. Operating in corrupt
environments adds direct and indirect transaction costs that the firm must contend with
(Rose-Ackerman, 1975; Uhlenbruck, et al., 2006). For example, “companies that are
burdened with ‘under-the-table payments’ will try to contain their costs by cutting
corners” (Nwabuzor, 2005, p. 129). The costs associated with operating in highly corrupt
environments are more uncertain (Cuervo-Cazurra, 2006). This cost uncertainty
contributes to the lower levels of foreign direct investment in countries high in corruption
(Habib & Zurawicki, 2001, 2002).
If a MNE’s competitors utilize corrupt business practices, the MNE may be
influenced to likewise participate in CSiR behavior to maintain its industry
competitiveness (Pinto, Leana, & Pil, 2008). This represents a form of organizational
isomorphism, driving homogeneity of firm behavior, including corruption and associated
irresponsibility (Venard & Hanafi, 2008). Extreme economic and competitive pressures
that threaten the firm’s survival may further increase the likelihood that the firm will
pursue irresponsible actions to remain viable (Campbell, 2007).
Finally, MNEs with a history and culture that accepts and expects regular corrupt
interactions with public officials may find unethical behavior has become instantiated
within the organization. Firms that operate in environments with strong formal
institutional pressures to participate in corruption through bribery, for example, may find
corrupt practices have become rationalized and deeply embedded within the organization

103
103 103
103 1
03 103 103 103
103 103
(Anand, Ashforth, & Joshi, 2004). These MNEs may find themselves susceptible to
lowering their home country standards to meet other local societal norms and pressures,
some of which may represent unethical and socially irresponsible behavior in the eyes of
stakeholders. Institutionalized corruption “can become an integral part of day-to-day
activities to such an extent that individuals may be unable to see the inappropriateness of
their behaviors” (Ashforth & Anand, 2003, p. 4).
This discussion highlights a multitude of reasons why pervasive corruption in a
MNE’s public sector interactions may increase the firm’s likelihood of acting in a
socially irresponsible way. Formal corruption may influence MNEs to lower firm
standards that could prevent CSiR. Also, in distancing themselves from corrupt public
officials, MNE managers may overlook or misunderstand local stakeholder social
responsibility expectations, increasing the risk of committing acts of CSiR. Furthermore,
because of the additional costs of corruption combined with the pressures of having
competitors using corrupt methods may further lead MNEs down the path toward
irresponsibility. And when the corrupt practices dominate the firm’s dealings with public
officials on a consistent basis, the corruption may become embedded in the
organizational culture, generally desensitizing the organization to the ethical implications
of corrupt public sector behavior. For these reasons, firms operating in high FCEs may
find themselves initiating or tolerating more actions that are socially irresponsible. Thus,
I hypothesize:
Hypothesis 1: MNEs operating in location portfolios containing higher formal
corruption environments on average have higher levels of CSiR.

104
104 104
104 1
04 104 104 104
104 104
Informal Corruption Environments and Firm Social Irresponsibility
Like other aspects of the institutional environment, corruption also has an
informal component. Informal corruption extends beyond the corrupt practices within the
formal, state-driven institutions of the countries with which corporations may interact.
Corruption may also be found in varying extents within the everyday experiences of the
average individual citizen of a society (Riaño, Heinrich, & Hodess, 2010). Some
environments have a stronger overall culture of corruption that permeates the everyday
life of its members. I refer to the socio-cultural nature of corruption as the informal
corruption environment (ICE).
Sociology recognizes that the essence of corruption is found in its social and
cultural foundations (Luo, 2005). “Social structures inhibit, enable, and stimulate people
to commit corruption, and may even force people into corruption” (Nieuwenboer &
Kaptein, 2008, p. 134). A history of broadly-based corrupt practices may result in a
higher overall penetration of corruption within the country’s collective experience. This
corruption may span beyond interactions within formal governmental bodies and be
found in private sector businesses, educational systems, the media, religious groups, non-
governmental agencies, as well as personal exchanges.
In countries with a higher ICE, corruption may become expected not only in the
formal interactions with public officials and governmental processes, but also in the
society’s informal interactions as well. This is important to MNEs because firms’ local
interactions are not limited to only formal institutional actors such as governmental
agents. Firms also interact with the general public within the countries in which they
operate, such as in their dealings with local employees, customers, suppliers, etc.
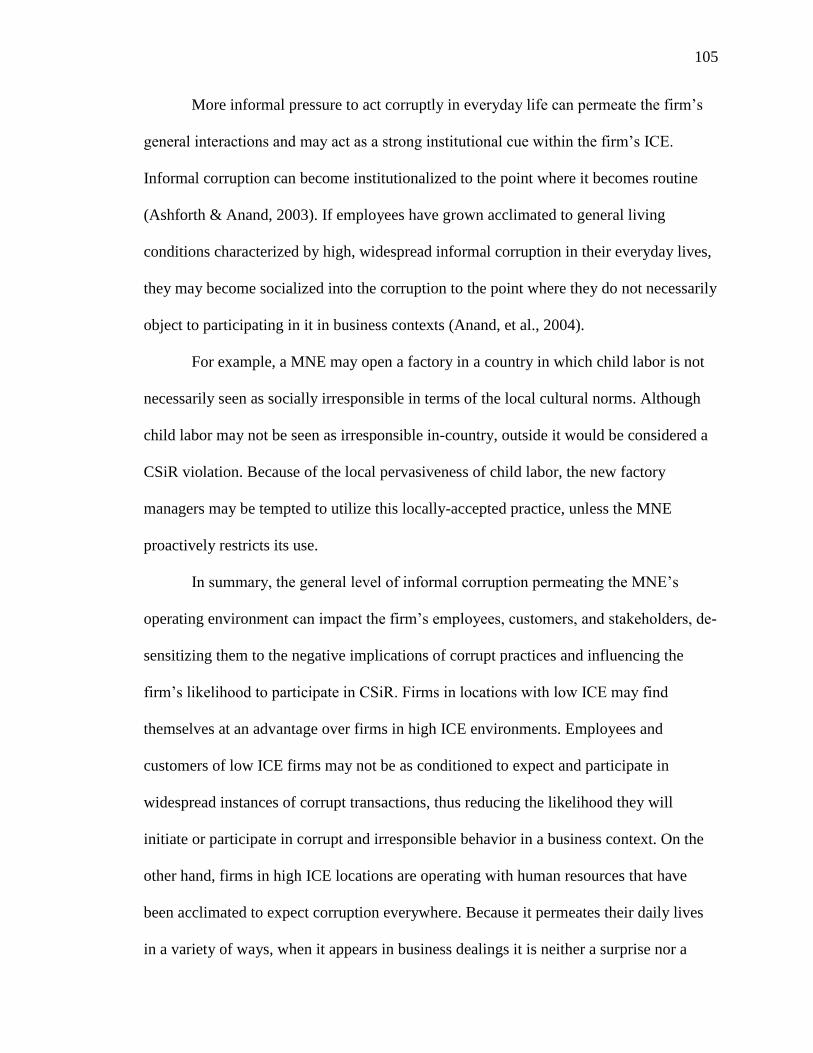
105
105 105
105 1
05 105 105 105
105 105
More informal pressure to act corruptly in everyday life can permeate the firm’s
general interactions and may act as a strong institutional cue within the firm’s ICE.
Informal corruption can become institutionalized to the point where it becomes routine
(Ashforth & Anand, 2003). If employees have grown acclimated to general living
conditions characterized by high, widespread informal corruption in their everyday lives,
they may become socialized into the corruption to the point where they do not necessarily
object to participating in it in business contexts (Anand, et al., 2004).
For example, a MNE may open a factory in a country in which child labor is not
necessarily seen as socially irresponsible in terms of the local cultural norms. Although
child labor may not be seen as irresponsible in-country, outside it would be considered a
CSiR violation. Because of the local pervasiveness of child labor, the new factory
managers may be tempted to utilize this locally-accepted practice, unless the MNE
proactively restricts its use.
In summary, the general level of informal corruption permeating the MNE’s
operating environment can impact the firm’s employees, customers, and stakeholders, de-
sensitizing them to the negative implications of corrupt practices and influencing the
firm’s likelihood to participate in CSiR. Firms in locations with low ICE may find
themselves at an advantage over firms in high ICE environments. Employees and
customers of low ICE firms may not be as conditioned to expect and participate in
widespread instances of corrupt transactions, thus reducing the likelihood they will
initiate or participate in corrupt and irresponsible behavior in a business context. On the
other hand, firms in high ICE locations are operating with human resources that have
been acclimated to expect corruption everywhere. Because it permeates their daily lives
in a variety of ways, when it appears in business dealings it is neither a surprise nor a
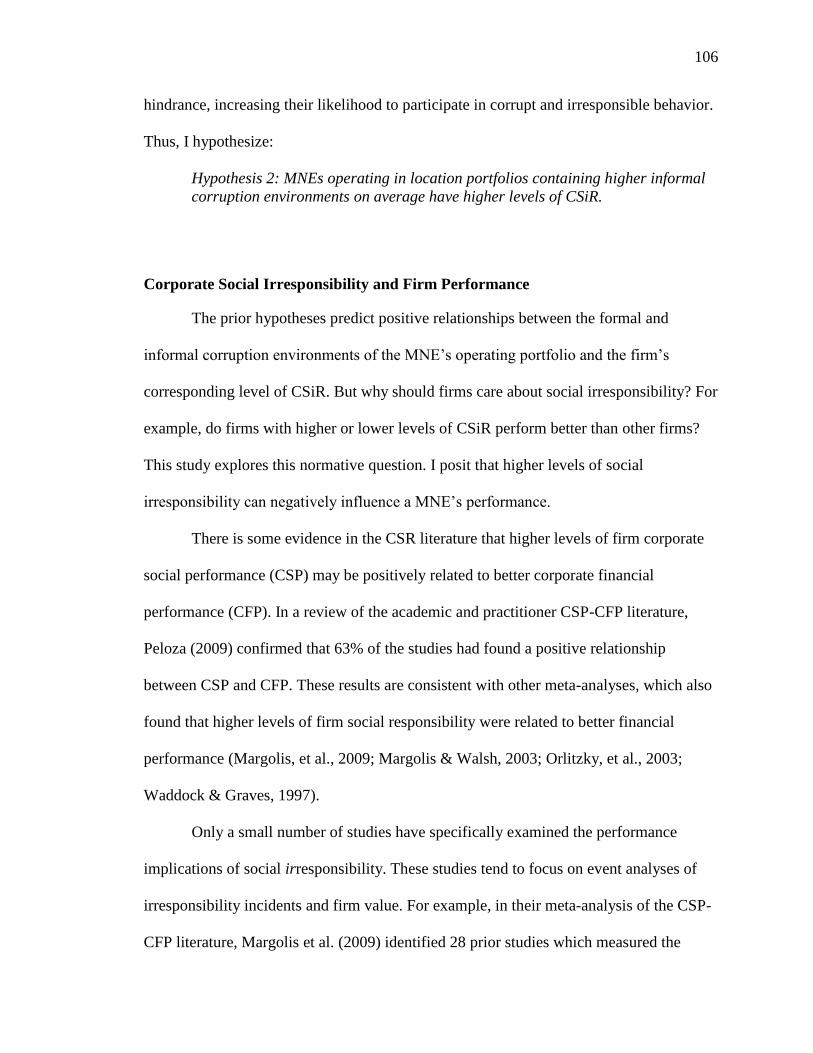
106
106 106
106 1
06 106 106 106
106 106
hindrance, increasing their likelihood to participate in corrupt and irresponsible behavior.
Thus, I hypothesize:
Hypothesis 2: MNEs operating in location portfolios containing higher informal
corruption environments on average have higher levels of CSiR.
Corporate Social Irresponsibility and Firm Performance
The prior hypotheses predict positive relationships between the formal and
informal corruption environments of the MNE’s operating portfolio and the firm’s
corresponding level of CSiR. But why should firms care about social irresponsibility? For
example, do firms with higher or lower levels of CSiR perform better than other firms?
This study explores this normative question. I posit that higher levels of social
irresponsibility can negatively influence a MNE’s performance.
There is some evidence in the CSR literature that higher levels of firm corporate
social performance (CSP) may be positively related to better corporate financial
performance (CFP). In a review of the academic and practitioner CSP-CFP literature,
Peloza (2009) confirmed that 63% of the studies had found a positive relationship
between CSP and CFP. These results are consistent with other meta-analyses, which also
found that higher levels of firm social responsibility were related to better financial
performance (Margolis, et al., 2009; Margolis & Walsh, 2003; Orlitzky, et al., 2003;
Waddock & Graves, 1997).
Only a small number of studies have specifically examined the performance
implications of social irresponsibility. These studies tend to focus on event analyses of
irresponsibility incidents and firm value. For example, in their meta-analysis of the CSP-
CFP literature, Margolis et al. (2009) identified 28 prior studies which measured the

107
107 107
107 1
07 107 107 107
107 107
stock market impacts associated with the public announcement of specific social
irresponsibility incidents, what they termed ‘revealed misdeeds’, such as regulatory
violations, fines, lawsuits, arrests, involuntary recalls, etc. Their findings confirmed that
news of irresponsibility has a negative effect on firm value.
Similar findings were confirmed previously by Frooman (1997) in his meta-
analysis of irresponsibility event studies. Reports of socially irresponsible events or illicit
corporate behavior resulted in decreases in shareholder wealth. Frooman points out that
while his analysis cannot necessarily confirm why this dynamic occurs (is a penalty being
imposed on ethical or more economic grounds?), it does reveal that the market reacts
negatively to CSiR.
Additionally, there is evidence that the negative impacts of irresponsibility can be
stronger than any positive impacts of responsible behavior. Doh et al. (2010) found some
initial empirical support for this notion when examining the stock price impacts
associated with firm additions and removals from social responsibility stock indexes.
Removal acts as a signal of corporate irresponsibility and is associated with a greater
(negative) effect on shareholder wealth than any corresponding effects related to being
added to an index. Thus, past CSiR studies tend to find that “doing bad, if discovered, has
a more pronounced effect on financial performance than doing good” (Margolis, et al.,
2009, p. 23).
In addition to the signaling or disclosure arguments, I suggest there may be other
reasons that firms high in CSiR will perform poorly. First, social irresponsibility can add
risks and costs that may negatively affect the firm’s performance. Acting irresponsibly in
conflict with stakeholders’ CSR expectations, such as violating particular environmental
or human rights standards, may expose the firm to risks and costs associated with civil

108
108 108
108 1
08 108 108 108
108 108
lawsuits and criminal litigation (deMaCarty, 2009). A well-publicized track record of
irresponsibility may prevent the firm from obtaining capital at consistent rates (McGuire,
Sundgren, & Schneeweis, 1988). Or firms may face large-scale consumer boycotts due to
CSiR which negatively affect the firm’s brand reputation and sales (Becker-Olsen,
Cudmore, & Hill, 2006).
Much of the activity driving these additional costs is often spurred by private
political pressure exerted by non-governmental organizations (NGOs), the rise of which
is “one of the most significant developments in international affairs over the past 20
years” (Doh & Guay, 2006, p. 51). Consumer watchdog organizations may utilize a
“name-and-shame” strategy to publicize incidents of corporate irresponsibility (Becker-
Olsen, et al., 2006), a NGO tactic that was used to effectively to advance the anti-
sweatshop movement in the 1990’s (Bartley & Child, 2010). This risk may be
particularly pertinent to larger firms, whose higher profile makes them a more likely
target of NGO action (Godfrey, et al., 2009). Once the firm’s perceived CSiR has been
exposed in this fashion, the firm may need to address the harm that has been caused to
their stakeholders (Campbell, 2007), increasing their costs and subsequently reducing
performance.
Second, irresponsible behavior may also open the firm up to increased likelihood
of governmental regulatory intervention to which the firm will have to respond (Orlitzky
& Benjamin, 2001). Just as the private political pressure exerted by NGOs highlight
corporate irresponsibility, governments may likewise exert public political pressure to
force the corporation to address irresponsible behavior (Reid & Toffel, 2009). This may
involve fines or other regulatory actions. For example, “if a firm fails to meet promises to
government officials in regard to actions that affect the environment (dumping, etc.),

109
109 109
109 1
09 109 109 109
109 109
government agencies may find it necessary to pass more stringent regulations…to force
the firm to act in a socially responsible manner” (McGuire, et al., 1988, p. 856).
Regulatory or legislative risks may also be embedded in other NGO actions. For
example, citing shareholder resolutions at Hartford Financial Services Group and CVS
Caremark Corporation, Reid and Toffel (2009) point out that it is not uncommon for
shareholder resolutions to include implicit or explicit regulatory threats as a means to
motivate corporate compliance with activist causes. Irresponsible firms may be left to
face the additional expense of implementing costly changes to correct their irresponsible
practices or potentially paying government-imposed fines and penalties associated with
non-compliance.
Third, after a high-profile irresponsible event or after earning a reputation for
irresponsibility (such as having the irresponsible behavior called out by a third-party
social responsibility rating agency or index), stakeholders may lose trust in the firm. A
lack of trust can degrade stakeholders’ commitment to the firm, damaging sales (Berman,
Wicks, Kotha, & Jones, 1999) .
Not only does firm performance suffer from this decrease in sales, but the firm
may also need to expend additional resources and incur additional costs to enhance the
firm’s social responsibility image and reputation and to address and prevent recurrence of
the irresponsible behavior (Arjoon, 2005). For example, firms may utilize resources to
make new investments in corporate governance in the “hope that corporate governance
will restore trust in business” (Rossouw, 2005, p. 37).
A case in point can be seen when Shell Oil radically changed its approach to
corporate governance following a very public and negative Greenpeace campaign against
announcing a plan to dump its Brent Spar offshore oil rig into the North Sea in 1995, an

110
110 110
110 1
10 110 110 110
110 110
action that was deemed as environmentally irresponsible by the activists (Backer, 2007).
But these reactive measures to re-establish a socially responsible reputation with
stakeholders are not without incremental cost to the firm.
Finally, irresponsible behavior can affect the firm’s legitimacy with key
stakeholders. Social responsibility can be used strategically to achieve legitimacy,
effectively becoming a foundation of the firm’s social license to operate (Chiu &
Sharfman, 2011). Violations of social responsibility legitimacy threaten this license to
operate or even potentially the firm’s long-term survival (Bansal & Roth, 2000).
The legitimacy argument can also be extended to an internal stakeholder group,
the firm’s employees. “Organizations’ socially responsible or irresponsible acts are of
serious consequence to employees” (Aguilera, Rupp, Williams, & Ganapathi, 2007, p.
843). Destroying goodwill and legitimacy through CSiR can lead to difficulties in
attracting and retaining the best employees, leading to a cycle of service degradation
which can ultimately impact performance (deMaCarty, 2009). These dynamics all
reinforce the importance of establishing and maintaining legitimacy with external and
internal stakeholders and highlight the potential performance consequences of losing
legitimacy through social irresponsibility.
In summary, I propose that just as firms are rewarded for their CSR, they may be
penalized for CSiR. Not only can irresponsible behavior add risks and costs associated
with dealing with NGO anti-irresponsibility activism, but firms may also face costly
exposure to regulatory threats and governmental actions related to their CSiR. Reacting
to incidents and patterns of CSiR can drain precious firm resources that could be invested
elsewhere. Finally, a pattern of irresponsibility can put the firm’s “license to operate” at
risk and may damage the firms’ legitimacy in the eyes of its key stakeholders, reducing

111
111 111
111 1
11 111 111 111
111 111
the firm’s financial viability. For the above reasons firms with higher CSiR do not
perform as well as firms that do not have to contend with social irresponsibility:
Hypothesis 3: MNEs with higher levels of social irresponsibility on average have
lower performance than MNEs with lower levels of social irresponsibility.
METHODOLOGY
Sample Selection
Secondary data were used to test the hypotheses in a multinational context. The
sample frame for this study was the Kinder, Lydenberg, Domini Research & Analytics
(KLD, now part of MSCI Inc.) social responsibility rating data. KLD publishes a series
of binary strength and weakness indicators in a variety of CSR categories and is
considered a defacto standard for social responsibility research (Hart & Sharfman, 2012;
Mattingly & Berman, 2006; Wood, 2010). Because KLD reports both firm social
responsibility strengths and weaknesses (concerns) separately (as opposed to only
providing a “net” continuous variable rating reflecting “overall” firm social
responsibility), it has been used in prior studies to investigate social irresponsibility
(Doh, et al., 2010; Mattingly & Berman, 2006; Muller & Kräussl, 2011; Strike, et al.,
2006).
An initial sample of 700 firms was randomly selected from the 2011 KLD social
responsibility ratings dataset. The target sample size of 700 was calculated based on the
total number of individual items that are modeled in the analysis and the recommended
desirable (high-end) observation to variable ratio of 20:1 (Hair, Black, Babin, &
Anderson, 2010, p. 176). Only one firm in the initial sample had to be dropped per lack
of available subsidiary data, and the final sample size of 699 firms was retained for the

112
112 112
112 1
12 112 112 112
112 112
analysis. The final sample was comprised of a total of 72,635 firm-location
observations.
Dependent Variable
Following other social responsibility studies, both operating performance and firm
value were used to measure the dependent variable in this study, firm performance
(Margolis & Walsh, 2003). Operating performance was measured via two commonly-
used performance measures. The first performance measure was Return on assets
(ROA), the ratio of net income to total assets. This accounting-based indicator has been
found to most closely correlate with social performance in prior social responsibility
research (Orlitzky, et al., 2003). Performance was also measured via Tobin’s q, a
forward-looking market-based indicator of firm value that incorporates firm equity, as
well as preferred stock and debt and reflects the intangible value investors assign to a
company (Guenster, Bauer, Derwall, & Koedijk, 2011). Market-based approaches are the
most commonly used method of measuring financial performance in social responsibility
research (Peloza, 2009).
Endogenous Variable
CSiR is both a dependent and independent (endogenous) variable in this research
model. Prior empirical research has tended to use one of two different methods to
measure firm social irresponsibility: 1) occurrences of negative social responsibility-
related actions or events; or 2) third-party ratings of firm irresponsibility levels. The first
method is typically used in event analyses that are focused on examining a performance

113
113 113
113 1
13 113 113 113
113 113
impact in the aftermath of a specific CSiR-related incident (Chatterji & Toffel, 2010;
Frooman, 1997).
However, in this study I am interested in a firm’s overall pattern of socially
irresponsible behavior, as opposed to analyzing the occurrence or impact of particular
irresponsibility events. For this reason, I selected the second CSiR measurement method
mentioned above, aggregating irresponsibility rating data available in the KLD dataset.
The KLD data is widely used in general social responsibility research, and its construct
validity as a measure has been confirmed (Mattingly & Berman, 2006; Sharfman, 1996).
KLD is also the primary data source of choice in the majority of studies that specifically
examine social irresponsibility (Doh, et al., 2010; Mattingly & Berman, 2006; McGuire,
et al., 2003; Muller & Kräussl, 2011; Strike, et al., 2006).
One reason for the popular use of KLD to measure CSiR is because KLD
publishes discrete ratings of both firms’ “good” CSR (‘strengths’) and “bad” CSiR
(‘concerns’) in a variety of social responsibility categories, including environment,
community, human rights, employee relations, diversity, and product. KLD’s separate
consideration of strengths and concerns enables researchers to focus on one or both of
these social responsibility dimensions, depending on the research model.
Therefore, each firm’s CSiR in this study was calculated via the identical
technique and data source used in prior studies (Chatterji & Toffel, 2010; Doh, et al.,
2010; Mattingly & Berman, 2006; McGuire, et al., 2003; Muller & Kräussl, 2011;
Strike, et al., 2006). To calculate each firm’s overall CSiR score I summed binary
concerns indicators in the KLD dataset for each firm. The specific irresponsibility items
included in this study are summarized in Table 3.1. This summation of concerns

114
114 114
114 1
14 114 114 114
114 114
resulted in a single interval measure of social irresponsibility for each firm, where zero
represents no CSiR, and higher numbers indicate higher levels of CSiR.
TABLE 3.1. KLD social irresponsibility weakness items representing firm CSiR
Category Weakness Category Weakness
Environment Regulatory problems Employee
relations
Union relations
Substantial emissions Health & safety concerns
Climate change Supply chain controversies
Negative product impact Labor-management relations
Land use & biodiversity Diversity Workforce diversity issues
Non-carbon emissions Representation
Other env’l concern Board of directors diversity
Community Community impact Product Product safety
Human rights Burma concern Marketing/contracting issue
Sudan concern Antitrust
Other concern Other product concern
Independent Variables
The formal and informal corruption environment independent variables were
measured at the portfolio level, adapting a portfolio measurement technique used in prior
international business studies (Chao & Kumar, 2010; Gomez-Mejia, Makri, & Kintana,
2010; Gomez-Mejia & Palich, 1997; Kim & Park, 2002; Nachum & Song, 2011; Zaheer
& Hernandez, 2011). Portfolio-level measurements were calculated by averaging country
attributes for each MNE headquarters and subsidiary location. This resulted in a weighted
average value for each firm, weighted by the number of locations the MNE has in each

115
115 115
115 1
15 115 115 115
115 115
country. This same technique was used to calculate both the MNE portfolio formal
corruption environment and informal corruption environment values.
Portfolio informal corruption environment (ICE): The ICE reflects the degree of
general permeation of corruption into a society’s culture and everyday life. The ICE
reflects the everyday citizen’s general impressions and experiences at an individual, not
necessarily government-corporate, level. Thus, the ICE is measured using general public
views of corruption, as opposed to international business people and country expert
opinions.
This informal, socio-cultural dimension of corruption is rarely included as a
distinct corruption measure. One reason for this is that a lack of cross-national measures
that reflect this deeper cultural penetration of corruption beyond public sector interactions
has hampered empirical investigations in this area (You & Khagram, 2005). Despite the
relative scarcity of studies incorporating informal corruption measures, one method of
measuring informal corruption levels can be found in the Transparency International
Global Corruption Barometer (GCB) dataset1. Based on interviews with more than
91,500 people in 86 countries, the GCB reflects the general public’s perception of the
permeation of corruption across a variety of institutions in their country (Riaño, et al.,
2010).
1 The World Values Survey (WVS) was also considered as an alternative measure of informal corruption in
this study. The WVS contains items that capture the degree to which the general public feels a variety of
potentially unethical behaviors are justifiable, such as cheating on taxes, not paying a bus or train fare, and
accepting a bribe, that could also be considered indicators of informal corruption pervasiveness. Two
reasons led to the selection of the GCB over WVS. First, GCB’s coverage of countries relevant to this
study was superior to WVS’. WVS was missing data for the specific items of interest in several countries
including Denmark, Ireland, and Austria. Additionally, the WVS is conducted in waves that survey
different countries at different points in time over a 25+ year time period. Because all of other data
elements in this study represent a particular point in time (2009-11), the GCB was considered more
comparable to the measurement model and was selected over the WVS.

116
116 116
116 1
16 116 116 116
116 116
As summarized in Table 3.2, the GCB uses a 5-point Likert-style scale where 1
means not at all corrupt and 5 means extremely corrupt to measure the extent to which
citizens perceive corruption affects eleven different institutional elements in their
country.
TABLE 3.2 Perceptual informal corruption items on Global Corruption Barometer
To what extent do you perceive the following categories in this
country to be affected by corruption on a scale from 1 to 5
(1 meaning not at all corrupt and 5 meaning extremely corrupt):
Political parties
Parliament/legislature
Police
Business/private sector
Public officials/civil servants
Judiciary
NGOs (non-governmental organizations)
Media
Religious bodies
Military
Education system
Although the questions on the GCB are primarily based on public sector (formal)
institutions, the measures themselves can be considered to reflect the informal dimension
of corruption because the respondents who are answering the question represent the
general population and average citizens. In contrast to other measures that focus on
corruption practices in the formal sector, the GCB is not designed to reflect expert
opinions on government-corporate corruption levels, but rather the average citizen’s
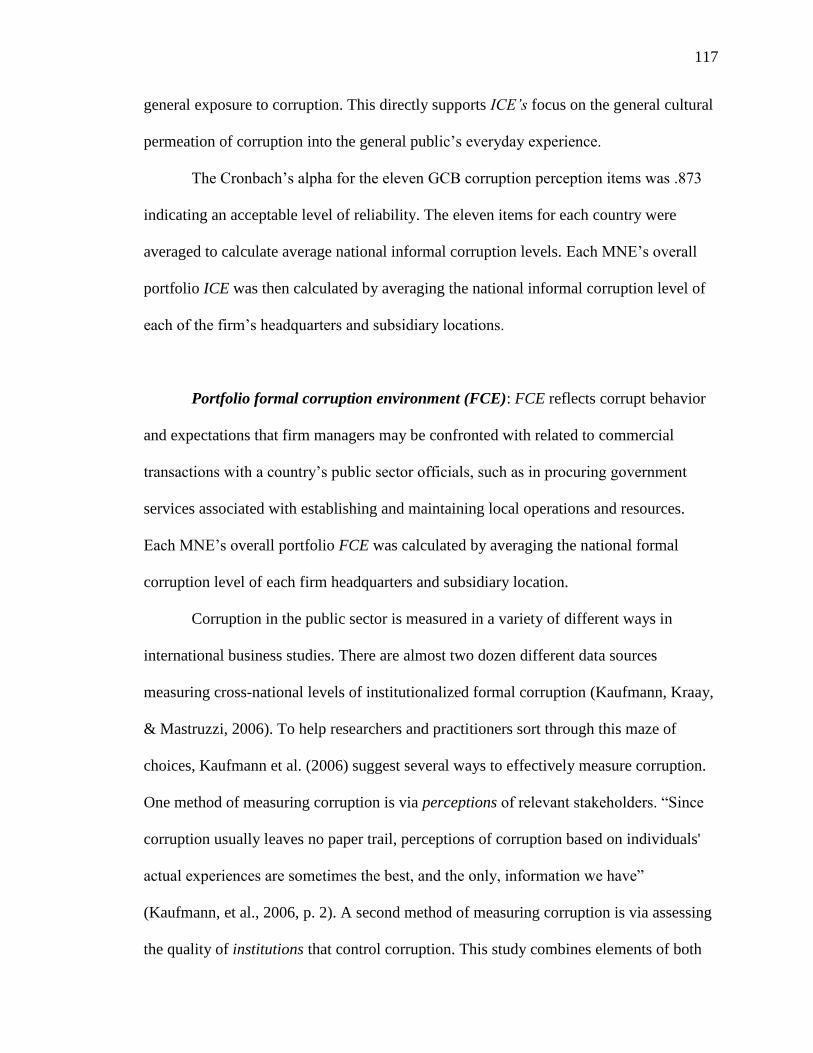
117
117 117
117 1
17 117 117 117
117 117
general exposure to corruption. This directly supports ICE’s focus on the general cultural
permeation of corruption into the general public’s everyday experience.
The Cronbach’s alpha for the eleven GCB corruption perception items was .873
indicating an acceptable level of reliability. The eleven items for each country were
averaged to calculate average national informal corruption levels. Each MNE’s overall
portfolio ICE was then calculated by averaging the national informal corruption level of
each of the firm’s headquarters and subsidiary locations.
Portfolio formal corruption environment (FCE): FCE reflects corrupt behavior
and expectations that firm managers may be confronted with related to commercial
transactions with a country’s public sector officials, such as in procuring government
services associated with establishing and maintaining local operations and resources.
Each MNE’s overall portfolio FCE was calculated by averaging the national formal
corruption level of each firm headquarters and subsidiary location.
Corruption in the public sector is measured in a variety of different ways in
international business studies. There are almost two dozen different data sources
measuring cross-national levels of institutionalized formal corruption (Kaufmann, Kraay,
& Mastruzzi, 2006). To help researchers and practitioners sort through this maze of
choices, Kaufmann et al. (2006) suggest several ways to effectively measure corruption.
One method of measuring corruption is via perceptions of relevant stakeholders. “Since
corruption usually leaves no paper trail, perceptions of corruption based on individuals'
actual experiences are sometimes the best, and the only, information we have”
(Kaufmann, et al., 2006, p. 2). A second method of measuring corruption is via assessing
the quality of institutions that control corruption. This study combines elements of both

118
118 118
118 1
18 118 118 118
118 118
of these approaches, perceptual and institutional, to create a single robust measure of
each country’s formal corruption levels that was used to calculate each firm’s portfolio
FCE. The selection of the specific perceptual and institutional elements to support this
multi-dimensional measure of formal corruption is explained below.
The perceptual aspect of my formal corruption measure was determined via
Transparency International’s 2010 Corruption Perception Index (CPI). The CPI
aggregates expert and business opinion survey results to reflect the level of administrative
and political corruption in 178 different countries. CPI scores are assigned based on a 10-
point interval scale where 0 indicates a highly corrupt government and a 10 indicates low
levels of public sector corruption.
The CPI is selected over other cross-national corruption perceptions such as the
Freedom House political rights index, Political Risk Service’s International Country Risk
Guide index of corruption, or the Black Market Activity Index, because of the CPI’s
more pervasive use in the international business literature. The CPI has been recognized
as being used most extensively to measure formal corruption in cross-national research
(Brouthers, Gao, & McNicol, 2008; Habib & Zurawicki, 2001; Voyer & Beamish, 2004;
Weitzel & Berns, 2006; You & Khagram, 2005). It has been found to be a robust measure
of corruption (Husted, 1999) with confirmed construct validity (Voyer & Beamish, 2004;
Wilhelm, 2002), making it an appropriate selection for the perceptive dimension of
formal corruption in this international business study.
Transparency International codes its raw CPI data in such a way that a lower CPI
score actually reflects a higher level of corruption. To aid in interpretation and remain
consistent with prior corruption studies (Davis & Ruhe, 2003; Kwok & Tadesse, 2006;
Robertson & Watson, 2004), country CPI scores were reverse coded and rescaled by

119
119 119
119 1
19 119 119 119
119 119
multiplying each country’s score by -1 (to reverse code) and adding +10 to each (to
create a positive range) before being incorporated into my formal corruption measure.
This produces a more consistent transformed CPI scale where 10 indicates high
administrative and political corruption and 0 indicates low levels of administrative and
political corruption.
Following Kaufmann (2006), the second aspect of my formal corruption variable
incorporates measurements of key institutional influences that are directly related to the
control of corruption. These items “do not measure actual corruption, but can provide
useful indications of the possibility of corruption” (Kaufmann, et al., 2006, p. 2).
Countries that implement and enforce more stringent anti-corruption regulatory controls
can limit the incentives and opportunities for corrupt behavior, curtailing the levels of
formal sector corruption.
I incorporated the influence of formal corruption-constraining institutions via the
2010 World Bank Worldwide Governance Indicators (WGI), which are available for over
200 countries and subsequently widely applied in international business research
(Cuervo-Cazurra, 2006). These indicators represent the aggregation of hundreds of
governance data variables from 31 different data sources (Kaufmann, Kraay, &
Mastruzzi, 2009, 2010). Cuervo-Cazurra (2006) points out that because the WGI data
aggregation is accomplished via a precision-weighted, unobserved components model,
the noise of single indicators is reduced, further enhancing the indicators’ value as
composite measures of institutional governance.
Three WGI indicators that specifically focus on governance practices most
relevant to corruption were used as part of the formal corruption measurement in this
study. First, the WGI control of corruption (CC) indicator speaks directly to the issue of

120
120 120
120 1
20 120 120 120
120 120
public sector corruption and reflects incentives or disincentives for corrupt practices to
flourish in the country. Second, the WGI government effectiveness (GE) indicator reflects
the independence of public services from political pressures as well as the credibility of
the government’s commitment to stated policies, what has been called its “unbribe-
ability,”(Langbein & Knack, 2008, p. 5). Finally, WGI’s regulatory quality (RQ)
indicator assesses whether barriers in public-private transactions have been erected that
enable corrupt practices to occur or whether the regulatory environment fosters healthy
private sector growth.
Each of the WGI indicators range from -2.5 to +2.5, where -2.5 indicates weak
governance and +2.5 indicates a strong control. This results in the situation where higher
raw WGI values reflect stronger country institutional controls, which in turn reflect an
environment where less corruption would be expected. To maintain consistency and
eliminate potential confusion, a reverse code/rescale transformation similar to that
applied to the CPI was applied to the WGI values. WGI indicators were transformed by
multiplying each by -1 (to reverse code) and adding 2.5 to each (to rescale into a non-
negative range) before being incorporated into the formal corruption measure. The
resulting transformed scale ranges from 0 to 5, where 0 indicates an environment with
fewer opportunities for formal corruption because of the high governance controls, and 5
indicates a high likelihood of formal corruption because of the lack of controls.
The single perceptual corruption item (CPI) and the three institutional corruption
items (WGI CC, GE, and RQ) were used to calculate an overall level of formal
corruption for each country. Because these elements are conceptually very close to each
other (Langbein & Knack, 2008), there was high correlation expected and confirmed

121
121 121
121 1
21 121 121 121
121 121
amongst the four formal corruption components. Therefore, I used factor analysis to
create and confirm the validity of a single formal corruption level factor for each country.
Exploratory factor analysis (EFA) was used to create the FCE formal corruption
factor. To show that FCE is measuring a phenomenon that is distinct from the ICE
informal corruption variable, I incorporated the four formal corruption environment
variables as well as the informal corruption perception variable into a single EFA.
Variables were standardized prior to factor analysis. The results of the EFA are
summarized in Table 3.3.
The EFA results yielded the expected two factor solution where the four formal
corruption items loaded on one factor, and the informal corruption variable loaded on its
own factor. Varimax rotation confirmed all four FCE items (CPI, WGI GE, WGI RQ,
and WGI CC) loaded on a single factor as expected, and the ICE item (GCB) loaded on a
second factor. The EFA produced an eigenvalue = 3.953 explaining 98.87% of the
variance and a significant Bartlett’s test of sphericity (p < .001). The Kaiser-Meyer-Olkin
Measure of Sampling Adequacy (MSA) exceeded the required .50 threshold (.659), and
all communalities met the recommended .50 rule-of-thumb. The Cronbach’s alpha for the
four FCE items was .993, suggesting an acceptable level of reliability, and the
Cronbach’s alpha was not improved by the removal of any of the items. All item-to-total
correlations exceeded the minimum .50 level, and inter-item correlations exceeded the
recommended .30 threshold. Thus, the EFA results support the use of the FCE factor to
represent portfolio formal corruption environment in the regression analyses.

122
122 122
122 1
22 122 122 122
122 122
TABLE 3.3. Exploratory factor analysis formal corruption environment (FCE)
Variable Factor 1 Factor 2
CPI – Corruption Perception Index (formal) .994 -.045
WGI GE – Government effectiveness (formal) .983 -.128
WGI RQ – Regulatory quality (formal) .977 -.161
WGI CC – Control of corruption (formal) .995 .024
GCB – Global Corruption Barometer (informal) -.074 .997
Control Variables
Prior studies have found firm size to be a strong predictor of social responsibility
and irresponsibility (Johnson & Greening, 1999; Strike, et al., 2006; Udayasankar, 2008).
Therefore, this study controlled for Firm size, measured via the log of the number of
employees. Following Barnea and Rubin (2010), Firm experience was measured by the
number of years since the firm’s founding.
Prior social responsibility research has also found that degree of international
diversification may influence MNE CSiR (Strike, et al., 2006). Therefore, I included two
variables to control for the scope of the firm’s international activities from the prior CSiR
research. First, I controlled for the count of the distinct Number of countries within
which the firm is operating (headquarters or subsidiary locations). The firm’s
international scope was also measured by counting the number of Foreign subsidiaries
within the MNE’s operations. Additionally, because social responsibility standards vary
between different countries (Maignan & Ralston, 2002), a firm’s home country CSR
standards may influence whether or not the firm participates in irresponsible behavior.
Therefore, I included a dummy variable in my CSiR analysis to control for differences in

123
123 123
123 1
23 123 123 123
123 123
firm headquarters country. Because 85% of the sample frame firms are headquartered in
the U.S., I coded the dummy variable Home country as a 0 if the firm is U.S.-based and a
1 if the firm is headquartered in any other country.
Because there are indications in the social responsibility literature that the
strength of firm corporate social responsibility (CSR) is related to firm corporate
financial performance (Margolis, et al., 2009; Margolis & Walsh, 2003; Orlitzky, et al.,
2003; Peloza, 2009), I also controlled for firm CSR in my evaluation of the CSiR-
performance relationship. Consistent with prior social responsibility studies (Chatterji &
Toffel, 2010; Doh, et al., 2010; Mattingly & Berman, 2006; McGuire, et al., 2003; Muller
& Kräussl, 2011; Strike, et al., 2006), firm CSR values were calculated by summing 30
binary strengths indicators in the 2011 KLD dataset indicated in Table 3.4 for each firm.
This summation results in a single interval measure of CSR for each firm, represented by
a range of possible values from 0 to 30, where a higher number indicates higher levels of
firm social responsibility.
Prior comparative analysis in an international setting has indicated that industry
norms may affect firm social responsibility strategies (Aguilera, Williams, Conley, &
Rupp, 2006). Therefore, following Klapper and Love (2004) I controlled for industry in
my analysis of firm performance. Utilizing Standard & Poor’s (S&P) Capital IQ’s
industry sectors, Industry dummy variables were coded for the following sectors:
consumer discretionary, consumer staples, energy, financials, healthcare, industrials,
information technology, materials, telecommunication services, and utilities.

124
124 124
124 1
24 124 124 124
124 124
TABLE 3.4. KLD social responsibility strength items representing firm CSR
Category Strength Category Strength
Environment Beneficial products Employee
relations
Union relations
Pollution prevention Cash profit sharing
Recycling Employee involvement
Clean energy Health and safety
Management systems Supply chain policies/pgms
Other env’l strengths Other benefits & programs
Community Charitable giving Diversity Representation
Innovative giving Board of Directors
Community engagement Work/life benefits
Other comm strengths Women & minority
Human rights Indigenous relations Gay & lesbian policies
Human rights initiatives Employs underrepresented
Product Product quality Other diversity strengths
Benefits to disadvantaged Governance Reporting quality
Access to capital Public policy
Additionally, following other CSP-CFP research (Jo & Harjoto, 2011) firm
Leverage, a ratio of firm debt to equity, was also included as a control in my performance
analysis. Data for all control variables with the exception of the CSR variable were
obtained from the S&P Capital IQ database. All variable definitions and data sources are
summarized in Table 3.5.

125
125 125
125 1
25 125 125 125
125 125
TABLE 3.5. Variables, measures, and sources of data
Variable Measure Source
Variables
of interest
CSiR Continuous variable measuring the degree of
firm irresponsibility, from 0 (low) to 22 (high)
2011 KLD CSiR
weakness indicators
ROA (%) Accounting-based measure of operating
performance; ratio of income to assets
S&P Capital IQ
Tobin’s q Market-based measure of firm value; market-
to-book ratio incorporating equity, preferred
stock, and debt
S&P Capital IQ
Informal
Corruption
Environment ICE)
Measure of the permeation of corruption in the
everyday lives of the general public in the
countries that comprise the MNE portfolio
2010 TI Global
Corruption
Barometer
Variables
that
comprise
FCE
factor
Control of
corruption (CC)
Indicator of extent to which public power
exercised for private gain is controlled in the
countries that comprise the MNE portfolio,
from 0 (strong corruption control) to 5 (weak
corruption controls)
World Bank World
Governance
Indicators 2010
(rescaled)
Regulatory quality
(RQ)
Indicator of extent to which governments
implement sound policies to support private
development in the countries that comprise the
MNE portfolio, from 0 (strong regulatory
quality) to 5 (weak regulatory quality)
World Bank World
Governance
Indicators 2010
(rescaled)
Government
effectiveness (GE)
Indicator of quality of public services and
policies and credibility of government
commitment to such policies in the countries
that comprise the MNE portfolio, from 0
(highly effective) to 5 (low effectiveness)
World Bank World
Governance
Indicators 2010
(rescaled)
Administrative
and political
corruption (CPI)
Indicator of level of public sector corruption in
the countries that comprise the MNE portfolio,
from 1 (very little government corruption) to
10 (very corrupt government)
TI Corruption
Perception Index
2010 (rescaled)
Control
variables
Firm size Natural log of number of employees S&P Capital IQ
Firm experience Age of firm, years since founding S&P Capital IQ
Number countries Indicator of international scope measured by
number of distinct countries in which the firm
has a headquarters &/or subsidiary location(s)
S&P Capital IQ
Foreign
subsidiaries
Indicator of international scope measured by
number of foreign subsidiaries
S&P Capital IQ
Home country Dummy indicator where 0 indicates U.S.-based
firm and 1 indicates HQ in any other country
S&P Capital IQ
CSR Continuous variable measuring degree of firm
social responsibility, from 0 (low) to 30 (high)
2011 KLD CSR
strength indicators
Leverage Ratio of total debt to total equity S&P Capital IQ
Industry Dummy indicators for 7 industry sectors S&P Capital IQ

126
126 126
126 1
26 126 126 126
126 126
RESULTS
Because CSiR is an endogenous variable in this research model, the hypotheses
were tested using two-stage least squares (2SLS) regression. The reasoning for utilizing
this method as opposed to the more commonly applied ordinary least square (OLS)
regression is as follows. One of the underlying assumptions behind OLS regression is
independence of the error terms (Hair, et al., 2010, p. 185). Models with independent
variables that are endogenous, that is variables that are influenced by other variables in
the model, can produce inconsistent and misleading results (Antonakis, Bendahan,
Jacquart, & Lalive, in press). OLS results under conditions of endogeneity can be
susceptible to bad estimates, biased coefficients, and potentially inaccurate interpretations
(Hoetker & Mellewigt, 2009). Missing variables and/or measurement errors in the
dependent variable might result in endogeneity problems and error term correlation
(Shaver, 2005).
Therefore, to minimize the impact of endogeneity on my regression results, I
utilized the 2SLS method in this study. The benefit of 2SLS is that it addresses the
possibility of error correlation, but it “does not preclude the possibility that the errors will
be found not to correlate” (Shaver, 2005, p. 341). Therefore, it represents a cautionary
and proactive method of testing the hypotheses as a system under conditions of probable
endogeneity.
The 2SLS technique was conducted via a system of two regression equations. A
set of Stage 1 equations were used to test Hypotheses 1 and 2, regressing firm CSiR
against the MNE portfolio formal (FCE) and informal corruption environments (ICE),
respectively. Predicted CSiR values were saved from the Stage 1 regression and used as
the independent variable in Stage 2. Using the Predicted CSiR values addresses the

127
127 127
127 1
27 127 127 127
127 127
endogeneity concern because Predicted CSiR values are correlated with the original CSiR
values, but are not correlated with the error terms. The Stage 2 equation of the 2SLS
analysis was used to test Hypothesis 3, regressing firm financial performance (ROA and
Tobin’s q, separately) against the firm’s Predicted CSiR values from Stage 1.
To confirm the methodological selection of 2SLS for this study, I conducted a
Durbin-Wu-Hausman endogeneity test. Durbin-Wu-Hausman tests whether the Stage 2
regression using the (instrumental) Predicted CSiR values saved from Stage 1 and the
Stage 2 regression using the (OLS) actual CSiR values results in a statistically significant
difference between the coefficients for the actual CSiR and Predicted CSiR variables.
Under conditions of endogeneity, the OLS-based estimates will be biased (based on a
correlation between the error terms and the predicted dependent variable that violates the
assumptions for OLS), resulting in a significant difference in the regression results using
2SLS and OLS methods. In this scenario, proceeding with the 2SLS method utilizing the
instrumental (Predicted CSiR) values is preferred. If endogeneity is not indicated, the
OLS- and instrumental-based results will not differ significantly.
Because this study uses two different measures of firm performance, ROA and
Tobin’s q, the Durbin-Wu-Hausman test must be conducted for each dependent variable.
The results of the Durbin-Wu-Hausman test in this study did not indicate a statistically
significant difference between 2SLS and OLS coefficients using ROA as the dependent
variable (t = 1.30). However, the results did find a statistically significant difference
between 2SLS (using the instrumental variable) and OLS for the dependent variable
Tobin’s q (t = 2.34, p < 0.05). Based on the overall test results, the null hypothesis that
CSiR is exogenous was rejected. Because the Tobin’s q test indicated endogeneity and the
ROA test was inconclusive (producing similar results under both OLS and 2SLS), the use

128
128 128
128 1
28 128 128 128
128 128
of the 2SLS technique utilizing the instrumental Predicted CSiR values was confirmed
for use in this study.
The directional hypotheses in this study support the use of one-tailed tests for all
regressions (Cohen & Cohen, 1983). Table 3.6 summarizes the descriptive statistics and
correlations of variables in the study sample. An inspection of the bivariate correlations
confirmed that none of the significant correlations between independent variables
exceeded the 0.70 co-linearity guidelines (Hair, et al., 2010, pp. 204-205). However,
several significant correlations with control variables approached, though did not exceed,
the recommended threshold: Number of countries and Foreign subsidiaries (r = .658);
Number of countries and Portfolio ICE (r = -.628); and CSR and Firm size (r = .595). The
two measures of the dependent variable in this study, ROA and Tobin’s q, were also
relatively highly correlated (r =.568).
Because of the instances of some relatively high bivariate correlations, variance
inflation factor scores (VIFs) from the regression equations were inspected to test for
possible multicollinearity. With all VIFs reported in the Stage 1 regression tests ranging
from 1.108 to 3.273, well within recommended levels (Hair, et al., 2010, pp. 204-205),
there was no indication that multicollinearity is a problem in the Stage 1 model.
Table 3.7 summarizes the regression for Stage 1, containing the results of the four
models used to test the hypothesized relationships between formal and informal
corruption environment and firm social irresponsibility (Hypothesis 1 and 2 respectively).
Model 1 contains only the Stage 1 control variables. The overall control model is
statistically significant (R2 = .256, p = .000). As expected per prior research, controls for
Firm size (B = 1.70, p = .000), Firm age (B = .01, p < .01), and number of Foreign
subsidiaries (B = .004, p < .01) were all confirmed to be significant positive predictors of

129
TABLE 3.6. Description and correlations of variables
Variables 1 2 3 4 5 6 7 8 9 10 11 12
Mean 2.76 3.27 0.00 2.46 7.01 36,767 67.17 18.56 53.92 .09 3.89 .415
Standard deviation 2.314 0.109 1.000 2.417 5.218 96,539 46.921 17.425 84.250 .285 4.555 .858
1. Firm CSiR -
2. Portfolio ICE .068 -
3. Portfolio FCE .059 -.074 -
4. Tobin’s q -.084* -.119** .010 -
5. ROA -.019 -.111** .085* .568** -
6. Firm Size † .483** .043 .018 -.011 .032 -
7. Firm Experience .256** .006 -.024 -.095* -.094* .292** -
8. Number of Countries † .188** -.628** .126** .036 .012 .356** .239** -
9. Foreign Subsidiaries .297** -.352** .088* -.038 -.031 .448** .256** .658** -
10. Home Country -.096* -.168** .269** .069 .027 -.202** -.158** -.132** .019 -
11. Firm CSR .460** -.071 .001 .005 .060 .595** .318** .392** .392** -.183** -
12. Leverage .004 .067 -.007 .520** -.014 .045 .062 -.002 .004 -.052 -.005 -
13. Industry–Consumer Disc .008 .092* -.050 .093* .132** .157** -.060 -.154** -.109** -.020 .003 .038
14. Industry–Cons Staples .123** .019 .137** .039 .072 .104** .153** .041 -.007 -.031 .187** .033
15. Industry–Energy .169** .090* .004 -.059 -.012 -.081* .009 -.045 -.007 .002 -.036 -.026
16. Industry–Financials -.007 .172** -.042 -.077* -.170** .032 .238** -.048 .045 .107** .079* -.036
17. Industry–Healthcare -.128** -.049 -.051 .002 .072 -.005 -.065 .053 .045 -.029 .034 -.021
18. Industry–Industrials .014 -.028 -.036 .000 -.062 .082* .111** .037 .136** -.008 -.112** .090*
19. Industry–Info Tech -.221** -.240** .062 .041 -.032 -.188** -.325** .111** -.057 .048 -.093* -.121**
20. Industry–Materials .103** -.082* .031 -.053 .011 -.099** .081* .064 .010 -.056 -.007 .013
21. Industry–Telco .034 .062 -.053 -.048 -.030 .016 -.059 .013 -.022 .014 .020 .010
22. Industry–Utilities .084* .172** -.028 -.085* -.101** -.047 .025 -.125** -.063 -.049 .047 .027
*p < 0.01, **p < 0.05 (two-tailed tests)
† Statistics represent variable post logarithmic transformation

130 130
130 1
30 130 130 130
130 130
130
TABLE 3.6. Description and correlations of variables (continued)
Variables 13 14 15 16 17 18 19 20 21 22
Mean .19 .07 .06 .08 .09 .19 .20 .08 .01 .02
Standard deviation .389 .263 .243 .276 .289 .391 .398 .274 .106 .154
13. Industry–Consumer Disc -
14. Industry–Cons Staples -.136** -
15. Industry–Energy -.124** -.073 -
16. Industry–Financials -.144** -.085* -.078* -
17. Industry–Healthcare -.152** -.090* -.082* -.095* -
18. Industry–Industrials -.230** -.136** -.124** -.144** -.152** -
19. Industry–Info Tech -.237** -.141** -.129** -.149** -.157** -.238** -
20. Industry–Materials -.142** -.084* -.077* -.090* -.095* -.143** -.148** -
21. Industry–Telco -.051 -.031 -.028 -.032 -.034 -.052 -.053 -.032 -
22. Industry–Utilities -.075* -.045 -.041 -.047 -.050 -.076* -.078* -.047 -.017 -
*p < 0.01, **p < 0.05 (two-tailed tests)

131
CSiR. The Number of countries was also significant (B = -.38, p < .05); however, the
resulting negative coefficient was opposite direction of what has been predicted in prior
CSiR research, where greater international scope was found to be positively related to
CSiR (Strike, et al., 2006). The dummy variable controlling for Home country was not
found to be significant (B = -.05, n.s.)
TABLE 3.7. Regression results for Stage 1 (Hypotheses 1 and 2)
Variables Model 1
Controls
Model 2
FCE
Model 3
ICE
Model 4
Model 2 + ICE
Intercept -4.49
(.65)
-4.38
(.66)
-11.52
(3.38)
-10.84
(3.41)
Firm Size 1.70***
(.16)
1.69***
(.16)
1.60***
(.16)
1.60***
(.16)
Firm Experience (Age) .01***
(.002)
.01***
(.002)
.01***
(.002)
.01***
(.002)
Number of Countries -.38**
(.23)
-.44**
(.23)
.03
(.30)
-.06
(.30)
Number Foreign Subsidiaries .004***
(.001)
.004***
(.001)
.003***
(.001)
.004***
(.001)
Home Country Dummy -.05
(.28)
-.19
(.29)
.13
(.29)
-.02
(.31)
Portfolio FCE -
.14**
(.08)
- .12*
(.08)
Portfolio ICE -
- 2.15**
(1.01)
1.97**
(1.02)
R-square .256 .259 .261 .263
Adjusted R-square .251 .253 .255 .256
Change in R-square - .003 .005 .004
F-value for change in R2 - 2.984 4.488 3.732
F-value sig. for change in R2 - .085 .034 .054
Overall F-value 47.746**
*
40.400*** 40.737*** 35.298***
Dependent variable = CSiR in all models.
*p < 0.1 **p < 0.05 ***p < 0.01 (one-tailed tests). n = 699 in all models.
Unstandardized coefficients with corresponding standard errors in parentheses.

132
Model 2 adds the independent variable FCE to Model 1. The overall Model 2 is
statistically significant (R2 = .259, p = .000) and represents a statistically significant
change in R2 over Model 1 (change in R2 = 0.003, p < 0.1). Hypothesis 1 predicted that
higher formal corruption environment levels in the MNE’s location portfolio (FCE) will
be related to higher levels of firm irresponsibility. FCE was found to be positively related
to firm CSiR (B = .14, p < 0.05). This result supports Hypothesis 1: MNEs operating in
location portfolios containing higher formal corruption environments on average have
higher levels of CSiR.
Hypothesis 2 predicted that higher MNE portfolio informal corruption
environments would also be related to higher levels of firm irresponsibility. Model 3 adds
the independent variable ICE to the Model 1 controls. The overall model was significant
(R2 = .261, p = .000) with a significant change in R2 (change in R2 = 0.005, p < 0.05).
ICE was confirmed to be positively related to firm CSiR (B = 2.15, p < 0.05) in Model 3.
This supports Hypothesis 2: MNEs operating in location portfolios containing higher
informal corruption environments on average have higher levels of CSiR.
In Model 4 the effects of formal and informal corruption environments tested in
Stage 1 were regressed together to confirm the incremental additive explanatory power of
the informal element over the formal corruption environment alone. Model 4 adds ICE as
an independent variable to Model 2, producing a significant overall model (R2 = .263, p =
.000) with a statistically significant change in R2 (change in R2 = 0.004, p < 0.1). ICE
was again confirmed to be significant (B = 1.97, p < 0.05). The Stage 1 regression results
of Model 4, therefore, support the notion that the informal dimension of corruption has

133
incremental explanatory power beyond the formal corruption environment in predicting
the social irresponsibility of MNEs.
Predicted CSiR values from Model 4 were retained for use in the second stage of
the 2SLS regression. The Predicted CSiR values represent the expected MNE social
irresponsibility levels given the levels of formal and informal corruption in the firm’s
portfolio of locations.
Table 3.8 provides the results of second stage of the instrumental 2SLS
regression2, which tests Hypothesis 3. The Stage 2 equations were tested separately using
two different measures of firm performance as the dependent variable. Models 5 and 6
used ROA as the performance measure; Models 7 and 8 used Tobin’s q for performance.
Of the 699 firms in the sample, 51 did not report sufficient financial information to
calculate performance measures, resulting in a sample n = 648 firms for the Stage 2
regression tests. With the exception of several Industry controls, Stage 2 VIF scores for
my variables of interest ranged from 1.024 – 3.206, well within acceptable
multicollinearity levels (Hair, et al., 2010, pp. 204-205).
Model 5 (using ROA as the dependent variable) contains only the Stage 2 control
variables. The Stage 1 control variables (e.g. Firm size) are not re-introduced here as
controls against firm performance because they are already embedded within the
Predicted CSiR values saved in Stage 1 and used as the independent variable in Stage 2,
and the same variable cannot be entered twice into a regression equation. The overall
2 It has been noted that running 2SLS equations as separate regressions may result in invalid standard errors
(Wooldridge, 2009, p. 522). For this reason it is recommended that 2SLS regressions be run using the
functions built into statistical packages such as SPSS, the tool utilized in this study. To address this
potential issue, I also ran my regression model using the built-in SPSS 2SLS regression function. The
results of this analysis produced results similar to those reported above, finding a significant negative
relationship between CSiR and Tobin’s q (B = -.160, std. error = .065, p < .01) as predicted in Hypothesis 3.
CSiR and ROA was not significant using the built-in 2SLS function (B = .016, std. error = .141, n.s.).

134
TABLE 3.8. Regression results for Stage 2 (Hypothesis 3)
Variables Model 5 Model 6 Model 7 Model 8
Intercept
5.32
(1.94)
6.22
(1.99)
.58
(.78)
1.20
(.79)
Firm CSR .05
(.05)
.11**
(.06)
.01
(.02)
.05**
(.02)
Firm Leverage -.12
(.24)
-.11
(.24)
1.50***
(.09)
1.51***
(.09)
Industry – Consumer Disc 2.97*
(1.97)
3.13*
(1.97)
1.60**
(.79)
1.71**
(.78)
Industry – Consumer Staples 2.71*
(2.05)
2.79*
(2.05)
1.41**
(.82)
1.46**
(.81)
Industry – Energy 1.33
(2.08)
1.34
(2.08)
.83
(.83)
.83
(.82)
Industry – Financials -2.27
(2.12)
-2.16
(2.11)
.64
(.85)
.71
(.84)
Industry – Healthcare 2.67*
(2.03)
2.65*
(2.02)
1.34**
(.81)
1.33**
(.80)
Industry – Industrials .97
(1.98)
1.20
(1.98)
1.02*
(.79)
1.18*
(.78)
Industry – Info Technology 1.23
(1.98)
1.07
(1.97)
1.76**
(.79)
1.64**
(.78)
Industry – Materials 1.75
(2.04)
1.68
(2.04)
.76
(.82)
.72
(.81)
Industry – Utilities -1.81
(2.30)
-1.89
(2.30)
-.27
(.92)
-.33
(.91)
Predicted Firm CSiR - -.44**
(.22)
- -.31***
(.09)
R-square .068 .074 .307 .319
Adjusted R-square .052 .056 .295 .306
Change in R2 - .006 - .013
F-value for change in R2 - 3.843 - 11.719
F-value sig. for change in R2 - .050 - .001
Overall F-value 4.213*** 4.200*** 25.562*** 24.803***
Dependent variable = ROA in Models 5 & 6; Tobin’s q in Models 7 & 8.
*p < 0.1 **p < 0.05 ***p < 0.01 (one-tailed tests). n = 648 in all models.
Unstandardized coefficients with corresponding standard errors in parentheses.

135
Model 5 was statistically significant, but produced a relatively low R2 (R2 = .068, p =
.000). Neither CSR nor Leverage was found to be a significant predictor of ROA. Three of
the Industry controls were found to be significant: consumer discretionary (B = 2.97, p <
0.1), consumer staples (B = 2.71, p < 0.1), and healthcare (B = 2.67, p < 0.1).
Model 6 added the independent variable to Model 5, regressing the first of my
performance measure dependent variables, ROA, against the independent variable
Predicted CSiR retained from Stage 1 (Model 4). Using the Predicted CSiR values as the
independent variable provides an analysis of the performance impact of social
irresponsibility given the firm’s locations’ levels of formal and informal corruption.
Model 6 produced a significant overall model (R2 = .074, p = .000) with a statistically
significant change in R2 (change in R2 = 0.006, p = 0.05). Predicted CSiR was negatively
related to ROA (B = -.44, p = 0.05), providing initial support for Hypothesis 3.
Models 7 and 8 repeated the Hypothesis 3 tests using the second performance
measure, Tobin’s q, in a similar fashion to Models 5 and 6. Model 7 again contains only
the control variables. The overall model was significant (R2 = .307, p = .000). Although
CSR was again not significant, in this model Leverage was strongly significant (B = 1.50,
p = .000). Under Model 7, five of the Industry dummies were significant: consumer
discretionary goods (B = 1.60, p < 0.05), consumer staples (B = 1.41, p < 0.05),
healthcare (B = 1.34, p < 0.05), industrials (B = 1.02, p < 0.1), and information
technology (B = 1.76, p < 0.05).
Model 8 adds the independent variable saved from Stage 1, Predicted CSiR, to the
Stage 2 equation. Model 8 produced a significant overall model (R2 = .319, p = .000)
with a statistically significant change in R2 (change in R2 = 0.013, p < 0.01). Predicted

136
CSiR was confirmed to be a significant negative predictor of Tobin’s q (B = -.31, p <
0.01). The significant performance analysis results in the Model 8 Tobin’s q test (and to a
lesser extent, the Model 6 ROA test) provide support for Hypothesis 3: MNEs with higher
levels of social irresponsibility on average have lower performance than MNEs with
lower levels of social irresponsibility.
DISCUSSION
In this study I began by considering whether MNEs that are operating in high
corruption environments are more likely to be socially irresponsible. Recognizing that
corruption is a relevant element of MNE’s institutional environments, institutional theory
posits that firms are subject to pressures exerted upon them from their institutional
environments in an effort to gain local legitimacy.
I theorized that firms operating in portfolios of locations characterized by
pervasive formal corruption in the public sector will increase the firm’s likelihood of
committing socially irresponsible actions. The negative influence of corruption may not
only encourage firms to side-step socially responsible behavior, but the additional costs
and risks associated with corrupt businesses may result in lack of CSR investments and
lead to higher CSiR. Corrupt business practices may become formally instantiated within
the organization.
I further hypothesized that in addition to the negative impacts associated with
formal corruption environments, MNEs may also face more CSiR because of the
influence of informal corruption in their operating environments. Informal corruption
represents the general permeation of corrupt behavior beyond just public sector

137
corruption to incorporate all aspects of a society, reflecting the corruption experienced by
average individual citizens in their everyday experiences. Environments higher in
informal corruption may exert pressure to act corruptly in everyday life (not just
corporate-public sector interactions) and thus may result in more tolerance and higher
occurrence of socially irresponsible decisions and outcomes.
I tested my hypotheses on a sample of 699 MNEs using each firm’s entire
subsidiary location portfolio. As expected, my tests confirmed the link between
corruption environments and irresponsibility. Firms operating in environments that have
higher average overall levels of formal and/or informal levels of corruption in their
operating environments can be expected to have correspondingly higher levels of CSiR.
Additionally I suggested that firms with higher CSiR levels will also have lower
performance. Socially irresponsible behavior may create additional risk and costs
associated with dealing with NGO anti-irresponsibility activism and/or regulatory threats
and other government actions due to CSiR exposure. Additionally, firms may have to
expend resources to react to specific incidents and patterns of CSiR or risk losing trust
and legitimacy with their local markets. As hypothesized, tests using multiple measures
of performance on a sample of 648 MNEs confirmed that higher CSiR is related to lower
overall firm performance. Although both the ROA- and Tobin’s q-based models
produced significant results as hypothesized, CSiR was found to be a better predictor of
performance when measured via Tobin’s q as opposed to via ROA. This finding makes
sense given that Tobin’s q is considered a longer-term performance measure, whereas
ROA is a shorter-term measure (Short, Ketchen Jr, Palmer, & Hult, 2007), and social

138
responsibility investments and impacts generally have long-term orientations (Wang &
Bansal, 2012).
Contribution
This study’s findings make several unique contributions to the international
business and social responsibility literature. First, this study is research-opening in that it
finds initial support for the suggestion that just as firms are rewarded for their positive
CSR, their performance may likewise be penalized for high levels CSiR. A large
percentage of the CSR research examines the CSR-performance relationship, but this
study’s findings indicate that the CSiR-performance relationship may be equally
deserving of research attention.
Second, based on North’s institutional model (1990), this study is the first to
conceptualize institutionalized corruption as having both a formal and informal
dimension. The regressions were executed hierarchically to emphasize that both the
formal and informal corruption dimensions contribute independently to social
irresponsibility. The typical focus in corruption-related research is on corruption in the
public sector, formal corruption. This study’s empirical results suggest that in addition to
the formal corruption environment, firms may also face separate additive impacts from
their informal corruption environment. Adding the informal dimension provides a
research contribution because with it we can better explain CSiR. The traditional method
(of conceptualizing formal corruption only) does not do as good of a job of explaining as
when we add in the informal dimension and may be an overly simplistic way of looking
at corruption. Therefore, future corruption researchers may wish to incorporate both the
formal and informal dimensions of corruption in future studies.

139
Finally, this is also the first social irresponsibility study to conceptualize the MNE
as a portfolio of locations, holistically considering the corruption impacts from the firm’s
entire set of operating locations on their social irresponsibility. Future research examining
the influence of external elements such as formal and informal institutions on social
irresponsibility and/or responsibility may want to consider utilizing the portfolio
conceptualization in their studies.
Managerial Implications
The empirical support for my hypotheses leads to two managerial
recommendations. First, MNEs may be able to reduce their CSiR exposure by balancing
corruption considerations in their country selection decisions. My findings help us
understand how a specific aspect of the institutional environment – corruption - across a
firm’s entire portfolio of locations may have an impact on the firm’s social
irresponsibility outcomes. Firms operating in portfolios of locations with lower formal
and/or informal corruption levels may be at an advantage in terms of CSiR. These results
provide guidance in country selection and social responsibility strategy for MNE
managers concerned about minimizing incidents of social irresponsibility.
Second I take an initial step in proposing and empirically confirming the notion
that MNEs with higher levels of CSiR may be outperformed by firms with lower levels of
social irresponsibility. There is a rich research stream underway examining the
relationships between positive social performance and firm financial performance, but the
social irresponsibility-performance link is unexplored. My results suggest that there is a
performance cost associated with maintaining high levels of CSiR that MNE managers

140
may want to consider when setting social responsibility strategies and making country
selection decisions.
Limitations
This study has several limitations. Although the KLD dataset is overwhelmingly
accepted in CSR and CSiR research (Wood, 2010), it has some limitations in terms of
international coverage which I have attempted to account for in the research design. The
KLD rating data is comprised of firms which are still overwhelmingly U.S.-based. To
address this limitation and maintain an international focus, this study considers the
corruption impact of the MNE’s entire portfolio of locations, not just the headquarters
country. In the future there may be better ways to measure CSiR which may further
address or eliminate this limitation and enable testing of the model using a broader global
sample. Whereas there are other available options for measuring CSR, other social
responsibility ratings do not provide a set of measures that examine irresponsibility
separately. This makes measuring CSiR offers more of a research challenge for the
future, particularly in an international context. Improved CSiR measures may also help
improve the R-squares of irresponsibility-related research models.
The portfolio operationalization technique used in this study also has some
limitations in that each subsidiary is weighted equally in the calculation of portfolio-level
variables. Certain subsidiaries may be more strategically important or more relevant to a
MNE’s social responsibility-related outcomes than others. Future researchers may be able
to identify theoretically-based methods of weighting subsidiaries differently that can be
supported by available data sources.

141
Additionally, this study utilizes nation-level attributes of formal and informal
corruption to explore the environmental effects of corruption on MNE social
irresponsibility and subsequent performance. Country-level attributes do not necessarily
capture any within-country variance that may exist. It is possible that the specific
geographic locations of the MNE’s presence in a particular region within a given country
might exhibit significantly different levels of formal and/or informal corruption which
could affect the results. Future measurements may provide for more institutional
granularity, enabling within-country analysis of different levels of institutionalized
corruption.
Finally, this study is cross-sectional, measuring phenomena at a particular point in
time. Future research may want to explore the relationships between corruption, CSiR,
and performance via a longitudinal design. However, because institutional elements do
not tend to radically change year-over-year, future studies would need to be conducted
either over very long periods of time or alternatively could focus on particular subsets of
the world that are experiencing more rapid institutional changes (e.g. emerging markets).
Conclusion
By conceptualizing and testing corruption as a multi-dimensional construct, this
study highlights the influence exerted on MNE by the formal and informal corruption
levels of its entire portfolio of subsidiary locations. Corruption environments can affect
firms’ social irresponsibility outcomes. MNEs that operating in locations that have higher
average levels of formal and/or informal corruption environments are more likely to have
correspondingly higher levels of CSiR. Furthermore, this study’s results suggest that
higher CSiR is linked to lower firm performance. If minimizing levels of CSiR is a

142
strategic priority for the firm, managers should consider national formal and informal
corruption profiles in their country selection decisions to minimize the impact of
corruption environments on their social irresponsibility.

143
REFERENCES
Aguilera, R. V., Rupp, D. E., Williams, C. A., & Ganapathi, J. (2007). Putting the S back
in corporate social responsibility: A multilevel theory of social change in
organizations. Academy of Management Review, 32(3), 836-863.
Aguilera, R. V., Williams, C. A., Conley, J. M., & Rupp, D. E. (2006). Corporate
governance and social responsibility: A comparative analysis of the UK and the
US. Corporate Governance: An International Review, 14(3), 147-158.
Aguinis, H., & Glavas, A. (2012). What we know and don't know about corporate social
responsibility: A review and research agenda. Journal of Management, 38(4),
932-968.
Anand, V., Ashforth, B. E., & Joshi, M. (2004). Business as usual: The acceptance and
perpetuation of corruption in organizations. Academy of Management Executive,
18(2), 39-53.
Antonakis, J., Bendahan, S., Jacquart, P., & Lalive, R. (in press). Causality and
endogeneity: Problems and solutions. In D. V. Day (Ed.), The Oxford handbook
of leadership and organizations. Oxford: Oxford University Press.
Argandoña, A. (2007). The United Nations convention against corruption and its impact
on international companies. Journal of Business Ethics, 74(4), 481-496.
Arjoon, S. (2005). Corporate governance: An ethical perspective. Journal of Business
Ethics, 61(4), 343-352.
Ashforth, B. E., & Anand, V. (2003). The normalization of corruption in organizations.
In B. M. Staw & R. M. Kramer (Eds.), Research in organizational behavior (Vol.
25, pp. 1-52). Kidlington, Oxford, UK: Elsevier.
Backer, L. (2007). Engaging stakeholders in corporate environmental governance.
Business and Society Review, 112(1), 29-54.
Bansal, P., & Roth, K. (2000). Why companies go green: A model of ecological
responsiveness. Academy of Management Journal, 43(4), 717-736.

144
Barnea, A., & Rubin, A. (2010). Corporate social responsibility as a conflict between
shareholders. Journal of Business Ethics, 97(1), 71-86.
Bartley, T., & Child, C. (2010). Shaming the corporation: Social movement pressure and
corporate social responsibility. Unpublished manuscript.
Becker-Olsen, K. L., Cudmore, B. A., & Hill, R. P. (2006). The impact of perceived
corporate social responsibility on consumer behavior. Journal of Business
Research, 59(1), 46-53.
Berman, S. L., Wicks, A. C., Kotha, S., & Jones, T. M. (1999). Does stakeholder
orientation matter? The relationship between stakeholder management models and
firm financial performance. Academy of Management Journal, 42(5), 488-506.
Brouthers, L. E., Gao, Y., & McNicol, J. P. (2008). Corruption and market attractiveness
influences on different types of FDI. Strategic Management Journal, 29(6), 673-
680.
Campbell, J. L. (2007). Why would corporations behave in socially responsible ways? An
institutional theory of corporate social responsibility. Academy of Management
Review, 32(3), 946-967.
Chao, M. C. H., & Kumar, V. (2010). The impact of institutional distance on the
international diversity-performance relationship. Journal of World Business,
45(1), 93-103.
Chatterji, A. K., & Toffel, M. W. (2010). How firms respond to being rated. Strategic
Management Journal, 31(9), 917-945.
Chiu, S., & Sharfman, M. (2011). Legitimacy, visibility, and the antecedents of corporate
social performance: An investigation of the instrumental perspective. Journal of
Management, 37(6), 1558-1585.
Cohen, J., & Cohen, P. (1983). Applied multiple regression for the behavioral sciences
(2nd ed.). Hillsdale, NJ: Lawrence Erlbaum Associates.
Cuervo-Cazurra, A. (2006). Who cares about corruption? Journal of International
Business Studies, 37(6), 807-822.

145
Damania, R., Fredriksson, P. G., & List, J. A. (2003). Trade liberalization, corruption,
and environmental policy formation: Theory and evidence. Journal of
Environmental Economics and Management, 46(3), 490-512.
Datamonitor. (2011). Shell: Leaving Nigeria would have even greater repercussions for
sustainability: Datamonitor.
Davis, J. H., & Ruhe, J. A. (2003). Perceptions of country corruption: Antecedents and
outcomes. Journal of Business Ethics, 43(4), 275-288.
deMaCarty, P. (2009). Financial returns of corporate social responsibility, and the moral
freedom and responsibility of business leaders. Business and Society Review,
114(3), 393-433.
Doh, J. P., & Guay, T. R. (2006). Corporate social responsibility, public policy, and NGO
activism in Europe and the United States: An institutional-stakeholder
perspective. Journal of Management Studies, 43(1), 47-73.
Doh, J. P., Howton, S. D., Howton, S. W., & Siegel, D. S. (2010). Does the market
respond to an endorsement of social responsibility? The role of institutions,
information, and legitimacy. Journal of Management, 36(6), 1461-1465.
Doig, A., & Mclvor, S. (1999). Corruption and its control in the developmental context:
An analysis and selective review of the literature. Third World Quarterly, 20(3),
657-676.
Frooman, J. (1997). Socially irresponsible and illegal behavior and shareholder wealth.
Business & Society, 36(3), 221-249.
Godfrey, P. C., Merrill, C. B., & Hansen, J. M. (2009). The relationship between
corporate social responsibility and shareholder value: An empirical test of the risk
management hypothesis. Strategic Management Journal, 30(4), 425-445.
Gomez-Mejia, L. R., Makri, M., & Kintana, M. L. (2010). Diversification decisions in
family-controlled firms. Journal of Management Studies, 47(2), 223-252.
Gomez-Mejia, L. R., & Palich, L. E. (1997). Cultural diversity and the performance of
multinational firms. Journal of International Business Studies, 28(2), 309-335.

146
Gray, C. W., & Kaufmann, D. (1998). Corruption and development. Finance and
Development, 35(1), 7-10.
Greenwood, M. (2007). Stakeholder engagement: Beyond the myth of corporate
responsibility. Journal of Business Ethics, 74(4), 315-327.
Guenster, N., Bauer, R., Derwall, J., & Koedijk, K. (2011). The economic value of
corporate eco-efficiency. European Financial Management, 17(4), 679-704.
Habib, M., & Zurawicki, L. (2001). Country-level investments and the effect of
corruption: Some empirical evidence. International Business Review, 10(6), 687-
700.
Habib, M., & Zurawicki, L. (2002). Corruption and foreign direct investment. Journal of
International Business Studies, 33(2), 291-307.
Hair, J., Black, W., Babin, B., & Anderson, R. (2010). Multivariate data analysis (7th
ed.). Upper Saddle River, NJ: Pearson Prentice Hall.
Hart, T. A., & Sharfman, M. (2012). Assessing the concurrent validity of the revised
Kinder, Lydenberg, and Domini corporate social performance indicators. Business
& Society, In press.
Hellman, J., Jones, G., Kaufmann, D., & Schankerman, M. (2000). Measuring
governance, corruption, and state capture: How firms and bureaucrats shape the
business environment in transition economies. Public Policy Research Paper No.
2312. The World Bank, Washington, D.C.
Henisz, W., & Swaminathan, A. (2008). Institutions and international business. Journal
of International Business Studies, 39(4), 537-539.
Hills, G., Fiske, L., & Mahmud, A. (2009). Anti-corruption as strategic CSR: A call to
action for corporations. Boston, MA: FSG Social Impact Advisors.
Hoetker, G., & Mellewigt, T. (2009). Choice and performance of governance
mechanisms: Matching alliance governance to asset type. Strategic Management
Journal, 30(10), 1025-1044.
147
Husted, B. W. (1999). Wealth, culture, and corruption. Journal of International Business
Studies, 30(2), 339-359.
Ioannou, I., & Serafeim, G. (2012). What drives corporate social performance? The role
of nation-level institutions. Journal of International Business Studies, 43(9), 834-
864.
Jo, H., & Harjoto, M. A. (2011). Corporate governance and firm value: The impact of
corporate social responsibility. Journal of Business Ethics, 103(3), 351-383.
Johnson, R. A., & Greening, D. W. (1999). The effects of corporate governance and
institutional ownership types on corporate social performance. Academy of
Management Journal, 42(5), 564-576.
Kaufmann, D. (2004). Corruption, governance and security: Challenges for the rich
countries and the world. In M. E. Porter, K. Schwab, X. Sala-i-Martin & A.
Lopez-Carlos (Eds.), The World Economic Forum, Global Competitiveness
Report 2004-5 (pp. 83-102). New York: Palgrave Macmillan.
Kaufmann, D., Kraay, A., & Mastruzzi, M. (2006). Measuring corruption: Myths and
realities. Development Outreach, 8(2), 124-137.
Kaufmann, D., Kraay, A., & Mastruzzi, M. (2009). Governance matters VIII: Aggregate
and individual governance indicators 1996-2008. World Bank Policy Research
Working Paper Series, (Policy Research Working Paper No. 4978). The World
Bank Development Research Group, Washington, D.C.
Kaufmann, D., Kraay, A., & Mastruzzi, M. (2010). The worldwide governance
indicators: Methodology and analytical issues. World Bank Policy Research
Working Paper Series, (Policy Research Working Paper No. 5430). The World
Bank Development Research Group, Washington, D.C.
Kim, K., & Park, J.-H. (2002). The determinants of value creation for partner firms in the
global alliance context. Management International Review, 42(4), 361-384.
Klapper, L. F., & Love, I. (2004). Corporate governance, investor protection, and
performance in emerging markets. Journal of Corporate Finance, 10(5), 703-728.

148
Kostova, T., & Roth, K. (2002). Adoption of an organizational practice by subsidiaries of
multinational corporations: Institutional and relational effects. Academy of
Management Journal, 45(1), 215-233.
Kostova, T., Roth, K., & Dacin, M. (2008). Institutional theory in the study of
multinational corporations: A critique and new directions. Academy of
Management Review, 33(4), 994-1006.
Kotchen, M. J., & Moon, J. J. (2011). Corporate social responsibility for irresponsibility.
Working paper #17254. National Bureau of Economic Research. Cambridge, MA.
Kwok, C. C. Y., & Tadesse, S. (2006). The MNC as an agent of change for host-country
institutions: FDI and corruption. Journal of International Business Studies, 37(6),
767-785.
Langbein, L., & Knack, S. (2008). The worldwide governance indicators and tautology:
Causally related separable concepts, indicators of a common cause, or both?
World Bank Policy Research Working Paper Series, (Policy Research Working
Paper No. 4669). The World Bank Development Research Group, Washington,
D.C.
Lange, D., & Washburn, N. T. (2012). Understanding attributions of corporate social
irresponsibility. Academy of Management Review, 37(2), 300-326.
Li, P. P. (2009). The duality of crony corruption in economic transition: Toward an
integrated framework. Journal of Business Ethics, 85(1), 41-55.
Lopez, R., & Mitra, S. (2000). Corruption, pollution, and the Kuznets environment curve.
Journal of Environmental Economics and Management, 40(2), 137-150.
Luo, Y. (2005). An organizational perspective of corruption. Management and
Organization Review, 1(1), 119-154.
Luo, Y. (2006). Political behavior, social responsibility, and perceived corruption: A
structuration perspective. Journal of International Business Studies, 37(6), 747-
766.

149
Maignan, I., & Ralston, D. A. (2002). Corporate social responsibility in Europe and the
U.S.: Insights from businesses' self-presentations. Journal of International
Business Studies, 33(3), 497-514.
Margolis, J. D., Elfenbein, H. A., & Walsh, J. (2009). Does It pay to be good... and does
it matter? A meta-analysis of the relationship between corporate social and
financial performance. Unpublished manuscript.
Margolis, J. D., & Walsh, J. P. (2003). Misery loves companies: Rethinking social
initiatives by business. Administrative Science Quarterly, 48(2), 268-305.
Matten, D., & Moon, J. (2008). "Implicit" and "explicit" CSR: A conceptual framework
for a comparative understanding of corporate social responsibility. Academy of
Management Review, 33(2), 404-424.
Mattingly, J. E., & Berman, S. L. (2006). Measurement of corporate social action.
Business & Society, 45(1), 20-46.
McGuire, J., Dow, S., & Argheyd, K. (2003). CEO incentives and corporate social
performance. Journal of Business Ethics, 45(4), 341-359.
McGuire, J., Sundgren, A., & Schneeweis, T. (1988). Corporate social responsibility and
firm financial performance. Academy of Management Journal, 31(4), 854-872.
Minor, D., & Morgan, J. (2011). CSR as reputation insurance: Primum non nocere.
California Management Review, 53(3), 40-59.
Morse, S. (2006). Is corruption bad for environmental sustainability? A cross-national
analysis. Ecology and Society, 11(1), 22.
MSCI. (2010). Environmental, Social, and Governance (ESG) STATS. from Kinder,
Lydenberg, Domini Research & Analytics (KLD).
Muller, A., & Kräussl, R. (2011). Doing good deeds in times of need: A strategic
perspective on corporate disaster donations. Strategic Management Journal,
32(9), 911-929.
150
Nachum, L., & Song, S. (2011). The MNE as a portfolio: Interdependencies in MNE
growth trajectory. Journal of International Business Studies, 42(3), 381-405.
Nieuwenboer, N. A., & Kaptein, M. (2008). Spiraling down into corruption: A dynamic
analysis of the social identity processes that cause corruption in organizations to
grow. Journal of Business Ethics, 83(2), 133-146.
North, D. C. (1990). Institutions, institutional change, and economic performance.
Cambridge: Cambridge University Press.
Nwabuzor, A. (2005). Corruption and development: New initiatives in economic
openness and strengthened rule of law. Journal of Business Ethics, 59(1), 121-
138.
Orlitzky, M., & Benjamin, J. D. (2001). Corporate social performance and firm risk: A
meta-analytic review. Business & Society, 40(4), 369-396.
Orlitzky, M., Schmidt, F. L., & Rynes, S. L. (2003). Corporate social and financial
performance: A meta-analysis. Organization Studies, 24(3), 403-441.
Peloza, J. (2009). The challenge of measuring financial impacts from investments in
corporate social performance. Journal of Management, 35(6), 1518-1541.
Peng, M. W., & Heath, P. S. (1996). The growth of the firm in planned economies in
transition: Institutions, organizations, and strategic choice. Academy of
Management Review, 21(2), 492-528.
Peng, M. W., & Pleggenkuhle Miles, E. G. (2009). Current debates in global strategy.
International Journal of Management Reviews, 11(1), 51-68.
Peng, M. W., Sunny, L. S., Pinkham, B., & Hao, C. (2009). The institution-based view as
a third leg for a strategy tripod. Academy of Management Perspectives, 23(3), 63-
81.
Peng, M. W., Wang, D. Y. L., & Jiang, Y. (2008). An institution-based view of
international business strategy: A focus on emerging economies. Journal of
International Business Studies, 39(5), 920-936.

151
Pinto, J., Leana, C. R., & Pil, F. K. (2008). Corrupt organizations or organizations of
corrupt individuals? Two types of organization-level corruption. Academy of
Management Review, 33(3), 685-709.
Putrevu, S., McGuire, J., Siegel, D. S., & Smith, D. M. (2012). Corporate social
responsibility, irresponsibility, and corruption: Introduction to the special section.
Journal of Business Research, In press.
Reid, E. M., & Toffel, M. W. (2009). Responding to public and private politics:
Corporate disclosure of climate change strategies. Strategic Management Journal,
30(11), 1157-1178.
Riaño, J., Heinrich, F., & Hodess, R. (2010). Global Corruption Barometer. Berlin:
Transparency International.
Robertson, C. J., & Watson, A. (2004). Corruption and change: The impact of foreign
direct investment. Strategic Management Journal, 25(4), 385-396.
Rodriguez, P., Siegel, D. S., Hillman, A., & Eden, L. (2006). Three lenses on the
multinational enterprise: Politics, corruption, and corporate social responsibility.
Journal of International Business Studies, 37(6), 733-746.
Rodriguez, P., Uhlenbruck, K., & Eden, L. (2005). Government corruption and the entry
strategies of multinationals. Academy of Management Review, 30(2), 383-396.
Rose-Ackerman, S. (1975). The economics of corruption. Journal of Public Economics,
4(2), 187-203.
Rossouw, G. J. (2005). Business ethics and corporate governance: A global survey.
Business & Society, 44(1), 32-39.
Scott, W. (2008). Institutions and organizations: Ideas and interests (3rd ed.). Thousand
Oaks, CA: Sage Publications.
Sharfman, M. (1996). The construct validity of the Kinder, Lydenberg & Domini social
performance ratings data. Journal of Business Ethics, 15(3), 287-296.

152
Shaver, J. M. (2005). Testing for mediating variables in management research: Concerns,
implications, and alternative strategies. Journal of Management, 31(3), 330-353.
Short, J. C., Ketchen Jr, D. J., Palmer, T. B., & Hult, G. T. M. (2007). Firm, strategic
group, and industry influences on performance. Strategic Management Journal,
28(2), 147-167.
Strike, V. M., Gao, J., & Bansal, P. (2006). Being good while being bad: Social
responsibility and the international diversification of US firms. Journal of
International Business Studies, 37(6), 850-862.
Suchman, M. C. (1995). Managing legitimacy: Strategic and institutional approaches.
Academy of Management Review, 20(3), 571-610.
Tan, J. (2009). Institutional structure and firm social performance in transitional
economies: Evidence of multinational corporations in China. Journal of Business
Ethics, 86, 171-189.
Transparency International. (2010). Corruption Perceptions Index. Berlin: Transparency
International.
Udayasankar, K. (2008). Corporate social responsibility and firm size. Journal of
Business Ethics, 83(2), 167-175.
Uhlenbruck, K., Rodriguez, P., Doh, J., & Eden, L. (2006). The impact of corruption on
entry strategy: Evidence from telecommunication projects in emerging
economies. Organization Science, 17(3), 402-414.
Venard, B., & Hanafi, M. (2008). Organizational isomorphism and corruption in financial
institutions: Empirical research in emerging countries. Journal of Business Ethics,
81(2), 481-498.
Voyer, P. A., & Beamish, P. W. (2004). The effect of corruption on Japanese foreign
direct investment. Journal of Business Ethics, 50(3), 211-224.
Waddock, S. A., & Graves, S. B. (1997). The corporate social performance-financial
performance link. Strategic Management Journal, 18(4), 303-319.

153
Wang, T., & Bansal, P. (2012). Social responsibility in new ventures: Profiting from a
long‐term orientation. Strategic Management Journal, 33(10), 1135-1153.
Weitzel, U., & Berns, S. (2006). Cross-border takeovers, corruption, and related aspects
of governance. Journal of International Business Studies, 37(6), 786-806.
Welsch, H. (2004). Corruption, growth, and the environment: A cross-country analysis.
Environment and Development Economics, 9(05), 663-693.
Wilhelm, P. G. (2002). International validation of the corruption perceptions index:
Implications for business ethics and entrepreneurship education. Journal of
Business Ethics, 35(3), 177-189.
Wood, D. J. (2010). Measuring corporate social performance: A review. International
Journal of Management Reviews, 12(1), 50-84.
Wooldridge, J. M. (2009). Introductory econometrics: A modern approach (4 ed.).
Mason, OH: South-Western Cengage Learning.
Yang, X., & Rivers, C. (2009). Antecedents of CSR practices in MNCs’ subsidiaries: A
stakeholder and institutional perspective. Journal of Business Ethics, 86, 155-169.
You, J., & Khagram, S. (2005). A comparative study of inequality and corruption.
American Sociological Review, 70(1), 136-157.
Zaheer, A., & Hernandez, E. (2011). The geographic scope of the MNC and its alliance
portfolio: Resolving the paradox of distance. Global Strategy Journal, 1(1‐2),
109-126.

154
154 154
154 1
54 154 154 154
154 154
APPENDIX A
OVERVIEW OF THE DISSERTATION FINDINGS

155
TABLE A.1. Dissertation findings and associated managerial and research implications
Main findings Managerial implications Research implications
Greater informal institutional
distance between the MNE’s
headquarters and subsidiary
locations negatively influences
firm CSP.
To reduce the decline in firm CSP, MNE managers
should select countries whose cultural profiles are more
similar to the headquarters culture.
Experience associated with learning about one culture
does not negate the need to learn about every new
culture.
The CSP dynamics associated with cultural
distance need to be further investigated using
other measures of informal institutional distance.
Formal institutional distance
reduces the CSP benefits of
greater international scope.
Entering more countries expands firm learning and leads
to higher CSP. However, if new countries have
significantly higher CSP standards than the firm’s current
locations, overall firm CSP may not increase as much
because prior firm experience is not as applicable in the
new higher-standard countries.
MNEs from lower social responsibility regions (e.g.
emerging markets) are at a particular disadvantage in this
regard because a large percentage of potential markets
have higher CSP standards.
Consider the asymmetric nature of formal
institutional distance; maintain sign and direction
to reflect the hierarchy of stringency in country-
level formal regulatory institutions.
Formal and informal
institutional distances produce
different dynamics relative to
social responsibility.
MNE managers should balance consideration of both the
cultural and regulatory aspects of their new country
selections.
Symmetry of formal and informal institutional
dynamics should not necessarily be assumed.
Future international business research into
possible different dynamics of formal and
informal differences needs to be investigated.

156 156
156 1
56 156 156 156
156 156
156
TABLE A.1. Dissertation findings and associated managerial and research implications (continued)
Main findings Managerial implications Research implications
Higher levels of both formal
and informal corruption
environments in a MNE’s
operating locations are related
to higher levels of firm CSiR.
To avoid higher firm CSiR, MNE managers should select
countries characterized by lower formal and informal
corruption environments.
Future research should consider the impact of the
corruption profiles of the firm’s operating
locations on other social responsibility-related
outcomes.
Informal corruption has a
separate and incremental impact
over formal corruption on
CSiR.
MNE outcomes are affected by both the level of formal
public sector corruption and the general permeation of
corruption within the society.
International business researchers should
consider informal corruption as a distinct
dimension of institutionalized corruption in
future studies.
Higher levels of CSiR are
related to lower firm
performance.
To improve firm performance, MNE managers should
reduce or eliminate socially irresponsible behavior.
A foundation is set for additional research into
the irresponsibility-performance relationship.
The institutional profiles of a
MNE’s entire portfolio of
operating locations have an
impact on the firm’s CSP and
CSiR.
The headquarters country influences are not the only
location consideration for MNEs. Each subsidiary
location country choice also may have a potential impact
on the firm’s social responsibility and irresponsibility
outcomes.
The operating portfolio is based on a
consideration of the full set of subsidiary
operating locations specific to a given MNE and
may provide a useful vantage point from which
to explore other institutional dynamics relative to
MNEs.

157
APPENDIX B
SECONDARY DATA COLLECTION METHODOLOGY

158
SECONDARY DATA COLLECTION METHODOLOGY
The purpose of this section is to describe the procedures used for secondary data
collection and preparation in the two empirical dissertation studies. Although Paper 1 and
Paper 2 utilized completely separate sample frames, samples, and independent and
dependent variables, the same basic process that blended firm, subsidiary, and country
data via portfolio-level operationalization was utilized for both papers. The general
mechanics of this data collection process are described within this appendix.
In addition to SPSS, the tools utilized for data manipulation in the dissertation
studies included Excel, Oracle, and TOAD. Data sourced from public and subscription
database sources were downloaded locally as Excel spreadsheets. The Excel spreadsheets
were uploaded into an Oracle 11g relational database (here forth referred to as the
“Research Database”). Extracts from the Research Database were used to create the final
samples which were imported into SPSS for analysis. The widely used TOAD database
tool was used for all database uploads, queries, and extracts. Figure B.1 provides an
overview of the tables, relevant data elements, and data relationships in the resulting
logical data model created for the empirical studies.
The first step in creating the study samples was to establish the initial firm
samples based on availability of social responsibility/irresponsibility data. The sample
frames for both studies were third party social responsibility ratings datasets. Paper 1
Utilized the CSRHub dataset; Paper 2 utilized the Kinder, Lydenberg, Domini (KLD)
ratings. CSRHub provides publicly available data which was downloaded in spreadsheet
form from the CSRHub website (www.csrhub.com). The KLD dataset is propriety and
was not available via any existing Kennesaw State database subscriptions. For this
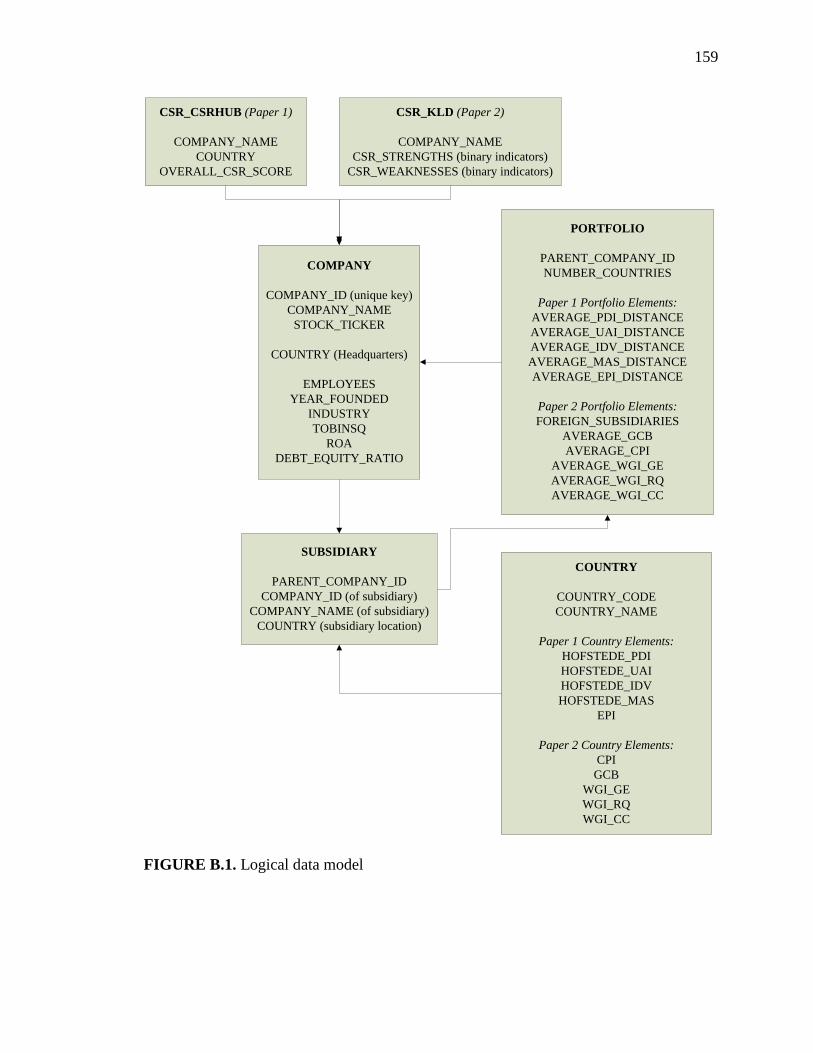
159
159 159
159 1
59 159 159 159
159 159
COMPANY
COMPANY_ID (unique key)
COMPANY_NAME
STOCK_TICKER
COUNTRY (Headquarters)
EMPLOYEES
YEAR_FOUNDED
INDUSTRY
TOBINSQ
ROA
DEBT_EQUITY_RATIO
PORTFOLIO
PARENT_COMPANY_ID
NUMBER_COUNTRIES
Paper 1 Portfolio Elements:
AVERAGE_PDI_DISTANCE
AVERAGE_UAI_DISTANCE
AVERAGE_IDV_DISTANCE
AVERAGE_MAS_DISTANCE
AVERAGE_EPI_DISTANCE
Paper 2 Portfolio Elements:
FOREIGN_SUBSIDIARIES
AVERAGE_GCB
AVERAGE_CPI
AVERAGE_WGI_GE
AVERAGE_WGI_RQ
AVERAGE_WGI_CC
SUBSIDIARY
PARENT_COMPANY_ID
COMPANY_ID (of subsidiary)
COMPANY_NAME (of subsidiary)
COUNTRY (subsidiary location)
COUNTRY
COUNTRY_CODE
COUNTRY_NAME
Paper 1 Country Elements:
HOFSTEDE_PDI
HOFSTEDE_UAI
HOFSTEDE_IDV
HOFSTEDE_MAS
EPI
Paper 2 Country Elements:
CPI
GCB
WGI_GE
WGI_RQ
WGI_CC
CSR_KLD (Paper 2)
COMPANY_NAME
CSR_STRENGTHS (binary indicators)
CSR_WEAKNESSES (binary indicators)
CSR_CSRHUB (Paper 1)
COMPANY_NAME
COUNTRY
OVERALL_CSR_SCORE
FIGURE B.1. Logical data model

160
160 160
160 1
60 160 160 160
160 160
reason, the KLD data was purchased in spreadsheet form personally by the author from
the dataset’s current owner, MSCI, Inc. (www.msci.com). The CSR datasets each
contained company name, headquarters country (for CSRHub), and a variety of different
social responsibility ratings (in different categories and sub-categories in the case of
KLD).
SPSS was used to identify random selections of firms from each CSR spreadsheet
(n = 450 from CSRHub for Paper 1; n = 700 from KLD for Paper 2, for a total of 1,150
firms). The selected firms and their associated CSR-related scores were used to populate
two new tables in the Research Database (CSR_CSRHUB and CSR_KLD).
The next step in the data collection process was to match each sample firm
selected from the CSR datasets with its corresponding firm demographic data. The source
of firm demographic data was the Standard & Poor’s Capital IQ database (accessed via
Kennesaw State subscription).Company name and headquarters country (when available)
were used to identify each of the 1,150 sample firms in Capital IQ. Extracts from Capital
IQ and name-matching queries were created to semi-automate the matching process.
However, because specific company naming conventions rarely match exactly between
two different data sources (e.g. one source may use “Apple” whereas another uses
“Apple, Inc.”), each of the 1,150 distinct company names had to be manually confirmed
and updated individually.
Entries in the Research Database were made for each CSR-Capital IQ firm match.
First, an entry in the COMPANY table was created containing basic firm information:
company name, headquarters country, number of employees, year founded, and industry.
Because Capital IQ company names include parenthetical stock tickers (e.g. Apple is

161
161 161
161 1
61 161 161 161
161 161
actually called “Apple [NYSE:APP]” in Capital IQ), an algorithm was created to
systematically strip off the stock tickers into their own data element in the COMPANY
table. The corresponding company number found in Capital IQ for each matched firm
was added to the corresponding CSR table to enable cross-referencing.
Because Paper 2’s research model includes firm performance-related variables,
several additional firm-level data elements were also extracted from Capital IQ and
stored with the Research Database COMPANY data for all Paper 2 firms: return on assets
(ROA); Tobin’s q; total debt and total equity (used to calculated leverage).
Both dissertation studies are based on the availability of portfolio-level measures
for each firm. Portfolio measures take specific measurements at the subsidiary level
(based on the country location of each subsidiary), and then all of the subsidiary values
for the firm are averaged together to create portfolio-level variables for each firm.
To accomplish this, first each sample firm’s entire set of subsidiary locations were
extracted from Capital IQ and loaded into the SUBSIDIARY table in the Research
Database. Capital IQ provides an extract capability that outputs all of a firm’s
subsidiaries in Excel spreadsheet form. This subsidiary spreadsheet was individually
extracted for each of the 1,150 sample firms. A special upload utility was written to take
the subsidiary number, company name, and country from each of Capital IQ spreadsheet.
This data was used to populate a new SUBSIDIARY table in the Research Database.
The next step involved preparing the country variables upon which the portfolio-
level variables would be based. The required country-level data elements were retrieved
from public sources as described in detail in the Methodology sections of each
dissertation paper and summarized in Table B.1 below. The country data was used to

162
162 162
162 1
62 162 162 162
162 162
populate a COUNTRY_MASTER table in the Research Database. To enable matching
country information from different sources, country names were normalized to United
Nations country naming standards.
TABLE B.1. Country-level data elements and sources used to create portfolio measures
Paper Country-level element Source
Paper 1 Hofstede cultural attributes
(PDI, IDV, UAI, MAS)
www.geert-hofstede.com
Environmental Performance Index
(EPI)
http:\\epi.yale.edu
Paper 2 Global Corruption Barometer
(GCB)
www.transparency.org/research/gcb
Corruption Perception Index
(CPI)
http:\\cpi.transparency.org
World Governance Indicators
(WGI CC, GE, RQ)
info.worldbank.org/governance/wgi
Once the social responsibility rating, firm, subsidiary, and country master data
tables were all prepared in the Research Database, the corresponding portfolio-level
measurements for each Paper 1 and Paper 2 firm were calculated combining data from all
four sources. Based on institutional distance theory, the portfolio-level measurements for
Paper 1 involved calculating the difference between attributes of each firm subsidiary
country and the firm headquarters country. Each Paper 1’s subsidiary-HQ differences
were then averaged to obtain firm-level average portfolio distances. The Paper 2
portfolio-level measurements were conceptualized to represent the firm’s overall
portfolio environment and were therefore calculated as the average of all locations,

163
163 163
163 1
63 163 163 163
163 163
including both subsidiary and headquarters in a single average per firm. Once calculated,
each of the portfolio-level measures were stored in a PORTFOLIO table.
Special scripts were also written to calculate several other measures required for
the dissertation studies, such as the Number of countries (number of distinct countries in
which the firm has a headquarters and/or subsidiary location, used in both Paper 1 and 2)
and Number of foreign subsidiaries (calculated based on count of subsidiary records for
each firm that were located in a country different than the headquarters country, used in
Paper 2). These fields were also stored in the PORTFOLIO table entry for each firm.
Once all of the portfolio-level variables were calculated, the corresponding
samples for the Paper 1 and Paper 2 firms could be exported from the Research Database
as Excel spreadsheets that were then imported into SPSS for data analysis. Table B.2
summarizes the large number of total number of records created and manipulated in the
Research Database that were required to prepare the samples for the dissertation studies.
TABLE B.2. Total count of records created in preparation of dissertation samples
Table name Total record count
CSR_CSRHUB 5,662
CSR_KLD 2,965
COMPANY 1,150
SUBSIDIARY 125,532
COUNTRY_MASTER 231
PORTFOLIO 1,150