gic’s agricultural carbon index (gic-aci) s agricultural carbon index (gic-aci) ......
TRANSCRIPT

An integrated agribusiness consulting and investment advisory fiAn integrated agribusiness consulting and investment advisory firmrm
©2009 GIC Group-Proprietary and Confidential
GIC’s Agricultural Carbon Index (GIC-ACI)
A Presentation for The Society of Government
EconomistsFebruary 18, 2010

www.GICGroup.com
Presentation Overview
Index Applications and Investment OpportunityIndex Applications and Investment Opportunity
Introduction of the GIC GroupIntroduction of the GIC Group
GIC’s Ag Carbon Index and the Carbon MarketGIC’s Ag Carbon Index and the Carbon Market

www.GICGroup.com
GIC is a 29-year old international agribusiness consulting company
Trustee Services
CarbonAdvisory Services
Program Evaluation& MarketResearch
Strategic Planning-Feasibility
StudiesExport
Consulting-MarketEntry
FinancialAdvisoryServices
GIC Group – Company Overview
www.GICGroup.com
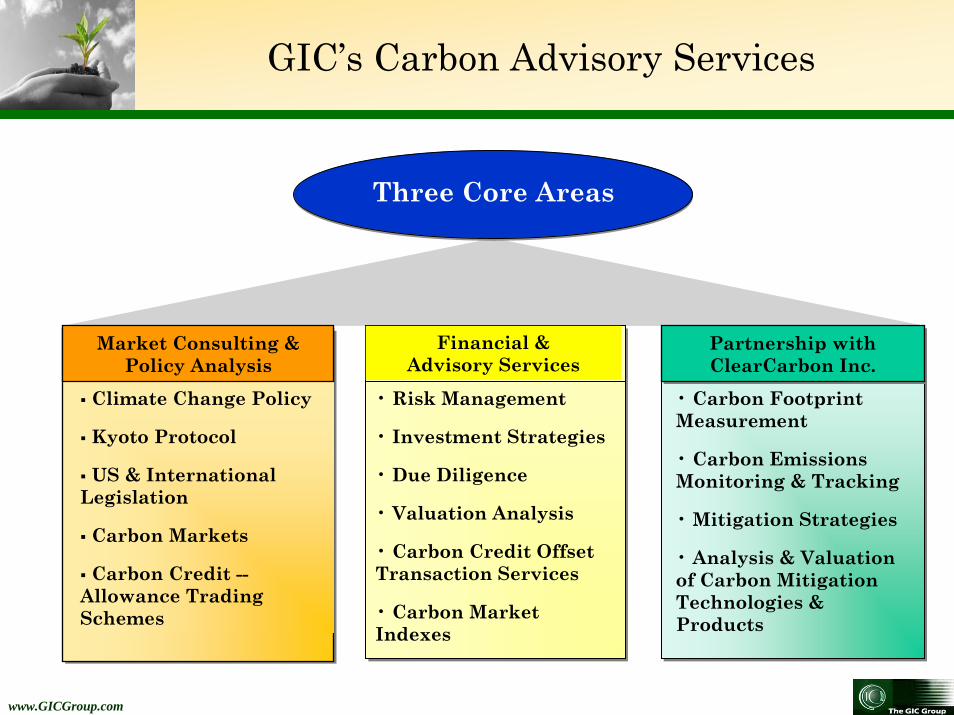
Three Core Areas
• Risk Management
• Investment Strategies
• Due Diligence
• Valuation Analysis
• Carbon Credit Offset Transaction Services
• Carbon Market Indexes
Partnership withClearCarbon Inc.Partnership withClearCarbon Inc.
• Carbon Footprint Measurement
• Carbon Emissions Monitoring & Tracking
• Mitigation Strategies
• Analysis & Valuation of Carbon Mitigation Technologies & Products
GIC’s Carbon Advisory Services
Financial &Advisory Services
Climate Change Policy
Kyoto Protocol
US & International Legislation
Carbon Markets
Carbon Credit --Allowance Trading Schemes
Market Consulting &Policy Analysis

www.GICGroup.com
GIC’s Ag Carbon Index – Overview
• Captures GHG footprint of agribusiness worldwide– Input sector– Production agriculture– Value-added sector
• Transparent, ag sector-specific carbon price discovery tool.
• Hedging instrument for carbon offsets and allowances.
• Due diligence tool for balance sheet valuation in M&A transactions.
• Instrument for estimating and valuing ag-related carbon mitigation technologies.
GICAgriculture Carbon Index
GIC-ACI
GICAgriculture Carbon Index
GIC-ACI

www.GICGroup.com
Two sub-segments: Production Agriculture and the Secondary Industries, Input and Value-Added sectors.
Developed Countries*
AdvancedDeveloping Countries*
Production AgricultureEx: Livestock, crop cultivation 5 to 25 percent 20 to 35 percent
Secondary Industries (Input & Value-Added Sectors)Ex: Chemical manufacturers, feed companies, food and beverage producers, pulp and paper mills, biofuels
5 to 15 percent 5 to 15 percent
Production agriculture and related secondary agro-industries are significant sources of methane, CO2, and N2O.
*Data based on GIC’s analysis of National GHG Inventory Reports Submitted to the UNFCCC
Agribusiness’s GHG Profile

www.GICGroup.com
• US land-based carbon sinks reduce net emissions by 1.1 gigatons of CO2 equivalent.
• Massive deforestation in Brazil and Indonesia accounts for 62% and 84% of each country’s GHG emissions.
Forest Products also highly integrated
•Timber production (primary)• Lumber• Pulp & Paper• Flooring (secondary)• Biomass/Biofuels
Land use, Land use change, and Forestry (LULUCF)
• Forest lands• Crops lands Potential Carbon Sink• Grasslands and Pasture
Forest Products Industries and Land Use Categories
www.GICGroup.com
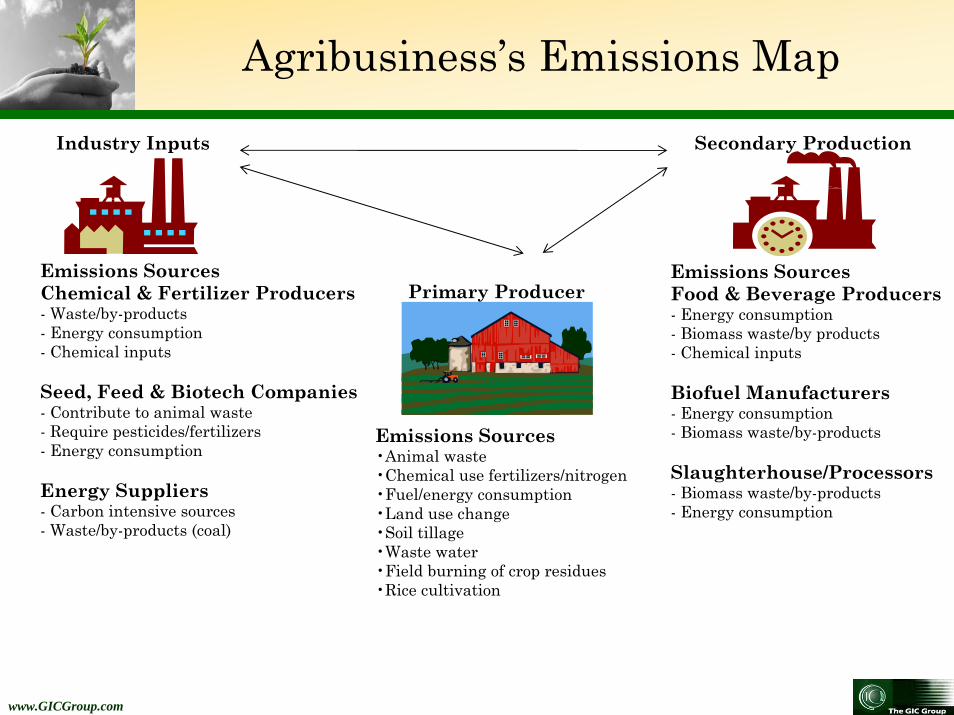
Primary Producer
Emissions Sources•Animal waste•Chemical use fertilizers/nitrogen•Fuel/energy consumption•Land use change•Soil tillage•Waste water•Field burning of crop residues•Rice cultivation
Secondary Production
Emissions SourcesFood & Beverage Producers- Energy consumption- Biomass waste/by products- Chemical inputs
Biofuel Manufacturers- Energy consumption- Biomass waste/by-products
Slaughterhouse/Processors- Biomass waste/by-products- Energy consumption
Emissions SourcesChemical & Fertilizer Producers- Waste/by-products- Energy consumption- Chemical inputs
Seed, Feed & Biotech Companies- Contribute to animal waste- Require pesticides/fertilizers- Energy consumption
Energy Suppliers- Carbon intensive sources- Waste/by-products (coal)
Industry Inputs
Agribusiness’s Emissions Map

www.GICGroup.com
Energy Use & Transport for All Segments*49%
Industry InputsFertilizers, Lime etc.
8%
Primary ProductionLivestock, Crop related soil emissions , Rice cultivation
41%
Waste SecondaryProduction
2%
*Includes the carbon emissions from biofuels and ethanol production and usage
U.S. Agribusiness Emissions Pyramid

www.GICGroup.com
Primary ProductionLivestock, Crop related soil emissions,
Rice cultivation45.8%
Industry InputsFertilizers, Lime etc.
11.2%
Energy Use & TransportAll Segments*
42.9%
Waste SecondaryProduction
.1%
*Includes the carbon emissions from biofuels and ethanol production and usage
EU-27 Agribusiness Emissions Pyramid

www.GICGroup.com
Breakdown of U.S. Ag Emissions
Share of U.S. Agribusiness GHG Emissions*
9.60%
54.30%
36.10%
Industry InputsProduction AgricultureSecondary Value-Added Production/Processing
*Data based on GIC’s analysis of National GHG Inventory Reports Submitted to the UNFCCC

www.GICGroup.com
Breakdown of EU-27 Ag Emissions
Share of Eu-27 Agribusiness GHG Emissions*
11.20%
54.80%
34.00%
Industry InputsProduction AgricultureSecondary Value-Added Production/Processing
*Data based on GIC’s analysis of National GHG Inventory Reports Submitted to the UNFCCC

www.GICGroup.com
5.25%0.77%
22.03%
0.13%7.06% 4.76% 1.48% 0.16% 1.83%
6.14%
24.23%
-56.6%
-1.9%
-0.5%
12.89%13.27%
-80%
-60%
-40%
-20%
0%
20%
40%
Ag Sub-sector
Shar
e of
Tot
al In
dust
ry E
mis
sion
s
Energy Usage Combustion & TransportEnteric FermentationManure ManagementRice CultivationAgricultural Soil Emissions (no fertilizer)Burning of Agricultural ResiduesFood & DrinkPulp & PaperLimestone Production (Sugar & Pulp/Paper Use)Soda AshNitric Acid ProductionAg Chemical Fertilizers (Lime & Urea)**Emissions from Biomass & EthanolForest LandCrop LandGrassland
US Agribusiness Emissions by Sub-sector
*Data based on GIC’s analysis of National GHG Inventory Reports Submitted to the UNFCCC

www.GICGroup.com
8.97% 9.26%
0.24%
19.99%
0.09%4.89% 3.29% 0.05% 0.01%
4.60% 6.57%
25.81%
-52.28%
5.11%0.48%
16.23%
-60%
-40%
-20%
0%
20%
40%
Ag Sub-sector
Shar
e of
Tot
al In
dust
ry E
mis
sion
s
Energy Usage Combustion & TransportEnteric FermentationManure ManagementRice CultivationAgricultural Soil Emissions (no fertilizer)Burning of Agricultural ResiduesFood & DrinkPulp & PaperLimestone Production (Sugar & Pulp/Paper Use)Soda AshNitric Acid ProductionAg Chemical Fertilizers (Lime & Urea)**Biomass Energy, Woody Biomass only*Forest LandCrop LandGrassland
EU-27 Agribusiness Emissions by Sub-sector
*Data based on GIC’s analysis of National GHG Inventory Reports Submitted to the UNFCCC

www.GICGroup.com
Emissions ReductionsChemical & Fertilizer Producers- Mitigation of waste products: nitric acid- Improved energy efficiency- Lower nitrogen chemicals
Seed, Feed & Biotech Companies- Alternative feeds, lowers methane- Biotech seeds, low tillage crops- Improved energy efficiency- Develop waste management products
Energy Suppliers- Fuel switch to low carbon sources- Utilize on-farm sources- Biomass, cellulosic alternatives
Industry Inputs
Primary Producer
Emissions Reductions•Improved waste management•Crop/seed switch•Organic chemicals/fertilizer•Animal waste to biogas•Biomass energy generation•Low tillage of soils•Carbon sequestration/land use•Improved energy efficiency
Secondary Production
Emissions SourcesFood & Beverage Producers- Improved energy efficiency- Biomass energy generation- Adopt waste management products/ technologies
Biofuel Manufacturers- Improved energy efficiency- Second generation biofuels- Biomass energy generation- Improved waste management
Slaughterhouse/Processors- Improved energy efficiency- Convert waste products into biomass for energy generation- Adopt waste management products/ technologies
Agribusiness’s Opportunity

www.GICGroup.com
Financial Gains From Introduction of Abatement Technologies
Expected cost to comply with the EPA reporting requirements to the private sector
Total cost (million)- estimated Number of Ave. cost per facility
First year Second year facilities First year Second year
$115 $72 10,000 $11,500 $7,200
Carbon footprint measurement & Emission reporting
Mitigation strategy & Emission projection
Monetization
Step 1 Step 2 Step 3
Direct saving with new carbon abatement
technologies
Additionality: carbon offsets

www.GICGroup.com
Financial Gains From Introduction of Abatement Technologies
Biotech rice seed
According to results of the trials conducted in China.
GIC‐ACI is used asa global carbon price
discovery mechanism for agribusiness

www.GICGroup.com
Overview of Global Carbon Market
The global carbon market increased 5% in 2009 in terms of value, compared with 83% in 2008. — In spite of the recession and associated decline in buyer appetite for carbon products, value increased across all major markets, including the EU ETS and the secondary CER market

www.GICGroup.com
• Source: New Energy Finance, January 2010
2009 Changes in the Carbon Market

www.GICGroup.com
• CDM project pipeline has 1460 ag-related projects, 2009– A total of 471 have been registered, of which 159 have received CERs.– Total issued CERs ag projects amount to 17.6 million or 8.1% of the
total.– Estimated value at spot price of 11.20 Euro is over 197 million Euro.
• Long-term trends and projections for Ag-related CERs by 2012– Cumulative Ag-CERs by 2012 is 457 million and by 2020 1.1 billion
Euro.– Est. cumulative value by 2012 is 5.2 billion Euro & 12.2 billion Euro by
2020.– Ag-related CERs will grow to 15% of the total value of the CDM
pipeline.
Agribusiness in the CER Market: Overview

www.GICGroup.com
Eight countries account for 86% of the ag-related projects in the CDM Pipeline
Brazil, 199
China, 131
India, 434
Indonesia, 66
Malaysia, 133
Mexico, 156
Thailand, 79
Phillipines, 63
Agribusiness in the CER Market: Breakdown by Country

www.GICGroup.com
• European Union Emissions Trading Scheme (EU-ETS)
– Primarily covers CO2 emissions* *Netherlands added allocations for 3 nitric acid plants in Phase II
– Only secondary agro-industries (food and beverage, pulp and paper, and chemical manufacturing), in the scheme.
*Account for about 4% of EU emissions.
– Production agriculture (not covered) accounts for 10% of all EU GHG emissions and other GHGs from secondary ag industries are about 5% of total EU GHG emissions.
– In Ireland, France, Denmark, Spain and Sweden, production agriculture accounts for more than 10% of all GHG emissions.
Agribusiness in the EUA Market: Overview

www.GICGroup.com
• Mexico, a major destination for CDMs, has called for binding emissions targets at the national level, as well as the creation of a NAFTA-wide cap & trade system.
– California-based Climate Action Reserve (C-CAR) recently authorized new protocols that allow for Mexican based landfill and livestock methane destruction projects to register for offset credits.
– Mexico has also pushed forward the idea of developing a $10 billion global climate fund to support offset activities and technology transfers to developing economies.
• Canada’s new baseline and credit system allows for purchase of international offsets of up to 10% of emission reduction requirements.
New International Opportunities for Agriculture & Carbon

www.GICGroup.com
• RGGI, first US regional cap & trade scheme
– 110 million allowances sold in four auctions worth more than $366 million
– Just power sector is covered.
– Offsets projects in production agriculture: livestock, biomass/fuel switch projects, afforestation
• US Cap & Trade: American Clean Energy & Security Act (ACES)
• Up to 2 billion offsets for compliance. 1 billion domestic & up to 1.5 billion international. International offsets discounted 1.25/1.
• USDA responsible for offset categories and requirements.
• A five-year moratorium on including an indirect land-use charge for biofuels. The USDA, EPA, and DOE will study and calculate impact of indirect land-use in the lifecycle GHG emissions profile of biofuels.
US Marketplace: Current Opportunities and Cap & Trade

www.GICGroup.com
1. Production Ag and secondary industries treated separately in current schemes.• Integrated agribusiness companies need transparent valuation tool.
2. Economies of scale – “games changers” missing• CDM pipeline will only produce 1.4 billion offsets by 2013, US proposal calls for 2
billion per year.• Need a sectoral approach to encourage more offset methodologies/technologies.
3. Climate change will impact ag directly and affect food and feed prices.
4. US production ag emits 518 million metric tons of CO2 equivalent per annum.
5. 25 to 50% avoidable in the near term with the right incentives.
6. Agribusiness, with projected lower marginal abatement costs, can become a major player in reducing global GHG emissions.
7. U.S. advances in mitigation technology/practices would provide farmers with offset credit premiums either through products that are grown with a particular mitigating technology or through the export of the mitigating technology/practice.
8. China with 30% of its GHG emissions tied to agribusiness has given only limited attention to the ag-sector. U.S. agriculture could utilize its comparative advantage in carbon efficiency and abatement technologies to gain a bigger foothold in this important market.
GIC-ACI: Rationale for the Index

www.GICGroup.com
Improved Energy Use & Development of Biomass Energy Alternatives
Waste Management
Land Use & Soil Sequestration
AlternativeCrops/Feed
The GIC-ACI, as a transparent, industry specific carbon index, provides a necessary tool for allocating investment capital in ag-related carbon offsets and mitigation strategies.
*Order of Pyramid and Size/Value of Mitigation Opportunities Need to Be Determined
GIC-ACI: Ag Opportunity Pyramid

www.GICGroup.com
Potential Size of Offset Market for Production Ag in US

www.GICGroup.com
Sector Weights
Production Agriculture*:
Ex. Crops & Livestock
Secondary Industries*:
Enhancement Sector
Ex. Fertilizers & Seed
Secondary Industries:Value-Added Sector*
Ex. Food, Biofuels
LULUCF* – Forest, Crop, Grazing and Pasture Land
Acreage
Regional Weights
EU-27 US Large Advanced Developing CountriesBrazil, China, India,
Indonesia, Malaysia, & Mexico*
Rest of World – Developing & Developed Countries**
*Account for nearly 90% of ag related projects in the CDM pipeline*
**Future versions will include weightings for Australia, New Zealand, Norway, Japan, and Russia and ROW (rest of world), as other regional components.
GIC-ACI: Index Design
Regional and Sectors Weightings for GIC-ACI
*Data based on GIC’s analysis of National GHG Inventory Reports Submitted to the UNFCCC

www.GICGroup.com
GHG FACTOR GROWTH MODEL: 2 Sets of Components
Macro-economic Fundamental• Domestic Output per Country/Region
(Region in case of EU-27)• Inflation*• Composite Index of Commodity Prices
*For the advanced developing countries we have used CPI instead due to a lack of time series data for PPI.
Land endowment: arable land (including crop land, grasslands, pasture, and forest land)
Annual fertilizer utilization/consumption.
Application
•Regression growth model starts at Year 2007 and projects to 2020.
•Model’s purpose is to project GHG emissions growth in the three sub-sectors by analyzing their response to the macroeconomic and fundamental variables.
•Growth model can be updated to incorporate new data and recalibrate growth trends.
•Model measures the supply/demand movement of GHG emissions/allowances.
GIC-ACI: Index Design –Growth Factor Model

www.GICGroup.com
– Base Year is 2008.
– Price based on a weighted average of current allowance and offset prices on listed future’s contracts in Europe.*
– Price escalated for inflation year-on-year and 3% growth rate based on annual reduction goals. Prices converted to dollars.
*Index price calculation is being updated to include voluntary offset credits tied to agricultural projects worldwide.
GIC-ACI: Index Model
www.GICGroup.com
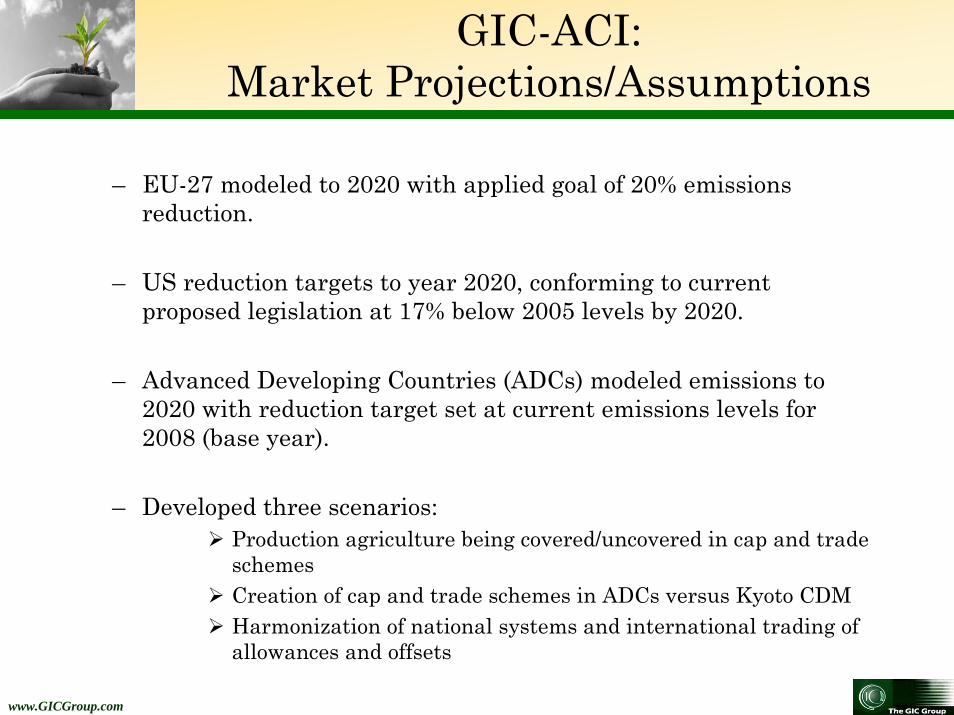
– EU-27 modeled to 2020 with applied goal of 20% emissions reduction.
– US reduction targets to year 2020, conforming to current proposed legislation at 17% below 2005 levels by 2020.
– Advanced Developing Countries (ADCs) modeled emissions to 2020 with reduction target set at current emissions levels for 2008 (base year).
– Developed three scenarios:Production agriculture being covered/uncovered in cap and trade schemesCreation of cap and trade schemes in ADCs versus Kyoto CDMHarmonization of national systems and international trading of allowances and offsets
GIC-ACI: Market Projections/Assumptions
www.GICGroup.com
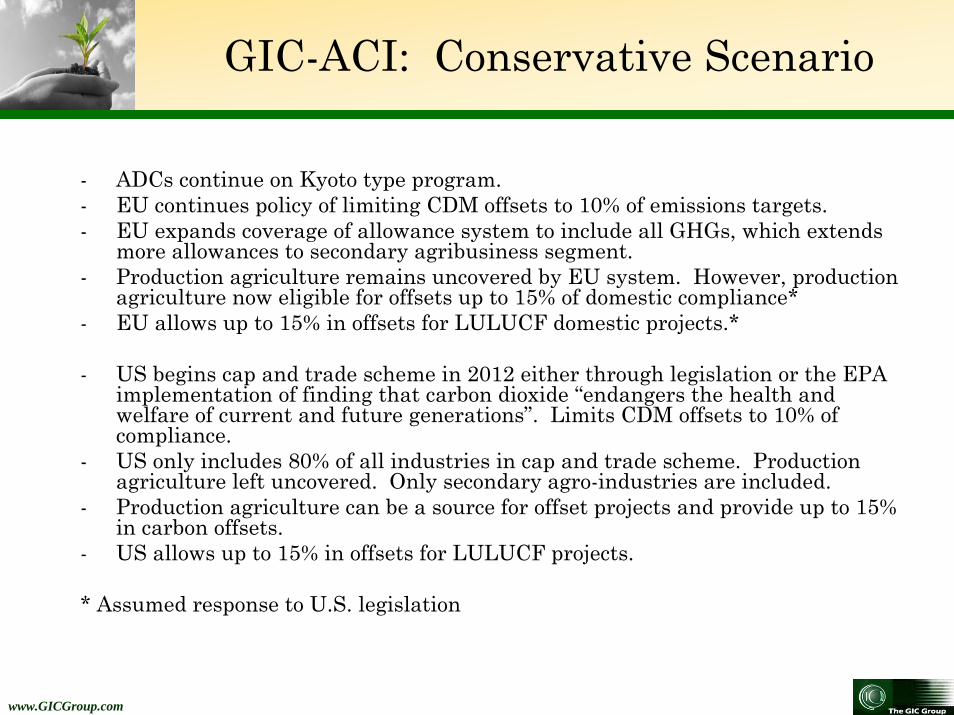
- ADCs continue on Kyoto type program.- EU continues policy of limiting CDM offsets to 10% of emissions targets.- EU expands coverage of allowance system to include all GHGs, which extends
more allowances to secondary agribusiness segment.- Production agriculture remains uncovered by EU system. However, production
agriculture now eligible for offsets up to 15% of domestic compliance*- EU allows up to 15% in offsets for LULUCF domestic projects.*
- US begins cap and trade scheme in 2012 either through legislation or the EPA implementation of finding that carbon dioxide “endangers the health and welfare of current and future generations”. Limits CDM offsets to 10% of compliance.
- US only includes 80% of all industries in cap and trade scheme. Production agriculture left uncovered. Only secondary agro-industries are included.
- Production agriculture can be a source for offset projects and provide up to 15% in carbon offsets.
- US allows up to 15% in offsets for LULUCF projects.
* Assumed response to U.S. legislation
GIC-ACI: Conservative Scenario

www.GICGroup.com
- Production agriculture receives the same treatment in the EU and the US as outlined in the conservative scenario.
- Offsets for domestic LULUCF projects in the EU-27 and the US mirrors conservative scenario.
- EU and US allow for greater use of CDM offsets up to 15% of emissions compliance targets.
- EU and US allow an additional 5% of offsets to come from LULUCF projects in developing countries.
- US begins cap and trade scheme on schedule outlined in the conservative scenario.
GIC-ACI: Moderate Scenario

www.GICGroup.com
- Kyoto revised after 2012. Large ADCs launch their own national cap and trade schemes. LULUCF offsets are not limited.
- EU establishes bi-lateral trade with large ADCs. Allowances can be exchanged across borders if cap and trade systems are harmonized.
- EU expands coverage of allowance system to include all GHGs from all economic sectors, including primary agriculture.
- EU allows up to 30% in offsets for domestic LULUCF projects.
- US begins cap and trade scheme in 2012. Establishes bi-lateral allowance trade scheme with individual large ADCs that have harmonized systems.
- US cover 100% of all industries in cap and trade scheme. Production agriculture is included.
- US allows up to 30% in offsets for LULUCF projects.
GIC-ACI: Aggressive Scenario

www.GICGroup.com
0
2000
4000
6000
8000
10000
12000
14000
2008
2009
2010
2011
2012
2013
2014
2015
2016
2017
2018
2019
2020
Year
Index Value
GIC ACI *AggressiveGIC ACI *ModerateGIC ACI *Conservative
GIC-ACI: Scenario Analysis

www.GICGroup.com
GIC-ACI Index Growth In Market Capitalization: Three Scenarios
0
200
400
600
800
1,000
1,200
1,400
1,600
1,800
2,000
2008 2009 2010 2011 2012 2013 2014 2015 2016 2017 2018 2019 2020
Bill
ions
USD
Year
Market Cap (Aggressive)Market Cap (Moderate)Market Cap (Conservative)
GIC-ACI: Market Cap Growth

www.GICGroup.com
Estimated Growth in Transaction Volume 2012-2020
0
1,000,000
2,000,000
3,000,000
4,000,000
5,000,000
6,000,000
7,000,000
Jan-1
2
Jan-1
3
Jan-1
4
Jan-1
5
Jan-1
6
Jan-1
7
Jan-1
8
Jan-1
9
Jan-2
0
Thou
sand
s
Trading Month/Year
Open Interest
GIC-ACI: Projected Volume Growth
www.GICGroup.com
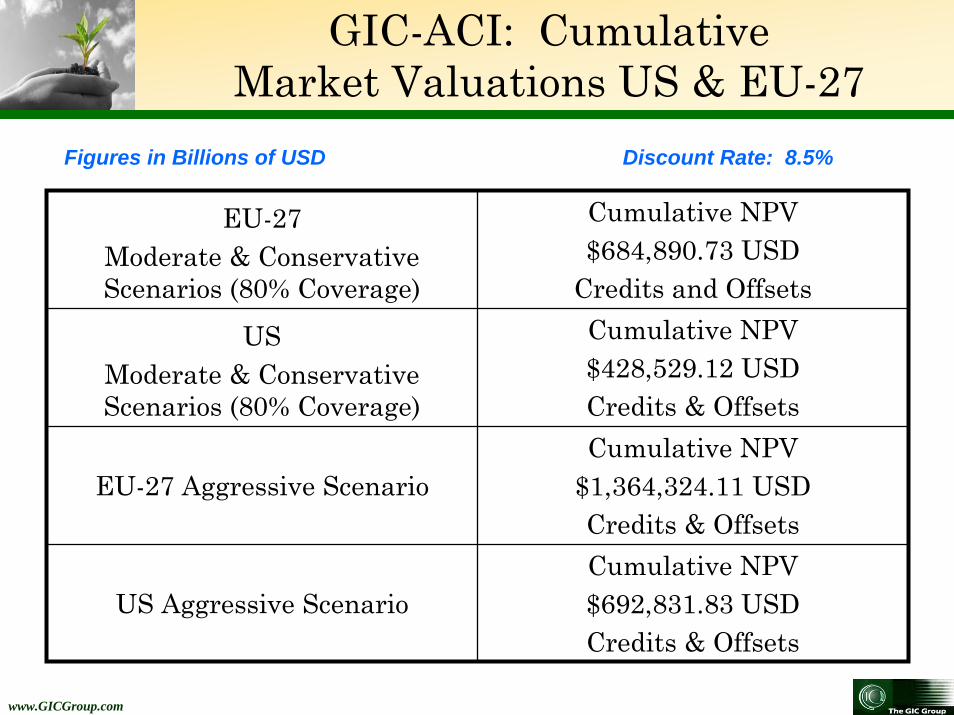
EU-27 Moderate & Conservative Scenarios (80% Coverage)
Cumulative NPV$684,890.73 USD
Credits and Offsets
US Moderate & Conservative Scenarios (80% Coverage)
Cumulative NPV$428,529.12 USDCredits & Offsets
EU-27 Aggressive ScenarioCumulative NPV
$1,364,324.11 USDCredits & Offsets
US Aggressive ScenarioCumulative NPV$692,831.83 USDCredits & Offsets
Figures in Billions of USD Discount Rate: 8.5%
GIC-ACI: Cumulative Market Valuations US & EU-27

www.GICGroup.com
Advanced Developing CountriesConservative Scenario
Cumulative NPV$115,045.48 USD
Only Offsets
Advanced Developing CountriesModerate Scenario
Cumulative NPV$172,717.62 USD
Only Offsets
Advanced Developing CountriesAggressive Scenario
Cumulative NPV$2,159.563.76 USDCredits & Offsets
Figures in Billions of USD Discount Rate: 12.00%
GIC-ACI: Cumulative Market Valuations ADCs
www.GICGroup.com
• GIC’s GHG Growth Factor model and related weights for the agribusiness sub-sectors will be updated quarterly as new forecasts and official data for the five factors become available.
• The weights for each sector (production, secondary, and LULUCF) will be updated annually based on official UNFCCC data.
• The weights for issued allowances and credits will be updated monthly.
• Recalibrate the input price and weights for offsets and allowances to include current voluntary offsets related to agribusiness.
• The index will become part of a risk analysis tool, which can be utilized to value a firm’s potential GHG footprint liability.
GIC-ACI: Evolution and Future Development

www.GICGroup.com
• Emissions from agricultural soils account for 29% and 26% of all agribusiness related GHG emissions in the US and EU-27, respectively.
• Soil emissions are about 45% of the total. Emissions from livestock are 30 to 35% of the total.
• New seed, feed, or energy use efficient technologies could generate more carbon offsets opportunities for U.S. agriculture.
• The GIC-ACI can be utilized to size and properly value the reduction potential of such technologies and create an improved monetization mechanism for U.S. producers
• Index can be used to value, trade, and cross-hedge grain and/or agricultural products derived from the new mitigation technologies.
Value Proposition of the Index

www.GICGroup.com
Relevance of the Index to U.S. Agriculture
• U.S. production agriculture more efficient in terms of GHG emissions and output.
• U.S. averages about 1.26 tons of CO2eq per hectare of agricultural land, the EU-27 about 2.6, and China about 2.1 tons per hectare.
• China’s emissions per hectare increased 3.5x from 1990.
• Other emerging markets, like Africa with poor agricultural efficiency already emit about .5 ton per hectare.
• U.S. agriculture has a competitive edge. Farmers could garner a premium for their lower carbon footprint produce by tying the offset credit to the crop.
• U.S. agriculture could become a global leader in exporting carbon efficient technologies to other markets with substantial high GHG emitting ag-industries.

Agribusiness consulting services
Investment advisory servicesGlobal Food Safety Forum (GFSF)Carbon advisory services
GIC GroupGIC Group1434 Duke Street
Alexandria, VA 22314 USATel. 703-684-1366Fax: 703-684-1369
web: www.gicgroup.com
©2009 GIC Group- Proprietary and confidential