half year 2017 financial results presentation · full year 2017 results presentation bravura...
TRANSCRIPT

Full Year 2017 Results PresentationBravura Solutions Limited
23rd August 2017

PAGE 2BRAVURA SOLUTIONS | PRESENTATION
The information contained in this document (including this notice) or discussed at this presentation (collectively, the Presentation) has been prepared by Bravura Solutions Limited (Bravura).The Presentation is subject to the conditions outlined below. Your receipt or viewing of the Presentation evidences your acceptance of those conditions and that you agree to be bound by them.NO OFFER OF SECURITIESThe Presentation is not a prospectus, product disclosure statement disclosure document or other offer document under Australian law or under any other law. It does not and is not intended to constitute an offer for subscription, financial product advice, invitation, solicitation or recommendation by any person or to any person with respect to the purchase or sale of any securities or financial products in any jurisdiction, and also does not form the basis of any contract or commitment to sell or apply for securities in Bravura or any of its subsidiaries (Bravura Group).The information contained in the Presentation has been prepared without taking account of any person's investment objectives, financial situation or particular needs and noting contained in the Presentation constitutes investment, legal, tax or other advice. You must not rely on the Presentation but make your own independent assessment and rely upon your own independent taxation legal, financial or other professional advice.FINANCIAL DATAAll information in the Presentation is in Australian dollars.The Presentation contains pro forma financial information. Such pro forma financial information has not been prepared in accordance with disclosure requirements of applicable accounting standards and other mandatory reporting requirements in Australia.Financial data calculating totals and percentages may be subject to rounding.FORWARD STATEMENTSNo representation or warranty, expressed or implied, is made as to the adequacy or completeness of the information and opinions contained in the Presentation.The Presentation may contain certain forward looking statements, including estimates, projections and opinions (Forward Statements). We use words such 'will', 'may', 'intend', 'seek', 'would', 'should', 'could' 'continue' 'plan', 'probability', 'risk', 'forecast', 'likely', 'estimate', 'anticipate', 'believe', or similar words to identify Forward Statements. Forward Statements may involve known and unknown risks and uncertainties and other factors, many of which are beyond the control of the Bravura Group, and have been made based upon management's expectations and beliefs concerning future developments and their potential effect on us. No representation is made or will be made that any Forward Statements will be achieved or will prove correct. Actual future results and operations could vary materially from the Forward Statements. Circumstances may change and the contents of this Presentation may become outdated as a result.PAST PERFORMANCEPast performance information given in this presentation is given for illustrative purposes only and should not be relied upon (and is not) an indication of future performance.DISCLAIMERThe information is supplied in summary form and is therefore not necessarily complete. The material contained in this presentation may include information derived from publicly available sources that have not been independently verified. No representation or warranty is made as to the accuracy, completeness or reliability of the information.To the maximum extent permitted by law, the Bravura Group and each of its affiliates, directors, employees, officers, partners, agents and advisers and any other person involved in the preparation of the Presentation disclaim all liability and responsibility (including without limitation, any liability arising from fault or negligence) for any direct or indirect loss or damage which may arise or be suffered through use or reliance on anything contained in, or omitted from, the Presentation. The Bravura Group accept no responsibility or obligation to inform you of any matter arising or coming to their notice, after the date of the presentation or this document, which may affect any matter referred to in the Presentation.This presentation should be read in conjunction with Bravura's other periodic and continuous disclosure announcements lodged with the ASX, which are available at www.asx.com.au.
Important notice and disclaimer

PAGE 3BRAVURA SOLUTIONS | PRESENTATION
Today’s presenters
Martin DedaTony Klim
Chief Financial OfficerChief Executive Officer

PAGE 4BRAVURA SOLUTIONS | PRESENTATION
Full Year 2017 highlights
Financial performance by Segment
Full Year 2018 Outlook
Q&A
Appendix – Additional financial information
Who we are
Agenda

Full Year 2017 highlights

PAGE 6BRAVURA SOLUTIONS | PRESENTATION
Full year 2017 highlights
• FY 2017 pro forma1 results exceeded prospectus forecasts across key metrics
• Four major new Sonata sales in Australia, UK, and South Africa
• Sonata now represents 48% of group revenues and expected to continue to drive strong financial performance
• Bravura’s expansion into South Africa confirmed with signing of STANLIB, a significant Wealth Management
business in South Africa, on Sonata
• Two new Funds Administration SaaS sales completed
• Sales pipeline remains strong with no visible impact from BREXIT other than FX
• Strong free cash flow generation, resulting in net cash position of $11.4 million at 30 June 2017
• Dividend declared of 4.5 cents per share, representing 70% of pro-rata2, pro forma NPAT
Sonata’s modern, open architecture and digital capabilities have driven client adoption and developed a market leading position
Notes:1 Pro forma NPAT has been prepared consistently with the IPO Prospectus, adjusting for the removal of the impact of $2.7m IPO t ransaction fees and the Company’s historical capital structure (FY
2017 $4.2m of net finance expense and FY 2016 $11.5m of net finance expense). 2 Pro-rata pro forma NPAT for the 7.5 months between IPO and 30 June 2017.

PAGE 7BRAVURA SOLUTIONS | PRESENTATION
Prospectus pro forma1 forecasts exceeded
• Revenue of $191.9 million exceeded prospectus forecast of
$187.6 million by 2.3%
• Pro forma1 EBITDA $32.6 million exceeded prospectus
forecast of $32.3 million by 0.8%
• Wealth Management Revenue exceeded prospectus forecast
by 0.9%, with 4 new Sonata clients signed
• Funds Administration Revenue and Operating EBITDA
exceeded prospectus forecast by 4.9% and 4.0% respectively
• Pro forma1 NPAT at $22.3 million exceeded prospectus
forecast of $21.0 million by 6.0%
• R&D Capex increase driven by additional investment for South
African regulatory requirements
• Pro forma1 Operating Cash flow of $24.1 million lower than
prospectus forecast due to timing of customer receipts and fees
paid in advance
• Net cash of $11.4 million as at 30 June 2017
Revenue, pro forma1 EBITDA and NPAT, outperform prospectus forecasts
Notes:1 Pro forma EBITDA and NPAT have been prepared consistently with the IPO Prospectus, adjusting for the removal of the impact of $2.7m IPO transaction fees and the Company’s
historical capital structure (FY 2017 $4.2m of net finance expense and FY 2016 $11.5m of net finance expense)2 Pro forma EBITDA plus change in working capital. Excludes taxes paid. Refer to page 253 Return on assets is calculated on closing assets as at 30 June
FY 2017 FY 2017 ChangeA$m Pro forma1 IPO Forecast %Group:Revenue 191.9 187.6 2.3%Segment Operating EBITDA 62.0 60.8 2.0%EBITDA 32.6 32.3 0.8%NPAT 22.3 21.0 6.0%Key metrics:Group Revenue growth vs prior year 3.9% 1.6%Wealth Management Revenue 122.7 121.6 0.9%Funds Administration Revenue 69.2 66.0 4.9%Wealth Management Operating EBITDA 30.3 30.3 0.0%Funds Administration Operating EBITDA 31.7 30.5 4.0%
Sonata Revenue 92.8 92.0 0.9%Number of new Sonata sales 4 n/a
R&D Capex 7.7 6.6 -17.2%Operating Cashflow2 24.1 32.0 -24.7%Net cash 11.4 n/a
30-Jun-17 30-Jun-16Other: Pro forma1 Pro forma1 ChangeReturn on Assets3 12.2% 4.6% 7.6%Return on Equity 21.0% 7.9% 13.1%
PAGE 8BRAVURA SOLUTIONS | PRESENTATION
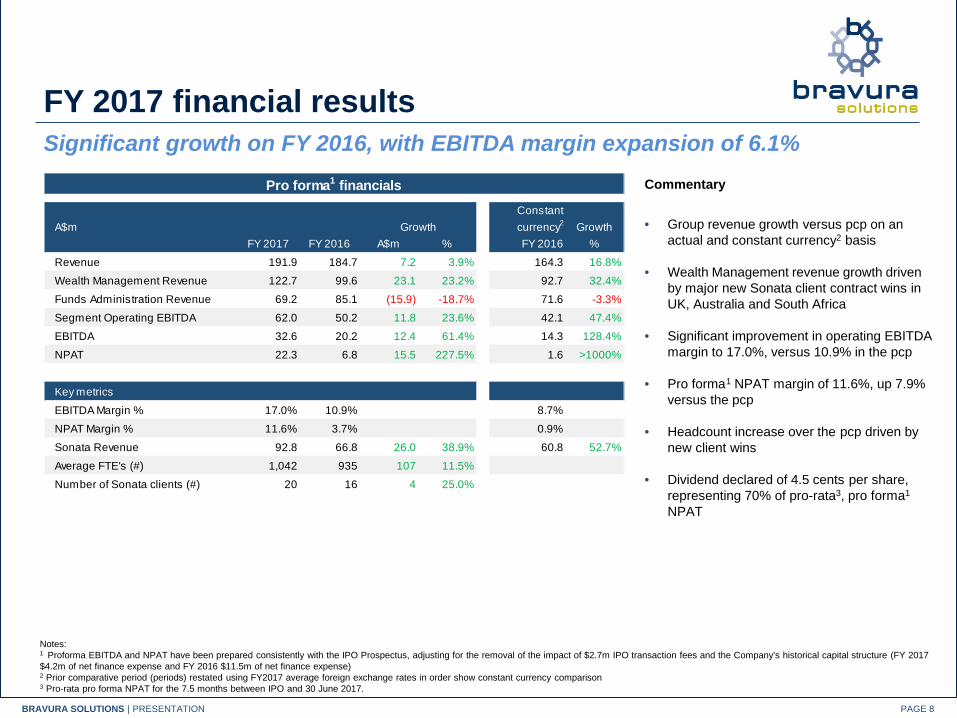
Commentary
• Group revenue growth versus pcp on an actual and constant currency2 basis
• Wealth Management revenue growth driven by major new Sonata client contract wins in UK, Australia and South Africa
• Significant improvement in operating EBITDA margin to 17.0%, versus 10.9% in the pcp
• Pro forma1 NPAT margin of 11.6%, up 7.9% versus the pcp
• Headcount increase over the pcp driven by new client wins
• Dividend declared of 4.5 cents per share, representing 70% of pro-rata3, pro forma1
NPAT
Significant growth on FY 2016, with EBITDA margin expansion of 6.1%FY 2017 financial results
Notes:1 Proforma EBITDA and NPAT have been prepared consistently with the IPO Prospectus, adjusting for the removal of the impact of $2.7m IPO transaction fees and the Company’s historical capital structure (FY 2017 $4.2m of net finance expense and FY 2016 $11.5m of net finance expense)2 Prior comparative period (periods) restated using FY2017 average foreign exchange rates in order show constant currency comparison3 Pro-rata pro forma NPAT for the 7.5 months between IPO and 30 June 2017.
Pro forma1 financialsConstant currency2
FY 2017 FY 2016 A$m % FY 2016 %Revenue 191.9 184.7 7.2 3.9% 164.3 16.8%Wealth Management Revenue 122.7 99.6 23.1 23.2% 92.7 32.4%Funds Administration Revenue 69.2 85.1 (15.9) -18.7% 71.6 -3.3%Segment Operating EBITDA 62.0 50.2 11.8 23.6% 42.1 47.4%EBITDA 32.6 20.2 12.4 61.4% 14.3 128.4%NPAT 22.3 6.8 15.5 227.5% 1.6 >1000%
Key metricsEBITDA Margin % 17.0% 10.9% 8.7%NPAT Margin % 11.6% 3.7% 0.9%Sonata Revenue 92.8 66.8 26.0 38.9% 60.8 52.7%Average FTE's (#) 1,042 935 107 11.5%Number of Sonata clients (#) 20 16 4 25.0%
A$m Growth Growth

Financial performance by Segment

PAGE 10BRAVURA SOLUTIONS | PRESENTATION
Wealth Management pro forma EBITDA and MarginNew sales of Sonata driving Wealth Management segment revenue growth
Commentary
• Wealth Management segment revenue growth driven by new Sonata sales and increase in professional services revenue from existing clients
• On a constant currency1 basis Sonata revenue grew 52.7%
• Operating EBITDA margins increased through higher operating leverage driven by major new Sonata contracts signed in UK, South Africa and Australia
• Expansion into South Africa confirmed with signing of STANLIB, a significant Wealth Management business in South Africa, our first Sonata client win in Africa
Notes:1 FY 2016 restated using FY 2017 average foreign exchange rates in order show constant currency comparison
Pro forma financials
A$m FY 2017 FY 2016 Growth %Constant
currency1
FY 2016Growth %
Wealth Management revenue 122.7 99.6 23.2% 92.7 32.4%
Sonata Revenue 92.8 66.8 38.9% 60.8 52.7%
Segment operating EBITDA 30.3 10.0 203.1% 8.6 252.3%
Segment operating EBITDA Margin %
24.7% 10.0% 9.3%
Pro forma Segment Operating EBITDA (A$m)
8.7 10.0
30.3 11.4% 10.0%
24.7%
0.0%
5.0%
10.0%
15.0%
20.0%
25.0%
30.0%
-
5.0
10.0
15.0
20.0
25.0
30.0
35.0
FY 2015 FY 2016 FY 2017

PAGE 11BRAVURA SOLUTIONS | PRESENTATION
Commentary
• Sonata revenue of 92.8 million in line with prospectus forecast of 92.0 million
• FY 2017 growth of +52.7% versus pcp on a constant currency1
basis, driven by 4 major new Sonata sales in Australia, UK, and South Africa
• Sonata has large and growing pipeline which will continue to drive growth in Wealth Management segment
• 20 Sonata clients
Sonata now represents 48% of group revenues and is expected to continue to drive strong financial performance
Wealth Management (continued)
Notes:1 FY 2016 restated using FY 2017 average foreign exchange rates in order show constant currency comparison
Constant Currency1 Revenue Growth (A$m)
21.6 38.1
60.8 92.8
16%
27%
37%
48%
0%
10%
20%
30%
40%
50%
60%
-
50.0
100.0
150.0
200.0
FY 2014 FY 2015 FY 2016 FY 2017
Sonata Group Sonata as % of Total
132.5142.0
164.3
191.9
A$m FY2013 FY2014 FY2015 FY2016 FY2017
Number of clients 3 10 12 16 20
Average actual revenue per client $1.7m $2.2m $3.4m $4.2m $4.6m

PAGE 12BRAVURA SOLUTIONS | PRESENTATION
Funds Administration pro forma EBITDA and marginHigh margin Funds Administration business beats prospectus forecast and continues to provide stable, strong cash flows
Commentary
• Revenue and costs are denominated 85% and 77% in GBP, respectively. This impacted pcp comparisons on an actual currency basis as a result of the depreciation of the pound sterling over 2017
• On a constant currency1 basis Funds Administration segment revenue remained roughly in line with the pcp
• Operating EBITDA margins remained stable versus the pcp
• Strong pipeline outlook, with new pipeline prospects for Sonata sales to Funds Administration clients
• Two new SaaS sales completed
Notes:1 FY 2016 restated using FY 2017 average foreign exchange rates in order show constant currency comparison
Pro forma financials
A$m FY 2017 FY 2016 Growth %Constant
currency1
FY 2016Growth %
Funds Administration revenue 69.2 85.1 -18.7% 71.6 -3.3%
Segment operating EBITDA 31.7 40.2 -21.1% 33.5 -5.2%
Segment operating EBITDA Margin %
45.8% 47.2% 46.8%
Pro forma Segment Operating EBITDA margin
41.3%
47.2%
45.8%
38%
40%
42%
44%
46%
48%
50%
52%
FY 2015 FY 2016 FY 2017
PAGE 13BRAVURA SOLUTIONS | PRESENTATION
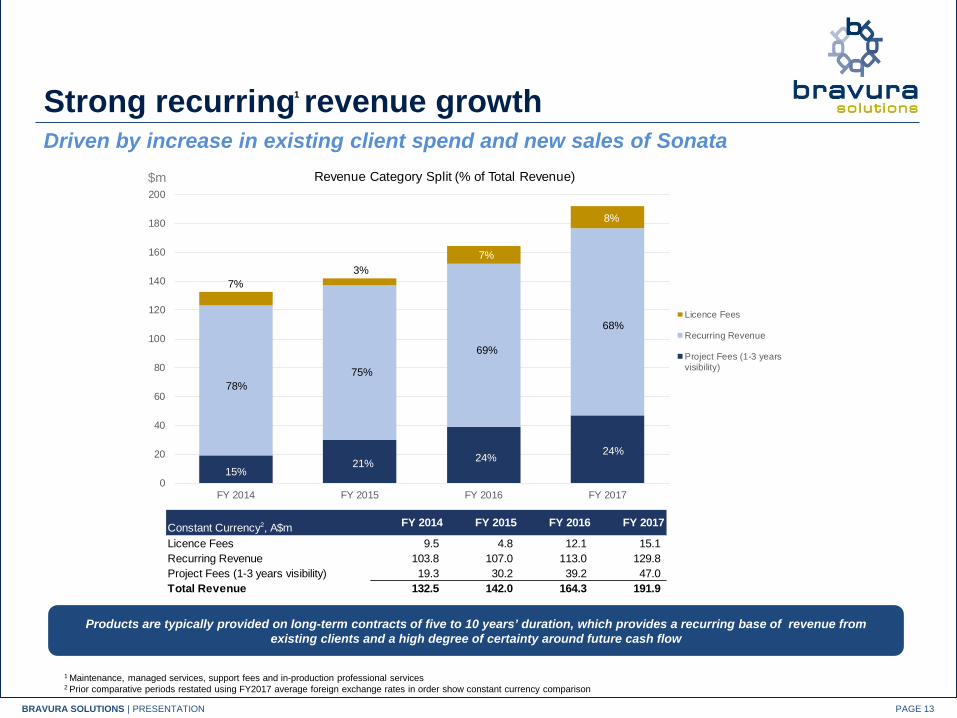
Strong recurring revenue growthDriven by increase in existing client spend and new sales of Sonata
62%
38%44%
1
1 Maintenance, managed services, support fees and in-production professional services2 Prior comparative periods restated using FY2017 average foreign exchange rates in order show constant currency comparison
Products are typically provided on long-term contracts of five to 10 years’ duration, which provides a recurring base of revenue from existing clients and a high degree of certainty around future cash flow
57%
38%43% 43%15%
21% 24%
7%
8%
Constant Currency2, A$m FY 2014 FY 2015 FY 2016 FY 2017
Licence Fees 9.5 4.8 12.1 15.1 Recurring Revenue 103.8 107.0 113.0 129.8 Project Fees (1-3 years visibility) 19.3 30.2 39.2 47.0 Total Revenue 132.5 142.0 164.3 191.9
19.3 30.2
39.2 47.0
0
20
40
60
80
100
120
140
160
180
200
FY 2014 FY 2015 FY 2016 FY 2017
Revenue Category Split (% of Total Revenue)
Licence Fees
Recurring Revenue
Project Fees (1-3 yearsvisibility)
68%
69%
75%78%
7%3%
7%
8%
24%24%21%15%
$m

PAGE 14BRAVURA SOLUTIONS | PRESENTATION
Investing in SonataSignificant investment in human capital to meet new client demand
1 Constant currency: Prior years restated using FY 2017 monthly average exchange rates
Revenue per FTE (A$000) FY 2015 FY 2016 FY 2017
Revenue (A$m)1 142.0 164.3 191.9 Average number of FTE's (#) 870 935 1,042 Revenue per FTE (A$000) 163.2 175.8 184.2
0
5
10
15
20
25
0
200
400
600
800
1,000
1,200
FY2013 FY2014 FY2015 FY2016 FY2017
Growth in FTE's and number of Sonata clients (June year end)
Number of FTE's (30th June) Cumulative Sonata Clients (#)
FTE# of Sonata
clients

PAGE 15BRAVURA SOLUTIONS | PRESENTATION
Sonata research and developmentDevelopment capital expenditure is expected to decrease following FY 2017 as non-client funded development reduces and more development is client funded
Commentary
• Total Sonata R&D expenditure of $24.0 million in FY 2017, $7.7 million of which was Capitalised. $13.7m was expensed.
• Main development capex related to new modules for:
• Defined benefits
• Group life
• Multi currency
• South Africa
Client-funded development is charged to clients as professional services revenue and is not capitalised. Consequently, development capital expenditure is expected to decrease in the future as non client-funded development reduces and more development is client-funded.
Development Expenditure (A$m)
FY 2014 FY 2015 FY 2016 FY 2017 IPO ForecastSonata Development Revenue 5.0 11.2 13.9 13.5 17.8 Sonata Development Costs (5.4) (12.0) (11.1) (13.7) (15.2)
Net Sonata development (costs) / revenue (0.4) (0.8) 2.8 (0.2) 2.6
Development Operating expense (1.7) (2.2) (2.1) (2.5) (2.6) Development Capital expense (5.5) (8.8) (4.0) (7.7) (6.6)
Total Development Expenditure (7.2) (11.0) (6.1) (10.3) (9.2) Net Sonata development (7.6) (11.8) (3.3) (10.5) (6.6)
Sonata Revenue 22.1 41.4 66.8 92.8 92.0 Total expenditure1 (12.6) (23.0) (17.2) (24.0) (24.4) Total expenditure as a % of Sonata Revenue 57% 56% 26% 26% 27%
1 Total expenditure represents the sum of Sonata development costs and total development expenditure

PAGE 16BRAVURA SOLUTIONS | PRESENTATION
Summary 2017
• Listed on the Australian Stock Exchange (BVS:ASX) on the 16th November 2016
• Key financial metrics above prospectus forecast and well above pcp
• Strong revenue growth up 3.9% to $191.9m (up 16.8% in constant currency)
• Strong pro forma EBITDA growth up 61.4% to $32.6m (up 128.4% in constant currency). Pro forma EBITDA
margin 17.0% versus 10.9% pcp.
• 4 major new Sonata client wins across Australia, South Africa and the UK
• 2 new Funds Administration SaaS client wins
• Return on Equity on a pro forma basis 21.0%, up 13.1 percentage points on pcp of 7.9%
A record year, driven by new Sonata sales
PAGE 17BRAVURA SOLUTIONS | PRESENTATION
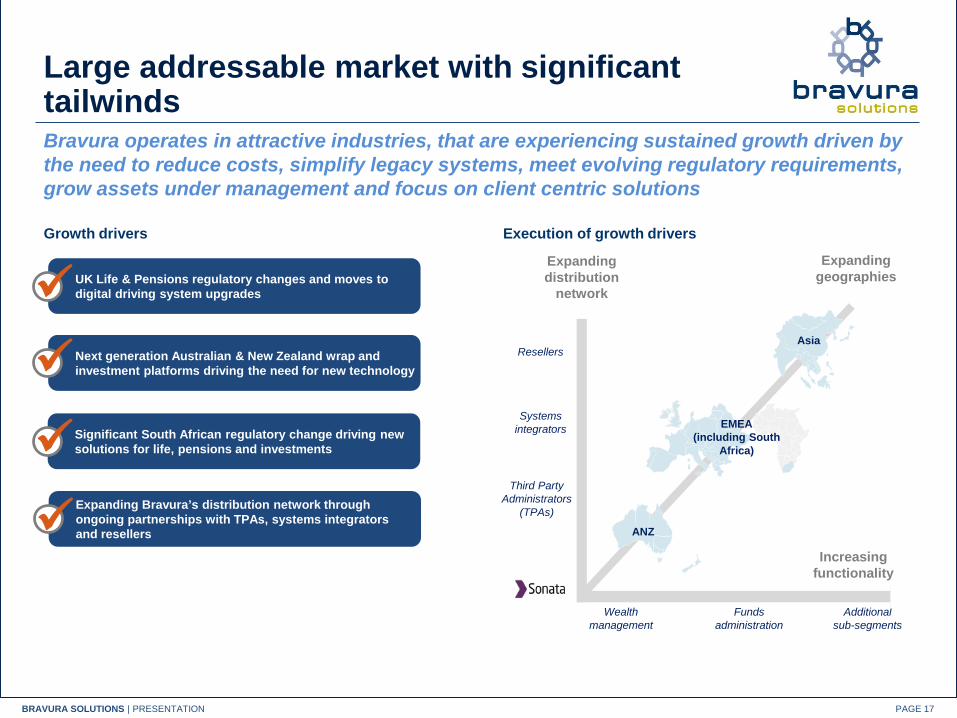
Execution of growth driversGrowth drivers
UK Life & Pensions regulatory changes and moves to digital driving system upgrades
Next generation Australian & New Zealand wrap and investment platforms driving the need for new technology
Expanding Bravura’s distribution network through ongoing partnerships with TPAs, systems integrators and resellers
Significant South African regulatory change driving new solutions for life, pensions and investments
Systems integrators
Additional sub-segments
Expandingdistribution
network
Increasing functionality
Expandinggeographies
Asia
ANZ
Third Party Administrators
(TPAs)
Funds administration
Resellers
EMEA(including South
Africa)
Wealth management
Large addressable market with significant tailwindsBravura operates in attractive industries, that are experiencing sustained growth driven by the need to reduce costs, simplify legacy systems, meet evolving regulatory requirements, grow assets under management and focus on client centric solutions

PAGE 18BRAVURA SOLUTIONS | PRESENTATION
Outlook for FY 2018
• Sales pipeline remains strong with no visible impact from BREXIT other than FX
• Continue roll out of Sonata in core geographies, and expand sales of Sonata into new geographies
• Additional new pipeline opportunities for Sonata in the Funds Administration Segment and further Funds Administration SaaS sales
• Foreign exchange assumptions consistent with FY 2017
• Development capital expenditure is expected to decrease following FY 2017 as non-client funded development reduces and more development is client funded
EPS Growth in mid teens
1

Q&A
APPENDIX
Full Year 2017 Financial results

PAGE 21BRAVURA SOLUTIONS | PRESENTATION
Income Statement
Commentary
The prospectus Forecast was based on Fixed exchange rates hence no Financing FX gain/loss was Forecast. The FX financing los s of $0.8m in FY17 was incurred from exchange rate fluctuations impacting intercompany financing positions month to month.
Net finance expense primarily relates to the cost of the debt facilities repaid at IPO.
Notes:1 Proforma EBITDA and NPAT have been prepared consistently with the IPO Prospectus, adjusting for the removal of the impact of $2.7m IPO transaction fees and the Company’s historical capital structure (FY 2017 $4.2m of net finance expense and FY 2016 $11.5m of net finance expense)
Statutory Result Pro forma1 Result
ActualIPO
Forecast ActualIPO
Forecast2017 2017 2017 2017
Wealth Management revenue 122.7 121.6 0.9% 122.7 121.6 0.9%Funds Administration revenue 69.2 66.0 4.9% 69.2 66.0 4.9%Revenue 191.9 187.6 2.3% 191.9 187.6 2.3%Total operating expenses 159.3 155.0 -2.8% 159.3 155.3 -2.6%IPO transaction fees 2.7 2.7 EBITDA 29.9 29.8 0.2% 32.6 32.3 0.8%Depreciation and amortisation expense 8.3 8.4 1.8% 8.3 8.4 1.7%EBIT 21.6 21.4 1.0% 24.4 23.8 2.4%Financing FX losses 0.8 0.0% 0.0%Net finance expense 4.2 4.6 9.4% (0) 0.2 120.0%NPBT 16.7 16.9 -1.4% 24.4 23.6 3.5%Income tax expense 2.2 2.6 14.8% 2.2 2.6 16.9%NPAT 14.4 14.3 1.0% 22.3 21.0 6.0%
A$m Change (%)
Change (%)
PAGE 22BRAVURA SOLUTIONS | PRESENTATION
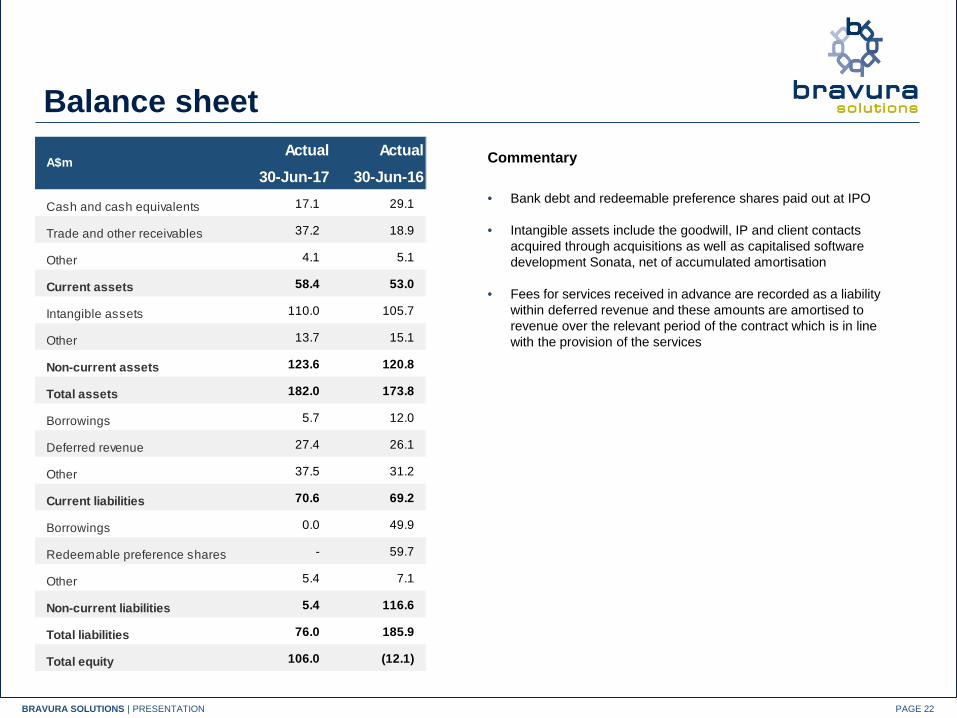
Balance sheet Actual Actual
30-Jun-17 30-Jun-16
Cash and cash equivalents 17.1 29.1
Trade and other receivables 37.2 18.9
Other 4.1 5.1
Current assets 58.4 53.0
Intangible assets 110.0 105.7
Other 13.7 15.1
Non-current assets 123.6 120.8
Total assets 182.0 173.8
Borrowings 5.7 12.0
Deferred revenue 27.4 26.1
Other 37.5 31.2
Current liabilities 70.6 69.2
Borrowings 0.0 49.9
Redeemable preference shares - 59.7
Other 5.4 7.1
Non-current liabilities 5.4 116.6
Total liabilities 76.0 185.9
Total equity 106.0 (12.1)
A$m Commentary
• Bank debt and redeemable preference shares paid out at IPO
• Intangible assets include the goodwill, IP and client contacts acquired through acquisitions as well as capitalised software development Sonata, net of accumulated amortisation
• Fees for services received in advance are recorded as a liability within deferred revenue and these amounts are amortised to revenue over the relevant period of the contract which is in line with the provision of the services

PAGE 23BRAVURA SOLUTIONS | PRESENTATION
Net free cash flow
Commentary
• Bank debt and redeemable preference shares paid out at IPO
• Continued strong operational cash flow to EBITDA conversion
• Pro forma net free cash flow conversion ratio is 39.3%
Pro forma Net cash flow variance against the IPO Forecast is largely caused by the timing of receipts, which follows cyclical invoicing cycles of Funds Administration contracts in general and annual maintenance fees across all contracts
Statutory Result Pro forma ResultActual Forecast Actual IPO
Forecast2017 2017 2017 2017
EBITDA 29.9 29.8 32.6 32.3
Changes in working capital (12.4) (2.4) (8.5) (0.3)
Capital expenditure - property plant and equipment (3.6) (4.0) (3.6) (4.0)
Development expenditure (7.7) (6.6) (7.7) (6.6)
Net free cash flow 1 6.2 16.8 12.8 21.4
Tax (1.6) (2.6) (1.6) (2.6)
Interest (1.2) (1.3) - (0.3)
Proceeds from issue of Shares 101.1 100.5
Repayment of borrowings (58.6) (62.9)
Redemption of Ironbridge Redeemable Preference Shares 2 (62.7) (59.7)
Proceeds from borrowings 6.0 - 6.0
Net cash flow (10.7) (9.1) 17.2 18.5
Net free cash flow conversion (%) 20.7% 56.4% 39.3% 66.2%
1 Excludes taxes paid, consistent with table 4/7 in IPO prospectus on page 682 Refer note 7 on table 4.7 in IPO prospectus on page 69
June year end, A$m

PAGE 24BRAVURA SOLUTIONS | PRESENTATION
Statutory Cash flow versus pcpActual Actual
30-Jun-17 30-Jun-16
Receipts 208.8 220.1
Payments (187.4) (190.1)
Payments of IPO transaction fees (4.0) -
Taxes Paid (1.6) (1.7)
Cash flow from operating activities 15.9 28.3
Cash flow from investing activities (11.3) (7.2)
Proceeds from share issue 114.6 -
Payments of IPO transaction costs (13.3) -
Repayment and interest of bank and finance lease facilities (53.9) (10.7)
Redemption of RPS (62.7) -
Cash flow from financing activities (15.3) (10.7)
Total cash flow (including currency impact) (10.7) 10.4
Cash and cash equivalents at end of year 17.1 29.1
A$000Commentary
• Bank debt and redeemable preference shares paid out at IPO
• Strong cash generation in FY 2017
• Continued strong operational cash flow to EBITDA conversion
• Operating cash flow to EBITDA conversion ratio is 48.6%

Who we are

PAGE 26BRAVURA SOLUTIONS | PRESENTATION
Who we areBravura is a market leading global provider of enterprise software and software-as-a-service (SaaS) to the wealth management and funds administration industries
Attractive financial profile, demonstrated by high revenue growth and increasing operating leverage
$192m FY2017 revenue
108% FY13–17A Sonata revenue
CAGR
>$100m Investment in Sonata software over 11 years
5-10yrLong-term client contracts
Rapid adoption of Sonata
20 New and existing blue-chip clients
Sonata Revenue
$93m FY2017 39% growth on FY2016
Supported by large addressable market with favourable industry tailwinds
More than $100 million invested in Sonata to date, flagship software product investment continues
More than 75 blue chip clients with $2.5 trillion AUA across 12 countries
Sticky long term revenue driven by upgrades, product extensions and recurring license and maintenance income
Rapid adoption of Sonata, a market leading Wealth Management / Funds Administration software product, now represents 48% of revenue

PAGE 27BRAVURA SOLUTIONS | PRESENTATION
Sonata has taken significant market share and has a huge market opportunitySonata enables clients to consolidate multiple legacy IT platforms into a unified, customer-centric solution
Unified, customer-centric solutionAdvisors & Clients
Digital multi-channel delivery
Single, configurable code base
Common Customer DB and Registry
CONSOLIDATES MULTIPLE PRODUCTS
Siloed, disparate legacy IT systems
Advisors & Clients
Move to true customer centric solution
CustomerDB & Registry 1
PRODUCT
1
Product Engine 1
Call centre 1
Customer DB & Registry
2
PRODUCT
2
Product Engine 2
Call centre 2
Customer DB & Registry
3
PRODUCT
3
Product Engine 3
Call centre 3
Sales driven by regulatory changes, cost pressure, digitisation and mobile

PAGE 28BRAVURA SOLUTIONS | PRESENTATION
Sonata addresses the key challenges faced by participants in a range of market segmentsBravura’s flagship product supports a wide range of financial products and supporting processes in a number of geographies
Sonata has the functionality of all of the heritage and established products
Financial Products Supported Wrap
platformsSuperannuation (incl. KiwiSaver) & pension
Investment products
Life insurance
Private wealth & portfolio admin
Funds administration
Processes
Front-office Middle-office Back-office
New product creation
Product distribution
Administration, workflow and correspondence
Compliance andauditing
Valuations and modelling
FeaturesUnified digital platform accessible across multiple devices
Modern solution available as an installed or hosted model
Processes multiple financial products
Compliant across multiple jurisdictions Highly secure
record keeping Scalable, modern technology

Thank you