hudson’s bay company - shareholderfiles.shareholder.com/downloads/amda-1etykl/0x0x... · diverse...
TRANSCRIPT

H U D S O N ’ S B A Y C O M P A N Y
2 0 1 4 A N N U A L R E P O R T

CELEBRATING A RICH AND STORIED HERITAGEAS NORTH AMERICA’S OLDEST COMPANY.

DRIVING GROWTH THROUGH ICONIC RETAIL BRANDS AND A DYNAMIC REAL ESTATE PORTFOLIO.

DIVERSEGEOGRAPHICFOOTPRINT
HUDSON’S BAY
SAKS FIFTH AVENUE
LORD & TAYLOR
SAKS FIFTH AVENUE OFF 5TH
HOME OUTFITTERS
STORE COUNT PER NORTH AMERICAN REGION

23
15182
3
910
5
2
9
12
1
11
1
1
1
1
1
2
1

2
16
4
4
4
3
103134
2
8
3
1
4
1
1
1
3
3
2
21
2
1
1
1
11
21
2
1
10
1
1 1
1
1
26
12
1
125
1
1
1
2
31
21
21
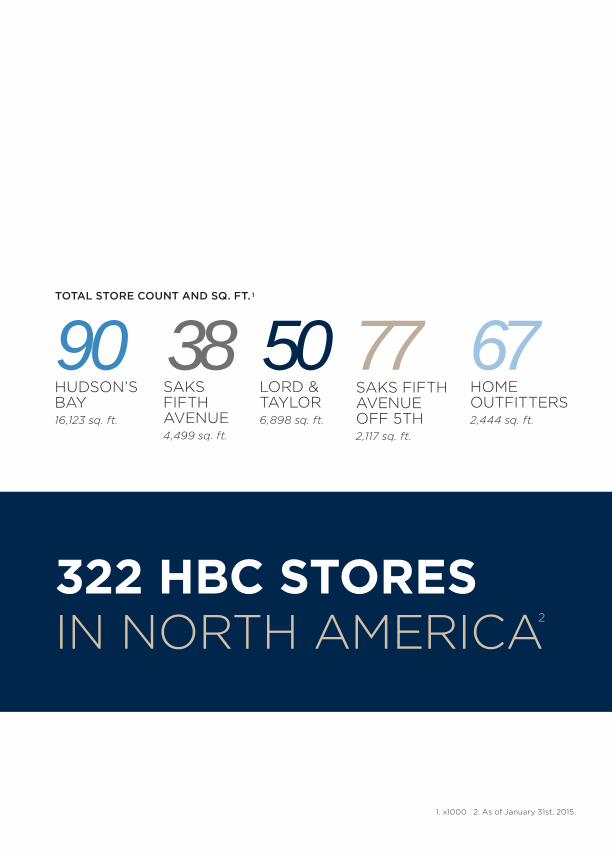
322 HBC STORESIN NORTH AMERICA2
1. x1000 2. As of January 31st, 2015.
HUDSON’S BAY16,123 sq. ft.
90LORD & TAYLOR6,898 sq. ft.
50HOMEOUTFITTERS2,444 sq. ft.
67SAKS FIFTH AVENUE4,499 sq. ft.
38SAKS FIFTHAVENUEOFF 5TH2,117 sq. ft.
77TOTAL STORE COUNT AND SQ. FT. 1

A Canadian icon
with over three
centuries of brand
heritage, Hudson’s
Bay helped build
the nation; making
it Canada’s most
prominent department
store and one of the
most recognized
brands in the country.
Saks opened
its doors to
New York City
in 1924, realizing
the vision of a
“unique luxury
store for fashionable
living.” The Saks
Fifth Avenue brand
is now synonymous
around the world
with luxury and style.
SAME STORE SALES GROWTH3
DSGLORD & TAYLORHUDSON’S BAYHOME OUTFITTERS
SAKS FIFTHAVENUE
SAKS FIFTH AVENUE OFF 5TH
+ 2.7%
+ 2.1%
+ 1.5%
+ 15.1%3. Local currency basis.
FY 2013 NORMALIZED EBITDA
$405MFY 2014 NORMALIZED EBITDA
$612M
$5,223MFY 2013 HBC RETAIL SALES
$8,169MFY 2014 HBC RETAIL SALES

Founded in 1999,
Home Outfi tters
is Canada’s largest
kitchen, bed, and
bath specialty
superstore, known
for providing
Canadians with
stylish, quality
home and lifestyle
merchandise at
great value.
Established in 1826,
Lord & Taylor was
not only the fi rst
department store
in the U.S., it has
made history with
a number of other
fi rsts including the
fi rst to offer personal
shopping and the
fi rst female President
of a department
store in the U.S.
+66%2013–2014 DSG DIGITAL SALES
GROWTH
FY 2014 HBC DIGITAL SALES AS A % OF RETAIL SALES 11%FY 2014
HBC DIGITAL SALES $900M
Established in 1995,
Saks Fifth Avenue
OFF 5TH leads
the market as the
premier luxury-
value destination
and is renowned for
its world-class and
carefully curated off-
the-runway trends,
exceptional service,
and extraordinary
value on the biggest
names in fashion.
WE OFFERA CAREFULLY CURATED COLLECTION OF BRANDS.
WE DELIVERAN EXCEPTIONAL SERVICE EXPERIENCE.
WE DELIGHTAND ENTERTAIN OUR CUSTOMERS AT EVERY TOUCHPOINT.
HBC 2012-2014 CALENDAR YEAR SHARE PRICE RANGE
$12
$21
$15
$18
$24
Common Shares of the Hudson’s Bay Company began trading on the Toronto Stock Exchange under the symbol “HBC” on November 20, 2012.
HBC CLOSING SHARE PRICE
2012 $16.72
2013 $17.93
2014 $24.56

CONTINUING THE TRADITION OF INNOVATION, 2014 WAS A TRANSFORMATIVEYEAR FOR HBC.

Dear Shareholders,
For more than 340 years,Hudson’s Bay Companyhas been making history.Founded in 1670 as “aCompany of Adventurers,” HBC charted new territory,innovated trade andcommerce and, ultimately,helped inspire and build anation. Today, HBC is NorthAmerica’s oldest companyand operates some of themost iconic retail banners in the world – Hudson’s Bay,Lord & Taylor, Saks FifthAvenue and Saks Fifth Avenue OFF 5TH. Our portfolio ofbrands offers a compellingassortment of apparel,accessories, shoes, beautyand home merchandise.We are committed toproviding great products,an exceptional service experience and elevatedshopping environments forour customers, both in storeand online.
Continuing the traditionof innovation, 2014 was atransformative year for HBC.In addition to strong top line sales growth across theCompany, the integration of Saks is already producingresults and HBC is now fi rmly positioned as a leaderin the luxury retail market, as well as at the forefront of the off-price segment withSaks Fifth Avenue OFF 5TH.
As we outlined last year,digital growth has been akey driver of our strategyand our investment hasdelivered very strong returns.Digital commerce sales grew to $900 million in 2014, ledby a 66% increase at DSG,and now represents 11% ofHBC’s total sales.
On the real estate front,HBC recently announcedthree major transactions;the $1.25 billion, 20-yearmortgage on the ground
portion of its Saks FifthAvenue fl agship in New YorkCity and two joint venturesfocused on real estate growthopportunities in the UnitedStates and Canada. Thesetransactions continue ourhistory of surfacing valuefrom our substantial realestate holdings, whilestrengthening HBC’s balancesheet and fi nancial position.
Finally, we have built aworld-class leadership team with the appointmentof Jerry Storch as ChiefExecutive Offi cer, Paul Beeslyas Chief Financial Offi cer,and Ian Putnam as ChiefCorporate DevelopmentOffi cer. The addition of thesethree experienced executives,as well as the appointmentof Don Watros as President,HBC International, greatlyenhance the managementteam and further positionsHBC to fully execute on ourstrategic growth initiatives.
A MESSAGE FROM
Richard Baker & Gerald Storch
Gerald L. Storch,Chief Executive Offi cer
2014 HIGHLIGHTS2014 moved us signifi cantly closer toward our long-term goal of achieving $10 billion in sales by 2018, with all businesses reporting same store sales growth, led by the strong performance of Saks Fifth Avenue OFF 5TH.
Key results for the year were:
Total retail sales of approximately $8.2 billion, up 56.4% year-over-year,primarily due to the inclusion of Saks for the full fi fty-two week period.
Richard A. Baker,Governor and Executive Chairman
Digital sales were $900 million, up $592 million from last year.
Gross profi t increase of 120 basis pointson a comparable basis.
Same store sales increased by 7.5%* On a local currency basis same store sales results were:
• DSG: +1.5%• Saks Fifth Avenue: +2.1%• Saks Fifth Avenue
OFF 5TH: +15.1%
*2.7% on a local currency basis.
Normalized EBITDA for the year was $612 million,or 7.5% of retail sales.
Building on these results andthe investments that HBC hasmade, we have outlined a numberof strategic initiatives that webelieve will drive growth at theCompany moving forward:
All-Channel GrowthWith an estimated 70% of retailtransactions infl uenced by digital, we are focused on creating aseamless connection between the online and in store experience.Historically, our digital capabilitieshave been less developed thanmany of our competitors, presentinga substantial opportunity forgrowth. Accordingly, in 2014we increased our investment andcreated HBC Digital to providecommon leadership to this initiative, ensuring that we leveragethe talent and best practices fromacross the Company’s differentbanners to deliver best-in-classdigital, mobile and omni-channel experiences for our customers.While we have invested signifi cantlyin improving our digital channelsand offerings, and will continueto do so, we are just as focused onenhancing the in store experiencefor our customers. The store environment delivers a multi-sensory experience that continuesto bring customers into our brickand mortar locations. Theseenvironments allow us to dazzleand entertain our shoppers. Aswe enter 2015 and beyond, webelieve that retail will be won bythose that offer an outstandingshopping experience acrossall channels.
Expanding our Off-Price BusinessOff-price presents an outstandinggrowth opportunity for ourCompany. This segment isgrowing much faster than therest of the retail industry, andwe believe there is a whitespace between the traditionalmass discounter and thedepartment store. Saks Fifth Avenue OFF 5TH is well-positioned to fi ll this void.Saks Fifth Avenue OFF 5THdelivers an enhanced valueproposition to better alignwith customer expectations,delivering true fashion and realvalue. Our newly designed SaksFifth Avenue OFF 5TH storeconcept utilizes a modern,modular format to create aneasier-to shop ‘treasure hunt’environment. We intend tosignifi cantly increase Saks Fifth Avenue OFF 5TH’s presenceacross North America, byopening new store locations and expanding online.
Bringing Saks Fifth Avenue & Saks Fifth Avenue OFF 5TH toCanadaWe believe there is a substantialopportunity for Saks Fifth Avenueand Saks Fifth Avenue OFF 5TH inCanada. Relative to other nations,Canada has an under-developed luxury market and, per capita,Canadians are outspendingEuropean and U.S. consumers on luxury goods, with many of theseconsumers travelling abroadto do so. Canada is also the topinternational ship-to destinationfor saks.com, signalling solid brandawareness that resonates across the country. Meanwhile, the off-pricemarket in Canada also presents atremendous opportunity for theSaks Fifth Avenue OFF 5TH brand.We anticipate opening up to sevenfull-line Saks Fifth Avenue locationsand up to 25 Saks Fifth Avenue OFF 5TH locations over the comingyears. Our fi rst two Saks FifthAvenue stores will be located inToronto; a 150,000 square footstore in Toronto Eaton Centre,and a 130,000 square foot store inSherway Gardens, both slated toopen in the spring of 2016. Our fi rst Canadian Saks Fifth Avenue OFF 5TH locations are also scheduledto open in that same time frame.
Driving Synergies and Effi cienciesFollowing the acquisition of SaksIncorporated, we have targeted the realization of approximately$100 million of annualized pre-taxsynergies over three years. Afterthe fi rst full year with Saks in the fold, we are happy to report weremain on plan and have been ableto realize approximately $50 millionof this target through a number ofinitiatives including, among others;
• Expanding our shared servicesorganization to Saks Fifth Avenue;
• Leveraging our procurement scale;
• Leveraging our technologyinfrastructure; and
• Using Saks Fifth Avenue OFF 5THas an enterprise-wide liquidationchannel.
In addition, we are focused ondriving effi ciencies throughoutour entire organization, forexample, by utilizing technologyto help our merchants buy, allocateand manage their businessesmore effi ciently. We believe thatthese projects, combined withexpanded all-channel fulfi llmentcapabilities, will continue toenhance merchandise gross margins over time.
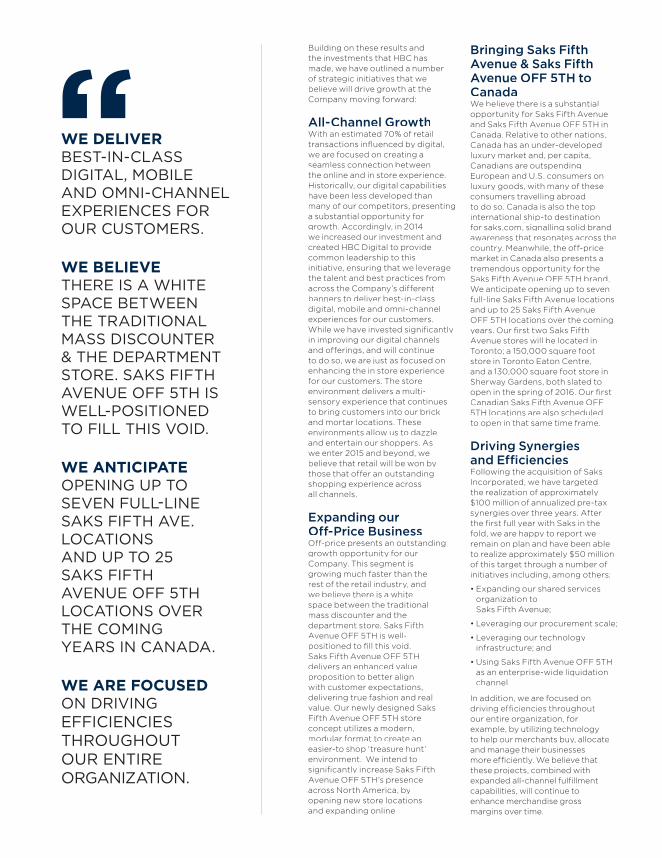
WE DELIVER BEST-IN-CLASS DIGITAL, MOBILE AND OMNI-CHANNEL EXPERIENCES FOR OUR CUSTOMERS.
WE BELIEVETHERE IS A WHITE SPACE BETWEEN THE TRADITIONAL MASS DISCOUNTER & THE DEPARTMENT STORE. SAKS FIFTH AVENUE OFF 5TH IS WELL-POSITIONED TO FILL THIS VOID.
WE ANTICIPATE OPENING UP TO SEVEN FULL-LINE SAKS FIFTH AVE. LOCATIONS AND UP TO 25 SAKS FIFTH AVENUE OFF 5TH LOCATIONS OVER THE COMING YEARS IN CANADA.
WE ARE FOCUSED ON DRIVING EFFICIENCIES THROUGHOUT OUR ENTIRE ORGANIZATION.

Real EstateHBC’s recently announced joint venturetransactions continue our strategy ofunlocking the long-term value fromour real estate portfolio to positionbetter the Company for growth in boththe retail and real estate businesses.This follows the 2011 sale of the Zellersleases for $1.8 billion, last year’s saleand leaseback of the Hudson’s BayQueen Street fl agship property inToronto for $650 million, and the recent mortgage fi nancing of the Saks FifthAvenue fl agship in New York. These jointventures will create two new growthvehicles for HBC – a real estate companyin the U.S. with Simon Property Group,and a real estate company in Canadawith RioCan REIT. We believe that thesejoint ventures will be well-positioned to drive growth and diversify our real estateportfolio by leveraging the expertiseof our best-in-class partners and thestrength of HBC’s brands. Additionally,these transactions also provide clarityto our shareholders and support ourvaluation of our real estate portfolio atC$9.2 billion. We expect this additionaltransparency will enable analysts and investors to value HBC on a sum-of-the-parts basis.
The future at HBC is very bright.These initiatives, combined with our dynamic leadership team and strongcompetencies in retailing, mergersand acquisitions, and real estate,ensure that HBC is well-positionedto deliver growth and enhance long-term shareholder value. By leveragingour scale to drive sales and increaseeffi ciencies across our businesses, HBC is able to provide investors with uniqueexposure to the North American retail,consumer and real estate sectors. Ofcourse, none of this would be possiblewithout the collective efforts of our dedicated and committed Associates,who are fundamental to delivering adifferentiated customer experience andaccomplishing the goals we have setout to achieve. We thank them for theirefforts and achievements. We are alsograteful to our Board of Directors, whocontinue to provide strategic leadershipand sound advice, and the entiremanagement team for their tremendousaccomplishments this past year.
Sincerely,
WE LEVERAGE THE TALENT AND BEST PRACTICES FROM ACROSS THE COMPANY’S DIFFERENT BANNERS.
Gerald L. Storch,Chief Executive Offi cer
Richard A. Baker,Governor and Executive Chairman
MANAGEMENT’S DISCUSSION AND ANALYSIS OFFINANCIAL CONDITION AND RESULTS OF OPERATIONS
The following management’s discussion and analysis (‘‘MD&A’’) is intended to assist readers in understandingthe business environment, strategies and performance and risk factors of Hudson’s Bay Company and its direct andindirect subsidiaries and predecessors or other entities controlled by them, referred to herein as ‘‘HBC’’, the‘‘Company’’, ‘‘we’’, ‘‘us’’, or ‘‘our.’’ It should be read in conjunction with the audited consolidated financialstatements of the Company and notes thereto for the fiscal year ended January 31, 2015. Unless otherwise indicated,all amounts are expressed in Canadian dollars.
The Board of Directors, on the recommendation of its Audit Committee, approved the contents of this MD&A.This MD&A reflects information as of April 6, 2015.
Basis of Presentation
Our consolidated financial statements are prepared in accordance with International Financial ReportingStandards (‘‘IFRS’’) as issued by the International Accounting Standards Board (‘‘IASB’’). Certain previouslyreported figures have been restated due to the implementation of International Financial ReportingInterpretations Committee 21 — Levies (‘‘IFRIC 21’’). See ‘‘New Accounting Policies — Levies.’’
General Information
Hudson’s Bay Company is a Canadian corporation continued under the Canada Business Corporations Act.In January 2012, through an internal reorganization, Lord & Taylor LLC (‘‘Lord & Taylor’’) became a wholly-owned subsidiary of HBC. On November 26, 2012, the Company completed an initial public offering(the ‘‘IPO’’) of its common shares, which trade on the Toronto Stock Exchange under the symbol ‘‘HBC.’’
On November 4, 2013, the Company completed its acquisition of all of the outstanding shares of SaksIncorporated (‘‘Saks’’), in an all-cash transaction valued at U.S.$2,973 million ($3,097 million), including debtassumed (the ‘‘Saks Acquisition’’). The Company’s financial results for Fiscal 2013 include the results of Saks forthe fourth quarter only.
References in this MD&A to Department Store Group (‘‘DSG’’) refer to the Company as structured priorto the acquisition of Saks (i.e., excluding Saks) and was previously referred to as Legacy HBC. As HomeOutfitters merged into the home business at Hudson’s Bay during the second quarter of Fiscal 2014, it is nowreported within DSG effective the third quarter of Fiscal 2014.
References to the ‘‘Queen Street Sale’’ in this MD&A refer to the sale of the Company’s downtown Torontoflagship store and adjacent Simpson’s Tower office complex in the first quarter of Fiscal 2014 (see note 28 of theaudited consolidated financial statements for Fiscal 2014).
Accounting Periods
This MD&A is based on the audited consolidated financial statements and accompanying notes thereto forFiscal 2014, Fiscal 2013 and Fiscal 2012.
Forward-Looking Statements
Certain statements in this MD&A regarding our current and future plans, expectations and intentions,results, levels of activity, performance, goals or achievements or any other future events or developments,including without limitation statements under the headings ‘‘Overview — Our Business’’ and ‘‘Outlook’’,constitute forward-looking statements. The words ‘‘may’’, ‘‘will’’, ‘‘would’’, ‘‘should’’, ‘‘could’’, ‘‘expects’’,‘‘plans’’, ‘‘intends’’, ‘‘trends’’, ‘‘indications’’, ‘‘anticipates’’, ‘‘believes’’, ‘‘estimates’’, ‘‘predicts’’, ‘‘likely’’ or‘‘potential’’, or the negative or other variations of these words or other comparable words or phrases, areintended to identify forward-looking statements.
Forward-looking statements are based on estimates and assumptions made by us in light of our experienceand perception of historical trends, current conditions and expected future developments, as well as other
14
factors that we believe are appropriate and reasonable in the circumstances. However, there can be no assurancethat such estimates and assumptions will prove to be correct.
Many factors could cause our actual results, level of activity, performance or achievements or future eventsor developments to differ materially from those expressed or implied by the forward-looking statements,including, without limitation, the following factors, which are discussed in greater detail in this MD&A and theCompany’s Annual Information Form for Fiscal 2013 filed on SEDAR on May 2, 2014: significant competitionin the retail industry; changing consumer preferences; changing consumer spending; the prospect ofunfavourable economic and political conditions; the seasonal nature of our business, unseasonable weatherconditions or natural disasters; our substantial amount of indebtedness and our ability to comply with thecovenants in our credit facilities; our ability to integrate Saks with the legacy business and to realize costsynergies and growth opportunities related thereto; our ability to achieve the full amount of cost synergies thatare anticipated, or achieve the cost synergies on the schedule anticipated, from the Saks Acquisition; ourdependence on key personnel who would be difficult to replace; our dependence on our advertising andmarketing programs; a material disruption in our computer systems; our ability to upgrade, maintain and secureour information systems to support the needs of the organization and protect against increased and evolvingcyber security threats; our ability to execute our retail and real estate growth strategies; fluctuations in the valueof the Canadian dollar in relation to the U.S. dollar; risks associated with doing business abroad; risks associatedwith operating freehold and leasehold property and surfacing value from our real estate portfolio, includingthrough our joint venture agreements; environmental risks associated with operating freehold and leaseholdproperty; our ability to meet our obligations under the agreement entered into with Target Corporation(‘‘Target’’); inability to protect our trademarks and other proprietary rights; pension related risks; our constatingdocuments could discourage takeover attempts; risks related to our ability to maintain financial andmanagement processes and controls; our ability to pay dividends is dependent on our ability to generatesufficient income and cash flows; influence by our principal shareholders; our principal shareholders have amaterial percentage of the Common Shares that may have an impact on the trading price of the CommonShares; and our principal shareholders may sell their Common Shares at a time in the future and such timing willbe beyond our control and may affect the trading price of the Common Shares; other risks inherent to ourbusiness and/or factors beyond our control that could have a material adverse effect on us. Additional risks anduncertainties are discussed in the Company’s materials filed with the Canadian securities regulatory authoritiesfrom time to time. These factors are not intended to represent a complete list of the factors that could affect us;however, these factors should be considered carefully.
The purpose of the forward-looking statements is to provide the reader with a description of management’sexpectations regarding the Company’s financial performance and may not be appropriate for other purposes;readers should not place undue reliance on forward-looking statements made herein. Furthermore, unlessotherwise stated, the forward-looking statements contained in this MD&A are made as of the date of thisMD&A, and we have no intention and undertake no obligation to update or revise any forward-lookingstatements, whether as a result of new information, future events or otherwise, except as required by applicablesecurities law. The forward-looking statements contained in this MD&A are expressly qualified by thiscautionary statement.
Non-IFRS Measures
This MD&A makes reference to certain non-IFRS measures. These measures are not recognized measuresunder IFRS, do not have a standardized meaning prescribed by IFRS and are therefore unlikely to becomparable to similar measures presented by other companies. Rather, these measures are provided asadditional information to complement IFRS measures by providing further understanding of the Company’sresults of operations from management’s perspective. Accordingly, they should not be considered in isolation oras a substitute for analysis of our financial information reported under IFRS. We use non-IFRS measuresincluding gross profit, EBITDA, Normalized EBITDA, Normalized Net Earnings (Loss) and NormalizedSelling, General & Administrative Expenses to provide investors with supplemental measures of our operatingperformance and thus highlight trends in our core business that may not otherwise be apparent when relyingsolely on IFRS financial measures. We also believe that securities analysts, investors, rating agencies and otherinterested parties frequently use non-IFRS measures in the evaluation of issuers. Our management also uses
15

non-IFRS measures in order to facilitate operating performance comparisons from period to period, prepareannual operating budgets and assess our ability to meet our future debt service, capital expenditure and workingcapital requirements.
For additional detail, refer to our tables outlining the relevant definitions and reconciliations of NetEarnings (Loss) — Continuing Operations to EBITDA and Normalized EBITDA, and Net Earnings (Loss) —Continuing Operations to Normalized Net Earnings.
Fourth Quarter Events
• On January 6, 2015, Gerald Storch joined the Company as Chief Executive Officer who together withRichard Baker, the Governor and Executive Chairman, compose the Office of the Chairman.
• On December 17, 2014, Ian Putnam joined the Company as Executive Vice President, Chief CorporateDevelopment Officer.
• On December 3, 2014 the Company closed the previously announced U.S.$1.25 billion, 20-year mortgageon the ground portion of its Saks Fifth Avenue flagship in New York City, located at 611 Fifth Avenue(the ‘‘Saks Mortgage’’). For further information on this transaction, please see ‘‘Cash Balances andLiquidity — Funding Capacity — Saks Mortgage.’’
• Jon Nordeen joined the Company as Chief Information Officer, effective November 19, 2014.
• On December 8, 2014, the Company declared a quarterly dividend, paid on January 15, 2015, toshareholders of record at the close of business December 31, 2014, in the amount of $0.05 perCommon Share.
Subsequent Events
• On February 11, 2015, a secondary offering was completed pursuant to which 2380162 Ontario Limited, asubsidiary of Ontario Teachers’ Pension Plan and successor in interest to H.S. Investment L.P.(‘‘HSILP’’), sold 4,899,000 of the Common Shares of HBC which it held. The Company did not receiveany proceeds from the offering.
• On February 25, 2015, the Company announced that it entered into agreements with Simon PropertyGroup Inc. (‘‘Simon’’) (NYSE: SPG) and RioCan Real Estate Investment Trust (‘‘RioCan’’)(TSX:REI.UN) to form two joint ventures focused on real estate growth opportunities in theUnited States, Canada and internationally. Both transactions are expected to close within approximately90–120 days, subject to securing acceptable debt financing for each joint venture and other customaryclosing conditions and consents, as applicable. Approximately $1.1 billion in expected cash proceeds fromthe joint venture transactions, net of expenses, will be used to reduce debt on the Company’s balancesheet. It is expected that the joint ventures will be accounted for using the equity method of accounting.The joint ventures are expected to enable the Company to leverage the expertise of market-leading realestate companies to build on the strength of its existing real estate assets and identify new real estategrowth opportunities. The transactions are structured to facilitate an IPO or other monetizationtransaction of each joint venture at a future date.
• On March 9, 2015, the Company declared a quarterly dividend, to be paid on April 15, 2015, toshareholders of record at the close of business March 31, 2015 in the amount of $0.05 perCommon Share.
• On April 2, 2015, the Company announced the appointment of Marc Metrick to President, Saks FifthAvenue. Marc replaces Marigay McKee who has stepped down based on mutual agreement withthe Company.
16

Overview
Our Business:
Hudson’s Bay Company, founded in 1670, is North America’s longest continually operated company. HBCoperates four iconic retail banners — Hudson’s Bay, Lord & Taylor, Saks Fifth Avenue and Saks OFF 5TH(‘‘OFF 5TH’’). Our portfolio of brands offers a compelling assortment of apparel, accessories, shoes, beauty andhome merchandise. Hudson’s Bay is Canada’s leading department store with 90 full-line locations, two outletstores and thebay.com. Lord & Taylor offers high-quality and fashionable merchandise in 50 full-line departmentstore locations, primarily in the northeastern and mid-Atlantic U.S., four Lord & Taylor outlet locations andlordandtaylor.com. Saks Fifth Avenue, one of the world’s pre-eminent luxury specialty retailers, comprises38 U.S. stores, five international licensed stores and saks.com. OFF 5TH offers great brands at great valuesthrough 77 U.S. stores and saksoff5th.com. Home Outfitters is Canada’s largest kitchen, bed and bath specialtysuperstore with 67 locations. The Company also operates two Zellers clearance centers in Canada.
We intend to continue to grow our retail sales primarily through the following strategies:
• Driving Growth across all Channels. We are focused on driving growth both within and across our storeand digital channels. We are building our capabilities and enhancing our store experience to allow ourcustomers to shop seamlessly across stores and digital and believe that serving our customers across allchannels results in increased spend and loyalty. We are also strengthening our digital presence throughHBC Digital, our team that manages digital commerce and marketing strategy and execution for ourdigital brands, and continuing to differentiate our store merchandise and experience to growthese channels.
• Expanding Our Off-Price Business. We have refined the OFF 5TH business model to offer more nationalbrands at a clearer value proposition in an easier-to-shop environment. We intend to accelerate the paceof new store openings and have introduced a larger OFF 5TH format.
• Bringing Saks Fifth Avenue and OFF 5TH to Canada. We intend to leverage our existing Canadianinfrastructure, institutional knowledge and experience to efficiently and effectively bring Saks FifthAvenue and OFF 5TH to Canada. We believe there is an opportunity to open up to seven Saks FifthAvenue stores and up to 25 OFF 5TH stores in Canada over the coming years, with the first full-line andOFF 5TH stores planned to open in 2016.
In addition, we believe there is an opportunity to realize significant operating margin improvementsthrough the following initiatives:
• Saks Acquisition Synergies. The targeted annualized Saks Acquisition synergies of approximately$100 million by 2016 are currently expected to be realized in a variety of areas, including(i) administration and other shared services; (ii) store expenses; (iii) information technologyinfrastructure; and (iv) gross profit enhancements.
• Operating Expense Management. We will continue to aggressively manage our operating expenses andleverage our significantly increased scale to optimize costs.
• Gross Profit Enhancements. We will continue to work to increase our gross profit through (i) upgradingtechnology to better plan, buy and allocate merchandise; and (ii) using our evolving digital commercefulfillment functionalities to optimize inventory productivity across each banner.
In addition to successfully operating and integrating our retail business and banners, the Company hasdemonstrated a history of surfacing and leveraging value from its substantial real estate holdings, which alsoserves to strengthen the Company’s balance sheet and operating business. Previous transactions and initiativesinclude the 2011 sale of the Zellers leases for U.S.$1.8 billion, along with the sale and leaseback of the QueenStreet property in Toronto for $650 million in the first quarter of Fiscal 2014 and the recent U.S.$1.25 billionmortgage financing of the ground portion of the Saks Fifth Avenue flagship property in New York City.
Continuing this pattern and following a thorough review of all strategic options, the Company announced,on February 25, 2015, that it had entered into agreements with each of Simon and RioCan to form two jointventures focused on real estate growth opportunities in the United States, Canada and internationally. It is
17
expected that these joint ventures will enable HBC to leverage the expertise of market-leading real estatecompanies to build on the strength of its existing real estate assets and identify new real estate growthopportunities. Both transactions are expected to close within approximately 90–120 days from the date ofannouncement.
The joint ventures create two new growth platforms for the Company; real estate in the United States andreal estate in Canada. We believe these to be the optimal structures to fund the expansion of our real estateportfolio. The joint ventures have mandates to grow beyond the initial seed properties and contributions of thepartners and it is expected that future property acquisitions will diversify the asset portfolios and tenant base ofeach joint venture and create additional value for our shareholders. Importantly, the transactions are structuredto facilitate an IPO or other monetization transaction of each joint venture at a future date.
Highlights of the thirteen week period ended January 31, 2015
• Retail sales, which include digital commerce sales from all banners, were $2,632 million for the thirteenweek period ended January 31, 2015, an increase of $225 million or 9.3% from $2,407 million for thethirteen week period ended February 1, 2014.
• Consolidated same store sales increased 8.7% over the comparable thirteen week period in Fiscal 2013,or 3.2% on a local currency basis. On a local currency basis, same store sales increased by 2.3% at DSG,2.6% at Saks Fifth Avenue and 12.1% at OFF 5TH.
• Digital commerce sales grew to $304 million, an increase of $79 million compared to the thirteen weekperiod ended February 1, 2014. DSG and Saks increased 44% and 32%, respectively, year-over-year forthe thirteen week period ended January 31, 2015, reflecting the Company’s continued strategic focus ongrowing this channel.
• Gross profit rate as reported was 40.8% of retail sales, or a 400 basis point improvement over the thirteenweek period ended February 1, 2014. Included in the 2014 gross profit rate is a conforming change in theclassification of advertising expense credits between SG&A and gross profit as they relate to the Saksbusiness in Fiscal 2014. Adjusting for this positive impact reduces our gross profit rate in Fiscal 2014 to40.3% on a comparable basis. Adjusting further for the negative impact associated with the amortizationof inventory related purchase accounting adjustments in Fiscal 2013, the gross profit rate in Fiscal 2013improves to a comparable 38.4%. On a net adjusted comparable basis, gross profit was realized at a190 basis point improvement when compared to Fiscal 2013.
• Normalized EBITDA was $318 million compared to $253 million for the fourth quarter of Fiscal 2013 oran improvement of $65 million when compared to Fiscal 2013. As a percentage of retail sales,Normalized EBITDA increased to 12.1% from 10.5% for the fourth quarter of Fiscal 2013.
Highlights of the fifty-two week period ended January 31, 2015
• Retail sales were $8,169 million for the fifty-two week period ended January 31, 2015, an increase of$2,946 million or 56.4% from $5,223 million for the fifty-two week period ended February 1, 2014. Theincrease is primarily attributable to the inclusion of Saks for the full fifty-two week period endedJanuary 31, 2015.
• Consolidated same store sales, which include Saks, increased 7.5% over the comparable fifty-two weekperiod in Fiscal 2013, or 2.7% on a local currency basis. On a local currency basis, same store salesincreased by 1.5% at DSG, 2.1% at Saks Fifth Avenue and 15.1% at OFF 5TH.
• Digital commerce sales grew to $900 million, an increase of $592 million compared to the fifty-two weekperiod ended February 1, 2014. The inclusion of Saks in Fiscal 2014 contributed $651 million, while DSGincreased by 66%, reflecting the Company’s continued strategic focus on growing this channel.
• Gross profit rate was 40.4% of retail sales in Fiscal 2014 and 39.2% in Fiscal 2013 on a comparable basis,when excluding the negative impacts of the amortization of inventory related purchase price accountingadjustments recorded on a full year basis for Fiscal 2014 and Fiscal 2013, and the positive impactsassociated with the conforming change in the classification of advertising expense credits between SG&A
18

and gross profit in Fiscal 2014. On a net adjusted comparable basis, gross profit rate improved by120 basis points when compared to Fiscal 2013.
• Normalized EBITDA was $612 million compared to $405 million for the comparable fifty-two weekperiod ended in Fiscal 2013. The increase in Normalized EBITDA of $207 million primarily relates to theinclusion of Saks for the full fifty-two week period ended January 31, 2015. As a percentage of retail sales,Normalized EBITDA decreased to 7.5% from 7.8% for the fifty-two week period endedFebruary 1, 2014.
Factors Affecting Our Performance
Retail Sales
The majority of our sales are from branded merchandise purchased directly from the brand owners or theirlicensees. We focus on offering a broad selection of branded and private-label merchandise appealing to thefashion taste of our customers. The quality and breadth of our selection allow us to change the mix of ourmerchandise based on fashion trends and individual store locations, and enable us to address a broadcustomer base.
Same Store Sales
The Company calculates same store sales on a year-over-year basis from stores operating for at least13 months, and includes online sales and clearance store sales. Stores undergoing remodeling remain in thesame store sales calculation base unless the store is closed for a significant period of time. Unless otherwisenoted, this calculation includes the impact of foreign currency translation. Since the fourth quarter of Fiscal2013, Saks’ same store sales have been included in consolidated same store sales. Definitions and calculations ofsame store sales differ among companies in the retail industry.
Gross Profit
Our cost of sales consists mainly of merchandise purchases, including transportation and distribution costs.Purchases are variable and proportional to our sales volume. We record vendor rebates as a reduction ofinventory cost. All costs directly associated with transportation and distribution, excluding central storage costsand any idle capacity, are capitalized as merchandise inventories.
We work to manage gross margin in a number of different ways. We manage the level of promotionalactivity relative to regular price activity and manage inventory levels to minimize the need for substantialclearance activity. We source private-label products and directly import certain branded products from overseasmarkets including, among others, China, India, Indonesia, Bangladesh, Vietnam, Cambodia and Europe. As aresult, our cost of sales for our Canadian operations is impacted by the fluctuation of foreign currencies againstthe Canadian dollar. In particular, we purchase a significant amount of our imported merchandise fromsuppliers in Asia using U.S. dollars. Therefore, our cost of sales is impacted by the fluctuation of the U.S. dollaragainst the Canadian dollar.
We enter into forward contracts to hedge some of our exposure to fluctuations in the value of theU.S. dollar against the Canadian dollar. Increases in the price of merchandise, raw materials, fuel and labour, ortheir reduced availability, could increase our cost of goods and negatively impact our financial results. Generally,we offset these cost increases with pricing adjustments in order to maintain a consistent mark-up on themerchandise, which might cause changes in our unit volume but typically has a minimal impact on our grossprofit rates.
Foreign Exchange
Our net investment in Lord & Taylor Acquisition Inc. (‘‘L&T Acquisition’’), the indirect parent of Lord &Taylor LLC and Saks, whose functional currency is U.S. dollars, presents a foreign exchange risk to HBC, whosefunctional currency is Canadian dollars. HBC was using a net investment hedge to mitigate this risk. HBC haddesignated U.S.$800 million of the Senior Term Loan B as a hedge of the first U.S.$800 million of net assets ofL&T Acquisition. The hedge was subsequently reduced to U.S.$350 million upon pay down of certain debt, and
19
further to nil, upon pay down of Senior Term Loan B. Foreign currency translation of the net earnings of L&TAcquisition impacts consolidated net earnings. Foreign currency translation of HBC’s investment in L&TAcquisition impacts other comprehensive income.
Selling, General & Administrative Expenses (‘‘SG&A’’)
Our SG&A consists of store labour and maintenance costs, store occupancy costs, advertising andmarketing costs, salaries and related benefits of corporate and field management associates, administrativeoffice expenses, services purchased and other related expenses. SG&A includes buying and occupancy costs andexcludes transportation and distribution centre costs included in inventory and cost of sales. It also includespension, restructuring and other non-recurring items and excludes depreciation and amortization expenses.Although our average hourly wage rate is higher than the minimum wage, an increase in the mandated minimumwage could significantly increase our payroll costs unless we realize offsetting productivity gains and costreductions.
Our occupancy costs are driven primarily by rent expense, which may include escalation clauses overexisting lease terms, including option periods. We believe that our existing leases are generally favourable tocurrent market rates. When entering new leases, we are generally able to negotiate leases at attractive marketrates due to the increased consumer traffic that our stores generate in strip malls and shopping centres.
Under our legacy credit agreements, we earn royalty payments from credit card issuers based on the total ofCompany and other sales charged to either the Private Label Credit Cards (‘‘PLCC’’) or MasterCard. Royaltyrates change based on the year-to-date credit volume of out-of-store credit card sales. We also receive bountypayments from credit card issuers for each approved PLCC or MasterCard account. Bounty and royaltypayments are recognized based on expected or actual performance over the life of the credit card agreements. Inaddition, pursuant to a servicing agreement with a credit card issuer, the Company receives compensation forproviding key customer service functions including new account openings, transaction authorizations, billingadjustments and customer inquiries. All credit card revenues are included as a reduction of SG&A in ourfinancial statements. We have no risk of credit loss on the credit card receivables in the underlying portfolio.
Effective January 1, 2015, we entered into a new credit card program that will eventually replace all legacycredit agreements. Under this program, we share in the income and losses of the credit card program related toprivate label and co-branded credit cards at Hudson’s Bay and Saks. The effective date for Lord & Taylor isJune 2015. Income (loss) is included in selling, general and administrative expenses.
Finance Costs
Our finance costs are expenses derived from the financing activities of the Company, including interestexpense on long and short-term borrowings, gains or losses on the early extinguishment of debt and fair valuegains or losses and amortization charges related to embedded derivatives. In addition to credit ratings and creditspreads, our finance costs are dependent on fluctuations in the underlying indexes used to calculate interestrates, including, but not limited to the Canadian prime rate, the Canadian Dealer Offered Rate (‘‘CDOR’’) andthe London Interbank Offered Rate (‘‘LIBOR’’).
In connection with the Saks Acquisition, we issued Common Share purchase warrants to HSILP, an affiliateof Ontario Teachers’ Pension Plan, and to West Face Long Term Opportunities Global Master L.P., a fundadvised by West Face Capital Inc. The non-cash charges associated with the warrants fluctuate with changes inthe Common Share price and other factors, as they require mark-to-market adjustments each reporting period.We record the mark-to-market valuation adjustment of these warrants as finance income (costs) based on theirend-of-period valuations.
Weather
Extreme weather conditions in the areas in which the Company’s stores are located could adversely affectthe Company’s business. For example, frequent or unusually heavy snowfall, ice storms, rainstorms, earthquakes,or other extreme weather conditions over a prolonged period could make it difficult for the Company’scustomers to travel to its stores and thereby reduce the Company’s sales and profitability. The Company’s
20

business is also susceptible to unseasonable weather conditions. For example, extended periods of unseasonablywarm temperatures during the winter season or cool weather during the summer season could result in lowersales and more promotional activity to clear merchandise at the end of the season. Reduced sales from extremeor prolonged unseasonable weather conditions could adversely affect the Company’s operating results.
Competition
The Company conducts its retail merchandising business under highly competitive conditions. Although theCompany is one of North America’s largest retailers, it has numerous and varied competitors at the national andlocal levels, including conventional and specialty department stores, other specialty stores, mass merchants,value retailers, discounters, and Internet and mail-order retailers. Competition may intensify as new competitorsenter into the markets in which our banners operate including U.S. competitors entering into the Canadianmarket, and/or if our competitors enter into business combinations or alliances. Competition is characterized bymany factors, including assortment, advertising, price, quality, service, location, reputation and creditavailability. If the Company does not compete effectively with regard to these factors, its results of operationscould be materially and adversely affected.
Consumer Trends
The fashion and retail industries are subject to sudden shifts in consumer trends and consumer spending.The Company’s sales and operating results depend, in part, on its ability to predict or respond to changes infashion trends and consumer preferences in a timely manner. The Company develops new retail concepts andcontinuously adjusts its market positioning in branded and private-label merchandise and product categories inan effort to satisfy customer demand. Any sustained failure to anticipate, identify and respond to emergingtrends in lifestyle and consumer preferences could have a material adverse effect on the Company’s business.Consumers’ discretionary spending impacts the Company’s sales and may be affected by many factors outside ofthe Company’s control, including general economic conditions, consumer disposable income levels, consumerconfidence levels, the availability, cost and level of consumer debt, the costs of basic necessities and other goods,and the effects of weather or natural disasters.
Seasonality
The quarterly sales and earnings of the Company are significantly impacted by customer sales patterns. As aresult, sales in the fiscal fourth quarter, due to the holiday shopping season, represent a much greater portion ofour annual sales volume and a substantial portion of our annual earnings. We generate approximately one-thirdof our sales during the fourth quarter of each fiscal year due to the Christmas and holiday shopping season.
New Accounting Policies — Levies
In May 2013, the IASB issued IFRIC 21, providing guidance on the accounting for levies imposed bygovernments. The interpretation clarifies that the obligating event that gives rise to a liability to pay a levy is theactivity described in the relevant legislation that triggers the payment of the levy. It also clarifies that a levyliability is accrued rateably over a reporting period only if the activity that triggers payment occurs over suchperiod, in accordance with the relevant legislation. See ‘‘Changes in Accounting Policies Including InitialAdoption’’ section of this MD&A.
Property taxes are charged by a government in accordance with legislation, are based on underlyingproperty value, and include both real and personal property. As such, real and personal property taxes are withinthe scope of IFRIC 21. Prior to the adoption of IFRIC 21, the Company recorded all property taxes rateablyover the relevant tax year.
Property tax legislation in various jurisdictions in Canada does not clearly define a single obligating eventthat gives rise to a liability to pay annual property taxes. As such, at any date within the year, the only amount ofproperty taxes that an owner can reasonably estimate they are liable for is a pro rata estimate of annual propertytaxes based on the number of days of ownership. Rateable recognition of property taxes in Canada, therefore,continues to be appropriate under IFRIC 21.
21
In the majority of the U.S. tax jurisdictions in which the Company operates, the obligating event for realand personal property taxes is ownership of the property on the day of the year for which the tax is imposed.
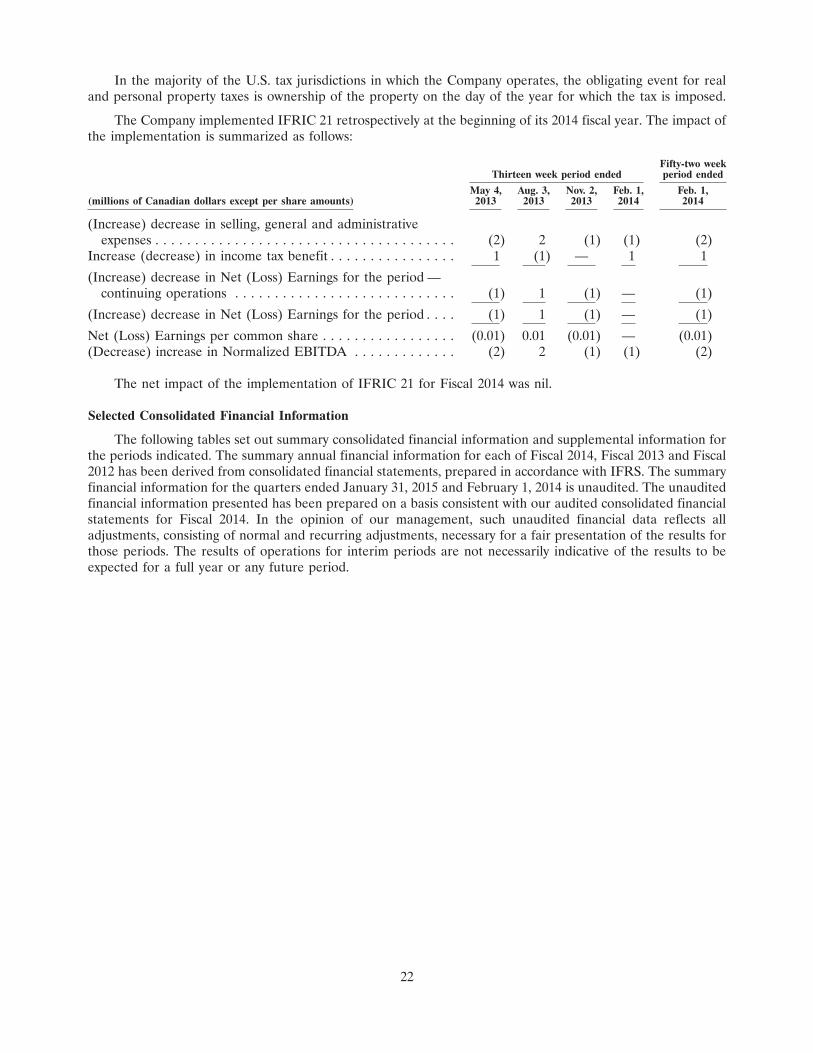
The Company implemented IFRIC 21 retrospectively at the beginning of its 2014 fiscal year. The impact ofthe implementation is summarized as follows:
Fifty-two weekThirteen week period ended period ended
May 4, Aug. 3, Nov. 2, Feb. 1, Feb. 1,(millions of Canadian dollars except per share amounts) 2013 2013 2013 2014 2014
(Increase) decrease in selling, general and administrativeexpenses . . . . . . . . . . . . . . . . . . . . . . . . . . . . . . . . . . . . . . (2) 2 (1) (1) (2)
Increase (decrease) in income tax benefit . . . . . . . . . . . . . . . . 1 (1) — 1 1
(Increase) decrease in Net (Loss) Earnings for the period —continuing operations . . . . . . . . . . . . . . . . . . . . . . . . . . . . (1) 1 (1) — (1)
(Increase) decrease in Net (Loss) Earnings for the period . . . . (1) 1 (1) — (1)
Net (Loss) Earnings per common share . . . . . . . . . . . . . . . . . (0.01) 0.01 (0.01) — (0.01)(Decrease) increase in Normalized EBITDA . . . . . . . . . . . . . (2) 2 (1) (1) (2)
The net impact of the implementation of IFRIC 21 for Fiscal 2014 was nil.
Selected Consolidated Financial Information
The following tables set out summary consolidated financial information and supplemental information forthe periods indicated. The summary annual financial information for each of Fiscal 2014, Fiscal 2013 and Fiscal2012 has been derived from consolidated financial statements, prepared in accordance with IFRS. The summaryfinancial information for the quarters ended January 31, 2015 and February 1, 2014 is unaudited. The unauditedfinancial information presented has been prepared on a basis consistent with our audited consolidated financialstatements for Fiscal 2014. In the opinion of our management, such unaudited financial data reflects alladjustments, consisting of normal and recurring adjustments, necessary for a fair presentation of the results forthose periods. The results of operations for interim periods are not necessarily indicative of the results to beexpected for a full year or any future period.
22
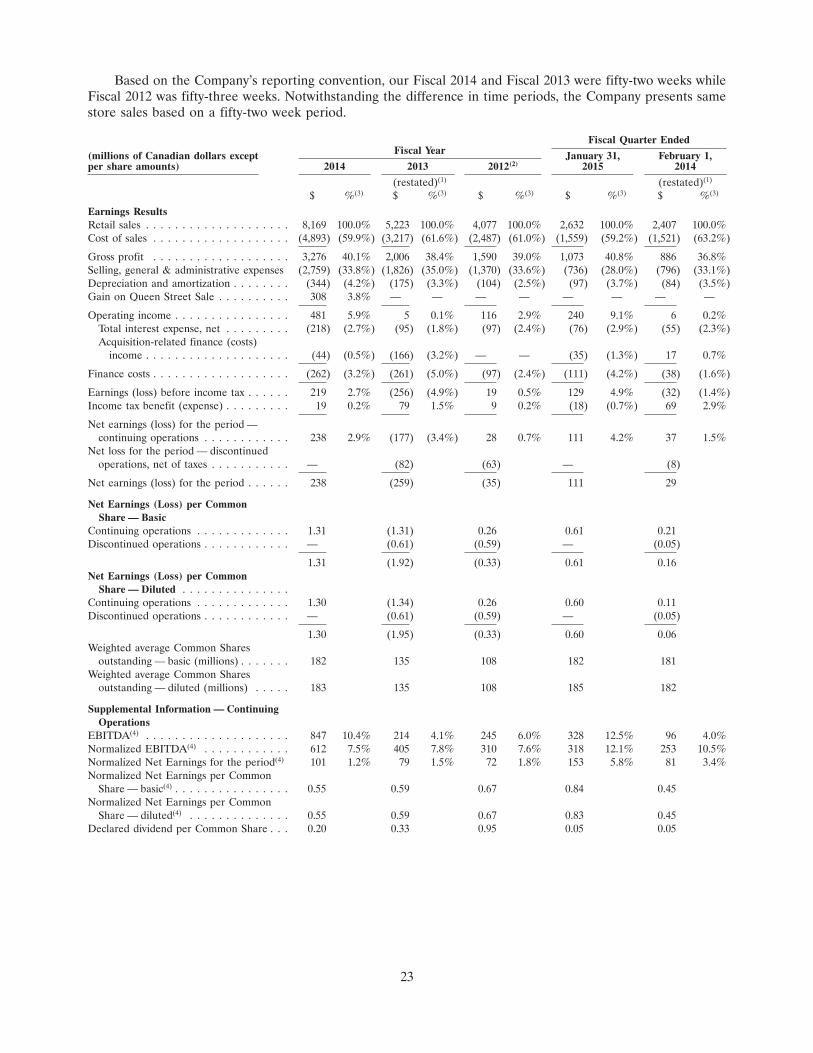
Based on the Company’s reporting convention, our Fiscal 2014 and Fiscal 2013 were fifty-two weeks whileFiscal 2012 was fifty-three weeks. Notwithstanding the difference in time periods, the Company presents samestore sales based on a fifty-two week period.
Fiscal Quarter EndedFiscal Year(millions of Canadian dollars except January 31, February 1,
per share amounts) 2014 2013 2012(2) 2015 2014
(restated)(1) (restated)(1)
$ %(3) $ %(3) $ %(3) $ %(3) $ %(3)
Earnings ResultsRetail sales . . . . . . . . . . . . . . . . . . . . 8,169 100.0% 5,223 100.0% 4,077 100.0% 2,632 100.0% 2,407 100.0%Cost of sales . . . . . . . . . . . . . . . . . . . (4,893) (59.9%) (3,217) (61.6%) (2,487) (61.0%) (1,559) (59.2%) (1,521) (63.2%)
Gross profit . . . . . . . . . . . . . . . . . . . 3,276 40.1% 2,006 38.4% 1,590 39.0% 1,073 40.8% 886 36.8%Selling, general & administrative expenses (2,759) (33.8%) (1,826) (35.0%) (1,370) (33.6%) (736) (28.0%) (796) (33.1%)Depreciation and amortization . . . . . . . . (344) (4.2%) (175) (3.3%) (104) (2.5%) (97) (3.7%) (84) (3.5%)Gain on Queen Street Sale . . . . . . . . . . 308 3.8% — — — — — — — —
Operating income . . . . . . . . . . . . . . . . 481 5.9% 5 0.1% 116 2.9% 240 9.1% 6 0.2%Total interest expense, net . . . . . . . . . (218) (2.7%) (95) (1.8%) (97) (2.4%) (76) (2.9%) (55) (2.3%)Acquisition-related finance (costs)
income . . . . . . . . . . . . . . . . . . . . (44) (0.5%) (166) (3.2%) — — (35) (1.3%) 17 0.7%
Finance costs . . . . . . . . . . . . . . . . . . . (262) (3.2%) (261) (5.0%) (97) (2.4%) (111) (4.2%) (38) (1.6%)
Earnings (loss) before income tax . . . . . . 219 2.7% (256) (4.9%) 19 0.5% 129 4.9% (32) (1.4%)Income tax benefit (expense) . . . . . . . . . 19 0.2% 79 1.5% 9 0.2% (18) (0.7%) 69 2.9%
Net earnings (loss) for the period —continuing operations . . . . . . . . . . . . 238 2.9% (177) (3.4%) 28 0.7% 111 4.2% 37 1.5%
Net loss for the period — discontinuedoperations, net of taxes . . . . . . . . . . . — (82) (63) — (8)
Net earnings (loss) for the period . . . . . . 238 (259) (35) 111 29
Net Earnings (Loss) per CommonShare — Basic
Continuing operations . . . . . . . . . . . . . 1.31 (1.31) 0.26 0.61 0.21Discontinued operations . . . . . . . . . . . . — (0.61) (0.59) — (0.05)
1.31 (1.92) (0.33) 0.61 0.16Net Earnings (Loss) per Common
Share — Diluted . . . . . . . . . . . . . . .Continuing operations . . . . . . . . . . . . . 1.30 (1.34) 0.26 0.60 0.11Discontinued operations . . . . . . . . . . . . — (0.61) (0.59) — (0.05)
1.30 (1.95) (0.33) 0.60 0.06Weighted average Common Shares
outstanding — basic (millions) . . . . . . . 182 135 108 182 181Weighted average Common Shares
outstanding — diluted (millions) . . . . . 183 135 108 185 182
Supplemental Information — ContinuingOperations
EBITDA(4) . . . . . . . . . . . . . . . . . . . . 847 10.4% 214 4.1% 245 6.0% 328 12.5% 96 4.0%Normalized EBITDA(4) . . . . . . . . . . . . 612 7.5% 405 7.8% 310 7.6% 318 12.1% 253 10.5%Normalized Net Earnings for the period(4) 101 1.2% 79 1.5% 72 1.8% 153 5.8% 81 3.4%Normalized Net Earnings per Common
Share — basic(4) . . . . . . . . . . . . . . . . 0.55 0.59 0.67 0.84 0.45Normalized Net Earnings per Common
Share — diluted(4) . . . . . . . . . . . . . . 0.55 0.59 0.67 0.83 0.45Declared dividend per Common Share . . . 0.20 0.33 0.95 0.05 0.05
23

Fiscal Quarter EndedFiscal Year January 31, February 1,
2014 2013 2012(2) 2015 2014
Same Store Sales Percentage Change(5)
Continuing operations . . . . . . . . . . . . . . . . . . . . . . . . . . 7.5% 5.4% 4.0% 8.7% 6.6%Continuing operations (local currency basis) . . . . . . . . . . . 2.7% 2.8% 3.7% 3.2% 2.1%DSG(7) . . . . . . . . . . . . . . . . . . . . . . . . . . . . . . . . . . . . . 1.5% 3.5% 4.1% 2.3% 2.8%Saks Fifth Avenue(6) . . . . . . . . . . . . . . . . . . . . . . . . . . . . 2.1% 2.1% N/A 2.6% 2.1%OFF 5TH(6) . . . . . . . . . . . . . . . . . . . . . . . . . . . . . . . . . 15.1% 7.9% N/A 12.1% 7.9%
Store InformationStore count(8)
Hudson’s Bay . . . . . . . . . . . . . . . . . . . . . . . . . . . . . . 90 90 90Lord & Taylor . . . . . . . . . . . . . . . . . . . . . . . . . . . . . . 50 49 48Saks Fifth Avenue . . . . . . . . . . . . . . . . . . . . . . . . . . . 38 41 N/AOFF 5TH . . . . . . . . . . . . . . . . . . . . . . . . . . . . . . . . . 77 71 N/AHome Outfitters . . . . . . . . . . . . . . . . . . . . . . . . . . . . . 67 69 69
Total . . . . . . . . . . . . . . . . . . . . . . . . . . . . . . . . . . . . . . 322 320 207
Gross leasable area/Square footage (thousands)(8)
Hudson’s Bay . . . . . . . . . . . . . . . . . . . . . . . . . . . . . . 16,123 16,123 16,118Lord & Taylor . . . . . . . . . . . . . . . . . . . . . . . . . . . . . . 6,898 6,790 6,710Saks Fifth Avenue . . . . . . . . . . . . . . . . . . . . . . . . . . . 4,499 4,787 N/AOFF 5TH . . . . . . . . . . . . . . . . . . . . . . . . . . . . . . . . . 2,117 1,960 N/AHome Outfitters . . . . . . . . . . . . . . . . . . . . . . . . . . . . . 2,444 2,515 2,515
Total . . . . . . . . . . . . . . . . . . . . . . . . . . . . . . . . . . . . . . 32,081 32,175 25,343
Fiscal Year
(millions of Canadian dollars) 2014 2013 2012
(restated)(1,11) (restated)(1)
$ $ $
Balance Sheet DataCash . . . . . . . . . . . . . . . . . . . . . . . . . . . . . . . . . . . . . . . . . . . . . . 168 21 48Trade and other receivables . . . . . . . . . . . . . . . . . . . . . . . . . . . . . 212 137 74Inventories . . . . . . . . . . . . . . . . . . . . . . . . . . . . . . . . . . . . . . . . . 2,349 2,048 994Current assets . . . . . . . . . . . . . . . . . . . . . . . . . . . . . . . . . . . . . . . 2,829 2,310 1,420Property, plant and equipment . . . . . . . . . . . . . . . . . . . . . . . . . . . 4,606 4,110 1,335Intangible assets . . . . . . . . . . . . . . . . . . . . . . . . . . . . . . . . . . . . . 1,076 980 233Goodwill . . . . . . . . . . . . . . . . . . . . . . . . . . . . . . . . . . . . . . . . . . . 237 208 —Total assets . . . . . . . . . . . . . . . . . . . . . . . . . . . . . . . . . . . . . . . . . 9,072 7,942 3,252Current liabilities(9) . . . . . . . . . . . . . . . . . . . . . . . . . . . . . . . . . . . 1,803 1,475 1,215Loans and borrowings (including current portion) . . . . . . . . . . . . . 3,124 3,455 851Other liabilities (including current portion)(10) . . . . . . . . . . . . . . . . 745 202 94Shareholders’ equity . . . . . . . . . . . . . . . . . . . . . . . . . . . . . . . . . . 2,492 2,043 1,008
Notes:
(1) Certain previously reported figures have been restated due to the implementation of IFRIC 21. For more information, please refer to‘‘New Accounting Policies — Levies.’’
(2) Not restated for the implementation of IFRIC 21.
(3) As a percentage of retail sales.
(4) See tables below for a reconciliation of Net Earnings (Loss) — Continuing Operations to both EBITDA and Normalized EBITDA anda reconciliation of Net Earnings (Loss) — Continuing Operations to Normalized Net Earnings.
(5) The Company calculates same store sales on a year-over-year basis from stores operating for at least 13 months and includes digitalcommerce sales and clearance store sales. Consolidated same store sales include results for all banners.
(6) Same store sales of Saks Fifth Avenue and OFF 5TH are calculated in U.S. dollars.
24
(7) Excludes Home Outfitters for Fiscal 2013 and Fiscal 2012 (see ‘‘General Information’’) and is calculated in local currencies.
(8) Hudson’s Bay Company operates two Hudson’s Bay Outlets, two Zellers stores and four Lord & Taylor Outlets that are excluded fromthe store count and gross leasable area.
(9) Excludes current loans and borrowings of $265 million as at January 31, 2015, $532 million as at February 1, 2014 and $132 million asat February 2, 2013; and other liabilities of $76 million as at January 31, 2015 and nil as at February 1, 2014 and February 2, 2013.
(10) Includes deferred landlord incentives of $356 million as at January 31, 2015, $169 million as at February 1, 2014 and $71 million as atFebruary 2, 2013.
(11) Restated for measurement period adjustments based on new information relating primarily to inventories. Please see note 4 of theCompany’s audited consolidated financial statements for the year ended January 31, 2015 for additional disclosure on the impacts ofthe adjustments to previously reported amounts.
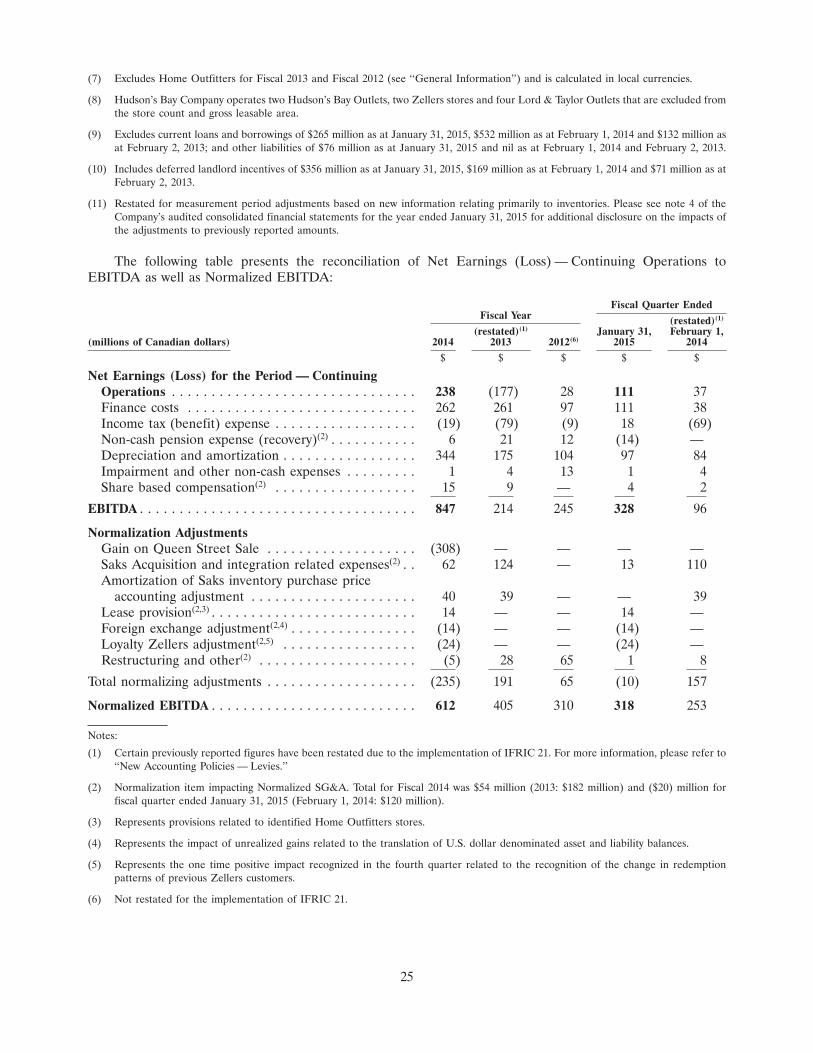
The following table presents the reconciliation of Net Earnings (Loss) — Continuing Operations toEBITDA as well as Normalized EBITDA:
Fiscal Quarter EndedFiscal Year (restated)(1)
(restated)(1) January 31, February 1,(millions of Canadian dollars) 2014 2013 2012(6) 2015 2014
$ $ $ $ $
Net Earnings (Loss) for the Period — ContinuingOperations . . . . . . . . . . . . . . . . . . . . . . . . . . . . . . . 238 (177) 28 111 37Finance costs . . . . . . . . . . . . . . . . . . . . . . . . . . . . . 262 261 97 111 38Income tax (benefit) expense . . . . . . . . . . . . . . . . . . (19) (79) (9) 18 (69)Non-cash pension expense (recovery)(2) . . . . . . . . . . . 6 21 12 (14) —Depreciation and amortization . . . . . . . . . . . . . . . . . 344 175 104 97 84Impairment and other non-cash expenses . . . . . . . . . 1 4 13 1 4Share based compensation(2) . . . . . . . . . . . . . . . . . . 15 9 — 4 2
EBITDA . . . . . . . . . . . . . . . . . . . . . . . . . . . . . . . . . . . 847 214 245 328 96
Normalization AdjustmentsGain on Queen Street Sale . . . . . . . . . . . . . . . . . . . (308) — — — —Saks Acquisition and integration related expenses(2) . . 62 124 — 13 110Amortization of Saks inventory purchase price
accounting adjustment . . . . . . . . . . . . . . . . . . . . . 40 39 — — 39Lease provision(2,3) . . . . . . . . . . . . . . . . . . . . . . . . . . 14 — — 14 —Foreign exchange adjustment(2,4) . . . . . . . . . . . . . . . . (14) — — (14) —Loyalty Zellers adjustment(2,5) . . . . . . . . . . . . . . . . . (24) — — (24) —Restructuring and other(2) . . . . . . . . . . . . . . . . . . . . (5) 28 65 1 8
Total normalizing adjustments . . . . . . . . . . . . . . . . . . . (235) 191 65 (10) 157
Normalized EBITDA . . . . . . . . . . . . . . . . . . . . . . . . . . 612 405 310 318 253
Notes:
(1) Certain previously reported figures have been restated due to the implementation of IFRIC 21. For more information, please refer to‘‘New Accounting Policies — Levies.’’
(2) Normalization item impacting Normalized SG&A. Total for Fiscal 2014 was $54 million (2013: $182 million) and ($20) million forfiscal quarter ended January 31, 2015 (February 1, 2014: $120 million).
(3) Represents provisions related to identified Home Outfitters stores.
(4) Represents the impact of unrealized gains related to the translation of U.S. dollar denominated asset and liability balances.
(5) Represents the one time positive impact recognized in the fourth quarter related to the recognition of the change in redemptionpatterns of previous Zellers customers.
(6) Not restated for the implementation of IFRIC 21.
25

The following table presents the reconciliation of Net Earnings (Loss) — Continuing Operations toNormalized Net Earnings.
Fiscal Quarter EndedFiscal Year (restated)(1)
(restated)(1) January 31, February 1,(millions of Canadian dollars) 2014 2013 2012(8) 2015 2014
$ $ $ $ $
Net Earnings (Loss) — Continuing Operations . . . . . . . 238 (177) 28 111 37
Normalization Adjustments(2)
Gain on Queen Street Sale . . . . . . . . . . . . . . . . . . . (261) — — — —Saks Acquisition and integration related expenses
and finance costs(3) . . . . . . . . . . . . . . . . . . . . . . . . 84 256 — 43 64Restructuring and other . . . . . . . . . . . . . . . . . . . . . . (4) 20 47 1 5Financing related adjustments(4) . . . . . . . . . . . . . . . . 47 8 7 25 4Amortization of Saks inventory purchase price
accounting adjustment . . . . . . . . . . . . . . . . . . . . . 24 24 — — 24Lease provision(5) . . . . . . . . . . . . . . . . . . . . . . . . . . 10 — — 10 —Foreign exchange adjustment(6) . . . . . . . . . . . . . . . . . (12) — — (12) —Loyalty Zellers adjustment(7) . . . . . . . . . . . . . . . . . . (18) — — (18) —Tax related adjustments . . . . . . . . . . . . . . . . . . . . . . (7) (52) (10) (7) (53)
Total normalizing adjustments . . . . . . . . . . . . . . . . . . . (137) 256 44 42 44
Normalized Net Earnings . . . . . . . . . . . . . . . . . . . . . . 101 79 72 153 81
Notes:
(1) Certain previously reported figures have been restated due to the implementation of IFRIC 21. For more information, please refer to‘‘New Accounting Policies — Levies.’’
(2) Net of tax as appropriate.
(3) Includes the recognition of non-cash finance costs (recoveries) related to warrants of $44 million (2013: nil) for the fiscal year and$35 million (2013: ($18 million)) for the fourth quarter.
(4) Includes write-off of deferred financing costs and penalties on early extinguishment of debt.
(5) Represents provisions related to identified Home Outfitters stores.
(6) Represents the impact of unrealized gains related to the translation of U.S. dollar denominated asset and liability balances.
(7) Represents the one time positive impact recognized in the fourth quarter related to the recognition of the change in redemptionpatterns of previous Zellers customers.
(8) Not restated for the implementation of IFRIC 21.
EBITDA is a non-IFRS measure that we use to assess our operating performance. EBITDA is defined asnet earnings before finance costs, income tax, non-cash share based compensation expense, depreciation andamortization expense, impairment and other non-cash expenses, and non-cash pension expense (recovery). TheCompany’s Canadian defined benefit pension plan is currently over-funded and as a result, pension expense isadjusted as management does not expect to make any payments in the foreseeable future.
Normalized EBITDA is defined as EBITDA adjusted to exclude: (i) business and organizationrestructuring/realignment charges; (ii) merger/acquisition costs and expenses; (iii) normalizing adjustments, ifany, related to transactions that are not associated with day-to-day operations; and (iv) EBITDA related todiscontinued operations. Normalized Net Earnings is defined as net earnings (loss) adjusted to exclude:(i) business and organization restructuring/realignment charges; (ii) merger/acquisition costs and expenses;(iii) normalizing adjustments, including those related to purchase accounting, if any, related to transactions thatare not associated with day-to-day operations; and (iv) net earnings (loss) related to discontinued operations.Normalized SG&A is defined as SG&A adjusted to exclude: (i) business and organizationrestructuring/realignment charges; (ii) merger/acquisition costs and expenses; (iii) normalizing adjustments, if
26

any, related to transactions that are not associated with day-to-day operations; and (iv) expenses related todiscontinued operations. We have included Normalized EBITDA, Normalized Net Earnings and NormalizedSG&A to provide investors and others with supplemental measures of our operating performance. We believeNormalized EBITDA, Normalized Net Earnings and Normalized SG&A are important supplemental measuresof operating performance because they eliminate items that have less bearing on our operating performance andthus highlight trends in our core business that may not otherwise be apparent when relying solely on IFRSfinancial measures. We also believe that securities analysts, investors, rating agencies and other interestedparties frequently use EBITDA, Normalized EBITDA, Normalized Net Earnings and Normalized SG&A in theevaluation of issuers, many of which present similar metrics when reporting their results. Our management alsouses Normalized EBITDA in order to facilitate operating performance comparisons from period to period,prepare annual operating budgets and assess our ability to meet our future debt service, capital expenditure andworking capital requirements and our ability to pay dividends on our shares. As other companies may calculateEBITDA, Normalized EBITDA, Normalized Net Earnings or Normalized SG&A differently than we do, thesemetrics are not comparable to similarly titled measures reported by other companies.
Results of Operations
Thirteen Week Period Ended January 31, 2015 Compared to the Thirteen Week Period Ended February 1, 2014
Retail Sales
Retail sales, which include digital commerce sales from all banners, were $2,632 million for the thirteenweek period ended January 31, 2015, an increase of $225 million or 9.3% from $2,407 million for the thirteenweek period ended February 1, 2014. Comparative growth at DSG and Saks in the quarter was further enhancedby currency improvements on the translation of U.S. dollar denominated sales.
Consolidated same store sales increased by 8.7%, or 3.2% on a local currency basis. Same store sales on alocal currency basis increased 2.3% at DSG, 2.6% at Saks Fifth Avenue and 12.1% at OFF 5TH.
Digital commerce sales totaled $304 million for the thirteen week period ended January 31, 2015. DSGincreased 44% year-over-year to $97 million and Saks increased 32% year-over-year to $207 million.
In terms of merchandise category performance, sales growth at DSG was driven by men’s apparel, ladies’shoes, outerwear and home products. Sales growth at Saks Fifth Avenue was driven by designer clothing,menswear and accessories. Sales growth at OFF 5TH was strong due to growth in menswear, women’s shoes andaccessories.
Gross Profit
Gross profit as reported was $1,073 million for the thirteen week period ended January 31, 2015, comparedto $886 million for the thirteen week period ended February 1, 2014. Included in gross profit is a conformingchange in the classification of advertising expense credits between SG&A and gross profit as they relate to theSaks business in 2014. Adjusting for this positive impact reduces our gross profit in Fiscal 2014 to $1,060 on acomparable basis. Adjusting for the negative impact associated with the amortization of inventory relatedpurchase accounting adjustments in Fiscal 2013 of $39 million, the gross profit in Fiscal 2013 improves to$925 million on a comparable basis, for an improvement of $135 million compared to the thirteen week periodended February 1, 2014. Improved performance at DSG and Saks, combined with additional improvements inreported gross profit dollars as a result of favourable currency conversion on U.S. dollar denominated sales,resulted in overall improvements in the quarterly gross profit.
Gross profit rate as reported, was 40.8% of retail sales, or an initial 400 basis point improvement over thethirteen week period ended February 1, 2014. Adjusting the gross profit rate in Fiscal 2014 and Fiscal 2013 forthe items identified above, exclusive of positive exchange impacts adjusts our gross profit rates in Fiscal 2014 to40.3%, and 38.4% in Fiscal 2013. Adjusting for favourable exchange rates on U.S. dollar denominated grossprofits, results in a comparable gross profit rate of 40.0% in Fiscal 2014, or a 160 basis point improvement whencompared to Fiscal 2013. Improved gross profit rates at DSG and Saks resulted in overall rate improvements ona comparable basis.
27

Selling, General & Administrative Expenses
SG&A was $736 million for the thirteen week period ended January 31, 2015, compared to $796 million forthe thirteen week period ended February 1, 2014. Included in SG&A for Fiscal 2014 is a conforming change inthe classification of advertising expense credits between SG&A and gross profit as they relate to the Saksbusiness in Fiscal 2014. Adjusting for this negative impact reduces SG&A in Fiscal 2014 to $723 million on acomparable basis.
For the thirteen week period ended January 31, 2015, Normalized SG&A net of the adjustments above, was$743 million compared to $676 million for the thirteen week period ended February 1, 2014, or a $67 millionincrease. Normalized SG&A has been calculated as SG&A above, excluding Saks Acquisition and integrationrelated expenses, restructuring and other, non-cash pension expense recovery and share-based compensation. Inaddition to these normalization adjustments, SG&A has also been negatively impacted in the quarter by thetranslation impact resulting from the conversion of U.S. dollar denominated expenses into Canadian dollars.
Excluding normalization items of ($20) million ($120 million in the prior year) and the impact ofadjustments described above, exclusive of exchange impacts, Normalized SG&A as a percentage of retail saleswas 28.2% compared to 28.1% for the prior year, an increase of 10 basis points. Adjusting for negative impactsdue to foreign exchange in the current year, Normalized SG&A as a percentage of retail sales was 28.0%, animprovement of 10 basis points over the prior year.
In addition, the current year SG&A includes impacts of incremental strategic investments in our HBCdigital business, higher occupancy costs associated with the Queen Street Sale and performance-based incentivecompensation, partially offset by operating synergies of $14 million in Q4. Absent these items, NormalizedSG&A as a percentage of retail sales was 27.6% or a 50 basis point improvement over Fiscal 2013.
EBITDA and Normalized EBITDA
EBITDA was $328 million in the thirteen week period ended January 31, 2015, compared to $96 million inthe thirteen week period ended February 1, 2014, an increase of $232 million.
Normalized EBITDA was $318 million, compared to $253 million in the thirteen week period endedFebruary 1, 2014, an increase of $65 million. Expressed as a percentage of sales, Normalized EBITDA marginwas 12.1% in the fourth quarter of Fiscal 2014 compared to 10.5% in the fourth quarter of the prior year.Improved performance at both DSG and Saks was driven by a strong sales season, improved gross profits andSG&A costs. Combined with added positive impacts related to foreign exchange, this has resulted in theimproved dollar and percentage based Normalized EBITDA results.
Finance Costs
Finance costs were $111 million in the thirteen week period ended January 31, 2015 compared to$38 million for the thirteen week period ended February 1, 2014, an increase of $73 million. The increase isprimarily related to the write-off of incremental non-cash deferred financing costs of approximately $27 million,and the net change in non-cash finance related costs associated with appreciating values related to outstandingshare purchase warrants of approximately $53 million. These charges were offset by small improvements inpension and other interest expense.
Income Tax Expense
Income tax expense was $18 million in the thirteen week period ended January 31, 2015, compared to abenefit of $69 million for the thirteen week period ended February 1, 2014. The effective income tax rate of14.0% for the thirteen week period ended January 31, 2015 decreased from 50.0% adjusted for the reversal of avaluation allowance recorded against deferred tax assets in the prior year for the thirteen week period endedFebruary 1, 2014, primarily due to recognition of capital losses in the current year and favourable prior yearadjustments in Fiscal 2014 compared to Fiscal 2013. In addition, non-deductible permanent differencesdecreased from the prior year, principally consisting of acquisition-related finance costs. These decreases wereoffset in part by a lower effect of international tax rate differentials.
28

Net Earnings — Continuing Operations
Net Earnings — Continuing Operations were $111 million in the thirteen week period ended January 31,2015 compared to $37 million in the thirteen week period ended February 1, 2014, an increase of $74 million.
Normalized Net Earnings — Continuing Operations
Normalized Net Earnings — Continuing Operations were $153 million in the thirteen week period endedJanuary 31, 2015 compared to $81 million in the thirteen week period ended February 1, 2014, an increase of$72 million.
Fifty-two Week Period Ended January 31, 2015 Compared to the Fifty-two Week Period Ended February 1, 2014
Retail Sales
Retail sales were $8,169 million for the fifty-two week period ended January 31, 2015, an increase of$2,946 million or 56.4% from $5,223 million for the fifty-two week period ended February 1, 2014. This increaseprimarily relates to the inclusion of Saks for the full fifty-two week period ended January 31, 2015.
Consolidated same store sales, increased 7.5% for the comparable fifty-two week period, or 2.7% on a localcurrency basis. Same store sales on a local currency basis increased 1.5% at DSG, 2.1% at Saks Fifth Avenue and15.1% at OFF 5TH.
Digital commerce sales totaled $900 million in the fifty-two week period ended January 31, 2015. Theinclusion of Saks contributed $651 million while DSG increased 66% year-over-year to $249 million.
In terms of merchandise category performance, sales growth at DSG was driven by men’s apparel, ladies’shoes, dress clothes and outerwear. Sales growth at Saks Fifth Avenue was driven by menswear and accessorieswhile at OFF 5TH, continues to be strong across the majority of categories.
Gross Profit
Gross profit for the fifty-two week period ended January 31, 2015 was $3,276 million compared to$2,006 million for the fifty-two week period ended February 1, 2014, an increase of $1,270 million, primarily dueto the inclusion of Saks for the fifty-two week period ended February 1, 2014. Gross profit rate as reported,expressed as a percentage of retail sales, was 40.1% or an increase of 170 basis points compared to the fifty-twoweek period ended February 1, 2014. Adjusting the gross profit rate for the negative impact of the amortizationof inventory-related purchase price accounting adjustments of $40 million in Fiscal 2014 ($39 million in Fiscal2013), and the impact of the conforming change in the classification of advertising expense credits betweenSG&A and gross profit for the Saks business in Fiscal 2014, overall gross profit rates improved to 40.4% inFiscal 2014, compared to 39.2% in Fiscal 2013, an increase of 120 basis points on a comparable basis. Improvedgross profit rates at DSG and the inclusion of Saks for the full fifty-two week period ended January 31, 2015, atgross profit rates higher than DSG resulted in overall rate improvements on a comparable basis.
Selling, General & Administrative Expenses
SG&A was $2,759 million or 33.8% of retail sales for the fifty-two week period ended January 31, 2015,compared to $1,826 million or 35.0% of retail sales for the fifty-two week period ended February 1, 2014. Theincrease in SG&A is primarily attributed to the inclusion of Saks. Included in SG&A for Fiscal 2014 is aconforming change in the classification of expense credits between SG&A and gross profit as they relate to theSaks business in Fiscal 2014. Adjusting for this negative impact reduces our SG&A in Fiscal 2014 to $2,746 on acomparable basis.
For the fifty-two week period ended January 31, 2015, Normalized SG&A net of adjustments above was$2,692 million compared to $1,644 million for the fifty-two week period ended February 1, 2014, or a$1,048 million increase. Normalized SG&A has been calculated as SG&A identified above and excludes SaksAcquisition and integration related expenses, non-cash pension expense, restructuring and other, and share-based compensation for the fifty-two week periods ended January 31, 2015 and February 1, 2014. In addition tothese normalization adjustments, SG&A for the fifty-two week period ended January 31, 2015 has also been
29

negatively impacted in the year by the translation impact resulting from the conversion of U.S. dollardenominated expenses into Canadian dollars.
Excluding normalization items of $54 million ($182 million in the prior year) net of adjustments describedabove including the adjustment for the impact of foreign exchange, Normalized SG&A as a percentage of retailsales was 32.9% in Fiscal 2014 compared to 31.5% for the prior year, or an increase of 140 basis points. Thisincrease was driven in large part by the full year impact of incremental strategic investments in our HBC digitalbusiness, higher occupancy costs associated with the Queen Street Sale and performance-based incentivecompensation, partially offset by operating synergies of approximately $50 million realized in Fiscal 2014 as aresult of the Saks Acquisition. Absent these items, Normalized SG&A as a percentage of retail sales was 32.3%.
EBITDA and Normalized EBITDA
EBITDA was $847 million or 10.4% of retail sales in the fifty-two week period ended January 31, 2015compared to $214 million or 4.1% of retail sales in the fifty-two week period ended February 1, 2014, an increaseof $633 million.
Normalized EBITDA was $612 million or 7.5% of retail sales in the fifty-two week period endedJanuary 31, 2015. This compares to Normalized EBITDA of $405 million or 7.8% of retail sales in the fifty-twoweek period ended February 1, 2014. The year-over-year increase of $207 million primarily relates to theinclusion of Saks for the full fifty-two week period ended January 31, 2015, improved performance at DSG andpositive translation impacts related to foreign exchange.
Finance Costs
Finance costs of $262 million for the fifty-two week period ended January 31, 2015 were comparable to$261 million for the fifty-two week period ended February 1, 2014. The net increase relates to incrementalinterest expense on long-term borrowings of $71 million, the write-off of incremental non-cash deferredfinancing costs totaling approximately $39 million, penalties and fees on term loans of $12 million and non-cashfinance related costs associated with appreciating values related to outstanding share purchase warrants ofapproximately $44 million. Finance costs in the prior year included $153 million of non-recurring non-cashmark-to-market adjustments on equity commitment forwards (see notes 6 and 18 to the audited annualconsolidated financial statements for the year ended January 31, 2015) and bridge financing fees of $12 millionrelated to the Saks Acquisition.
Income Tax Benefit
Income tax benefit was $19 million for the fifty-two week period ended January 31, 2015 compared to$79 million for the fifty-two week period ended February 1, 2014. The effective income tax rate of (8.7%) for thefifty-two week period ended January 31, 2015 decreased from 10.2% adjusted for the reversal of a valuationallowance recorded against deferred tax assets for the fifty-two week period ended February 1, 2014, primarilydue to lower non-deductible permanent differences in the current year, principally consisting of acquisition-related finance costs and the favourable tax treatment related to the Queen Street Sale (see note 28 of theaudited consolidated financial statements for Fiscal 2014). Further decreases in the effective tax rate relate tothe effect of international tax rate differentials, recognition of capital losses in the current year and favourableprior year adjustments in Fiscal 2014 compared to Fiscal 2013.
Net Earnings — Continuing Operations
Net Earnings — Continuing Operations were $238 million in the fifty-two week period ended January 31,2015 compared to a Net Loss — Continuing Operations of $177 million in the fifty-two week period endedFebruary 1, 2014, an increase in earnings of $415 million. The year-over-year increase in earnings is primarily theresult of the gain recognized on the Queen Street Sale, and the inclusion of Saks for the full fifty-two weekperiod ended January 31, 2015.
30
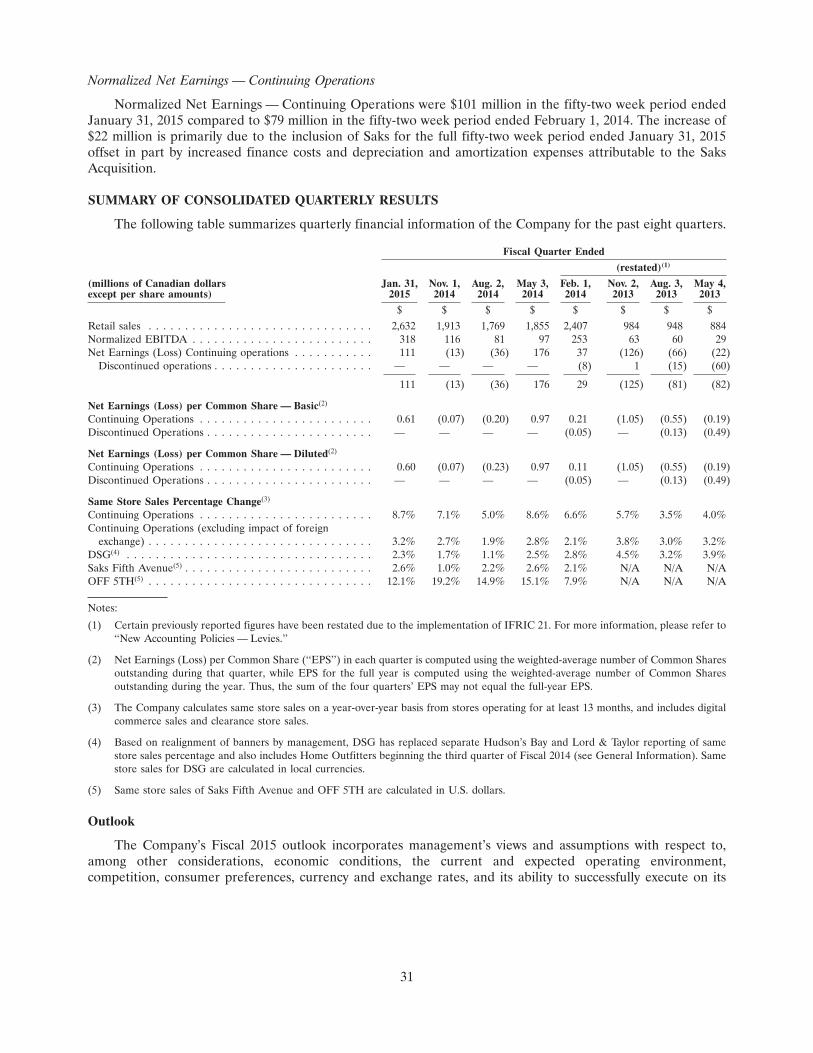
Normalized Net Earnings — Continuing Operations
Normalized Net Earnings — Continuing Operations were $101 million in the fifty-two week period endedJanuary 31, 2015 compared to $79 million in the fifty-two week period ended February 1, 2014. The increase of$22 million is primarily due to the inclusion of Saks for the full fifty-two week period ended January 31, 2015offset in part by increased finance costs and depreciation and amortization expenses attributable to the SaksAcquisition.
SUMMARY OF CONSOLIDATED QUARTERLY RESULTS
The following table summarizes quarterly financial information of the Company for the past eight quarters.
Fiscal Quarter Ended
(restated)(1)
(millions of Canadian dollars Jan. 31, Nov. 1, Aug. 2, May 3, Feb. 1, Nov. 2, Aug. 3, May 4,except per share amounts) 2015 2014 2014 2014 2014 2013 2013 2013
$ $ $ $ $ $ $ $Retail sales . . . . . . . . . . . . . . . . . . . . . . . . . . . . . . . 2,632 1,913 1,769 1,855 2,407 984 948 884Normalized EBITDA . . . . . . . . . . . . . . . . . . . . . . . . . 318 116 81 97 253 63 60 29Net Earnings (Loss) Continuing operations . . . . . . . . . . . 111 (13) (36) 176 37 (126) (66) (22)
Discontinued operations . . . . . . . . . . . . . . . . . . . . . . — — — — (8) 1 (15) (60)
111 (13) (36) 176 29 (125) (81) (82)
Net Earnings (Loss) per Common Share — Basic(2)
Continuing Operations . . . . . . . . . . . . . . . . . . . . . . . . 0.61 (0.07) (0.20) 0.97 0.21 (1.05) (0.55) (0.19)Discontinued Operations . . . . . . . . . . . . . . . . . . . . . . . — — — — (0.05) — (0.13) (0.49)
Net Earnings (Loss) per Common Share — Diluted(2)
Continuing Operations . . . . . . . . . . . . . . . . . . . . . . . . 0.60 (0.07) (0.23) 0.97 0.11 (1.05) (0.55) (0.19)Discontinued Operations . . . . . . . . . . . . . . . . . . . . . . . — — — — (0.05) — (0.13) (0.49)
Same Store Sales Percentage Change(3)
Continuing Operations . . . . . . . . . . . . . . . . . . . . . . . . 8.7% 7.1% 5.0% 8.6% 6.6% 5.7% 3.5% 4.0%Continuing Operations (excluding impact of foreign
exchange) . . . . . . . . . . . . . . . . . . . . . . . . . . . . . . . 3.2% 2.7% 1.9% 2.8% 2.1% 3.8% 3.0% 3.2%DSG(4) . . . . . . . . . . . . . . . . . . . . . . . . . . . . . . . . . . 2.3% 1.7% 1.1% 2.5% 2.8% 4.5% 3.2% 3.9%Saks Fifth Avenue(5) . . . . . . . . . . . . . . . . . . . . . . . . . . 2.6% 1.0% 2.2% 2.6% 2.1% N/A N/A N/AOFF 5TH(5) . . . . . . . . . . . . . . . . . . . . . . . . . . . . . . . 12.1% 19.2% 14.9% 15.1% 7.9% N/A N/A N/A
Notes:
(1) Certain previously reported figures have been restated due to the implementation of IFRIC 21. For more information, please refer to‘‘New Accounting Policies — Levies.’’
(2) Net Earnings (Loss) per Common Share (‘‘EPS’’) in each quarter is computed using the weighted-average number of Common Sharesoutstanding during that quarter, while EPS for the full year is computed using the weighted-average number of Common Sharesoutstanding during the year. Thus, the sum of the four quarters’ EPS may not equal the full-year EPS.
(3) The Company calculates same store sales on a year-over-year basis from stores operating for at least 13 months, and includes digitalcommerce sales and clearance store sales.
(4) Based on realignment of banners by management, DSG has replaced separate Hudson’s Bay and Lord & Taylor reporting of samestore sales percentage and also includes Home Outfitters beginning the third quarter of Fiscal 2014 (see General Information). Samestore sales for DSG are calculated in local currencies.
(5) Same store sales of Saks Fifth Avenue and OFF 5TH are calculated in U.S. dollars.
Outlook
The Company’s Fiscal 2015 outlook incorporates management’s views and assumptions with respect to,among other considerations, economic conditions, the current and expected operating environment,competition, consumer preferences, currency and exchange rates, and its ability to successfully execute on its
31

strategic priorities and initiatives. The following outlook is fully qualified by the ‘‘Forward-Looking Statements’’section of this MD&A:
• Total sales of between $9.0 and $9.3 billion. This implies low single digit consolidated same store salesgrowth, calculated on a local currency basis.
• Capital investments, net of landlord incentives, of between $350 million and $400 million. This activityincludes the addition of one Saks Fifth Avenue store and between 12 and 14 OFF 5TH stores.
In Fiscal 2015, the Company intends to invest an incremental $50 million in strategic growth initiatives,including an accelerated pace of new store openings at OFF 5TH, strengthening its digital and all-channelpresence and capabilities, and incurring pre-opening costs associated with the 2016 expansion of Saks andOFF 5TH into Canada.
This guidance reflects a U.S. dollar foreign exchange rate assumption of USD:CAD = 1:1.24 for Fiscal2015. Significant variation in this foreign exchange rate assumption would impact the guidance. The actualaverage foreign exchange rate incorporated in the Company’s reported sales results for Fiscal 2014 wasUSD:CAD = 1:1.12.
Liquidity and Capital Resources
Cash Flows
Total cash, including restricted cash, is managed to remain at minimal levels by drawing on or repaying ourrevolving credit facilities. Our liquidity and capital resources are primarily impacted by: (i) current cash and cashequivalents; (ii) operating activities; (iii) investing activities; and (iv) financing activities. The following tablesummarizes cash flows by activity:
Fiscal Quarter EndedFiscal Year January 31, February 1,
(millions of Canadian dollars) 2014 2013 2015 2014
$ $ $ $
Continuing operationsOperating activities . . . . . . . . . . . . . . . . . . . . . . . . . . . . . . . . . . . 547 164 667 299Investing activities . . . . . . . . . . . . . . . . . . . . . . . . . . . . . . . . . . . . 441 (3,013) (78) (2,864)Financing activities . . . . . . . . . . . . . . . . . . . . . . . . . . . . . . . . . . . (848) 2,906 (471) 2,552
Increase (decrease) in cash from continuing operations . . . . . . . . . . . 140 57 118 (13)Foreign exchange gain (loss) on cash . . . . . . . . . . . . . . . . . . . . . . . . 7 (1) 6 (2)(Decrease) increase in cash from discontinued operations . . . . . . . . . — (83) — 10Cash at beginning of period . . . . . . . . . . . . . . . . . . . . . . . . . . . . . . 21 48 44 26
Cash at end of period . . . . . . . . . . . . . . . . . . . . . . . . . . . . . . . . . . . 168 21 168 21
Net Cash Flow — Operating Activities
Net cash inflow from operating activities was $547 million for the fifty-two week period ended January 31,2015 compared to $164 million for the fifty-two week period ended February 1, 2014, an increase of $383 million.This increase is due primarily to improved cash from operations and improvements in working capital offset tosome extent by cash interest costs.
For the thirteen week period ended January 31, 2015, net cash inflow from operating activities was$667 million compared to an inflow of $299 million for the thirteen week period ended February 1, 2014. Theincrease of $368 million is attributed primarily to improved cash from operations and improvements in workingcapital.
32
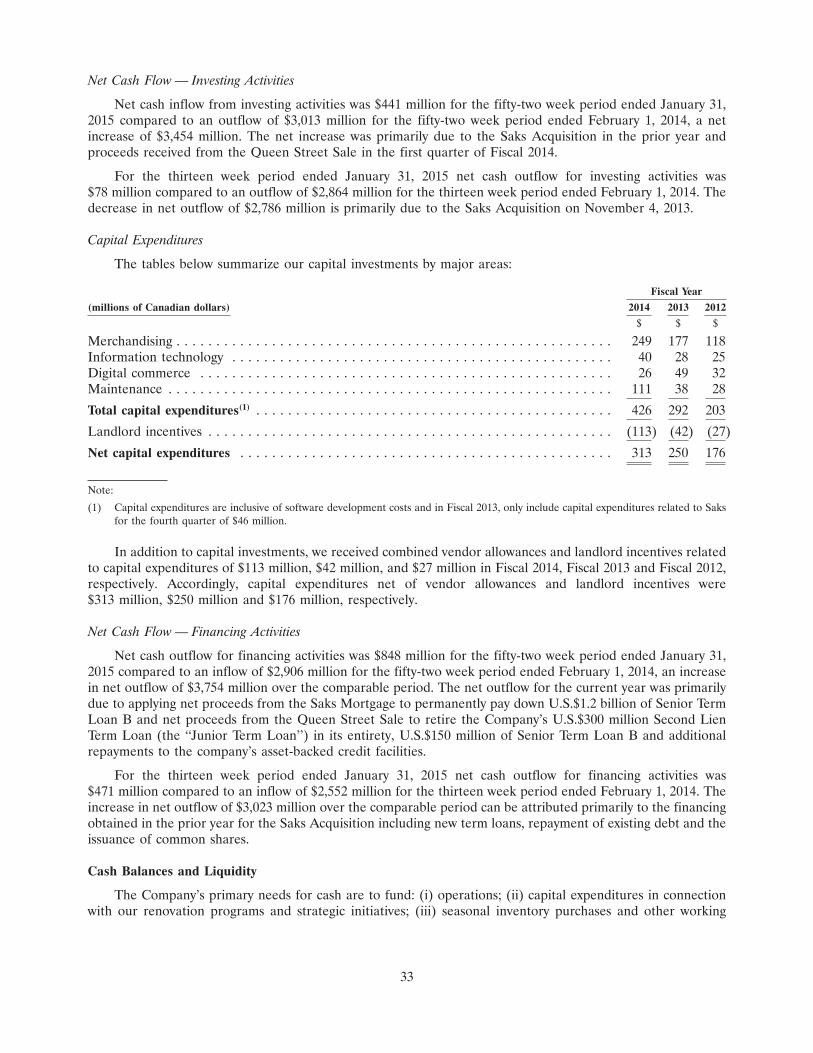
Net Cash Flow — Investing Activities
Net cash inflow from investing activities was $441 million for the fifty-two week period ended January 31,2015 compared to an outflow of $3,013 million for the fifty-two week period ended February 1, 2014, a netincrease of $3,454 million. The net increase was primarily due to the Saks Acquisition in the prior year andproceeds received from the Queen Street Sale in the first quarter of Fiscal 2014.
For the thirteen week period ended January 31, 2015 net cash outflow for investing activities was$78 million compared to an outflow of $2,864 million for the thirteen week period ended February 1, 2014. Thedecrease in net outflow of $2,786 million is primarily due to the Saks Acquisition on November 4, 2013.
Capital Expenditures
The tables below summarize our capital investments by major areas:
Fiscal Year
(millions of Canadian dollars) 2014 2013 2012
$ $ $
Merchandising . . . . . . . . . . . . . . . . . . . . . . . . . . . . . . . . . . . . . . . . . . . . . . . . . . . . . . . 249 177 118Information technology . . . . . . . . . . . . . . . . . . . . . . . . . . . . . . . . . . . . . . . . . . . . . . . . 40 28 25Digital commerce . . . . . . . . . . . . . . . . . . . . . . . . . . . . . . . . . . . . . . . . . . . . . . . . . . . . 26 49 32Maintenance . . . . . . . . . . . . . . . . . . . . . . . . . . . . . . . . . . . . . . . . . . . . . . . . . . . . . . . . 111 38 28
Total capital expenditures(1) . . . . . . . . . . . . . . . . . . . . . . . . . . . . . . . . . . . . . . . . . . . . . 426 292 203
Landlord incentives . . . . . . . . . . . . . . . . . . . . . . . . . . . . . . . . . . . . . . . . . . . . . . . . . . . (113) (42) (27)
Net capital expenditures . . . . . . . . . . . . . . . . . . . . . . . . . . . . . . . . . . . . . . . . . . . . . . . 313 250 176
Note:
(1) Capital expenditures are inclusive of software development costs and in Fiscal 2013, only include capital expenditures related to Saksfor the fourth quarter of $46 million.
In addition to capital investments, we received combined vendor allowances and landlord incentives relatedto capital expenditures of $113 million, $42 million, and $27 million in Fiscal 2014, Fiscal 2013 and Fiscal 2012,respectively. Accordingly, capital expenditures net of vendor allowances and landlord incentives were$313 million, $250 million and $176 million, respectively.
Net Cash Flow — Financing Activities
Net cash outflow for financing activities was $848 million for the fifty-two week period ended January 31,2015 compared to an inflow of $2,906 million for the fifty-two week period ended February 1, 2014, an increasein net outflow of $3,754 million over the comparable period. The net outflow for the current year was primarilydue to applying net proceeds from the Saks Mortgage to permanently pay down U.S.$1.2 billion of Senior TermLoan B and net proceeds from the Queen Street Sale to retire the Company’s U.S.$300 million Second LienTerm Loan (the ‘‘Junior Term Loan’’) in its entirety, U.S.$150 million of Senior Term Loan B and additionalrepayments to the company’s asset-backed credit facilities.
For the thirteen week period ended January 31, 2015 net cash outflow for financing activities was$471 million compared to an inflow of $2,552 million for the thirteen week period ended February 1, 2014. Theincrease in net outflow of $3,023 million over the comparable period can be attributed primarily to the financingobtained in the prior year for the Saks Acquisition including new term loans, repayment of existing debt and theissuance of common shares.
Cash Balances and Liquidity
The Company’s primary needs for cash are to fund: (i) operations; (ii) capital expenditures in connectionwith our renovation programs and strategic initiatives; (iii) seasonal inventory purchases and other working
33

capital requirements; and (iv) debt service. Working capital requirements are at their highest in the latter half ofthe fiscal year as inventory builds through the fall, peaking just before the holiday selling season.
The Company’s primary sources of funds are cash flows provided by operations, landlord incentives, ourHBC and U.S. revolving credit facilities, and mortgage-backed real estate financing. Other potential sources offunding may include new corporate loans and mortgages, the sale and leaseback of real estate properties, sellingreal estate, selling other company assets or the issuance of equity. The availability of funding sources isdependent on economic conditions, capital markets, and our financial condition.
The Company may consider additional acquisitions of, and investments in, retail businesses, and othercomplimentary assets or companies. Transactions, if any, are expected to be financed through a combination ofthe following sources: cash on hand, borrowing under existing or new credit facilities and the issuance oflong-term debt or other securities, including common shares.
Funding Capacity
The Company anticipates that we will be able to satisfy our working capital requirements, planned capitalexpenditures and debt service requirements with proceeds from cash flows from operations, short-term tradecredit, seasonal borrowings under our revolving credit facilities and other sources of financing. The Companyexpects to generate adequate cash flow from operating activities to sustain current levels of operations.
Management believes that there is not a significant risk of default and/or arrears on lease payments, interestor principal payment of debt, or of a breach of debt covenants.
There is no provision in debt, lease, or other arrangements that could trigger an additional fundingrequirement for the Company. There are no legal or practical restrictions on the ability of subsidiaries totransfer funds to the Company that would affect the ability to meet its obligations as and when they fall due.
On February 25, 2014, the Company completed the sale of its downtown Toronto flagship store andadjacent Simpson’s Tower office complex. A portion of the proceeds from the Queen Street Sale was used toretire in entirety the Company’s U.S.$300 million Junior Term Loan and permanently pay downU.S.$150 million of the Senior Term Loan B. The balance of the net proceeds was used to reduce theoutstanding balance of the Company’s Canadian revolving credit facility.
On December 3, 2014, the Company obtained the Saks Mortgage. Net of associated fees and expenses, allproceeds were utilized to permanently pay down U.S.$1.2 billion of the Company’s Senior Term Loan B.
HBC Revolving Credit Facility
HBC is party to a credit facility with Bank of America, N.A. (through its Canadian branch), Wells FargoFinancial Corporation Canada, GE Canada Finance Holding Company, JPMorgan Chase Bank, N.A., TorontoBranch, CIBC Asset-Based Lending, Merrill Lynch, Pierce, Fenner & Smith Incorporated, GE Capital Markets(Canada) Limited, GE Capital Markets, Inc. and certain other financial institutions (the ‘‘HBC Revolving CreditFacility’’). As of January 31, 2015, HBC owed $159 million under the HBC Revolving Credit Facility. HBC is incompliance with all covenants contained in the HBC Revolving Credit Facility.
The HBC Revolving Credit Facility has total availability of $600 million (reduced from $750 millionpursuant to an amendment dated December 17, 2014, which also extended the maturity date to December 17,2019). The HBC Revolving Credit Facility is subject to a borrowing base, based predominantly on eligibleinventory of HBC (excluding L&T Acquisition and its subsidiaries) and eligible credit card receivables of HBCand certain of its subsidiaries (excluding L&T Acquisition and its subsidiaries). The HBC Revolving CreditFacility bears interest based on various rates depending on which facility is utilized, including the Canadianprime rate, CDOR rate, United States index rate and LIBOR. The HBC Revolving Credit Facility is available tofinance working capital requirements, capital expenditures or other general corporate purposes and to makecertain restricted payments, investments and repayments of indebtedness, and can be drawn in both U.S. andCanadian dollars. As the HBC Revolving Credit Facility is available for and used to finance working capitalrequirements, capital expenditures and other general corporate purposes, it has been classified in the
34

consolidated balance sheets as part of current loans and borrowings. However, the Company is not required torepay the balance outstanding as at January 31, 2015 until the maturity date of December 17, 2019.
The HBC Revolving Credit Facility contains restrictive covenants customary for facilities of this nature,including restrictions on the incurrence of indebtedness, restrictions on capital expenditures and restrictions onpayments to affiliates and shareholders. It also includes events of default and representations and warrantiesthat are customary for credit facilities of this nature.
The HBC Revolving Credit Facility is secured by a first priority security interest over all inventory andaccounts receivable in Canada.
Yorkdale Mortgage
On May 22, 2013 the Company entered into an agreement with Murray & Company Holdings Limited for a$50 million mortgage (the ‘‘Yorkdale Mortgage’’). The Yorkdale Mortgage matures on May 22, 2023, bearsinterest at 4.89% per annum over a 25 year amortization schedule and is secured by a first mortgage of aleasehold interest of the Hudson’s Bay store at the Yorkdale Shopping Centre in Toronto, Ontario. The proceedsof the Yorkdale Mortgage were used to partially prepay the HBC Term Loan. On December 1, 2014, Murray &Company Holdings Limited assigned the mortgage to GMI Servicing Inc.
Senior Term Loan B
On November 4, 2013, the Company entered into a U.S.$2,000 million senior secured term loan facility withBank of America, N.A., as the administrative agent (the ‘‘Senior Term Loan B’’).
The Senior Term Loan B matures November 4, 2020 and carries interest at a rate of LIBOR plus 3.75% perannum. The agreement is structured such that LIBOR will be deemed to be not less than 1% per annum(‘‘LIBOR Floor’’). The Senior Term Loan B is subject to mandatory prepayments. A portion of the proceedsfrom Senior Term Loan B was used to repay in full the existing HBC senior term loan facility (‘‘HBC TermLoan’’) and the Lord & Taylor amended and restated credit facility (‘‘Lord & Taylor Term Loan’’). Theremainder was used to finance the Saks Acquisition.
The Senior Term Loan B is secured by a second lien over all of the Company’s inventory and accountsreceivable, a first lien over substantially all other assets as well as a pledge of the shares of certain of theCompany’s subsidiaries. The Senior Term Loan B contains customary representations and warranties, positiveand negative covenants, reporting requirements and events of default. The Company is in compliance with allcovenants contained in the Senior Term Loan B credit agreement.
On February 25, 2014, the Company, using part of the proceeds of the Queen Street Sale, permanently paiddown U.S.$150 million of the Senior Term Loan B, and on December 3, 2014, the Company permanently paiddown U.S.$1.2 billion using proceeds of the Saks Mortgage, net of associated fees and expenses.
U.S. Revolving Credit Facility
L&T Acquisition is party to a credit agreement with Bank of America, N.A. as Administrative Agent andCollateral Agent dated November 4, 2013. As of January 31, 2015, L&T Acquisition owed U.S.$85 million underthe U.S. Revolving Credit Facility. L&T Acquisition is in compliance with all covenants contained in theU.S. Revolving Credit Facility.
The U.S. Revolving Credit Facility provides a U.S.$1.1 billion revolving line of credit through November 4,2018 (increased from U.S.$950 million pursuant to an amendment dated December 11, 2014) and refinancedrevolving credit facilities previously in place with Saks and Lord & Taylor. This revolving line of credit is subjectto a borrowing base, based predominantly on eligible inventory and accounts receivable of Lord & Taylor, Saksand their respective subsidiaries. The U.S. Revolving Credit Facility is available to finance working capital needs,capital expenditures, operating activities and to support the issuance of standby letters of credit. TheU.S. Revolving Credit Facility has multiple interest rate charge options that are based on the U.S. prime rate,Federal Funds rate and LIBOR. As the U.S. Revolving Credit Facility is available for and used to financeworking capital requirements, capital expenditures and other operating activities, it has been classified in the
35

consolidated balance sheets as part of current loans and borrowings. However, the Company is not required torepay the balance outstanding as at January 31, 2015 until the maturity date of November 4, 2018.
The U.S. Revolving Credit Facility contains restrictive covenants customary for credit facilities of thisnature, including restrictions on the incurrence of indebtedness, financial maintenance covenants, andrestrictions on payments to affiliates and shareholders. It also includes events of default and representations andwarranties that are customary for credit facilities of this nature.
The U.S. Revolving Credit Facility is secured by a first lien security interest over all inventory and accountsreceivables in the United States (Lord & Taylor and Saks).
Saks Mortgage
On December 3, 2014, the Company announced the closing of a U.S.$1.25 billion, 20-year mortgage loan,on the ground portion of the Company’s Saks Fifth Avenue flagship property in New York City, located at611 Fifth Avenue with a syndicate of lenders including an affiliate of Morgan Stanley Canada Limited (the ‘‘SaksMortgage’’). The mortgage is secured by a first mortgage lien on the fee interest in the property, together withall ground lease rents, profits and revenue. The Saks Mortgage contains restrictive covenants, events of defaultand representations and warranties that are customary for credit facilities of this nature.
All proceeds from the Saks Mortgage, net of associated fees and expenses, were utilized to permanently paydown U.S.$1.2 billion of the Senior Term Loan B. The Saks Mortgage is interest-only, with a fixed interest rateof 4.39%, and does not require any principal amortization over its 20 year term. The Company is in compliancein all material respects with the terms of its indebtedness to the lenders under the Saks Mortgage.
Lord & Taylor Mortgage
On September 7, 2012, LT 424 LLC (‘‘LT 424’’), which is an indirect subsidiary of Lord & Taylor, enteredinto a U.S.$250 million syndicated floating rate senior mortgage loan with an affiliate of CIBC WorldMarkets Inc., as Administrative Agent of the syndicate of lenders, which matures on September 10, 2017(the ‘‘Lord & Taylor Mortgage’’). Lord & Taylor utilized the net proceeds of this loan, approximatelyU.S.$243 million, to reduce the balance of the Lord & Taylor Term Loan.
Interest is charged on the Lord & Taylor Mortgage at a rate of LIBOR plus 3.0%. LT 424 has entered intointerest rate swap arrangements, the effect of which is to fix the interest rate related to the Lord & TaylorMortgage at 3.85%.
The Lord & Taylor Mortgage has no mandatory principal repayments during the first three years, withmonthly amortization payments required during the final two years, based upon a 30 year straight-lineamortization schedule with an interest rate of 7%. LT 424 has the ability to prepay the Lord & Taylor Mortgageafter the first two years with a fee to the lenders of 2%, which fee drops to 1% after three years, and without feesafter September 10, 2016. Any prepayments are applied to reduce the then remaining scheduled installments.
The Lord & Taylor Mortgage contains customary representations and warranties, positive and negativecovenants, reporting requirements and events of default. Lord & Taylor is in compliance with all covenantscontained in the Lord & Taylor Mortgage. As security for the Lord & Taylor Mortgage the Company granted afirst priority mortgage in the Fifth Avenue Lord & Taylor property.
36

Contractual Obligations
Our significant contractual obligations and commitments as of January 31, 2015 are as follows:
Fiscal Year
(millions of Canadian dollars(1)) Total 2015 2016 2017 2018 2019 Thereafter
$ $ $ $ $ $
Lease financingOperating lease arrangements(2,3) . . . . . . . . . . . . . . . . . . 1,672 143 133 123 110 99 1,064
Short-term borrowings(4)
HBC Revolving Credit Facility . . . . . . . . . . . . . . . . . . . 159 159 — — — — —U.S. Revolving Credit Facility . . . . . . . . . . . . . . . . . . . . 108 108 — — — — —
Long-term borrowingsSenior Term Loan B(6,7) . . . . . . . . . . . . . . . . . . . . . . . . 826 — — — — — 826Yorkdale Mortgage . . . . . . . . . . . . . . . . . . . . . . . . . . . . 48 2 1 1 1 1 42Lord & Taylor Mortgage . . . . . . . . . . . . . . . . . . . . . . . . 318 1 3 314 — — —Saks Mortgage(7) . . . . . . . . . . . . . . . . . . . . . . . . . . . . . 1,599 — — — — — 1,599Finance leases and other(5) . . . . . . . . . . . . . . . . . . . . . . 165 20 15 3 2 2 123Purchase obligations(8) . . . . . . . . . . . . . . . . . . . . . . . . . 151 66 20 15 12 11 27Other obligations(9) . . . . . . . . . . . . . . . . . . . . . . . . . . . 1,424 1,318 27 11 68 — —
Total obligations . . . . . . . . . . . . . . . . . . . . . . . . . . . . . 6,470 1,817 199 467 193 113 3,681
Notes:
(1) U.S. dollar denominated debt translated to Canadian dollars at a rate of U.S.$1.00: C$1.2711.
(2) Represents future minimum lease payments under non-cancellable operating leases. Minimum lease payments are defined as thepayments over the lease term that the Company is or can be required to make, excluding contingent rent, costs for services and taxes tobe paid by and reimbursed to the lessor, together with any guaranteed amounts.
(3) Included in these figures are future minimum payments relating to Zellers of $4 million, $3 million, $3 million, $3 million, $2 millionand $4 million for Fiscal Years 2015 — 2019 and thereafter, respectively.
(4) The HBC Revolving Credit Facility and U.S. Revolving Credit Facility mature on December 17, 2019 and November 4, 2018,respectively.
(5) Includes liability related to real estate finance leases of $130 million, all of which was assumed through the acquisition of Saks. Theliability includes $93 million primarily related to presumed lease renewals that the Company is not contractually committed to.
(6) On February 25, 2014, the Company closed its agreement to sell its downtown Toronto flagship retail complex and the Simpson’s Towerlocated at 401 Bay Street to an affiliate of The Cadillac Fairview Corporation Limited for a purchase price of $650 million. Proceeds ofthe transaction were used to retire in entirety the Junior Term Loan and permanently pay down U.S.$150 million of the Senior TermLoan B.
(7) On December 3, 2014, the Company closed the Saks Mortgage using the net proceeds from the transaction to permanently pay downU.S.$1.2 billion of the Senior Term Loan B.
(8) Includes contractual obligations to purchase goods or services of a material amount where the contract prescribes fixed or minimumvolumes to be purchased or payments to be made within a fixed period of time for a set or variable price. These are only estimates ofanticipated financial commitments under these arrangements and the amount of actual payments will vary. These purchase obligationsdo not include purchase orders issued or agreements made in the ordinary course of business which are solely for goods which aremeant for resale, nor do they include any contracts which may be terminated on relatively short notice or with relatively insignificantcost or liability to the Company.
(9) Other obligations include trade and other payables, derivatives and other liabilities.
Leases
The Company has long-term operating lease obligations that are not capitalized on the consolidatedbalance sheet in accordance with IFRS. These leases are related to store locations, warehouse facilities andequipment and are reflected within ‘‘Operating lease arrangements’’ included in the table above. Leases typicallyhave an original term ranging from 15 to 25 years and provide for renewal periods exercisable at the Company’s
37
option. Operating leases relating to property typically require that the Company pays associated real estate taxesand common area maintenance costs in addition to the minimum lease payments noted above. Such costs varyfrom period to period and totaled $157 million and $151 million in Fiscal 2014 and Fiscal 2013, respectively. Inaddition to operating leases relating to store locations, the Company also holds finance leases related toequipment, which are capitalized on the consolidated balance sheet in accordance with IFRS. Upon the closingof the proposed joint venture transactions with Simon and RioCan (the ‘‘JV Transactions’’), the Company’sretail operations are expected to enter into long-term lease arrangements with the joint ventures with averagelease terms of 20 years, plus renewal options.
Lease Guarantees
As part of normal operations, the Company regularly reviews its real estate portfolio and store locations.Based on the reviews conducted in prior years, the Company has closed certain store premises that it deemed tobe non-strategic. Where these premises were leased, when possible, the Company assigned its leases to otherretail operators, but remained obligated to the landlord on those leases as the original tenant thereunder despitethe assignment. If the assignee were to default on the lease agreement, the Company would remain obligated tothe landlord for payment of amounts due under the lease. The terms of these assigned leases can extend up tothe year 2024. As of January 31, 2015, these leases have future minimum lease payments of $154 million(February 1, 2014: $150 million), of which $113 million (February 1, 2014: $145 million) relates to leasesassigned to Target (or its affiliates), in addition to other lease-related expenses, such as property taxes andcommon area maintenance. The Company has a full, unconditional and continuing guarantee and indemnityfrom Target regarding all ongoing obligations related to the store leases acquired by Target (or its affiliates)which include the assumption of all obligations and liabilities of Zellers arising under these leases after closing ofsuch sale. The Company’s obligation would be offset by payments from existing or future assignees and theirobligations to the Company to comply with the assigned leases. Potential liabilities related to these guaranteesmay be subject to certain defences by the Company. The Company does not expect to make any significantpayments with respect to these lease obligations and believes that the risk of significant loss is low.
On March 6, 2015, Target Canada’s affiliates surrendered eleven leases (which Zellers previously assignedto Target, or its affiliates) to the applicable landlords in connection with Target Canada affiliates’ proceedingsunder the Companies’ Creditors Arrangement Act. In connection with such surrender of leases, the applicablelandlords released certain parties, including HBC, Zellers and their respective predecessors, from all claimsarising out of or relating to, among other things, such leases.
Short-term and Long-term Borrowings
As of January 31, 2015, Company’s drawings on the HBC Revolving Credit Facility and the U.S. RevolvingCredit Facility were $159 million and $108 million, respectively.
On February 25, 2014, the Company closed the Queen Street Sale. Proceeds of the transaction were used toretire in entirety the Junior Term Loan and to permanently pay down U.S.$150 million of the Senior TermLoan B. The balance of the net proceeds was used to reduce the outstanding balance of the HBC RevolvingCredit Facility.
On December 3, 2014 the Company closed the U.S.$1.25 billion, 20-year mortgage on the ground portion ofits Saks Fifth Avenue flagship in New York City. All proceeds from the Saks Mortgage, net of associated feesand expenses, were utilized to permanently pay down U.S.$1.2 billion of the Senior Term Loan B.
Procurement
The above contractual obligations table includes purchase orders for goods not for resale that areenforceable and legally binding on the Company and which specify all significant terms including: fixed orminimum quantities to be purchased; fixed minimum or variable price provisions; and the approximate timing ofthe transaction. The purchase obligations figures disclosed above also include obligations in respect of minimumroyalty payments due to certain key suppliers.
38

Pensions
The defined benefit component of the Company’s Canadian pension plan is currently over-funded, and as aresult the Company does not expect to make significant contributions to it over the next five years, subject to theperformance of the plan assets. The Company has non-pension Canadian employee benefit plans, which are notfunded. For Canadian defined contribution plans, the Company pays contributions to pension plans on amandatory, contractual or voluntary basis. The Company has no further payment obligations once thecontributions have been paid. Contributions are recognized as an employee benefit expense as incurred, which isas the related employee service is rendered.
In the U.S., Saks sponsors a funded defined-benefit cash balance pension plan and an unfundedsupplemental executive retirement plan for certain employees. The pension plan no longer admits newparticipants and in 2009 future benefit accruals were suspended. The funding policy requires contributions to thepension plan to be at least equal to the minimum funding requirement, as determined under the EmployeeRetirement Income Security Act of 1974. There are no funding requirements for the Fiscal 2015 plan year.
Other
As of January 31, 2015, the Company had other long-term liabilities that included an accrued benefit planliability and an accrued self-insurance provision. The Company also had obligations in respect of equity grantsand incentive units that may be settled with cash or shares of the Company. These have not been classified ascontractual obligations for the following reasons:
• future payments of accrued benefit plan liability, principally post-retirement benefits, depend on whenand if retirees submit claims;
• future payments of equity grants and incentive units depend on whether the grants or incentive units havevested, and whether any will be elected to be cash settled; and
• future payments of insurance claims can extend over several years and depend on the timing ofanticipated settlements and results of litigation.
Guarantees and Off-Balance Sheet Arrangements
The Company has guarantees and general indemnification commitments to counterparties. Historically, theCompany has not made any significant payments with respect to these guarantees and indemnificationprovisions, and management believes that the risk of significant loss is low.
Standby and documentary letters of credit are used in connection with certain obligations mainly related topurchase orders and Workers Compensation Collateral requirements. The aggregate gross potential liabilityrelated to the Company’s letters of credit is approximately $28 million as at January 31, 2015.
Other than in connection with the proposed JV Transactions, the Company has not created, and is not partyto, any special purpose or off-balance sheet entities for the purpose of raising capital, incurring debt or operatingits business. The Company does not have any relationships or arrangements with entities that are notconsolidated into its financial statements that are reasonably likely to materially affect liquidity or the availabilityof capital resources. It is expected that the joint ventures will be accounted for using the equity method ofaccounting. As a result, indebtedness at the joint ventures would not be consolidated on the Company’s balancesheet and there would be limited impact on cash flow.
Financial Instruments and Other Instruments
The Company utilizes certain derivatives as cash flow hedges of its exposure to foreign currency risk andinterest rate risk. The effective portion of the changes in the fair value of the hedging derivatives, net of taxes, isrecognized in other comprehensive income.
The Company enters into forward foreign exchange contracts to fix the cost in Canadian dollars of certainU.S. dollar based purchases of merchandise from foreign suppliers. These forward exchange contracts have beendesignated as cash flow hedges and reported at fair value in financial assets or financial liabilities, depending on
39
their fair value. Once the inventory is recorded, the Company has elected to reclassify the related accumulatedother comprehensive income (loss) amount to merchandise inventories. Subsequent changes in the fair value ofthe forward foreign exchange contracts are recorded in net earnings (loss).
Derivative financial instruments not designated within an effective hedging relationship and embeddedderivatives are classified as fair value through profit or loss and measured at fair value with any changes in theirfair values recognized in income in the period in which the change occurs. Short-term deposits are classified asheld to maturity, which are measured at amortized cost using the effective interest method. All other financialassets are classified as loans and receivables and measured at amortized cost using the effective interest method.
All other financial liabilities are classified as other liabilities and measured at amortized cost using theeffective interest method. Interest income and expense are included in finance costs.
The Company determines the fair value of its long-term loans and borrowings using a discounted cash flowmodel, taking into consideration the fixed interest rate spread included in the related debt compared to fixedinterest rate spreads on similar debt available in the market at the balance sheet dates.
The fair values of foreign currency options, interest rate swaps and forward foreign currency contractsreflect the estimated amounts that the Company would receive or pay if it were to settle the contracts at thereporting date.
As a result of the Saks Acquisition, the Company recognized Equity Commitment Forwards in the yearended February 1, 2014 which were classified as fair value through profit or loss and measured at fair value. Anychanges in the fair value were recognized in net earnings (loss) in the period in which the change occurred.Upon closing of the Saks Acquisition, the Company derecognized the Equity Commitment Forwards andreclassified the related financial liability to share capital. The fair values were determined using a forwardpricing model. In addition, the Company issued warrants in connection with the Saks Acquisition. Certainfeatures of the warrants resulted in the warrants being presented as derivative financial liabilities which areclassified as fair value through profit or loss and measured at fair value. Subsequent changes in the fair value arerecognized in net earnings (loss) in the period in which the change occurs. The fair values of the warrants aredetermined using the Black-Scholes option pricing model. For a complete description of the derivative financialinstruments of the Company and related risks, please refer to note 18 of the Company’s audited consolidatedfinancial statements for the fiscal year ended January 31, 2015.
Risks arising from Financial Instruments
Through its use of financial instruments, the Company has exposure to credit, liquidity and market risk. Thefollowing is a description of those risks and how the exposures are managed:
(i) Credit risk
Credit risk refers to the possibility that the Company can suffer financial losses due to the failure of theCompany’s counterparties to meet their payment obligations. The Company is exposed to minimal credit riskfrom customers, vendors, and financial counterparties as a result of ongoing credit evaluations and review ofaccounts receivable collectability. Credit risk is mitigated by various techniques including selectingcounterparties based on acceptable credit ratings and minimizing the concentration of positions with individualcounterparties. There is no concentration of accounts receivable balances. The Company does not consider itsexposure to credit risk to be material.
(ii) Liquidity risk
Liquidity risk is the risk that the Company will not be able to meet its financial obligations as they fall due.The Company manages liquidity risk by continuously monitoring actual and projected cash flows, taking intoaccount the seasonality of the Company’s working capital needs, sales and earnings. The HBC Revolving CreditFacility, the U.S. Revolving Credit Facility and the bank overdraft facilities are used to maintain liquidity.
40

(iii) Market risk
Market risk includes foreign currency risk and interest rate risk:
(a) Foreign currency risk
The Company is a Canadian dollar functional currency entity that purchases a significant amount ofinventory for its Canadian operations in U.S. dollars. HBC enters into forward foreign exchange contracts andforeign currency options to reduce the foreign exchange risk with respect to these U.S. dollar denominatedpurchases.
In accordance with the Company’s risk management policy, HBC may hedge up to 100% of all foreigncurrency transactions and economic exposures that are recognized on the consolidated balance sheets, ordeemed as firm commitments (e.g. purchase orders that have been issued for goods and services in foreigncurrency). HBC may further hedge up to 70% of forecasted transactions (anticipated transactions for whichthere are no firm commitments).
Our net investment in Lord & Taylor and Saks, whose functional currency is U.S. dollars, presents a foreignexchange risk to HBC, whose functional currency is Canadian dollars. HBC used a net investment hedge tomitigate this risk. HBC had originally designated U.S.$800 million of Senior Term Loan B as a hedge of the firstU.S.$800 million of net assets of L&T Acquisition. The hedge was subsequently reduced to U.S.$350 millionupon pay down of certain debt and further to nil, upon pay down of Senior Term Loan B. Foreign currencytranslation of the net earnings of L&T Acquisition impacts consolidated net earnings (loss). Foreign currencytranslation of HBC’s investment in L&T Acquisition impacts other comprehensive income.
(b) Interest rate risk
The Company’s interest rate risk arises from short-term and long-term borrowings. Borrowings issued atvariable rates expose the Company to cash flow interest rate risk. The Company’s variable rate borrowings aredenominated in both U.S. and Canadian dollars.
Cash flow interest rate risk is mitigated by the use of interest rate swaps.
In connection with the Saks Mortgage the Company entered into two separate interest rate swap lockforward contracts (the ‘‘Rate Locks’’) during fiscal 2014 that resulted in the Company fixing the interest rate tobe paid over the entire term of the mortgage. The Company designated the Rate Locks as hedges of the cashflows from the forecasted proceeds of the Saks Mortgage. Each hedging relationship was assessed to be highlyeffective and as at January 31, 2015, a net realized loss of $9 million, with related deferred taxes of $4 millionwas included in other comprehensive income representing the mark-to-market adjustments to fair value fromthe date of execution of each Rate Lock, October 10, 2014 and November 5, 2014 respectively to December 3,2014, the date of close of the Saks Mortgage.
Classification of Financial Instruments
Derivative financial instruments not designated within an effective hedging relationship and embeddedderivatives are classified as fair value though profit or loss and measured at fair value with any changes in theirfair values recognized in net earnings (loss) in the period in which the change occurs. Short-term deposits areclassified as held to maturity, which are measured at amortized cost using the effective interest method. Allother financial assets are classified as loans and receivables and measured at amortized cost using the effectiveinterest method. All other financial liabilities are classified as other liabilities and measured at amortized costusing the effective interest method. Interest income and expense are included in finance costs.
The following table provides a summary of the fair values of financial instruments by classification as ofJanuary 31, 2015 and February 1, 2014:
(millions of Canadian dollars) 2014 2013
$ $
Classified as fair value through profit or loss . . . . . . . . . . . . . . . . . . . . . . . . . . . . . . . . . . (69) (25)Classified as loans and receivables . . . . . . . . . . . . . . . . . . . . . . . . . . . . . . . . . . . . . . . . . . 380 160Classified as held to maturity . . . . . . . . . . . . . . . . . . . . . . . . . . . . . . . . . . . . . . . . . . . . . . 2 2Financial derivatives designated as cash flow hedges . . . . . . . . . . . . . . . . . . . . . . . . . . . . . 21 6Classified as other liabilities . . . . . . . . . . . . . . . . . . . . . . . . . . . . . . . . . . . . . . . . . . . . . . . (4,415) (4,264)
41

Fair Value of Financial Instruments
The Company determines the fair value of its long-term loans and borrowings using a discounted cash flowmodel, taking into consideration the fixed interest rate spread included in the related debt compared to fixedinterest rate spreads on similar debt available in the market at the balance sheet dates.
The fair values of foreign currency options, interest rate swaps and forward foreign currency contractsreflect the estimated amounts that the Company would receive or pay if it were to settle the contracts at thereporting date. The fair value of foreign currency options are determined based on the difference between theexercise rate and the spot rate, volatility of exchange rates and market interest rates at the period-end date.Interest rate swaps are valued using a discounted cash flow model based on market interest rate curves at theperiod-end date. The forward foreign currency contracts are valued based on the difference between contractrates and spot rates at the period-end date, discounted to reflect the time-value of money. The fair values ofembedded foreign currency derivatives reflect the estimated amounts the Company would receive or pay tosettle forward foreign exchange contracts with similar terms using valuation techniques and observable marketinput data.
For Fiscal 2014, the Company recorded a net loss of $44 million (2013: $153 million) on financialinstruments related to the Saks Acquisition. Specifically, the net loss comprised losses on changes in fair value ofWarrants of $44 million (2013: nil) and Equity Commitment Forwards of nil (2013: $153 million). In addition,the Company recorded a loss of $1 million on the change in fair value of embedded foreign currency derivativesin Fiscal 2014 (2013: $1 million).
Tax Matters
In the ordinary course of business, the Company is subject to ongoing audits by tax authorities. While theCompany believes that its tax filing positions are appropriate and supportable, from time to time certain mattersare reviewed and challenged by the tax authorities.
The Company regularly reviews the potential for adverse outcomes in respect of tax matters. The Companybelieves that there are no tax matters that will have a material adverse effect on its liquidity, consolidatedfinancial position or results of operations because the Company believes that it has adequate provisions for anytax matters. Should the ultimate tax liability materially differ from the provisions, the Company’s effective taxrate and its earnings (loss) could be affected, positively or negatively, in the period in which the mattersare resolved.
Related Party Transactions
Transactions between HBC and its subsidiaries, which are related parties, have been eliminated onconsolidation and are not disclosed herein. Details of transactions with other related parties are disclosed below.
On May 6, 2011, a subsidiary of L&T Acquisition entered into a two year lease with SP 35 L.P.(the ‘‘Landlord’’) for approximately 31,000 square feet in Shrewsbury, NJ. The lease was amended onJanuary 17, 2013 to include three renewal options. The first two renewal options are for terms of two and threeyears, respectively, at an annual cost of U.S.$440 thousand. The third renewal option is for a term of five years atan annual cost of U.S.$484 thousand. The first and second renewal options were exercised. Amounts charged tothe Company under the rental arrangement for the thirteen and fifty-two weeks ended January 31, 2015 wereU.S.$110 thousand and U.S.$440 thousand, respectively (2013: U.S.$94 thousand and U.S.$376 thousand,respectively). The Landlord is an affiliate of National Realty & Development Corp. (‘‘NRDC’’). Richard Bakerand Robert Baker, the principals of NRDC, are directors of the Company.
During the thirteen and fifty-two weeks ended January 31, 2015, the Company accrued nil and$314 thousand, respectively (2013: $300 thousand and $300 thousand, respectively) from Hudson’s Bay TradingCompany, LP (‘‘HBTC’’), a shareholder of the Company, with respect to the reimbursement of expenses forservices provided by HBC on their behalf.
On February 25, 2014, the Company completed the sale of its downtown Toronto flagship store andadjacent Simpson’s Tower office complex to an affiliate of The Cadillac Fairview Corporation Limited, an
42

affiliate of HSILP, for a purchase price of $650 million. The Company has leased the entire retail and a portionof office complex back for a base term of twenty-five years, with renewal options up to approximately twenty-fiveyears. The transaction is considered to be a related party transaction because an affiliate of The CadillacFairview Corporation Limited is a related party of the Company by virtue of it being an affiliate of OntarioTeachers’ Pension Plan Board, which indirectly holds the power to exercise control and direction over, andbeneficial ownership of, more than 10% of the Company’s outstanding voting shares. As part of this transaction,Saks has also agreed to lease space in Toronto’s Sherway Gardens from The Cadillac Fairview CorporationLimited, which is also considered to be a related party transaction. Previously, the Company had entered intostore leases with The Cadillac Fairview Corporation Limited or its affiliates for stores located at: Fairview Parkin Kitchener, Ontario; Richmond Centre in Richmond, British Columbia; Chinook Centre and Market Mall,both in Calgary, Alberta; Polo Park Shopping Centre in Winnipeg, Manitoba; Masonville Place in London,Ontario; Markville Shopping Centre in Markham, Ontario; Limeridge Mall in Hamilton, Ontario; FairviewPointe-Claire, in Pte-Claire, Quebec; Fairview Mall in Toronto, Ontario; Carrefour Laval in Laval, Quebec; LesPromenades St. Bruno in St. Bruno, Quebec; and Les Galeries D’Anjou in Montreal, Quebec. The leasescontain representations and warranties, positive and negative covenants and events of default which, in eachcase, are customary to leases of this nature. The Company is in compliance with the covenants contained inthe leases.
All of the above amounts have been recorded at the exchange value of the transaction.
Critical Accounting Policies
The Company’s discussion and analysis of its financial condition and results of operations are based uponthe Company’s consolidated financial statements, which have been prepared in accordance with IFRS. TheCompany’s significant accounting policies are described in note 2 to the Fiscal 2014 audited consolidatedfinancial statements.
The preparation of these financial statements requires management to make judgments, estimates andassumptions about the carrying amounts of assets and liabilities, and reporting of income and expenses, that arenot readily apparent from other sources. The estimates and associated assumptions are based on historicalexperience and other factors that are considered to be relevant. Actual results may differ materially from theseestimates. The estimates and underlying assumptions are reviewed on an ongoing basis.
Revisions to accounting estimates are recognized in the period in which the estimate is revised if therevision affects only that period, or in the period of the revision and future periods if the revision affects bothcurrent and future periods.
The following are certain critical judgments and estimations that management has made in the process ofapplying the Company’s accounting policies and that have the most significant effect on the amounts recognizedin the consolidated financial statements (see note 3 to the Fiscal 2014 audited consolidated financial statementsfor further critical judgments and estimations):
Inventories
Inventories are valued at the lower of cost and net realizable value.
Cost is determined using the weighted average cost method based on individual items and, with respect toSaks, a retail inventory method that approximates cost. Costs comprise all variable costs such as the merchandisecost, freight and handling, incurred in bringing inventories to their present location and condition. Storage andadministrative overheads are expensed as incurred. Supplier rebates and discounts received or receivable basedon vendor agreements are recorded as a reduction in the cost of purchases unless they relate to a reimbursementof specific incremental expenses. The Company receives significant support from vendors for promotionalmarkdown activity and reflects this support as an offset to the cost of markdowns taken in cost of goods sold.
Net realizable value is the estimated selling price determined at the item level using historical markdownrates for similar items in the ordinary course of business, less estimated costs required to sell. At each balancesheet date, the Company reviews its on-hand inventory to identify items selling below cost at that date and uses
43

historical trends and current inventory mix to determine an additional reserve for the impact of futuremarkdowns which will take the net realizable value of inventory on-hand below cost.
Physical inventories are generally taken within each merchandise department annually, and inventoryrecords are adjusted accordingly resulting in an expense within cost of goods sold. The Company records ashrink reserve utilizing historical shrink rates to reflect the incremental expense between the time of the physicalinventory count and the reporting date.
Loyalty Programs
Loyalty program accounting allocates a portion of consideration paid by the customer at the timemerchandise or services are acquired to the value of the loyalty entitlement earned as part of the transaction.This portion of the consideration is treated as deferred revenue and recognized when the customer redeemspoints and ultimately acquires additional merchandise or services. The Company retains an external actuary toestimate the percentage of rewards points earned by customers that ultimately will be redeemed.
Impairment and reversal of impairment of long-lived assets
Long-lived assets are subject to impairment and impairment reversal reviews based on whether current orfuture events and circumstances suggest that their recoverable amount may be more or less than their carryingvalue. In certain instances, the recoverable amount is based on a calculation of expected future cash flows whichincludes management assumptions and estimates of future performance.
Impairment of goodwill
The Company uses judgment in determining the grouping of assets to identify its cash generating units(‘‘CGUs’’) for purposes of testing for impairment of goodwill. In testing for impairment, goodwill acquired in abusiness combination is allocated to the CGUs that are expected to benefit from the synergies of the businesscombination. The calculations for impairment testing involve significant estimates and assumptions. Itemsestimated include cash flows, discount rates and assumptions on revenue growth rates. These estimates couldaffect the Company’s future results if the current estimates of future performance and fair values change.Judgment is also used to determine whether an indication of impairment is present which would require thecompletion of an impairment test in addition to the annual testing.
Income Taxes
In connection with the reorganization on January 11, 2012 that resulted in Lord & Taylor becoming a whollyowned subsidiary of the Company, Lord & Taylor became a taxable entity. Prior to January 11, 2012, Lord &Taylor was considered a flow-through (limited liability corporations or ‘‘LLC’’, and limited partnerships) entityfor tax purposes. The Company’s accounting policies for the following types of entities are as follows:
(i) Taxable entities
The Company has recognized deferred income tax assets arising from differences between the tax bases ofassets and liabilities and their carrying amounts in the consolidated financial statements as well as those inrespect of non-capital losses carried forward. The extent to which assets have been recognized reflectsmanagement’s expectation that these assets will be recovered through the reversal of the differences between thetax and accounting basis as well as through future taxable profits being earned before expiry of the losses. Avaluation allowance is recorded to the extent that management does not believe that the assets are recoverable.The Company has had significant movement in the valuation allowance in recent years as operating performancehas improved, demonstrating the Company’s ability to realize the timing differences and tax loss carry-forwards.The sale of leasehold interests caused management to record a valuation allowance on the deferred tax assetsrelated to Zellers due to the expected inability to fully utilize the tax loss carry-forwards. This was subsequentlyreduced based on additional information that confirmed the extent to which restricted losses shouldbe recovered.
44

Income tax expense or benefit comprises current and deferred income taxes. Tax is recognized in theconsolidated statements of earnings (loss), except to the extent that it relates to items recognized either in othercomprehensive income or directly in equity. The income tax expense is calculated on the basis of the tax lawsenacted or substantively enacted at the date of the balance sheet.
(ii) Flow-through entities
Lord & Taylor, as a limited liability company from the date of its acquisition by HBTC through January 10,2012, was treated as a partnership for U.S. federal income tax purposes and in most states in which it operates.Lord & Taylor did not record a federal tax provision for deferred tax assets or liabilities related to federal taxprior to its acquisition by HBC.
Lord & Taylor operates stores in eleven states, plus the District of Columbia. Although most of these statesfollow the federal treatment of LLCs, four states require an LLC to file a state corporation or franchise taxreturn and pay any related taxes or submit income tax withholdings on the partners’ behalf. Accordingly, a stateincome tax expense is recorded for estimated income attributable to those states.
Post-employment benefits
Post-employment benefits include pensions (both defined contribution and defined benefit) andnon-pension post-retirement benefits (medical and life insurance benefits for retirees). The Company reports itsobligations under these plans net of any plan assets.
The asset or liability recognized in the consolidated balance sheet in respect of the defined benefit pensionplan is the present value of the defined benefit obligation at the end of the reporting period less the fair value ofplan assets. Independent actuaries calculate the defined benefit obligation annually.
Actuarial gains and losses (typically related to investment performance or interest rate movement differentfrom management’s assumptions) are excluded from operating income and are recognized in othercomprehensive income in the period in which they arise. Past service costs are recognized in operating income inthe year in which they arise. For funded plans, surpluses are recognized only to the extent to which the Companycan unilaterally reduce future contributions to the plan.
For defined contribution plans, the Company pays contributions to pension plans on a mandatory,contractual or voluntary basis. The Company has no further payment obligations once the contributions havebeen paid. Contributions are recognized as an employee benefit expense as incurred, which is as the relatedemployee service is rendered.
Valuation of Financial Instruments
In connection with the Acquisition, the Company issued warrants. Additionally, due to the variability of theshare issue price and certain features of the investment agreements, forward contracts (‘‘Equity CommitmentForwards’’) were recognized and accounted for as derivative financial instruments in the prior year. Theclassification of these instruments as financial liabilities is an area of significant judgment. The Companyrecorded the mark-to-market valuation adjustment of these warrants (and Equity Commitment Forwards in theprior year) as finance costs based upon the end of period valuation.
Changes in Accounting Policies Including Initial Adoption
Accounting Standards Implemented in 2014
Financial Instruments — In December 2011, the IASB amended IAS 32 — Financial Instruments:Presentation (‘‘IAS 32’’), to clarify the requirements that permit offsetting a financial asset and liability in thefinancial statements. The Company implemented IAS 32 at the beginning of its 2014 fiscal year and theimplementation did not have an impact on its results of operations, financial position or disclosure.
In June 2013, the IASB amended IAS 39 — Financial Instruments: Recognition and Measurement(‘‘IAS 39’’), providing guidance on novation of over-the-counter derivatives and continued designation for hedgeaccounting. The amendments to IAS 39 must be applied retrospectively for annual periods beginning on or after
45

January 1, 2014. The Company implemented IAS 39 at the beginning of its 2014 fiscal year and theimplementation did not have an impact on its results of operations, financial position or disclosure.
Impairment of Assets — In May 2013, the IASB amended IAS 36 — Impairment of Assets (‘‘IAS 36’’),providing guidance on recoverable amount disclosures for non-financial assets. The Company implementedIAS 36 at the beginning of its 2014 fiscal year and the implementation did not have an impact on its results ofoperations, financial position or disclosure.
Levies — In May 2013, the IASB issued IFRIC 21, providing guidance on the accounting for levies imposedby governments. The interpretation clarifies that the obligating event that gives rise to a liability to pay a levy isthe activity described in the relevant legislation that triggers the payment of the levy. The Company adopted thestandard retrospectively in the first quarter of Fiscal 2014. The impact of the amendments to IFRIC 21 issummarized in note 2(z) of the Fiscal 2014 audited consolidated financial statements.
Future Expected Changes
Financial Instruments — In July 2014, the IASB issued IFRS 9 — Financial Instruments (‘‘IFRS 9’’), whichbrings together the classification and measurement, impairment and hedge accounting phases of the IASB’sproject to replace IAS 39.
Classification and measurement
Financial assets are classified and measured based on the business model under which they are managedand the contractual cash flow characteristics of the financial assets. Financial liabilities are classified in a similarmanner as under IAS 39, except that financial liabilities measured at fair value will have fair value changesresulting from changes in the entity’s own credit risk recognized in other comprehensive income instead of netearnings (loss).
Impairment
The measurement of impairment of financial assets is based on an expected credit loss model. It is nolonger necessary for a triggering event to have occurred before credit losses are recognized. IFRS 9 also includesnew disclosure requirements about expected credit losses and credit risk.
Hedge accounting
The new general hedge accounting model more closely aligns hedge accounting with risk managementactivities undertaken by entities when hedging their financial and non-financial risk exposures. The new modelwill provide more opportunities to apply hedge accounting to reflect actual risk management activities.
IFRS 9 will be applied retrospectively for annual periods beginning on or after January 1, 2018. Earlyadoption is permitted. The Company is assessing the potential impact of this standard.
Revenue — In May 2014, the IASB issued IFRS 15 — Revenue from Contracts with Customers(‘‘IFRS 15’’), which provides a comprehensive framework for recognition, measurement and disclosure ofrevenue from contracts with customers, excluding contracts within the scope of the standards on leases,insurance contracts and financial instruments. IFRS 15 is effective for annual reporting periods beginning on orafter January 1, 2017, and must be applied retrospectively. Early adoption is permitted. The Company isassessing the potential impact of IFRS 15.
Joint Arrangements — In May 2014, the IASB amended IFRS 11 — Joint Arrangements (‘‘IFRS 11’’) torequire that a joint operator accounting for the acquisition of an interest in a joint operation, in which theactivity of the joint operation constitutes a business must apply the relevant IFRS 3 — Business Combinationsprinciples for business combinations accounting. The amendments also clarify that a previously held interest in ajoint operation is not remeasured on the acquisition of an additional interest in the same joint operation whilejoint control is retained. In addition, a scope exclusion has been added to IFRS 11 to specify that theamendments do not apply when the parties sharing joint control, including the reporting entity, are undercommon control of the same ultimate controlling party. The amendments apply to both the acquisition of the
46
initial interest in a joint operation and the acquisition of any additional interests in the same joint operation. Theamendments to IFRS 11 are effective for annual reporting periods beginning on or after January 1, 2016, andmust be applied prospectively. Early adoption is permitted. The Company is assessing the potential impact of theamendments to IFRS 11.
Management’s Report on Internal Controls Over Financial Reporting
Disclosure Controls and Procedures
Disclosure controls and procedures are designed to provide reasonable assurance that material informationis gathered and reported to senior management, including the Chief Executive Officer (‘‘CEO’’) and the ChiefFinancial Officer (‘‘CFO’’), on a timely basis so that appropriate decisions can be made regarding publicdisclosure.
The Company’s management, under the supervision of the CEO and the CFO, has designed andmaintained a set of disclosure controls and procedures to ensure that information required to be disclosed infilings made pursuant to National Instrument 52-109 — Certification of Disclosure in Issuers’ Annual andInterim Filing (‘‘NI 52-109’’) is recorded, processed, summarized and reported within the time periods specifiedin the Canadian Securities Administrators’ (‘‘CSA’’) rules and forms.
Internal Controls over Financial Reporting
The CEO and the CFO have designed, or caused to be designed under their supervision, internal controlsover financial reporting to provide reasonable assurance regarding the reliability of financial reporting and thepreparation of financial statements for external purposes in accordance with IFRS. Management conducted itsevaluation based on the framework set forth in the Internal Control-Integrated Framework (2013) issued by theCommittee of Sponsoring Organizations of the Treadway Commission. Based on its evaluation under thisframework, management concluded that the company’s internal control over financial reporting was effective asof January 31, 2015.
Internal control systems, no matter how well designed, have inherent limitations. Therefore, even thosesystems determined to be designed effectively can provide only reasonable assurance with respect to financialreporting and financial statement preparation.
Changes in Internal Control Over Financial Reporting
As part of HBC’s on-going system integration strategy, the Company completed system conversions for oneof its Banners during the fourth quarter of Fiscal 2014. These conversions resulted in changes to the Company’sinternal controls over financial reporting impacting the following areas: (1) Merchandise Payables and Inventoryas well as (2) Payroll.
Except for the preceding changes, there have been no other changes in the Company’s internal controlsover financial reporting during Fiscal 2014 that materially affected, or are reasonably likely to materially affect,the Company’s internal control over financial reporting.
Additional Information
Additional information relating to Hudson’s Bay Company, including the most recently filed AnnualInformation Form, is available on SEDAR at www.sedar.com.
Risk Factors
For a detailed description of risk factors associated with the Company, refer to the ‘‘Risk Factors’’ section ofthe Company’s Annual Information Form for Fiscal 2013 filed on SEDAR on May 2, 2014. Additional riskfactors related to the contemplated joint ventures with RioCan and Simon are outlined below. The Company isnot otherwise aware of any significant changes to the Company’s risk factors from those disclosed at that time.
47

We may not be able to successfully close our contemplated joint venture transactions. There can be no assurancethat we will receive the expected benefits from such joint ventures or that we will be able to effect a futuremonetization transaction with respect to each of the joint ventures.
Closing of the joint venture transactions are each subject to customary conditions and consents, asapplicable. We currently expect to close the joint venture transactions within approximately 90-120 days ofannouncement. There can be no assurance that the transaction with Simon or the transaction with RioCan willclose in accordance with the proposed timeline, or at all. Further, there can be no assurance that ourcontemplated joint ventures will provide the expected benefits, including enabling us to identify new real estategrowth opportunities such as future property acquisitions, or that we will be able to monetize our joint venturesat a future date.
We will not have sole control over the properties that we have agreed to hold with our joint venture partners or overthe revenues and certain decisions associated with those properties, which may limit our flexibility with respect tothese properties.
We have agreed to form joint ventures with each of RioCan and Simon, whereby we have initiallycontributed 10 owned or ground-leased properties to the joint venture with RioCan and 42 owned or ground-leased properties to the joint venture with Simon. The properties that we will own or lease through our realestate joint ventures total approximately 8.7 million square feet.
Despite having an eventual pro forma 79.8% equity stake in the joint venture with RioCan and an eventualpro forma 80% equity stake in the joint venture with Simon, a joint venture involves risks, including, amongothers, a risk that our partner:
• may have economic or business interests or goals that are inconsistent with our economic or businessinterests or goals;
• may take actions contrary to our policies or objectives with respect to our real estate investments;
• may have to give its consent with respect to certain major decisions, including the decision to distributecash, refinance a property or sell a property;
• may become bankrupt, limiting its ability to meet calls for capital contributions and potentially making itmore difficult to refinance or sell the property;
• may become engaged in a dispute with us that might affect our ability to develop or operate aproperty; or
• may have competing interests in our markets that could create conflict of interest issues.
Further, we will not have sole control of certain major decisions relating to the properties that we ownthrough real estate joint ventures, including, among others, decisions relating to:
• making any loans or providing financial assistance to any person;
• issuing new units or other interests in our joint ventures; or
• dissolving or terminating our joint ventures.
Dividends
The Company’s Board of Directors approved the payment of a quarterly dividend on March 9, 2015, whichwill be paid on April 15, 2015, to shareholders of record at the close of business March 31, 2015. The dividendwill be in the amount of $0.05 per Common Share and will be designated as an ‘‘eligible dividend’’ for Canadiantax purposes.
Outstanding Share Data
The Company’s authorized share capital consists of an unlimited number of Common Shares and anunlimited number of preferred shares issuable in series. As of April 6, 2015, the Company had
48

182,100,001 Common Shares issued and outstanding and no preferred shares issued and outstanding. As ofApril 6, 2015, the Company had 10,475,059 share options, 396,748 restricted share units and 6,750,000 warrantsoutstanding, all of which are convertible or exchangeable into Common Shares.
The Company’s Common Shares trade on the Toronto Stock Exchange under the symbol ‘‘HBC’’ and begantrading on November 20, 2012. In addition, there were approximately 25 million Common Shares reserved forissuance for the exercise of share options, warrants and the settlement of restricted share units. Assumingexercise of all outstanding share options and the settlement of all outstanding restricted share units, there wouldbe approximately 193.0 million Common Shares issued and outstanding on a fully diluted basis. Assumingexercise of all outstanding share options, the settlement of all outstanding restricted share units and the exerciseof all outstanding warrants, there would be approximately 199.8 million Common Shares issued and outstandingon a fully diluted basis.
49

7APR201517221476
INDEPENDENT AUDITOR’S REPORT
To the Shareholders of Hudson’s Bay Company
We have audited the accompanying consolidated financial statements of Hudson’s Bay Company, whichcomprise the consolidated balance sheets as at January 31, 2015, February 1, 2014 and February 2, 2013, and theconsolidated statements of earnings (loss), consolidated statements of comprehensive income (loss),consolidated statements of shareholders’ equity and consolidated statements of cash flows for the 52 weeksended January 31, 2015 and February 1, 2014, and a summary of significant accounting policies and otherexplanatory information.
Management’s Responsibility for the Consolidated Financial Statements
Management is responsible for the preparation and fair presentation of these consolidated financialstatements in accordance with International Financial Reporting Standards, and for such internal control asmanagement determines is necessary to enable the preparation of consolidated financial statements that are freefrom material misstatement, whether due to fraud or error.
Auditor’s Responsibility
Our responsibility is to express an opinion on these consolidated financial statements based on our audits.We conducted our audits in accordance with Canadian generally accepted auditing standards. Those standardsrequire that we comply with ethical requirements and plan and perform the audit to obtain reasonable assuranceabout whether the consolidated financial statements are free from material misstatement.
An audit involves performing procedures to obtain audit evidence about the amounts and disclosures in theconsolidated financial statements. The procedures selected depend on the auditor’s judgment, including theassessment of the risks of material misstatement of the consolidated financial statements, whether due to fraudor error. In making those risk assessments, the auditor considers internal control relevant to the entity’spreparation and fair presentation of the consolidated financial statements in order to design audit proceduresthat are appropriate in the circumstances, but not for the purpose of expressing an opinion on the effectivenessof the entity’s internal control. An audit also includes evaluating the appropriateness of accounting policies usedand the reasonableness of accounting estimates made by management, as well as evaluating the overallpresentation of the consolidated financial statements.
We believe that the audit evidence we have obtained in our audits is sufficient and appropriate to provide abasis for our audit opinion.
Opinion
In our opinion, the consolidated financial statements present fairly, in all material respects, the financialposition of Hudson’s Bay Company as at January 31, 2015, February 1, 2014 and February 2, 2013, and itsfinancial performance and its cash flows for the 52 weeks ended January 31, 2015 and February 1, 2014 inaccordance with International Financial Reporting Standards.
Chartered Professional Accountants, Chartered AccountantsLicensed Public Accountants
April 6, 2015Toronto, Canada
F-1

HUDSON’S BAY COMPANY
CONSOLIDATED STATEMENTS OF EARNINGS (LOSS)
For the 52 weeks ended January 31, 2015 and February 1, 2014(millions of Canadian dollars, except per share amounts)
February 1,January 31, 2014
2015 (restated — see note 2(z))Notes (Fiscal 2014) (Fiscal 2013)
Retail sales . . . . . . . . . . . . . . . . . . . . . . . . . . . . . . . . . . . . . . . . 8,169 5,223Cost of sales . . . . . . . . . . . . . . . . . . . . . . . . . . . . . . . . . . . . . . . 10 (4,893) (3,217)Selling, general and administrative expenses . . . . . . . . . . . . . . . . (2,759) (1,826)Depreciation and amortization . . . . . . . . . . . . . . . . . . . . . . . . . . 5 (344) (175)Gain on sale and leaseback transaction . . . . . . . . . . . . . . . . . . . 28 308 —
Operating income . . . . . . . . . . . . . . . . . . . . . . . . . . . . . . . . . . . 481 5Total interest expense, net . . . . . . . . . . . . . . . . . . . . . . . . . . . . . (218) (95)Acquisition-related finance costs . . . . . . . . . . . . . . . . . . . . . . . . (44) (166)
Finance costs . . . . . . . . . . . . . . . . . . . . . . . . . . . . . . . . . . . . . . 6 (262) (261)
Earnings (loss) before income tax — continuing operations . . . . . 219 (256)Income tax benefit . . . . . . . . . . . . . . . . . . . . . . . . . . . . . . . . . . 7 19 79
Net earnings (loss) for the year — continuing operations . . . . . . 238 (177)Net loss for the year — discontinued operations, net of income
taxes . . . . . . . . . . . . . . . . . . . . . . . . . . . . . . . . . . . . . . . . . . . 29 — (82)
Net earnings (loss) for the year . . . . . . . . . . . . . . . . . . . . . . . . . 238 (259)
Basic net earnings (loss) per common share . . . . . . . . . . . . . . . 21Continuing operations . . . . . . . . . . . . . . . . . . . . . . . . . . . . . . . . 1.31 (1.31)Discontinued operations . . . . . . . . . . . . . . . . . . . . . . . . . . . . . . — (0.61)
1.31 (1.92)
Diluted net earnings (loss) per common share . . . . . . . . . . . . . . 21Continuing operations . . . . . . . . . . . . . . . . . . . . . . . . . . . . . . . . 1.30 (1.34)Discontinued operations . . . . . . . . . . . . . . . . . . . . . . . . . . . . . . — (0.61)
1.30 (1.95)
(See accompanying notes to the Consolidated Financial Statements)
F-2

HUDSON’S BAY COMPANY
CONSOLIDATED STATEMENTS OF COMPREHENSIVE INCOME (LOSS)
for the 52 weeks ended January 31, 2015 and February 1, 2014(millions of Canadian dollars)
February 1,January 31, 2014
2015 (restated — see note 2(z))(Fiscal 2014) (Fiscal 2013)
Net earnings (loss) . . . . . . . . . . . . . . . . . . . . . . . . . . . . . . . . . . . . . . . 238 (259)Other comprehensive income, net of tax:Item that will not be reclassified to earnings or loss:
Net actuarial (loss) gain of employee benefit plans, net of taxes of $4(2013: $16) . . . . . . . . . . . . . . . . . . . . . . . . . . . . . . . . . . . . . . . . . . (6) 45
Items that may be reclassified subsequently to earnings or loss:Currency translation adjustment . . . . . . . . . . . . . . . . . . . . . . . . . . . . 236 159Net loss on net investment hedge, net of taxes of $4 (2013: $4) . . . . . (2) (54)Net gain on derivatives designated as cash flow hedges, net of taxes of
$3 (2013: $4) . . . . . . . . . . . . . . . . . . . . . . . . . . . . . . . . . . . . . . . . 13 10Reclassification to non-financial assets of net losses on derivatives
designated as cash flow hedges, net of taxes of $2 (2013: $2) . . . . . . (5) (4)Reclassification to earnings of net losses on derivatives designated as
cash flow hedges, net of taxes of $2 (2013: $1) . . . . . . . . . . . . . . . . (6) (3)
Other comprehensive income . . . . . . . . . . . . . . . . . . . . . . . . . . . . . . . . 230 153
Total comprehensive income (loss) . . . . . . . . . . . . . . . . . . . . . . . . . . . . 468 (106)
(See accompanying notes to the Consolidated Financial Statements)
F-3

HUDSON’S BAY COMPANY
CONSOLIDATED STATEMENTS OF SHAREHOLDERS’ EQUITY
For the 52 weeks ended January 31, 2015 and February 1, 2014(millions of Canadian dollars)
Accumulated OtherComprehensive Income (Loss) (‘‘AOCI’’)
Currency Net Cash TotalShare Retained Contributed Translation Employee Investment Flow Total Shareholders’
Notes Capital Earnings Surplus Adjustment Benefits Hedge Hedges AOCI Equity
As at February 2, 2013 . . . . . . . . 246 797 33 (12) (51) — — (63) 1,013Impact of change in accounting
policy . . . . . . . . . . . . . . . . . 2(z) — (4) — (1) — — — (1) (5)
As at February 3, 2013 (restated) . 246 793 33 (13) (51) — — (64) 1,008Comprehensive loss (restated) . . . — (259) — 159 45 (54) 3 153 (106)Share based compensation . . . . . . 19 — — 10 — — — — — 10Issuance of common shares . . . . . 20 1,174 — — — — — — — 1,174Dividends . . . . . . . . . . . . . . . . 20 — (43) — — — — — — (43)
As at February 1, 2014 (restated) . 1,420 491 43 146 (6) (54) 3 89 2,043Comprehensive income . . . . . . . . — 238 — 236 (6) (2) 2 230 468Share based compensation . . . . . . 19 — — 17 — — — — — 17Dividends . . . . . . . . . . . . . . . . 20 — (36) — — — — — — (36)
As at January 31, 2015 . . . . . . . . 1,420 693 60 382 (12) (56) 5 319 2,492
(See accompanying notes to the Consolidated Financial Statements)
F-4

17APR201508513137 17APR201508510482
HUDSON’S BAY COMPANY
CONSOLIDATED BALANCE SHEETS
As at January 31, 2015, February 1, 2014 and February 2, 2013(millions of Canadian dollars)
(restated —note 2(z) (restated —
and note 4) note 2(z))
January 31, February 1, February 2,2015 2014 2013
Notes (Fiscal 2014) (Fiscal 2013) (Fiscal 2012)
ASSETSCash . . . . . . . . . . . . . . . . . . . . . . . . . . . . . . . . . . . . . . . . . . . . 8 168 21 48Trade and other receivables . . . . . . . . . . . . . . . . . . . . . . . . . . . . . 9 212 137 74Inventories . . . . . . . . . . . . . . . . . . . . . . . . . . . . . . . . . . . . . . . . 10 2,349 2,048 994Financial assets . . . . . . . . . . . . . . . . . . . . . . . . . . . . . . . . . . . . . 18 24 8 3Income taxes recoverable . . . . . . . . . . . . . . . . . . . . . . . . . . . . . . 7 23 —Other current assets . . . . . . . . . . . . . . . . . . . . . . . . . . . . . . . . . . 69 71 32Assets of discontinued operations . . . . . . . . . . . . . . . . . . . . . . . . . 29 — 2 269Total current assets . . . . . . . . . . . . . . . . . . . . . . . . . . . . . . . . . . 2,829 2,310 1,420Property, plant and equipment . . . . . . . . . . . . . . . . . . . . . . . . . . . 11 4,606 4,110 1,335Intangible assets . . . . . . . . . . . . . . . . . . . . . . . . . . . . . . . . . . . . . 12 1,076 980 233Goodwill . . . . . . . . . . . . . . . . . . . . . . . . . . . . . . . . . . . . . . . . . . 12 237 208 —Pensions and employee benefits . . . . . . . . . . . . . . . . . . . . . . . . . . 17 69 72 38Deferred tax assets . . . . . . . . . . . . . . . . . . . . . . . . . . . . . . . . . . . 7 240 249 214Other assets . . . . . . . . . . . . . . . . . . . . . . . . . . . . . . . . . . . . . . . 15 13 12Total assets . . . . . . . . . . . . . . . . . . . . . . . . . . . . . . . . . . . . . . . . 9,072 7,942 3,252
LIABILITIESLoans and borrowings . . . . . . . . . . . . . . . . . . . . . . . . . . . . . . . . . 14 265 532 132Trade payables . . . . . . . . . . . . . . . . . . . . . . . . . . . . . . . . . . . . . . 945 585 400Other payables and accrued liabilities . . . . . . . . . . . . . . . . . . . . . . 603 489 273Other liabilities . . . . . . . . . . . . . . . . . . . . . . . . . . . . . . . . . . . . . 13 76 — —Deferred revenue . . . . . . . . . . . . . . . . . . . . . . . . . . . . . . . . . . . . 130 152 110Provisions . . . . . . . . . . . . . . . . . . . . . . . . . . . . . . . . . . . . . . . . . 15 115 149 85Income taxes payable . . . . . . . . . . . . . . . . . . . . . . . . . . . . . . . . . 8 10 3Financial liabilities . . . . . . . . . . . . . . . . . . . . . . . . . . . . . . . . . . . 18 2 1 1Liabilities of discontinued operations . . . . . . . . . . . . . . . . . . . . . . 29 — 89 343Total current liabilities . . . . . . . . . . . . . . . . . . . . . . . . . . . . . . . . 2,144 2,007 1,347Loans and borrowings . . . . . . . . . . . . . . . . . . . . . . . . . . . . . . . . . 14 2,859 2,923 719Provisions . . . . . . . . . . . . . . . . . . . . . . . . . . . . . . . . . . . . . . . . . 15 63 16 14Financial liabilities . . . . . . . . . . . . . . . . . . . . . . . . . . . . . . . . . . . 18 68 24 —Pensions and employee benefits . . . . . . . . . . . . . . . . . . . . . . . . . . 17 109 96 70Deferred tax liabilities . . . . . . . . . . . . . . . . . . . . . . . . . . . . . . . . . 7 668 631 —Other liabilities . . . . . . . . . . . . . . . . . . . . . . . . . . . . . . . . . . . . . 13 669 202 94Total liabilities . . . . . . . . . . . . . . . . . . . . . . . . . . . . . . . . . . . . . 6,580 5,899 2,244SHAREHOLDERS’ EQUITYShare capital . . . . . . . . . . . . . . . . . . . . . . . . . . . . . . . . . . . . . . . 20 1,420 1,420 246Retained earnings . . . . . . . . . . . . . . . . . . . . . . . . . . . . . . . . . . . 693 491 793Contributed surplus . . . . . . . . . . . . . . . . . . . . . . . . . . . . . . . . . . 60 43 33Accumulated other comprehensive income (loss) . . . . . . . . . . . . . . 319 89 (64)Total shareholders’ equity . . . . . . . . . . . . . . . . . . . . . . . . . . . . . . 2,492 2,043 1,008Total liabilities and shareholders’ equity . . . . . . . . . . . . . . . . . . . . 9,072 7,942 3,252
(See accompanying notes to the Consolidated Financial Statements)
On behalf of the Board:
Director Director
F-5
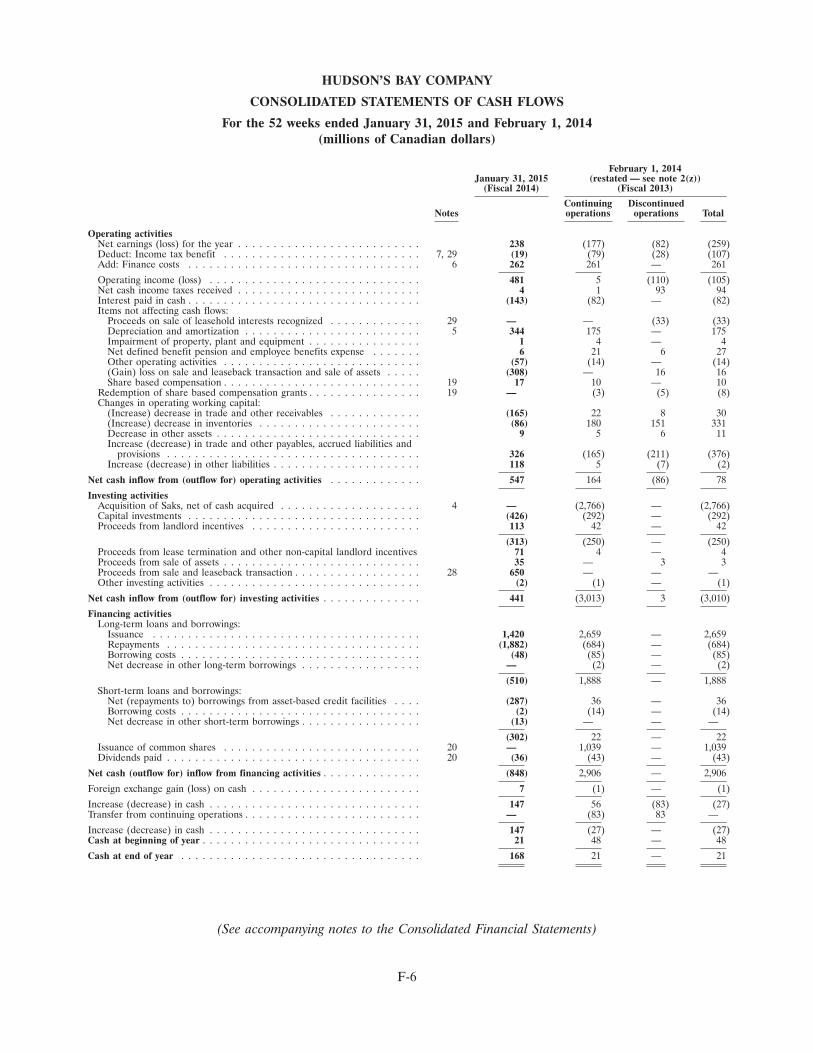
HUDSON’S BAY COMPANY
CONSOLIDATED STATEMENTS OF CASH FLOWS
For the 52 weeks ended January 31, 2015 and February 1, 2014(millions of Canadian dollars)
February 1, 2014January 31, 2015 (restated — see note 2(z))
(Fiscal 2014) (Fiscal 2013)
Continuing DiscontinuedNotes operations operations Total
Operating activitiesNet earnings (loss) for the year . . . . . . . . . . . . . . . . . . . . . . . . . . 238 (177) (82) (259)Deduct: Income tax benefit . . . . . . . . . . . . . . . . . . . . . . . . . . . . 7, 29 (19) (79) (28) (107)Add: Finance costs . . . . . . . . . . . . . . . . . . . . . . . . . . . . . . . . . 6 262 261 — 261
Operating income (loss) . . . . . . . . . . . . . . . . . . . . . . . . . . . . . . 481 5 (110) (105)Net cash income taxes received . . . . . . . . . . . . . . . . . . . . . . . . . . 4 1 93 94Interest paid in cash . . . . . . . . . . . . . . . . . . . . . . . . . . . . . . . . . (143) (82) — (82)Items not affecting cash flows:
Proceeds on sale of leasehold interests recognized . . . . . . . . . . . . . 29 — — (33) (33)Depreciation and amortization . . . . . . . . . . . . . . . . . . . . . . . . . 5 344 175 — 175Impairment of property, plant and equipment . . . . . . . . . . . . . . . . 1 4 — 4Net defined benefit pension and employee benefits expense . . . . . . . 6 21 6 27Other operating activities . . . . . . . . . . . . . . . . . . . . . . . . . . . . (57) (14) — (14)(Gain) loss on sale and leaseback transaction and sale of assets . . . . . (308) — 16 16Share based compensation . . . . . . . . . . . . . . . . . . . . . . . . . . . . 19 17 10 — 10
Redemption of share based compensation grants . . . . . . . . . . . . . . . . 19 — (3) (5) (8)Changes in operating working capital:
(Increase) decrease in trade and other receivables . . . . . . . . . . . . . (165) 22 8 30(Increase) decrease in inventories . . . . . . . . . . . . . . . . . . . . . . . (86) 180 151 331Decrease in other assets . . . . . . . . . . . . . . . . . . . . . . . . . . . . . 9 5 6 11Increase (decrease) in trade and other payables, accrued liabilities and
provisions . . . . . . . . . . . . . . . . . . . . . . . . . . . . . . . . . . . . 326 (165) (211) (376)Increase (decrease) in other liabilities . . . . . . . . . . . . . . . . . . . . . 118 5 (7) (2)
Net cash inflow from (outflow for) operating activities . . . . . . . . . . . . . 547 164 (86) 78
Investing activitiesAcquisition of Saks, net of cash acquired . . . . . . . . . . . . . . . . . . . . 4 — (2,766) — (2,766)Capital investments . . . . . . . . . . . . . . . . . . . . . . . . . . . . . . . . . (426) (292) — (292)Proceeds from landlord incentives . . . . . . . . . . . . . . . . . . . . . . . . 113 42 — 42
(313) (250) — (250)Proceeds from lease termination and other non-capital landlord incentives 71 4 — 4Proceeds from sale of assets . . . . . . . . . . . . . . . . . . . . . . . . . . . . 35 — 3 3Proceeds from sale and leaseback transaction . . . . . . . . . . . . . . . . . . 28 650 — — —Other investing activities . . . . . . . . . . . . . . . . . . . . . . . . . . . . . . (2) (1) — (1)
Net cash inflow from (outflow for) investing activities . . . . . . . . . . . . . . 441 (3,013) 3 (3,010)
Financing activitiesLong-term loans and borrowings:
Issuance . . . . . . . . . . . . . . . . . . . . . . . . . . . . . . . . . . . . . . 1,420 2,659 — 2,659Repayments . . . . . . . . . . . . . . . . . . . . . . . . . . . . . . . . . . . . (1,882) (684) — (684)Borrowing costs . . . . . . . . . . . . . . . . . . . . . . . . . . . . . . . . . . (48) (85) — (85)Net decrease in other long-term borrowings . . . . . . . . . . . . . . . . . — (2) — (2)
(510) 1,888 — 1,888Short-term loans and borrowings:
Net (repayments to) borrowings from asset-based credit facilities . . . . (287) 36 — 36Borrowing costs . . . . . . . . . . . . . . . . . . . . . . . . . . . . . . . . . . (2) (14) — (14)Net decrease in other short-term borrowings . . . . . . . . . . . . . . . . . (13) — — —
(302) 22 — 22Issuance of common shares . . . . . . . . . . . . . . . . . . . . . . . . . . . . 20 — 1,039 — 1,039Dividends paid . . . . . . . . . . . . . . . . . . . . . . . . . . . . . . . . . . . . 20 (36) (43) — (43)
Net cash (outflow for) inflow from financing activities . . . . . . . . . . . . . . (848) 2,906 — 2,906
Foreign exchange gain (loss) on cash . . . . . . . . . . . . . . . . . . . . . . . . 7 (1) — (1)
Increase (decrease) in cash . . . . . . . . . . . . . . . . . . . . . . . . . . . . . . 147 56 (83) (27)Transfer from continuing operations . . . . . . . . . . . . . . . . . . . . . . . . . — (83) 83 —
Increase (decrease) in cash . . . . . . . . . . . . . . . . . . . . . . . . . . . . . . 147 (27) — (27)Cash at beginning of year . . . . . . . . . . . . . . . . . . . . . . . . . . . . . . . 21 48 — 48
Cash at end of year . . . . . . . . . . . . . . . . . . . . . . . . . . . . . . . . . . 168 21 — 21
(See accompanying notes to the Consolidated Financial Statements)
F-6
HUDSON’S BAY COMPANY
NOTES TO CONSOLIDATED FINANCIAL STATEMENTS
NOTE 1. GENERAL INFORMATION
Hudson’s Bay Company (‘‘HBC’’ or the ‘‘Company’’) is a Canadian corporation continued under the Canada Business CorporationsAct and domiciled in Canada.
On November 26, 2012, the Company completed an initial public offering (the ‘‘IPO’’) of its common shares, which trade on theToronto Stock Exchange.
On November 4, 2013, the Company acquired Saks Incorporated (‘‘Saks’’) whereby all of the issued and outstanding shares (other thanshares owned by Saks and its subsidiaries) of Saks were purchased through Lord & Taylor Acquisition Inc. (‘‘L&T Acquisition’’), awholly-owned subsidiary of the Company for U.S.$16.00 per share in an all-cash transaction (the ‘‘Acquisition’’) valued atU.S.$2,973 million ($3,097 million), including debt assumed (see note 4).
The Company owns and operates department stores in Canada and the United States under Hudson’s Bay, Lord & Taylor, Saks FifthAvenue, Saks Fifth Avenue OFF 5TH (‘‘OFF 5TH’’) and Home Outfitters banners. The address of the registered office of HBC is401 Bay Street, Suite 500, Toronto, ON, M5H 2Y4.
NOTE 2. SIGNIFICANT ACCOUNTING POLICIES
a) Statement of compliance
The consolidated financial statements of the Company and its subsidiaries have been prepared in accordance with InternationalFinancial Reporting Standards (‘‘IFRS’’) as issued by the International Accounting Standards Board (‘‘IASB’’).
The consolidated financial statements for the year ended January 31, 2015 were authorized for issuance by the Board of Directors ofHBC on April 6, 2015.
b) Basis of presentation
These consolidated financial statements have been prepared on a going concern basis, under the historical cost convention, as modifiedby the revaluation of financial assets and financial liabilities (including derivative instruments) at fair value through the statements ofearnings (loss). In accordance with IFRS, the Company has:
• provided comparative financial information; and
• applied the same accounting policies throughout all periods presented.
The preparation of financial statements in accordance with IFRS requires the use of critical accounting estimates. It also requiresmanagement to exercise judgment in applying the Company’s accounting policies. These areas involving a higher degree of judgment orcomplexity, or areas where assumptions and estimates are significant are disclosed in note 3.
c) Basis of consolidation
These consolidated financial statements of the Company include the accounts of HBC and its subsidiaries. Inter-company transactions,balances, revenues and expenses have been eliminated.
d) Fiscal year
The fiscal year of the Company consists of a 52 or 53 week period. Fiscal years 2014 and 2013 represent 52 week periods ended onJanuary 31, 2015 and February 1, 2014, respectively. References to years in the consolidated financial statements and notes to theconsolidated financial statements relate to fiscal years rather than calendar years.
e) Foreign currency translation
i) Functional and presentation currency
Items included in the financial statements of each of the Company’s entities are measured using the currency of the primary economicenvironment in which the entity operates (the ‘‘functional currency’’). These consolidated financial statements are presented inCanadian dollars, which is HBC’s functional currency and the presentation currency of the Company.
ii) Transactions and balances
Foreign currency transactions are translated into the functional currency using the foreign exchange rates at the dates of thetransactions. Foreign exchange gains and losses resulting from the settlement of such transactions and from the translation of monetary
F-7

HUDSON’S BAY COMPANY
NOTES TO CONSOLIDATED FINANCIAL STATEMENTS (Continued)
NOTE 2. SIGNIFICANT ACCOUNTING POLICIES (Continued)
assets and liabilities denominated in foreign currencies at balance sheet date foreign exchange rates are recognized in net earnings(loss), except when included in other comprehensive income as qualifying cash flow or net investment hedges.
iii) Foreign operations
The results and financial position of L&T Acquisition and its subsidiaries including Lord & Taylor Holdings LLC (‘‘L&T’’) and Saks,which have a U.S. dollar functional currency, are translated into the presentation currency as follows:
• assets and liabilities are translated at the closing foreign exchange rate at the date of each balance sheet;
• revenues and expenses are translated at average foreign exchange rates;
• equity transactions are translated at foreign exchange rates on the date the transactions occur; and
• all resulting foreign exchange translation differences are recognized as currency translation adjustment in the consolidated statementsof comprehensive income (loss).
f) Business combinations and goodwill
Business combinations are accounted for using the acquisition method.
Consideration transferred is measured at fair value, which is calculated as the sum of the fair value of the assets acquired (includingcash), liabilities assumed, any contingent consideration and equity interests issued by the Company.
Transaction costs incurred in connection with a business combination are expensed in the period as incurred.
Goodwill is measured as the difference between the fair value of the consideration transferred and the fair value of the identifiableassets acquired and liabilities assumed, all measured as at the acquisition date. Goodwill is not amortized.
After initial recognition, goodwill is measured at cost less any accumulated impairment losses. For the purpose of impairment testing,goodwill is allocated to cash-generating units (‘‘CGUs’’) or groups of CGUs based on the level at which it is monitored by management.The allocation is made to those CGUs or groups of CGUs that are expected to benefit from the business combination in which thegoodwill arose.
Where goodwill forms part of a CGU and part of the operations within that unit are disposed of, the goodwill associated with theoperation disposed of is included in the carrying amount of the operation when determining the gain or loss on disposal of theoperation. Goodwill disposed of in this circumstance is measured based on the relative fair values of the operation disposed of and theportion of the CGU retained.
g) Cash
Cash consists of cash on hand, deposits in banks and short-term deposits with maturities of less than 3 months and includes restrictedfunds. Restricted cash represents amounts deposited in escrow accounts which are maintained and managed by an independent agent.
h) Trade and other receivables
Trade and other receivables consisting of credit card issuer, vendor and other receivables are recognized initially at fair value andsubsequently measured at amortized cost using the effective interest method, less allowance for impairment. An allowance forimpairment of accounts receivable is established when there is objective evidence that the Company will not be able to collect allamounts due according to the original terms of the receivables.
i) Inventories
Inventories are valued at the lower of cost and net realizable value. Cost is determined using the weighted average cost method basedon individual items and, with respect to Saks, a retail inventory method that approximates cost. Net realizable value is the estimatedselling price determined at the item level using gross profit expectation and historical markdown rates for similar items in the ordinarycourse of business, less estimated costs required to sell.
Costs comprise all variable costs, and certain fixed costs, incurred in bringing inventories to their present location and condition.Storage and administrative overheads are expensed as incurred. Supplier rebates and discounts are recorded as a reduction in the costof purchases unless they relate to a reimbursement of specific incremental expenses.
Merchandise that is subject to consignment or licensee (concession) agreements is not included in inventories.
F-8
HUDSON’S BAY COMPANY
NOTES TO CONSOLIDATED FINANCIAL STATEMENTS (Continued)
NOTE 2. SIGNIFICANT ACCOUNTING POLICIES (Continued)
j) Property, plant and equipment
Property, plant and equipment are carried at cost less accumulated depreciation and any accumulated impairment losses. Freehold landis stated at cost less any impairment loss. Cost includes expenditures that can be directly attributed to the acquisition of the asset andcapitalized borrowing costs. Subsequent costs are included in the asset’s carrying amount or recognized as a separate asset, asappropriate, only when it is probable that future economic benefits will flow to the Company and the cost can be reliably measured. Thecarrying amount of the replaced asset is derecognized.
Freehold land and assets under construction are not depreciated. Depreciation commences when the assets are available for use and isrecognized on a straight-line basis to depreciate the cost of the assets to their estimated residual value over their estimated useful lives.When significant parts of an asset have different useful lives, they are accounted for as separate components of the asset anddepreciated over their respective estimated useful lives.
Estimated useful lives are as follows:
Asset Amortization Periods
Buildings . . . . . . . . . . . . . . . . . . . . . . . . . . . . . . . . . . . . . . . . . . . . . . . . . . . . . . . . . . . . . . . up to 70 yearsLeasehold improvements . . . . . . . . . . . . . . . . . . . . . . . . . . . . . . . . . . . . . . . . . . . . . . . . . . . . . up to 20 yearsFixtures and fittings . . . . . . . . . . . . . . . . . . . . . . . . . . . . . . . . . . . . . . . . . . . . . . . . . . . . . . . . up to 19 yearsAssets held under finance leases . . . . . . . . . . . . . . . . . . . . . . . . . . . . . . . . . . . . . . . . . . . . . . . . up to 50 years
Although the table reflects maximum amortization periods, most assets are amortized over shorter periods. The assets’ useful lives andresidual values are reviewed, and adjusted if appropriate, annually.
k) Intangible assets
Private label brands and banner names with indefinite lives are measured at cost less any accumulated impairment losses and arenot amortized.
Intangible assets with finite useful lives are carried at cost less accumulated amortization and impairment losses. These assets areamortized on a straight-line basis over their estimated useful lives.
Estimated useful lives are as follows:
Asset Amortization Periods
Software including internally developed costs . . . . . . . . . . . . . . . . . . . . . . . . . . . . . . . . . . . . . . . . up to 7 yearsBanner names . . . . . . . . . . . . . . . . . . . . . . . . . . . . . . . . . . . . . . . . . . . . . . . . . . . . . . . . . . . indefinitePrivate label brands . . . . . . . . . . . . . . . . . . . . . . . . . . . . . . . . . . . . . . . . . . . . . . . . . . . . . . . . indefiniteCredit cards . . . . . . . . . . . . . . . . . . . . . . . . . . . . . . . . . . . . . . . . . . . . . . . . . . . . . . . . . . . . . up to 5 yearsFavourable lease rights . . . . . . . . . . . . . . . . . . . . . . . . . . . . . . . . . . . . . . . . . . . . . . . . . . . . . . up to 75 years
The assets’ useful lives and residual values are reviewed, and adjusted if appropriate, annually.
Costs associated with maintaining computer software programs are recognized as an expense as incurred. Development costs that aredirectly attributable to the design and testing of identifiable and unique software products controlled by the Company, includingemployee costs, are recognized as intangible assets.
l) Impairment of non-financial assets
The carrying amount of property, plant and equipment and intangible assets are reviewed for impairment whenever events or changes incircumstances indicate that the carrying amount may not be recoverable. Indefinite life intangible assets and goodwill are tested forimpairment annually, or more frequently, if events or changes in circumstances indicate that the asset may be impaired.
An impairment loss is recognized for the amount by which the asset’s carrying value exceeds its recoverable amount. The recoverableamount is the higher of an asset’s fair value less costs to sell (‘‘FVLCTS’’) and value in use. The FVLCTS of an asset is assessed, wherepracticable, by external valuators. Value in use is estimated as the present value of the future cash flows that the Company expects toderive from the asset. For the purposes of assessing impairment, assets are grouped at the lowest level for which there are largelyindependent cash inflows (CGUs). With the exception of certain corporate assets, which are tested at the entity level, all assets aretested for impairment at the store level asset grouping.
F-9

HUDSON’S BAY COMPANY
NOTES TO CONSOLIDATED FINANCIAL STATEMENTS (Continued)
NOTE 2. SIGNIFICANT ACCOUNTING POLICIES (Continued)
Any impairment loss identified for a particular CGU is allocated to the assets within that unit on a pro-rata basis, except where therecoverable amount of an asset is based on FVLCTS, in which case no portion of the impairment loss is allocated to that asset. Anyimpairment charge is recognized in net earnings (loss) in the year in which it occurs. Where an impairment loss subsequently reversesdue to a change in the original estimate, the impairment loss is reversed but is restricted to increasing the carrying value of the relevantassets to the carrying value that would have been recognized had the original impairment not occurred.
m) Provisions
Provisions are recognized when the Company has a present legal or constructive obligation as a result of past events, it is probable thatan outflow of resources will be required to settle the obligation and the amount can be reliably estimated.
Provisions are measured at the present value of management’s best estimate of the expenditure required to settle the present obligationat the balance sheet date. Provisions are estimates and the actual costs and timing of future cash flows are dependent on future events.Any difference between expectations and the actual future liability will be accounted for in the period when such determination is made.Recoveries from third parties and other contingent gains are recognized when realized.
i) Self-insurance
The Company purchases third party insurance for automobile, product, workers’ compensation, medical and general liability claims thatexceed a certain dollar level. The Company is responsible for the payment of claims below these insured limits. Provisions forself-insurance are determined actuarially on a discounted basis based on claims filed and an estimate of claims incurred but notyet reported.
ii) Restructuring
Provisions for restructuring costs are recognized when the Company has a detailed formal plan for the restructuring and has raised avalid expectation in those affected that it will carry out the restructuring by starting to implement that plan or announcing its mainfeatures to those affected by it.
iii) Onerous leases and contracts
Provisions for onerous leases are recognized when the Company believes that the unavoidable costs of meeting future lease obligationsexceed the economic benefits expected to be received under the lease. Provisions for onerous contracts are recognized when theexpected benefits to be derived from a contract are less than the unavoidable costs of meeting the obligations under that contract, andonly after any impairment losses on assets dedicated to that contract have been recognized. The provision is measured at the presentvalue of the lower of the expected cost of terminating the contract and the expected net cost of continuing with the contract.
iv) Asset retirement obligations
Asset retirement obligations are recognized for operating leases where the Company has a legal or constructive obligation to removeleasehold improvements and replace or remove other structures at the end of the lease term, and for owned locations and at locationssubject to ground leases with similar requirements. Obligations are also booked for owned properties for constructive or legalobligations (such as environmental remediation). The obligation is measured at the present value of expected costs to settle theobligation using estimated cash flows and capitalized and amortized over the useful life of the asset to which it relates.
v) Legal
Legal provisions are recognized where there is a present obligation as a result of a past event, it is probable that there will be an outflowof economic resources and the amount can be reliably estimated.
n) Leases
Leases in which a significant portion of the risks and rewards of ownership are transferred to the Company are classified as financeleases. All other leases are classified as operating leases.
Finance leases are capitalized at the inception of the lease at the lower of the fair value of the leased property and the present value ofthe minimum lease payments. The property, plant and equipment acquired under finance leases are depreciated over the lesser of theeconomic life of the asset or the lease term.
F-10

HUDSON’S BAY COMPANY
NOTES TO CONSOLIDATED FINANCIAL STATEMENTS (Continued)
NOTE 2. SIGNIFICANT ACCOUNTING POLICIES (Continued)
Payments made under operating leases (net of any incentives received from the lessor) are charged to net earnings (loss) on astraight-line basis over the term of the lease. Income from operating leases is recognized on a straight-line basis over the term of thelease. The lease term includes renewals where management is reasonably certain the renewal option will be exercised.
The accounting treatment of a sale and leaseback transaction depends upon the substance of the transaction and whether the sale pricereflects fair value. For sale and finance leasebacks, any gain or loss from the sale is deferred and amortized over the term of the lease.For sale and operating leasebacks, if the transaction is established at fair value, any gain or loss is recognized immediately. If the saleprice is below fair value, any gain or loss is recognized immediately except that if the loss is compensated for by future lease payments atbelow market price, the loss is deferred and amortized in proportion to the lease payments over the term of the lease. If the sale price isabove fair value, the excess over fair value is deferred and amortized over the term of the lease.
o) Income taxes
Deferred income tax is recognized on taxable temporary differences arising from differences between the tax bases of assets andliabilities and their carrying amounts in the consolidated financial statements. Deferred income tax is recognized for all taxabletemporary differences, except to the extent where it arises from the initial recognition of an asset or a liability in a transaction that is nota business combination and at the time of transaction, affects neither accounting profit nor taxable profit. Deferred income tax isdetermined using income tax rates and laws that have been enacted or substantively enacted at the balance sheet date and are expectedto apply when the related deferred income tax asset is realized or the deferred income tax liability is settled.
Deferred income tax assets have been recognized in respect of non-capital losses and temporary differences giving rise to deferredincome tax assets because it is expected that these assets will be recovered by way of reversal of taxable temporary differences andmanagement’s expectation of future taxable profits within the loss expiry period.
Income tax expense or benefit comprises current and deferred income taxes. Income tax is recognized in net earnings (loss), except tothe extent that it relates to items recognized either in other comprehensive income or directly in equity. The income tax expense orbenefit is calculated on the basis of the tax laws enacted or substantively enacted at the date of the balance sheet.
Deferred tax assets and liabilities are only netted when the Company has a legally enforceable right to offset current tax assets againstcurrent tax liabilities and the deferred tax assets and liabilities relate to income taxes levied by the same taxation authority on either thesame taxable entity or different taxable entities which intend to realize or settle current tax assets or liabilities simultaneously infuture periods.
p) Employee benefits
i) Short-term employee benefits
Liabilities for wages, salaries (including non-monetary benefits), vacation entitlement and bonuses are measured on an undiscountedbasis and are recognized in selling, general and administrative expenses as the related service is provided. A liability is recognized forthe amount expected to be paid under short-term bonus plans if the Company has a present legal or constructive obligation to thisamount as a result of past service provided by the employee and the obligation can be reliably estimated.
ii) Post-employment benefits
Post-employment benefits include pensions (both defined contribution and defined benefit) and non-pension post-retirement benefits(medical and life insurance benefits for retirees). The Company reports its obligations under these plans net of any plan assets.
The asset or liability recognized in the consolidated balance sheets in respect of defined benefit pension plans is the present value of thedefined benefit obligation at the end of the reporting period less the fair value of plan assets. The defined benefit obligation iscalculated annually by independent actuaries using the projected unit credit method. The present value of the defined benefit obligationis determined by discounting the estimated future cash outflows using interest rates of high quality corporate bonds that aredenominated in the currency in which the benefits will be paid, and that have terms to maturity approximating the terms of the relatedpension liability.
Actuarial gains and losses are recognized in other comprehensive income in the period in which they arise. Past service costs arerecognized in selling, general and administrative expenses in the year in which they arise. For funded plans, surpluses are recognizedonly to the extent that the surplus is considered recoverable. Recoverability is primarily based on the extent to which the Company canunilaterally reduce future contributions to the plan.
F-11

HUDSON’S BAY COMPANY
NOTES TO CONSOLIDATED FINANCIAL STATEMENTS (Continued)
NOTE 2. SIGNIFICANT ACCOUNTING POLICIES (Continued)
For defined contribution plans, the Company pays contributions to pension plans on a mandatory, contractual or voluntary basis. TheCompany has no further payment obligations once the contributions have been paid. Contributions are recognized as employee benefitexpenses are incurred, which are as the related employee services are rendered.
iii) Other long-term employee benefits
The Company provides long-term disability benefits to certain employees dependent on the legal employer. The entitlement to thesebenefits is usually conditional on the completion of a minimum service period. The expected costs of these benefits are recognized whenan event occurs that causes the long-term disability. Actuarial gains and losses arising from experience adjustments and changes inactuarial assumptions are recognized in net earnings (loss) in the period in which they arise. These obligations are calculated annually.
iv) Termination benefits
Termination benefits are recognized as an expense and a liability at the earlier of when the entity can no longer withdraw the offer of thetermination benefit and when the entity recognizes any related restructuring costs.
v) Share based payments
The Company operates share based incentive plans under which it receives services from certain employees as consideration. For equitysettled awards, the fair value of the grant of equity interests is recognized as an expense over the period that the related service isrendered with a corresponding increase in equity. For cash-settled awards, the fair value of the liability is remeasured at the end of eachreporting period, with the change in fair value recognized as an expense over the period that the related service is rendered. Certainawards provide the Company with a choice of settlement in cash or by issuing equity. In these cases, the award is accounted for as acash-settled award when the Company has a present obligation to settle in cash.
The total amount to be expensed is determined by reference to the fair value of the equity interests granted. The total amount expensedis recognized over the vesting period on a tranche basis, which is the period over which all of the specified vesting conditions are to besatisfied. At each balance sheet date, the estimate of the number of equity interests that are expected to vest is revised. The impact ofthe revision to original estimates, if any, is recognized in selling, general and administrative expenses.
q) Financial assets
Financial assets have been classified in one of the following categories: at fair value through profit or loss, loans and receivables andheld-to-maturity. The classification depends on the purpose for which the financial assets were acquired. Management determines theclassification of its financial assets at initial recognition.
i) Financial assets at fair value through profit or loss
Financial assets at fair value through profit or loss are financial assets held for trading. A financial asset is classified in this category ifacquired principally for the purpose of selling in the short-term. Derivatives are also categorized as held for trading unless they aredesignated as hedges. Assets in this category are classified as current assets.
Financial assets carried at fair value through profit or loss are initially recognized at fair value and transaction costs are expensedimmediately to net earnings (loss). Subsequent changes in the fair value of financial assets at fair value through profit or loss are alsorecorded in net earnings (loss).
ii) Loans and receivables
Loans and receivables are non-derivative financial assets with fixed or determinable payments that are not quoted in an active market.They are included in current assets, except for those with maturities greater than twelve months after the balance sheet date, which areclassified as non-current assets. Loans and receivables are measured at amortized cost using the effective interest rate method.
iii) Held-to-maturity
Held-to-maturity investments are financial instruments with fixed or determinable payments and fixed maturities that the Company hasthe intention and ability to hold to maturity. They are included in current assets, except for maturities greater than twelve months afterthe balance sheet date, which are classified as non-current assets. Held-to-maturity investments are measured at amortized cost usingthe effective interest rate method.
F-12

HUDSON’S BAY COMPANY
NOTES TO CONSOLIDATED FINANCIAL STATEMENTS (Continued)
NOTE 2. SIGNIFICANT ACCOUNTING POLICIES (Continued)
The Company’s non-derivative financial assets are classified and measured as follows:
Asset Category
Cash . . . . . . . . . . . . . . . . . . . . . . . . . . . . . . . . . . . . . . . . . . . . . . . . . . . . . . . . . . . . . . . . . Loans and receivablesRestricted cash . . . . . . . . . . . . . . . . . . . . . . . . . . . . . . . . . . . . . . . . . . . . . . . . . . . . . . . . . . Loans and receivablesShort-term deposits . . . . . . . . . . . . . . . . . . . . . . . . . . . . . . . . . . . . . . . . . . . . . . . . . . . . . . . . Held-to-maturityTrade and other receivables . . . . . . . . . . . . . . . . . . . . . . . . . . . . . . . . . . . . . . . . . . . . . . . . . . Loans and receivables
iv) Impairment
The Company assesses, at each reporting date, whether there is an indicator that a financial asset or group of financial assets isimpaired. A financial asset or group of financial assets is deemed to be impaired if, and only if, there is evidence of impairment as aresult of one or more events that has occurred after the initial recognition of an asset and that event has an impact on the estimatedfuture cash flows of the financial asset or group of financial assets that can be reliably estimated.
v) Financial assets carried at amortized cost
For financial assets carried at amortized cost, the Company first assesses whether objective evidence of impairment exists individuallyfor financial assets that are individually significant, or collectively for financial assets that are not individually significant. If theCompany determines that no objective evidence of impairment exists for an individually assessed financial asset, whether significant ornot, it includes the asset in a group of financial assets with similar credit risk characteristics and collectively assesses them forimpairment. Assets that are individually assessed for impairment and for which an impairment loss is, or continues to be, recognized arenot included in a collective assessment of impairment.
If there is objective evidence that an impairment loss has occurred, the amount of loss is measured as the difference between the asset’scarrying amount and the present value of estimated future cash flows (excluding future expected credit losses that have not yet beenincurred). The present value of the estimated future cash flows is discounted at the financial asset’s original effective interest rate.
r) Financial liabilities
Trade payables and financial liabilities included in other payables and accrued liabilities are recognized initially at fair value, net oftransaction costs incurred and subsequently measured at amortized cost using the effective interest method.
Loans and borrowings are recognized initially at fair value, net of transaction costs incurred. Loans and borrowings are subsequentlystated at amortized cost; any difference between the proceeds (net of transaction costs) and the redemption value is recognized in netearnings (loss) as finance costs over the period of the borrowings using the effective interest method, unless related to a qualifying asset(note 2(t)).
Loans and borrowings are classified as current liabilities unless the Company has an unconditional right to defer settlement of theliability for at least twelve months after the balance sheet date.
s) Derivative financial instruments
Derivatives are initially recognized at fair value on the date a derivative contract is entered into and are subsequently remeasured totheir fair value at each balance sheet date. The method of recognizing the resulting gain or loss depends on whether the derivative isdesignated as a hedging instrument and, if so, the nature of the item being hedged. The Company designates certain derivatives as:
(a) hedges of the fair value of recognized assets or liabilities or a firm commitment (fair value hedge);
(b) hedges of foreign currency exposure (net investment hedge);
(c) hedges of a particular risk associated with a recognized asset or liability or a highly probable forecast transaction (cash flow hedge).
When a derivative financial instrument is not designated in a qualifying hedge relationship, all changes in its fair value are recognizedimmediately in net earnings (loss).
The Company documents at the inception of the transaction the relationship between hedging instruments and hedged items, as well asits risk management objectives and strategy for undertaking various hedging transactions. The Company also documents its assessment,both at hedge inception and on an ongoing basis, of whether the derivatives that are used in hedging transactions are highly effective inoffsetting changes in fair values or cash flows of hedged items.
F-13

HUDSON’S BAY COMPANY
NOTES TO CONSOLIDATED FINANCIAL STATEMENTS (Continued)
NOTE 2. SIGNIFICANT ACCOUNTING POLICIES (Continued)
The full fair value of a hedging derivative is classified as a non-current asset or liability when the maturity of the remaining hedged itemis more than twelve months and as a current asset or liability when the remaining maturity of the hedged item is less thantwelve months.
The Company does not use derivatives for trading or speculative purposes. The Company had cash flow hedges outstanding as atJanuary 31, 2015 and February 1, 2014 and a net investment hedge outstanding as at February 1, 2014.
Cash flow hedges
The effective portion of changes in the fair value of derivatives that are designated and qualify as cash flow hedges is recognized in othercomprehensive income. The gain or loss relating to the ineffective portion is recognized immediately in net earnings (loss) withinselling, general and administrative expenses. Amounts accumulated in other comprehensive income are recycled in net earnings (loss) inthe periods when the hedged item affects earnings (loss).
When a forecasted transaction that is hedged results in the recognition of a non-financial asset (for example, inventory or property,plant and equipment), the gains and losses previously deferred in accumulated other comprehensive income (loss) are transferred fromequity and included in the initial measurement of the cost of the asset. The deferred amounts are ultimately recognized in cost of salesin the case of inventory or in depreciation in the case of property, plant and equipment.
When a hedging instrument expires or is sold, or when a hedge no longer meets the criteria for hedge accounting, any cumulative gainor loss existing in equity at that time remains in accumulated other comprehensive income (loss) and is recognized when the forecastedtransaction is ultimately recognized in net earnings (loss). When a forecasted transaction is no longer expected to occur, the cumulativegain or loss that was reported in other comprehensive income is immediately transferred to net earnings (loss).
Derivatives at fair value through profit or loss
Changes in the fair value of derivatives embedded in a host contract and derivatives that are not distinguished in a hedging relationshipare recognized immediately in net earnings (loss). Embedded derivatives (elements of contracts whose cash flows move independentlyfrom the host contract) are required to be separated and measured at their respective fair values unless certain criteria are met. TheCompany has recorded the fair value of embedded derivatives in HBC’s U.S. dollar denominated purchase orders with certainnon-U.S. based vendors. The fair value of these embedded derivatives is recorded in financial assets or financial liabilities, depending onthe embedded derivative’s fair value.
Due to the variability of the share issue price and certain features of the equity investment agreements related to the Acquisition,forward contracts (‘‘Equity Commitment Forwards’’) were recognized and accounted for as derivative financial instruments which wereclassified as fair value through profit or loss and measured at fair value.
In connection with the Acquisition, the Company also issued warrants. Certain features of the warrants result in their presentation asderivative financial liabilities that are classified as fair value through profit or loss and recorded at fair value.
Offsetting of financial instruments
Financial assets and financial liabilities are offset and the net amount reported in the consolidated balance sheets if:
• There is currently a legally enforceable right to offset recognized amounts; and
• There is an intention to settle on a net basis, or to realize the assets and settle the liabilities simultaneously.
t) Borrowing costs
Borrowing costs that are directly attributable to the acquisition or construction of qualifying assets are capitalized to the cost of theasset. Qualifying assets are those that necessarily take a substantial period of time to prepare for their intended use. All other borrowingcosts are recognized in net earnings (loss) in the period in which they occur.
u) Revenue recognition
Revenue comprises the fair value of the consideration received or receivable for the sale of goods and services in the ordinary course ofthe Company’s activities. Revenue is shown net of sales tax and estimated returns.
The Company recognizes revenue when the amount can be reliably measured, it is probable that future economic benefits will flow tothe Company and when specific criteria have been met for each of the Company’s activities as described below. The Company bases its
F-14
HUDSON’S BAY COMPANY
NOTES TO CONSOLIDATED FINANCIAL STATEMENTS (Continued)
NOTE 2. SIGNIFICANT ACCOUNTING POLICIES (Continued)
estimates on historical results, taking into consideration the type of customer, the type of transaction and the specifics of eacharrangement.
i) Retail merchandise sales
Revenue consists of sales through retail stores of the banners operated by the Company and includes sales through the Company’se-commerce (‘‘Digital Commerce’’) operations. Merchandise sales through retail stores are recognized at the time of delivery to thecustomer which is generally at point of sale. Merchandise sales through Digital Commerce are recognized upon estimated receipt bythe customer.
It is the Company’s policy to sell merchandise to the customer with a right to return within a specified period. Accumulated experienceis used to estimate and provide for such returns. Where it is determined that the Company acts as an agent rather than a principal in atransaction, revenue is recognized to the extent of the commission.
ii) Gift cards
The Company sells gift cards through its retail stores, websites and selected third parties with no administrative fee charges orexpiration dates. No revenue is recognized at the time gift cards are sold. Revenue is recognized as a merchandise sale when the giftcard is redeemed by the customer.
The Company also recognizes income when the likelihood of the gift card being redeemed by the customer is remote (‘‘gift cardbreakage’’). Gift card breakage is estimated based on historical redemption patterns and is recognized in proportion to the redemptionof gift card balances.
v) Credit operations
Legacy agreements
Under the legacy credit program agreements, the Company earns royalty payments from credit card issuers based on the total ofCompany and other sales charged to either Private Label Credit Cards (‘‘PLCC’’) or MasterCards. Royalty rates change based on theyear-to-date credit volume of out-of-store credit card sales. The Company also receives bounty payments from credit card issuers foreach approved PLCC or MasterCard account. Bounty and royalty payments are recognized based on expected or actual performanceover the life of the credit card agreements. In addition, pursuant to a servicing agreement with a credit card issuer, the Companyreceives compensation for providing key customer service functions including new account openings, transaction authorizations, billingadjustments and customer inquiries. All credit revenues are included as a reduction of selling, general and administrative expenses.
New credit card program
Effective January 1, 2015, under a new credit card agreement with a credit card issuer, the Company shares in the income and losses ofthe credit card program related to private label and co-branded credit cards at Hudson’s Bay and Saks. The effective date for Lord &Taylor is June 2015. Income (loss) from the credit card program is included in selling, general and administrative expenses.
w) Vendor allowances
The Company receives cash or allowances from vendors, the most significant of which are in respect of markdown allowances, volumerebates and advertising. Such amounts are recorded as a reduction of the cost of purchases.
Rebates that are based on specified cumulative purchase volumes are recognized if the rebate is probable and reasonably estimable;otherwise these rebates are recognized when earned. These rebates are applied as a reduction of the cost of purchases.
x) Loyalty programs
Award credits are accounted for as a separate component of the sales transaction in which they are granted and therefore, part of thefair value of the consideration received is allocated to the award credits. This allocation is reported as deferred revenue until the awardcredits are redeemed by the customer. The amount deferred is based on points outstanding that the Company estimates will beredeemed by customers and the estimated fair value of those points. The points expected to be redeemed are based on many factors,including an actuarial review, where required, of customers’ past experience and trends.
F-15

HUDSON’S BAY COMPANY
NOTES TO CONSOLIDATED FINANCIAL STATEMENTS (Continued)
NOTE 2. SIGNIFICANT ACCOUNTING POLICIES (Continued)
y) Assets held for sale and discontinued operations
Non-current assets and groups of assets and liabilities which comprise disposal groups are presented as assets held for sale, where theasset or disposal group is available for sale in its present condition and the sale is highly probable. For this purpose, the sale isconsidered highly probable if management is committed to a plan to achieve the sale; there is an active program to find a buyer; thenon-current asset or disposal group is being actively marketed at a reasonable price; the sale is anticipated to be completed within 1 yearfrom the date of classification, and; it is unlikely there will be changes to the plan.
When a component of an entity has been disposed of or is classified as held for sale and it represents a separate major line of businessor geographical area of operations, the related results of operations and gain or loss on disposition are presented in discontinuedoperations.
z) New accounting standards implemented in the current year
Financial Instruments
In December 2011, the IASB amended IAS 32 — Financial Instruments: Presentation (‘‘IAS 32’’) to clarify the requirements thatpermit offsetting a financial asset and liability in the financial statements. IAS 32 is effective for annual periods beginning on or afterJanuary 1, 2014. The Company has applied the standard at the beginning of its 2014 fiscal year and the implementation did not have animpact on its results of operations, financial position or disclosure.
In June 2013, IASB amended IAS 39 — Financial Instruments: Recognition and Measurement (‘‘IAS 39’’), providing guidance onnovation of over-the-counter derivatives and continued designation for hedge accounting. The amendments to IAS 39 must be appliedretrospectively for annual periods beginning on or after January 1, 2014. The Company implemented IAS 39 at the beginning of its 2014fiscal year and the implementation did not have an impact on its results of operations, financial position or disclosure.
Impairment of Assets
In May 2013, the IASB amended IAS 36 — Impairment of Assets (‘‘IAS 36’’), providing guidance on recoverable amount disclosures fornon-financial assets. The amendments to IAS 36 must be applied retrospectively for annual periods beginning on or after January 1,2014. The Company implemented IAS 36 at the beginning of its 2014 fiscal year and the implementation did not have an impact on itsresults of operations, financial position or disclosure.
Levies
In May 2013, the IASB issued IFRIC 21 — Levies (‘‘IFRIC 21’’) providing guidance on the accounting for levies imposed bygovernments. The interpretation clarifies that the obligating event that gives rise to a liability to pay a levy is the activity described in therelevant legislation that triggers the payment of the levy. It also clarifies that a levy liability is accrued rateably over a reporting periodonly if the activity that triggers payment occurs over such period, in accordance with the relevant legislation.
Property taxes are charged by a government in accordance with legislation, are based on underlying property value, and include bothreal and personal property. As such, real and personal property taxes are within the scope of IFRIC 21. Prior to the adoption ofIFRIC 21, the Company recorded all property taxes rateably over the relevant tax year.
Property tax legislation in various jurisdictions in Canada does not clearly define a single obligating event that gives rise to a liability topay annual property taxes. As such, at any date within the year, the only amount of property taxes that an owner can reasonably estimatethey are liable for is a pro rata estimate of annual property taxes based on the number of days of ownership. Rateable recognition ofproperty taxes in Canada, therefore, continues to be appropriate under IFRIC 21.
In the majority of the U.S. tax jurisdictions in which the Company operates, the obligating event for real and personal property taxes isownership of the property on the day of the year for which the tax is imposed.
The Company implemented IFRIC 21 retrospectively at the beginning of its 2014 fiscal year.
F-16
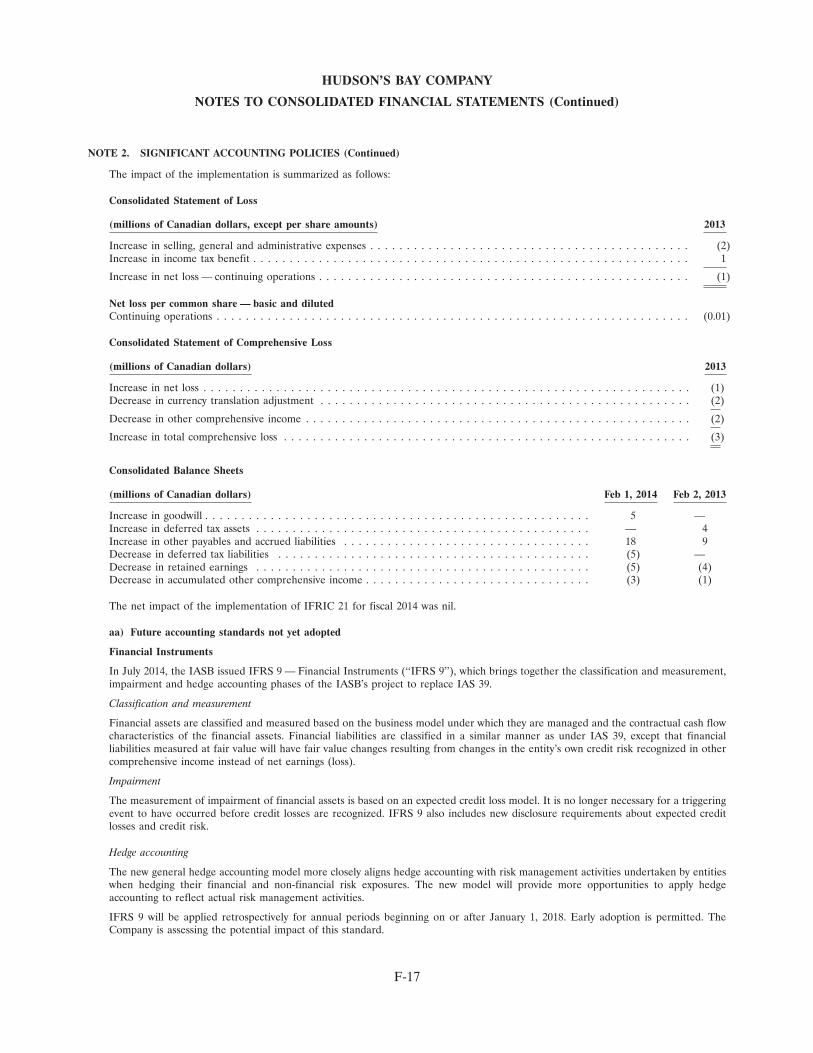
HUDSON’S BAY COMPANY
NOTES TO CONSOLIDATED FINANCIAL STATEMENTS (Continued)
NOTE 2. SIGNIFICANT ACCOUNTING POLICIES (Continued)
The impact of the implementation is summarized as follows:
Consolidated Statement of Loss
(millions of Canadian dollars, except per share amounts) 2013
Increase in selling, general and administrative expenses . . . . . . . . . . . . . . . . . . . . . . . . . . . . . . . . . . . . . . . . . . . . (2)Increase in income tax benefit . . . . . . . . . . . . . . . . . . . . . . . . . . . . . . . . . . . . . . . . . . . . . . . . . . . . . . . . . . . . 1
Increase in net loss — continuing operations . . . . . . . . . . . . . . . . . . . . . . . . . . . . . . . . . . . . . . . . . . . . . . . . . . . (1)
Net loss per common share — basic and dilutedContinuing operations . . . . . . . . . . . . . . . . . . . . . . . . . . . . . . . . . . . . . . . . . . . . . . . . . . . . . . . . . . . . . . . . . (0.01)
Consolidated Statement of Comprehensive Loss
(millions of Canadian dollars) 2013
Increase in net loss . . . . . . . . . . . . . . . . . . . . . . . . . . . . . . . . . . . . . . . . . . . . . . . . . . . . . . . . . . . . . . . . . . . (1)Decrease in currency translation adjustment . . . . . . . . . . . . . . . . . . . . . . . . . . . . . . . . . . . . . . . . . . . . . . . . . . . (2)
Decrease in other comprehensive income . . . . . . . . . . . . . . . . . . . . . . . . . . . . . . . . . . . . . . . . . . . . . . . . . . . . . (2)
Increase in total comprehensive loss . . . . . . . . . . . . . . . . . . . . . . . . . . . . . . . . . . . . . . . . . . . . . . . . . . . . . . . . (3)
Consolidated Balance Sheets
(millions of Canadian dollars) Feb 1, 2014 Feb 2, 2013
Increase in goodwill . . . . . . . . . . . . . . . . . . . . . . . . . . . . . . . . . . . . . . . . . . . . . . . . . . . . . 5 —Increase in deferred tax assets . . . . . . . . . . . . . . . . . . . . . . . . . . . . . . . . . . . . . . . . . . . . . . — 4Increase in other payables and accrued liabilities . . . . . . . . . . . . . . . . . . . . . . . . . . . . . . . . . . 18 9Decrease in deferred tax liabilities . . . . . . . . . . . . . . . . . . . . . . . . . . . . . . . . . . . . . . . . . . . (5) —Decrease in retained earnings . . . . . . . . . . . . . . . . . . . . . . . . . . . . . . . . . . . . . . . . . . . . . . (5) (4)Decrease in accumulated other comprehensive income . . . . . . . . . . . . . . . . . . . . . . . . . . . . . . . (3) (1)
The net impact of the implementation of IFRIC 21 for fiscal 2014 was nil.
aa) Future accounting standards not yet adopted
Financial Instruments
In July 2014, the IASB issued IFRS 9 — Financial Instruments (‘‘IFRS 9’’), which brings together the classification and measurement,impairment and hedge accounting phases of the IASB’s project to replace IAS 39.
Classification and measurement
Financial assets are classified and measured based on the business model under which they are managed and the contractual cash flowcharacteristics of the financial assets. Financial liabilities are classified in a similar manner as under IAS 39, except that financialliabilities measured at fair value will have fair value changes resulting from changes in the entity’s own credit risk recognized in othercomprehensive income instead of net earnings (loss).
Impairment
The measurement of impairment of financial assets is based on an expected credit loss model. It is no longer necessary for a triggeringevent to have occurred before credit losses are recognized. IFRS 9 also includes new disclosure requirements about expected creditlosses and credit risk.
Hedge accounting
The new general hedge accounting model more closely aligns hedge accounting with risk management activities undertaken by entitieswhen hedging their financial and non-financial risk exposures. The new model will provide more opportunities to apply hedgeaccounting to reflect actual risk management activities.
IFRS 9 will be applied retrospectively for annual periods beginning on or after January 1, 2018. Early adoption is permitted. TheCompany is assessing the potential impact of this standard.
F-17

HUDSON’S BAY COMPANY
NOTES TO CONSOLIDATED FINANCIAL STATEMENTS (Continued)
NOTE 2. SIGNIFICANT ACCOUNTING POLICIES (Continued)
Revenue
In May 2014, the IASB issued IFRS 15 — Revenue from Contracts with Customers (‘‘IFRS 15’’), which provides a comprehensiveframework for recognition, measurement and disclosure of revenue from contracts with customers, excluding contracts within the scopeof the standards on leases, insurance contracts and financial instruments. IFRS 15 is effective for annual periods beginning on or afterJanuary 1, 2017, and must be applied retrospectively. Early adoption is permitted. The Company is assessing the potential impact ofIFRS 15.
Joint Arrangements
In May 2014, the IASB amended IFRS 11 — Joint Arrangements (‘‘IFRS 11’’) to require that a joint operator accounting for theacquisition of an interest in a joint operation, in which the activity of the joint operation constitutes a business must apply the relevantIFRS 3 — Business Combinations principles for business combinations accounting. The amendments also clarify that a previously heldinterest in a joint operation is not remeasured on the acquisition of an additional interest in the same joint operation while joint controlis retained. In addition, a scope exclusion has been added to IFRS 11 to specify that the amendments do not apply when the partiessharing joint control, including the reporting entity, are under common control of the same ultimate controlling party.
The amendments apply to both the acquisition of the initial interest in a joint operation and the acquisition of any additional interests inthe same joint operation. The amended IFRS 11 is effective for annual periods beginning on or after January 1, 2016, and must beapplied prospectively. Early adoption is permitted. The Company is assessing the potential impact of the amendments to IFRS 11.
NOTE 3. CRITICAL ACCOUNTING JUDGMENTS AND KEY SOURCES OF ESTIMATION UNCERTAINTY
In the application of the Company’s accounting policies, which are described in note 2, and the preparation of the consolidated financialstatements, management is required to make judgments, estimates and assumptions about the carrying amounts of assets and liabilities,and reporting of income and expenses, that are not readily apparent from other sources. The estimates and associated assumptions arebased on historical experience and other factors that are considered to be relevant. Actual results may differ materially from theseestimates. The estimates and underlying assumptions are reviewed on an ongoing basis. Revisions to accounting estimates arerecognized in the period in which the estimate is revised if the revision affects only that period or in the period of the revision and futureperiods if the revision affects both current and future periods.
The following are the critical judgments and estimations that management has made in the process of applying the Company’saccounting policies and that have the most significant effect on the amounts recognized in the consolidated financial statements:
Business combinations
Fair value of assets acquired and liabilities assumed in a business combination is estimated based on information available at the date ofacquisition and involves considerable judgment in determining the fair values assigned to property, plant and equipment and intangibleassets acquired and liabilities assumed on acquisition. The determination of these fair values involves analysis including the use ofdiscounted cash flows, estimated future margins, future growth rates, market rents and capitalization rates. There is measurementuncertainty inherent in this analysis and actual results could differ from estimates.
Inventory valuation
Inventory is valued at the lower of cost and net realizable value. Current selling price and historical trends for estimating futuremarkdowns are utilized to estimate net realizable value. Inventory valuation also incorporates a write-down to reflect future losses onthe disposition of obsolete merchandise.
Inventory is adjusted to reflect estimated losses (‘‘shortage’’) incurred since the last inventory count. Shortage is estimated based onhistorical experience as a percentage of sales for the period from the date of the last inventory count to the end of the fiscal year.
Loyalty programs
Where loyalty award credits are issued in connection with a sales transaction which includes the loyalty program, a portion of therevenue has been deferred based on expected redemptions of points outstanding (note 2(x)). The amount of revenue deferred relatingto the loyalty programs is sensitive to changes in customer behaviour and the impact of changes in the loyalty programs. Deferredrevenue reported in the consolidated balance sheets relates entirely to the loyalty programs.
F-18

HUDSON’S BAY COMPANY
NOTES TO CONSOLIDATED FINANCIAL STATEMENTS (Continued)
NOTE 3. CRITICAL ACCOUNTING JUDGMENTS AND KEY SOURCES OF ESTIMATION UNCERTAINTY (Continued)
Impairment and reversal of impairment of long-lived assets
Long-lived assets are subject to impairment and impairment reversal reviews based on whether current or future events andcircumstances suggest that their recoverable amount may be more or less than their carrying value. In certain instances, the recoverableamount is based on a calculation of expected future cash flows which includes management assumptions and estimates of futureperformance. Details of asset impairments are set out in note 11.
Impairment of goodwill
The Company uses judgment in determining the grouping of assets to identify its CGUs for purposes of testing for impairment ofgoodwill. In testing for impairment, goodwill acquired in a business combination is allocated to CGUs that are expected to benefit fromthe synergies of the business combination. The calculations for impairment testing involve significant estimates and assumptions. Itemsestimated include cash flows, discount rates and assumptions on revenue growth rates. These estimates could affect the Company’sfuture results if the current estimates of future performance and fair values change. Judgment is also exercised to determine whether anindication of impairment is present that would require the completion of an impairment test in addition to the annual testing. Details ofthe allocation of goodwill and impairment testing are set out in note 12.
Valuation of warrants
In connection with the Acquisition, the Company issued warrants. The classification of these instruments as financial liabilities is anarea of significant judgment. The Company records a mark-to-market valuation adjustment on the warrants as finance costs based on avaluation at the end of each reporting period.
Provisions
Provisions have been made for various items including asset retirement obligations, general insurance liability and termination costs.Asset retirement obligations are based on uncertain estimates of remediation and the timing of the remediation. The Companypurchases third party insurance for automobile, product, workers’ compensation, medical and general liability claims that exceed acertain dollar level. The Company is responsible for the payment of claims below these insured limits. The self-insurance provision isbased on claims filed and an estimate of claims incurred but not yet reported. Details of the Company’s provisions are set out in note 15.
In the context of provisions for onerous contracts including leases, the Company uses judgment in determining when the expectedbenefits to be derived by the Company from a contract are lower than the unavoidable costs of meeting its obligations underthe contract.
Sales returns
Sales returns are estimated on the basis of historical returns and are recorded so as to allocate them to the same period as the originalrevenue is recorded.
Share based compensation
The Company operates a share option plan, phantom share plan, restricted share unit plan, performance share unit plan and profitsinterests plan for employees. The grant date fair values are calculated using valuation models, which use a number of assumptions andestimates, including expected volatility, the risk-free interest rate, the dividend yield, the non-marketability discount and the expectedlife of the grants. Details of these assumptions and estimates are set out in note 19.
Income taxes
The Company recognizes expected liabilities for income taxes based on an estimation of the likely income taxes due, which requiresjudgment as to the ultimate income tax determination of certain items. In addition, the Company has made estimates of futureprofitability in relation to an assessment of the recoverability of income tax losses. Details of the income tax expense and deferred taxesare set out in note 7.
Pensions and employee benefits
The Company operates various defined benefit plans for its employees. The present value of the plans’ liabilities recognized at thebalance sheet date and net financing charges recognized in net earnings (loss) are dependent on the interest rate of high qualitycorporate bonds. Other key assumptions within this calculation are based on market conditions or estimates of future events, includingmortality rates, as set out in note 17.
F-19

HUDSON’S BAY COMPANY
NOTES TO CONSOLIDATED FINANCIAL STATEMENTS (Continued)
NOTE 3. CRITICAL ACCOUNTING JUDGMENTS AND KEY SOURCES OF ESTIMATION UNCERTAINTY (Continued)
Lease accounting
The Company leases a significant number of store locations as part of its operations. The determination of classification betweenfinance and operating leases requires the exercise of management judgment, including estimates of fair value, the useful and economiclives of the leased assets, the existence of lower than market renewal options and appropriate discount rates. Finance leases andoperating leases are discussed in notes 14 and 16, respectively.
Management judgment is also exercised in the assessment of sale and leaseback transactions, including the determination of leasebackclassification between finance and operating leases, the fair value of the leased back property and appropriate discount rates.
NOTE 4. ACQUISITION OF SAKS
Acquisition
On November 4, 2013, the Company acquired all of the issued and outstanding shares of Saks (other than shares owned by Saks and itssubsidiaries), an omni-channel luxury retailer, for U.S.$16.00 per share in an all-cash transaction valued at U.S.$2,973 million($3,097 million), including debt assumed.
The Acquisition consideration of $2,797 million was financed through a subscription receipts offering (note 20), the issuance of commonshares pursuant to equity commitments to H.S. Investment L.P. (‘‘HSILP’’), an entity affiliated with Ontario Teachers’ Pension PlanBoard, and to West Face Long Term Opportunities Global Master L.P. (‘‘WF Fund’’), a fund advised by West Face Capital Inc.(note 20), and the incurrence of U.S.$2,000 million and U.S.$300 million term loans (note 14). As consideration for the equitycommitments of HSILP and WF Fund, the Company issued 6.75 million warrants (notes 18 and 20).
Purchase Price Allocation
The Company has finalized the purchase price allocation for the acquisition of Saks including goodwill. The following table summarizesthe fair value of the consideration given and the final fair values assigned to the assets acquired and liabilities assumed:
(millions of Canadian dollars)
Cash . . . . . . . . . . . . . . . . . . . . . . . . . . . . . . . . . . . . . . . . . . . . . . . . . . . . . . . . . . . . . . . . . . . . . . . . . . . 31Trade and other receivables . . . . . . . . . . . . . . . . . . . . . . . . . . . . . . . . . . . . . . . . . . . . . . . . . . . . . . . . . . . . 68Inventories . . . . . . . . . . . . . . . . . . . . . . . . . . . . . . . . . . . . . . . . . . . . . . . . . . . . . . . . . . . . . . . . . . . . . . . 1,117Other current assets . . . . . . . . . . . . . . . . . . . . . . . . . . . . . . . . . . . . . . . . . . . . . . . . . . . . . . . . . . . . . . . . . 50Property, plant and equipment . . . . . . . . . . . . . . . . . . . . . . . . . . . . . . . . . . . . . . . . . . . . . . . . . . . . . . . . . . 2,414Intangible assets . . . . . . . . . . . . . . . . . . . . . . . . . . . . . . . . . . . . . . . . . . . . . . . . . . . . . . . . . . . . . . . . . . . 681Goodwill . . . . . . . . . . . . . . . . . . . . . . . . . . . . . . . . . . . . . . . . . . . . . . . . . . . . . . . . . . . . . . . . . . . . . . . . 195Other assets . . . . . . . . . . . . . . . . . . . . . . . . . . . . . . . . . . . . . . . . . . . . . . . . . . . . . . . . . . . . . . . . . . . . . . 4Loans and borrowings — revolving credit facility . . . . . . . . . . . . . . . . . . . . . . . . . . . . . . . . . . . . . . . . . . . . . . . (299)Loans and borrowings — finance leases . . . . . . . . . . . . . . . . . . . . . . . . . . . . . . . . . . . . . . . . . . . . . . . . . . . . . (123)Loans and borrowings — other . . . . . . . . . . . . . . . . . . . . . . . . . . . . . . . . . . . . . . . . . . . . . . . . . . . . . . . . . . (2)Trade payables . . . . . . . . . . . . . . . . . . . . . . . . . . . . . . . . . . . . . . . . . . . . . . . . . . . . . . . . . . . . . . . . . . . . (275)Other payables and accrued liabilities . . . . . . . . . . . . . . . . . . . . . . . . . . . . . . . . . . . . . . . . . . . . . . . . . . . . . . (236)Deferred revenue . . . . . . . . . . . . . . . . . . . . . . . . . . . . . . . . . . . . . . . . . . . . . . . . . . . . . . . . . . . . . . . . . . (41)Provisions . . . . . . . . . . . . . . . . . . . . . . . . . . . . . . . . . . . . . . . . . . . . . . . . . . . . . . . . . . . . . . . . . . . . . . . (51)Deferred tax liabilities . . . . . . . . . . . . . . . . . . . . . . . . . . . . . . . . . . . . . . . . . . . . . . . . . . . . . . . . . . . . . . . (639)Pensions and employee benefits . . . . . . . . . . . . . . . . . . . . . . . . . . . . . . . . . . . . . . . . . . . . . . . . . . . . . . . . . (29)Other liabilities . . . . . . . . . . . . . . . . . . . . . . . . . . . . . . . . . . . . . . . . . . . . . . . . . . . . . . . . . . . . . . . . . . . . (68)
Total identifiable net assets acquired and consideration given . . . . . . . . . . . . . . . . . . . . . . . . . . . . . . . . . . . . . . 2,797
F-20

HUDSON’S BAY COMPANY
NOTES TO CONSOLIDATED FINANCIAL STATEMENTS (Continued)
NOTE 4. ACQUISITION OF SAKS (Continued)
Measurement Period Adjustments
During fiscal 2014, the Company identified measurement period adjustments based on new information relating primarily toinventories. The impacts of the adjustments to previously reported amounts are as follows:
Consolidated Balance Sheets
(millions of Canadian dollars) Nov 4, 2013 Feb 1, 2014
Increase in inventories . . . . . . . . . . . . . . . . . . . . . . . . . . . . . . . . . . . . . . . . . . . . . . . . 21 22Decrease in intangible assets . . . . . . . . . . . . . . . . . . . . . . . . . . . . . . . . . . . . . . . . . . . . (1) (1)Decrease in goodwill . . . . . . . . . . . . . . . . . . . . . . . . . . . . . . . . . . . . . . . . . . . . . . . . . (10) (11)Increase in other payables and accrued liabilities . . . . . . . . . . . . . . . . . . . . . . . . . . . . . . . 9 9Increase in deferred tax liabilities . . . . . . . . . . . . . . . . . . . . . . . . . . . . . . . . . . . . . . . . . 1 1
NOTE 5. DEPRECIATION AND AMORTIZATION
(millions of Canadian dollars) 2014 2013
Property, plant and equipment . . . . . . . . . . . . . . . . . . . . . . . . . . . . . . . . . . . . . . . . . . . 271 129Intangible assets . . . . . . . . . . . . . . . . . . . . . . . . . . . . . . . . . . . . . . . . . . . . . . . . . . . . 77 46Deferred credits . . . . . . . . . . . . . . . . . . . . . . . . . . . . . . . . . . . . . . . . . . . . . . . . . . . . (4) (3)Other . . . . . . . . . . . . . . . . . . . . . . . . . . . . . . . . . . . . . . . . . . . . . . . . . . . . . . . . . . . — 3
344 175
NOTE 6. FINANCE COSTS
(millions of Canadian dollars) 2014 2013
Interest expense on long-term borrowings . . . . . . . . . . . . . . . . . . . . . . . . . . . . . . . . . . . 132 61Interest expense on short-term borrowings . . . . . . . . . . . . . . . . . . . . . . . . . . . . . . . . . . 22 21Write-off of deferred financing costs (note 14) . . . . . . . . . . . . . . . . . . . . . . . . . . . . . . . . 52 13Net interest on pensions and employee benefits (note 17) . . . . . . . . . . . . . . . . . . . . . . . . 1 1Penalties and fees (note 14) . . . . . . . . . . . . . . . . . . . . . . . . . . . . . . . . . . . . . . . . . . . 12 —Interest income . . . . . . . . . . . . . . . . . . . . . . . . . . . . . . . . . . . . . . . . . . . . . . . . . . . (1) (1)
Total interest expense, net . . . . . . . . . . . . . . . . . . . . . . . . . . . . . . . . . . . . . . . . . . . . . . 218 95
Finance related costs on warrants (note 18) . . . . . . . . . . . . . . . . . . . . . . . . . . . . . . . . . 44 —Change in fair value of Equity Commitment Forwards (note 18) . . . . . . . . . . . . . . . . . . . . — 153Dividend equivalent on subscription receipts . . . . . . . . . . . . . . . . . . . . . . . . . . . . . . . . . — 1Bridge financing transaction fees . . . . . . . . . . . . . . . . . . . . . . . . . . . . . . . . . . . . . . . . — 12
Acquisition-related finance costs . . . . . . . . . . . . . . . . . . . . . . . . . . . . . . . . . . . . . . . . . . 44 166
262 261
In connection with financing the Acquisition in fiscal 2013, the Company secured a bridge financing facility in the amount ofU.S.$900 million to fund potential delays related to closing the uncommitted equity and debt financing transactions. Although thefacility was not drawn upon, the Company incurred bridge financing transaction fees related to the facility which were included infinance costs in fiscal 2013.
F-21

HUDSON’S BAY COMPANY
NOTES TO CONSOLIDATED FINANCIAL STATEMENTS (Continued)
NOTE 7. INCOME TAXES
The major components of the income tax benefit and the statutory income tax rate for fiscal 2014 and 2013 are as follows:
2013(restated —
(millions of Canadian dollars) 2014 see note 2(z))
Current tax expense (benefit) . . . . . . . . . . . . . . . . . . . . . . . . . . . . . . . . . . . . . . . . . . . . 8 (3)Deferred tax benefit . . . . . . . . . . . . . . . . . . . . . . . . . . . . . . . . . . . . . . . . . . . . . . . . . . (27) (76)
Income tax benefit . . . . . . . . . . . . . . . . . . . . . . . . . . . . . . . . . . . . . . . . . . . . . . . . . . . (19) (79)
Statutory income tax rate . . . . . . . . . . . . . . . . . . . . . . . . . . . . . . . . . . . . . . . . . . . . . . 26.3% 26.3%
Reconciliations of the income tax benefit at the above rates with the amounts presented in the consolidated statements of earnings(loss) are as follows:
2013(restated —
(millions of Canadian dollars) 2014 see note 2(z))
Earnings (loss) before income tax — continuing operations . . . . . . . . . . . . . . . . . . . . . . . . . 219 (256)Income tax expense (benefit) calculated at statutory income tax rate . . . . . . . . . . . . . . . . . . . 57 (67)Change in income taxes resulting from:
Permanent differences . . . . . . . . . . . . . . . . . . . . . . . . . . . . . . . . . . . . . . . . . . . . . . . (34) 56Increase (decrease) in valuation allowance . . . . . . . . . . . . . . . . . . . . . . . . . . . . . . . . . . 1 (53)Adjustments related to prior years . . . . . . . . . . . . . . . . . . . . . . . . . . . . . . . . . . . . . . . (8) 9Effect of international tax rate differentials . . . . . . . . . . . . . . . . . . . . . . . . . . . . . . . . . . (37) (19)Recognition of losses . . . . . . . . . . . . . . . . . . . . . . . . . . . . . . . . . . . . . . . . . . . . . . . . — (4)Other . . . . . . . . . . . . . . . . . . . . . . . . . . . . . . . . . . . . . . . . . . . . . . . . . . . . . . . . . 2 (1)
Income tax benefit . . . . . . . . . . . . . . . . . . . . . . . . . . . . . . . . . . . . . . . . . . . . . . . . . . . (19) (79)
The changes in the components of net deferred tax assets and liabilities for fiscal 2014 and 2013 are as follows:
Year ended January 31, 2015
RecognizedRecognized in other Net foreign
Feb 1, in net comprehensive currency Jan 31,(millions of Canadian dollars) 2014 earnings income exchange 2015
Property, plant and equipment . . . . . . . . . . . . . . . . . . . . . . (466) (40) — (76) (582)Employee benefits . . . . . . . . . . . . . . . . . . . . . . . . . . . . . . 22 (6) 1 — 17Pensions . . . . . . . . . . . . . . . . . . . . . . . . . . . . . . . . . . . . (8) 4 3 2 1Other assets . . . . . . . . . . . . . . . . . . . . . . . . . . . . . . . . . . (217) 48 1 (28) (196)Long-term liabilities and other . . . . . . . . . . . . . . . . . . . . . . 55 31 4 4 94Tax losses and other carryforward amounts . . . . . . . . . . . . . . 245 (9) — 17 253
(369) 28 9 (81) (413)Valuation allowance . . . . . . . . . . . . . . . . . . . . . . . . . . . . . (13) (1) — (1) (15)
Net deferred tax (liabilities) assets . . . . . . . . . . . . . . . . . . . (382) 27 9 (82) (428)
Comprising:Deferred tax assets . . . . . . . . . . . . . . . . . . . . . . . . . . . . . 249 240Deferred tax liabilities . . . . . . . . . . . . . . . . . . . . . . . . . . . (631) (668)
(382) (428)
F-22

HUDSON’S BAY COMPANY
NOTES TO CONSOLIDATED FINANCIAL STATEMENTS (Continued)
NOTE 7. INCOME TAXES (Continued)
Year ended February 1, 2014 (restated — see note 2(z) and note 4)
Assumed Transferred Recognized Netthrough from assets of Recognized in other foreign
(millions of Canadian Feb 2, business discontinued in net comprehensive Recognized currency Feb 1,dollars) 2013 combination operations loss income in equity exchange 2014
Property, plantand equipment . . . . . . . . 100 (502) 12 (40) — — (36) (466)
Employee benefits . . . . . . . 18 — 6 (2) — — — 22Pensions . . . . . . . . . . . . . (10) 5 — 12 (16) — 1 (8)Other assets . . . . . . . . . . . 8 (210) (20) 21 — — (16) (217)Long-term liabilities and
other . . . . . . . . . . . . . . 41 22 24 (42) 3 5 2 55Tax losses and other
carryforward amounts . . . . 65 61 37 74 — — 8 245
222 (624) 59 23 (13) 5 (41) (369)Valuation allowance . . . . . . (8) (15) (44) 53 — — 1 (13)
Net deferred tax assets(liabilities) . . . . . . . . . . 214 (639) 15 76 (13) 5 (40) (382)
Comprising:Deferred tax assets . . . . . . . 214 249Deferred tax liabilities . . . . . — (631)
214 (382)
The realization of the deferred income tax assets is dependent on the generation of future taxable income during the years in whichthose temporary differences become deductible. Based on management’s projection of future taxable income and tax planningstrategies, management expects to realize these net deferred income tax assets in advance of expiry.
As at January 31, 2015, the Company’s taxable entities including discontinued operations have non-capital tax losses carried forward of$770 million available in the United States and Canada as follows (millions of Canadian dollars):
Available until year ending
January 2026 . . . . . . . . . . . . . . . . . . . . . . . . . . . . . . . . . . . . . . . . . . . . . . . . . . . . . . . . . . . . . . . . . . . . . . . . 72January 2027 . . . . . . . . . . . . . . . . . . . . . . . . . . . . . . . . . . . . . . . . . . . . . . . . . . . . . . . . . . . . . . . . . . . . . . . . 109January 2028 . . . . . . . . . . . . . . . . . . . . . . . . . . . . . . . . . . . . . . . . . . . . . . . . . . . . . . . . . . . . . . . . . . . . . . . . 216January 2029 . . . . . . . . . . . . . . . . . . . . . . . . . . . . . . . . . . . . . . . . . . . . . . . . . . . . . . . . . . . . . . . . . . . . . . . . 16January 2030 . . . . . . . . . . . . . . . . . . . . . . . . . . . . . . . . . . . . . . . . . . . . . . . . . . . . . . . . . . . . . . . . . . . . . . . . 1January 2031 . . . . . . . . . . . . . . . . . . . . . . . . . . . . . . . . . . . . . . . . . . . . . . . . . . . . . . . . . . . . . . . . . . . . . . . . 12January 2032 . . . . . . . . . . . . . . . . . . . . . . . . . . . . . . . . . . . . . . . . . . . . . . . . . . . . . . . . . . . . . . . . . . . . . . . . 6January 2033 . . . . . . . . . . . . . . . . . . . . . . . . . . . . . . . . . . . . . . . . . . . . . . . . . . . . . . . . . . . . . . . . . . . . . . . . 88January 2034 . . . . . . . . . . . . . . . . . . . . . . . . . . . . . . . . . . . . . . . . . . . . . . . . . . . . . . . . . . . . . . . . . . . . . . . . 192January 2035 . . . . . . . . . . . . . . . . . . . . . . . . . . . . . . . . . . . . . . . . . . . . . . . . . . . . . . . . . . . . . . . . . . . . . . . . 58
770
NOTE 8. CASH
For the purposes of the consolidated statements of cash flows, cash includes cash on hand and in banks. Cash as at January 31, 2015 andFebruary 1, 2014 as presented in the consolidated balance sheets is comprised of the following:
(millions of Canadian dollars) 2014 2013
Cash . . . . . . . . . . . . . . . . . . . . . . . . . . . . . . . . . . . . . . . . . . . . . . . . . . . . . . . . . . . . . . . . . . . . . . . 153 19Restricted cash . . . . . . . . . . . . . . . . . . . . . . . . . . . . . . . . . . . . . . . . . . . . . . . . . . . . . . . . . . . . . . . . 15 2
168 21
F-23

HUDSON’S BAY COMPANY
NOTES TO CONSOLIDATED FINANCIAL STATEMENTS (Continued)
NOTE 9. TRADE AND OTHER RECEIVABLES
As at January 31, 2015 and February 1, 2014, trade and other receivables are comprised of:
(millions of Canadian dollars) 2014 2013
Trade receivables . . . . . . . . . . . . . . . . . . . . . . . . . . . . . . . . . . . . . . . . . . . . . . . . . . . . . . . . . . . . . . . 48 41Other receivables . . . . . . . . . . . . . . . . . . . . . . . . . . . . . . . . . . . . . . . . . . . . . . . . . . . . . . . . . . . . . . . 164 96
212 137
On January 4, 2013, the Company sold its leasehold interests in a property for U.S.$10 million of which U.S.$4 million was receivedupon transfer of the related property on January 31, 2013, the second installment of U.S.$3 million was received on January 31, 2014and the final installment of U.S.$3 million was received on January 31, 2015. Accordingly, as at January 31, 2015, nil (February 1, 2014:U.S. $3 million) was included in other receivables.
The fair value of trade and other receivables approximates their carrying values because of the short term nature of these accounts. Novaluation allowance was required at the end of either reporting period. Other receivables mainly comprise sundry receivablesfrom vendors.
NOTE 10. INVENTORIES
Inventories on hand at January 31, 2015 and February 1, 2014 were available for sale. The cost of merchandise inventories related tocontinuing operations recognized as expense for fiscal 2014 was $4,893 million (2013: $3,217 million). The write-down of merchandiseinventories below cost to net realizable value relating to continuing operations as at January 31, 2015 was $48 million (February 1, 2014:$47 million). There was no reversal of write-downs previously taken on merchandise inventories that are no longer estimated to sellbelow cost. Inventory has been pledged as security for certain borrowing agreements as described in note 14.
NOTE 11. PROPERTY, PLANT AND EQUIPMENT
Year ended January 31, 2015
Assetsheld under
Freehold Leasehold Fixtures & Finance(millions of Canadian dollars) Land Buildings Improvements Fittings Leases Total
CostBalance at beginning of year . . . . . . . . . . . . . . 1,055 2,085 456 801 283 4,680Additions . . . . . . . . . . . . . . . . . . . . . . . . . . — 55 134 199 5 393Disposals . . . . . . . . . . . . . . . . . . . . . . . . . . (97) (41) (4) (21) — (163)Net foreign currency exchange . . . . . . . . . . . . . 118 275 55 97 33 578
Balance at end of year . . . . . . . . . . . . . . . . . . 1,076 2,374 641 1,076 321 5,488
Accumulated depreciation and impairmentBalance at beginning of year . . . . . . . . . . . . . . 5 185 103 239 38 570Depreciation expense . . . . . . . . . . . . . . . . . . . — 86 45 115 25 271Impairment losses . . . . . . . . . . . . . . . . . . . . . — — 1 — — 1Eliminated on disposal . . . . . . . . . . . . . . . . . . — (15) (6) (18) — (39)Net foreign currency exchange . . . . . . . . . . . . . — 32 12 32 3 79
Balance at end of year . . . . . . . . . . . . . . . . . . 5 288 155 368 66 882
Net book value at end of year . . . . . . . . . . . . . 1,071 2,086 486 708 255 4,606
F-24
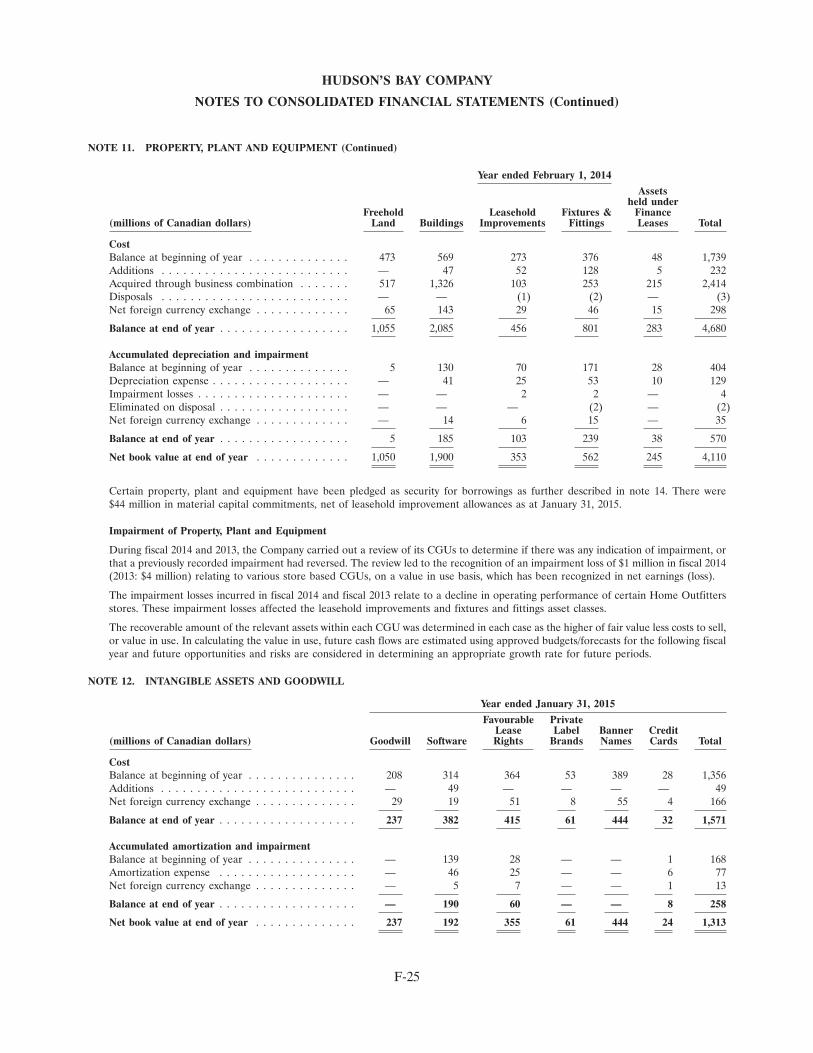
HUDSON’S BAY COMPANY
NOTES TO CONSOLIDATED FINANCIAL STATEMENTS (Continued)
NOTE 11. PROPERTY, PLANT AND EQUIPMENT (Continued)
Year ended February 1, 2014
Assetsheld under
Freehold Leasehold Fixtures & Finance(millions of Canadian dollars) Land Buildings Improvements Fittings Leases Total
CostBalance at beginning of year . . . . . . . . . . . . . . 473 569 273 376 48 1,739Additions . . . . . . . . . . . . . . . . . . . . . . . . . . — 47 52 128 5 232Acquired through business combination . . . . . . . 517 1,326 103 253 215 2,414Disposals . . . . . . . . . . . . . . . . . . . . . . . . . . — — (1) (2) — (3)Net foreign currency exchange . . . . . . . . . . . . . 65 143 29 46 15 298
Balance at end of year . . . . . . . . . . . . . . . . . . 1,055 2,085 456 801 283 4,680
Accumulated depreciation and impairmentBalance at beginning of year . . . . . . . . . . . . . . 5 130 70 171 28 404Depreciation expense . . . . . . . . . . . . . . . . . . . — 41 25 53 10 129Impairment losses . . . . . . . . . . . . . . . . . . . . . — — 2 2 — 4Eliminated on disposal . . . . . . . . . . . . . . . . . . — — — (2) — (2)Net foreign currency exchange . . . . . . . . . . . . . — 14 6 15 — 35
Balance at end of year . . . . . . . . . . . . . . . . . . 5 185 103 239 38 570
Net book value at end of year . . . . . . . . . . . . . 1,050 1,900 353 562 245 4,110
Certain property, plant and equipment have been pledged as security for borrowings as further described in note 14. There were$44 million in material capital commitments, net of leasehold improvement allowances as at January 31, 2015.
Impairment of Property, Plant and Equipment
During fiscal 2014 and 2013, the Company carried out a review of its CGUs to determine if there was any indication of impairment, orthat a previously recorded impairment had reversed. The review led to the recognition of an impairment loss of $1 million in fiscal 2014(2013: $4 million) relating to various store based CGUs, on a value in use basis, which has been recognized in net earnings (loss).
The impairment losses incurred in fiscal 2014 and fiscal 2013 relate to a decline in operating performance of certain Home Outfittersstores. These impairment losses affected the leasehold improvements and fixtures and fittings asset classes.
The recoverable amount of the relevant assets within each CGU was determined in each case as the higher of fair value less costs to sell,or value in use. In calculating the value in use, future cash flows are estimated using approved budgets/forecasts for the following fiscalyear and future opportunities and risks are considered in determining an appropriate growth rate for future periods.
NOTE 12. INTANGIBLE ASSETS AND GOODWILL
Year ended January 31, 2015
Favourable PrivateLease Label Banner Credit
(millions of Canadian dollars) Goodwill Software Rights Brands Names Cards Total
CostBalance at beginning of year . . . . . . . . . . . . . . . 208 314 364 53 389 28 1,356Additions . . . . . . . . . . . . . . . . . . . . . . . . . . . — 49 — — — — 49Net foreign currency exchange . . . . . . . . . . . . . . 29 19 51 8 55 4 166
Balance at end of year . . . . . . . . . . . . . . . . . . . 237 382 415 61 444 32 1,571
Accumulated amortization and impairmentBalance at beginning of year . . . . . . . . . . . . . . . — 139 28 — — 1 168Amortization expense . . . . . . . . . . . . . . . . . . . — 46 25 — — 6 77Net foreign currency exchange . . . . . . . . . . . . . . — 5 7 — — 1 13
Balance at end of year . . . . . . . . . . . . . . . . . . . — 190 60 — — 8 258
Net book value at end of year . . . . . . . . . . . . . . 237 192 355 61 444 24 1,313
F-25

HUDSON’S BAY COMPANY
NOTES TO CONSOLIDATED FINANCIAL STATEMENTS (Continued)
NOTE 12. INTANGIBLE ASSETS AND GOODWILL (Continued)
Year ended February 1, 2014 (restated — see note 4)
Favourable PrivateLease Label Banner Credit
(millions of Canadian dollars) Goodwill Software Rights Brands Names Cards Total
CostBalance at beginning of year . . . . . . . . . . . . . . . — 204 131 27 — — 362Additions . . . . . . . . . . . . . . . . . . . . . . . . . . . — 48 — — — — 48Acquired through business combination . . . . . . . . 195 66 204 21 364 26 876Disposals . . . . . . . . . . . . . . . . . . . . . . . . . . . — (12) — — — — (12)Net foreign currency exchange . . . . . . . . . . . . . . 13 8 29 5 25 2 82
Balance at end of year . . . . . . . . . . . . . . . . . . . 208 314 364 53 389 28 1,356
Accumulated amortization and impairmentBalance at beginning of year . . . . . . . . . . . . . . . — 111 18 — — — 129Amortization expense . . . . . . . . . . . . . . . . . . . — 37 8 — — 1 46Disposals . . . . . . . . . . . . . . . . . . . . . . . . . . . — (11) — — — — (11)Net foreign currency exchange . . . . . . . . . . . . . . — 2 2 — — — 4
Balance at end of year . . . . . . . . . . . . . . . . . . . — 139 28 — — 1 168
Net book value at end of year . . . . . . . . . . . . . . 208 175 336 53 389 27 1,188
The banner names and private label brands have been assigned an indefinite useful life, as there is no foreseeable limit to the periodover which the assets are expected to generate net cash inflows and the Company’s intention is to continue to utilize these trade namesfor the foreseeable future.
Allocation and Impairment Testing of Goodwill
The Company completed the allocation of goodwill to groups of CGUs that will benefit from the synergies related to the Acquisitionand performed its annual impairment test as at November 2, 2014, the first day of its fourth quarter. There was no goodwill recognizedon the Company’s balance sheet prior to the Acquisition.
The carrying amount of goodwill has been allocated to the Saks Fifth Avenue and OFF 5TH banners.
The recoverable amounts of banners are determined based on fair value less costs of disposal using an income approach thatincorporates a discounted cash flow model. This approach requires the Company to estimate and take into account the amount, timing,and relative certainty of projected unlevered cash flows expected to be generated by the operating assets and requires that certainassumptions be made.
In determining fair value less costs of disposal, the forecasted cash flows are based on the Company’s strategic business plans, aspresented to and approved by the Board of Directors, and projected over a 5 year period. Non-recurring and unusual items have beenadjusted for in the projected future cash flows. The Company selected discount rates representative of the current market assessment ofthe risks specific to each banner in the range of 7.0% to 12.0% for each calculation of fair value less costs of disposal. Applicableterminal growth rates were applied after the discrete projected period. These key assumptions are all considered Level 3 of the fairvalue hierarchy (note 18). As a result of this analysis, no impairment was identified for either banner to which goodwill hasbeen allocated.
The Company believes that any reasonable possible change in the key assumptions on which the recoverable amount is based would notcause the aggregate carrying amount to exceed the aggregate recoverable amount of either of the banners.
F-26

HUDSON’S BAY COMPANY
NOTES TO CONSOLIDATED FINANCIAL STATEMENTS (Continued)
NOTE 13. OTHER LIABILITIES
As at January 31, 2015 and February 1, 2014, other liabilities are comprised of:
(millions of Canadian dollars) 2014 2013
Deferred landlord incentives . . . . . . . . . . . . . . . . . . . . . . . . . . . . . . . . . . . . . . . . . . . . . . . . . . . . . . . . 356 169Deferred gain on sale and leaseback transaction . . . . . . . . . . . . . . . . . . . . . . . . . . . . . . . . . . . . . . . . . . . 242 —Deferred proceeds from lease terminations . . . . . . . . . . . . . . . . . . . . . . . . . . . . . . . . . . . . . . . . . . . . . . . 49 —Other deferred credits . . . . . . . . . . . . . . . . . . . . . . . . . . . . . . . . . . . . . . . . . . . . . . . . . . . . . . . . . . . . 11 13Other liabilities . . . . . . . . . . . . . . . . . . . . . . . . . . . . . . . . . . . . . . . . . . . . . . . . . . . . . . . . . . . . . . . . 87 20
745 202
Non-current . . . . . . . . . . . . . . . . . . . . . . . . . . . . . . . . . . . . . . . . . . . . . . . . . . . . . . . . . . . . . . . . . . 669 202Current . . . . . . . . . . . . . . . . . . . . . . . . . . . . . . . . . . . . . . . . . . . . . . . . . . . . . . . . . . . . . . . . . . . . . 76 —
745 202
Included in other liabilities is an interest-free advance of $65 million repayable in equal monthly installments of $2 million with a finalpayment on June 30, 2017.
NOTE 14. LOANS AND BORROWINGS
a) Current loans and borrowings
As at January 31, 2015 and February 1, 2014, current loans and borrowings are comprised of:
(millions of Canadian dollars) 2014 2013
HBC Revolving Credit Facility . . . . . . . . . . . . . . . . . . . . . . . . . . . . . . . . . . . . . . . . . . . . . . . . . . . . . . . 159 88U.S. Revolving Credit Facility . . . . . . . . . . . . . . . . . . . . . . . . . . . . . . . . . . . . . . . . . . . . . . . . . . . . . . . 108 418Current portion of long-term loans and borrowings . . . . . . . . . . . . . . . . . . . . . . . . . . . . . . . . . . . . . . . . . . 23 54
290 560Less: unamortized costs . . . . . . . . . . . . . . . . . . . . . . . . . . . . . . . . . . . . . . . . . . . . . . . . . . . . . . . . . . . (25) (28)
265 532
HBC Revolving Credit Facility
HBC is the borrower on an asset based credit facility (the ‘‘HBC Revolving Credit Facility’’) with Bank of America, N.A. as theadministrative agent and collateral agent, made available through a credit agreement (the ‘‘Credit Agreement’’).
On December 17, 2014, the Company executed an amendment to the HBC Revolving Credit Facility to extend the maturity date fromJune 15, 2017 to December 17, 2019 and reduce the credit facility from $750 million to $600 million.
The HBC Revolving Credit Facility is subject to a borrowing base, based predominantly on eligible inventory and eligible credit cardreceivables of HBC, excluding L&T Acquisition and its subsidiaries. The HBC Revolving Credit Facility is available for generalcorporate purposes and can be drawn in both U.S. and Canadian dollars. The HBC Revolving Credit Facility has multiple interest ratecharge options that are based on the Canadian prime rate, the Canadian Dealer Offered Rate (‘‘CDOR’’), U.S. index rate and theLondon Interbank Offered Rate (‘‘LIBOR’’).
As the HBC Revolving Credit Facility is available for and used to finance working capital requirements, capital expenditures and othergeneral corporate purposes, it has been classified in the consolidated balance sheets as part of current loans and borrowings. However,the Company is not required to repay the balance outstanding as at January 31, 2015, until the maturity date of December 17, 2019.
The HBC Revolving Credit Facility is secured by a first priority security interest over all inventory and accounts receivable in Canada.The Credit Agreement contains a number of representations and warranties and positive and negative covenants. These provisionsinclude, among other things, placing certain conditions and restrictions on making dividend payments and financial maintenancecovenants. The Credit Agreement also contains extensive reporting requirements and a number of events of default.
HBC was in compliance with all covenants contained in the Credit Agreement as at January 31, 2015 and February 1, 2014.
F-27

HUDSON’S BAY COMPANY
NOTES TO CONSOLIDATED FINANCIAL STATEMENTS (Continued)
NOTE 14. LOANS AND BORROWINGS (Continued)
The effective interest rate based on the average balance drawn and finance costs of the HBC Revolving Credit Facility for fiscal 2014and 2013 was as follows:
(millions of Canadian dollars) 2014 2013
Average balance drawn, calculated on a daily basis . . . . . . . . . . . . . . . . . . . . . . . . . . . . . . . . . . . . . . . . . . 53 162Finance costs . . . . . . . . . . . . . . . . . . . . . . . . . . . . . . . . . . . . . . . . . . . . . . . . . . . . . . . . . . . . . . . . . . 8 11Effective interest rate . . . . . . . . . . . . . . . . . . . . . . . . . . . . . . . . . . . . . . . . . . . . . . . . . . . . . . . . . . . . 15.1% 6.6%
As at January 31, 2015 and February 1, 2014, details of the borrowing base availability on the HBC Revolving Credit Facility wereas follows:
(millions of Canadian dollars) 2014 2013
Gross borrowing base availability . . . . . . . . . . . . . . . . . . . . . . . . . . . . . . . . . . . . . . . . . . . . . . . . . . . . . 457 479Drawings . . . . . . . . . . . . . . . . . . . . . . . . . . . . . . . . . . . . . . . . . . . . . . . . . . . . . . . . . . . . . . . . . . . . (159) (88)Outstanding letters of credit . . . . . . . . . . . . . . . . . . . . . . . . . . . . . . . . . . . . . . . . . . . . . . . . . . . . . . . . (9) (9)
Borrowing base availability net of drawings and letters of credit . . . . . . . . . . . . . . . . . . . . . . . . . . . . . . . . . . 289 382
U.S. Revolving Credit Facility
In connection with the Acquisition, the L&T and Saks revolving credit facilities were refinanced through a new U.S. revolving creditfacility. L&T Acquisition is the borrower pursuant to an asset based credit facility (‘‘U.S. Revolving Credit Facility’’) with Bank ofAmerica, N.A. as the administrative agent and collateral agent, dated November 4, 2013.
The U.S. Revolving Credit Facility originally provided a U.S.$950 million revolving line of credit through November 4, 2018. OnDecember 11, 2014, the Company executed an amendment to the U.S. Revolving Credit Facility to increase the credit facility toU.S.$1,100 million. This revolving line of credit is subject to a borrowing base, based predominantly on eligible inventory and accountsreceivable of L&T, Saks and their respective subsidiaries. The U.S. Revolving Credit Facility is available to finance working capitalneeds, capital expenditures, operating activities and to support the issuance of standby letters of credit. The U.S. Revolving CreditFacility has multiple interest rate charge options that are based on the U.S. prime rate, Federal Funds rate and LIBOR.
As the U.S. Revolving Credit Facility is available for and used to finance working capital requirements, capital expenditures and otheroperating activities, it has been classified in the consolidated balance sheets as part of current loans and borrowings. However, theCompany is not required to repay the balance outstanding as at January 31, 2015 until the maturity date of November 4, 2018.
The U.S. Revolving Credit Facility agreement contains restrictive covenants including restrictions on the incurrence of indebtedness,financial maintenance covenants, and restrictions on payments to affiliates and shareholders and also includes events of default,representations and warranties.
The U.S. Revolving Credit Facility is secured by a first lien security interest over all inventory and accounts receivables in theUnited States (L&T and Saks).
The effective interest rate based on the average balance drawn and finance costs of the U.S. Revolving Credit Facility for fiscal 2014 and2013 was as follows:
(millions of Canadian dollars) 2014 2013
Average balance drawn, calculated on a daily basis . . . . . . . . . . . . . . . . . . . . . . . . . . . . . . . . . . . . . . . . . . 389 362Finance costs . . . . . . . . . . . . . . . . . . . . . . . . . . . . . . . . . . . . . . . . . . . . . . . . . . . . . . . . . . . . . . . . . . 14 3Effective interest rate . . . . . . . . . . . . . . . . . . . . . . . . . . . . . . . . . . . . . . . . . . . . . . . . . . . . . . . . . . . . 3.6% 3.6%
F-28

HUDSON’S BAY COMPANY
NOTES TO CONSOLIDATED FINANCIAL STATEMENTS (Continued)
NOTE 14. LOANS AND BORROWINGS (Continued)
As at January 31, 2015 and February 1, 2014, details of the borrowing base availability on the U.S. Revolving Credit Facility wereas follows:
(millions of Canadian dollars) 2014 2013
Gross borrowing base availability . . . . . . . . . . . . . . . . . . . . . . . . . . . . . . . . . . . . . . . . . . . . . . . . . . . . 1,348 1,058Drawings . . . . . . . . . . . . . . . . . . . . . . . . . . . . . . . . . . . . . . . . . . . . . . . . . . . . . . . . . . . . . . . . . . . (108) (418)Outstanding letters of credit . . . . . . . . . . . . . . . . . . . . . . . . . . . . . . . . . . . . . . . . . . . . . . . . . . . . . . . (19) (9)
Borrowing base availability net of drawings and letters of credit . . . . . . . . . . . . . . . . . . . . . . . . . . . . . . . . . 1,221 631
The U.S. Revolving Credit Facility contains certain non-financial operating covenants. L&T Acquisition was in compliance with allcovenants as at January 31, 2015 and February 1, 2014.
In accordance with the U.S. Revolving Credit Facility, L&T Acquisition is limited in its ability to make distributions of earnings orreturns of capital to its parent.
In connection with the refinancing of the L&T revolving credit facility on November 4, 2013, $2 million of deferred financing costs werewritten off.
b) Long-term loans and borrowings
As at January 31, 2015 and February 1, 2014, long-term loans and borrowings are comprised of:
(millions of Canadian dollars) 2014 2013
Senior Term Loan B . . . . . . . . . . . . . . . . . . . . . . . . . . . . . . . . . . . . . . . . . . . . . . . . . . . . . . . . . . . . 826 2,228Junior Term Loan . . . . . . . . . . . . . . . . . . . . . . . . . . . . . . . . . . . . . . . . . . . . . . . . . . . . . . . . . . . . . . — 334Yorkdale Mortgage . . . . . . . . . . . . . . . . . . . . . . . . . . . . . . . . . . . . . . . . . . . . . . . . . . . . . . . . . . . . . 48 49Lord & Taylor Mortgage . . . . . . . . . . . . . . . . . . . . . . . . . . . . . . . . . . . . . . . . . . . . . . . . . . . . . . . . . . 318 279Saks Mortgage . . . . . . . . . . . . . . . . . . . . . . . . . . . . . . . . . . . . . . . . . . . . . . . . . . . . . . . . . . . . . . . . 1,599 —Other mortgage . . . . . . . . . . . . . . . . . . . . . . . . . . . . . . . . . . . . . . . . . . . . . . . . . . . . . . . . . . . . . . . — 10Real estate finance leases . . . . . . . . . . . . . . . . . . . . . . . . . . . . . . . . . . . . . . . . . . . . . . . . . . . . . . . . . 130 118Equipment finance leases and other . . . . . . . . . . . . . . . . . . . . . . . . . . . . . . . . . . . . . . . . . . . . . . . . . . 35 42
2,956 3,060Less: unamortized costs . . . . . . . . . . . . . . . . . . . . . . . . . . . . . . . . . . . . . . . . . . . . . . . . . . . . . . . . . . (74) (83)Less: amounts due within one year . . . . . . . . . . . . . . . . . . . . . . . . . . . . . . . . . . . . . . . . . . . . . . . . . . . (23) (54)
2,859 2,923
Maturities of long-term debt are as follows:
(millions of Canadian dollars)
Fiscal year:2015 . . . . . . . . . . . . . . . . . . . . . . . . . . . . . . . . . . . . . . . . . . . . . . . . . . . . . . . . . . . . . . . . . . . . . . 232016 . . . . . . . . . . . . . . . . . . . . . . . . . . . . . . . . . . . . . . . . . . . . . . . . . . . . . . . . . . . . . . . . . . . . . . 192017 . . . . . . . . . . . . . . . . . . . . . . . . . . . . . . . . . . . . . . . . . . . . . . . . . . . . . . . . . . . . . . . . . . . . . . 3182018 . . . . . . . . . . . . . . . . . . . . . . . . . . . . . . . . . . . . . . . . . . . . . . . . . . . . . . . . . . . . . . . . . . . . . . 32019 . . . . . . . . . . . . . . . . . . . . . . . . . . . . . . . . . . . . . . . . . . . . . . . . . . . . . . . . . . . . . . . . . . . . . . 3Thereafter . . . . . . . . . . . . . . . . . . . . . . . . . . . . . . . . . . . . . . . . . . . . . . . . . . . . . . . . . . . . . . . . . . . 2,590
2,956
Senior Term Loan B
On November 4, 2013, in connection with the closing of the Acquisition, the Company entered into an agreement for aU.S.$2,000 million senior secured term loan facility (‘‘Senior Term Loan B’’) with Bank of America, N.A. as the administrative agent.
F-29

HUDSON’S BAY COMPANY
NOTES TO CONSOLIDATED FINANCIAL STATEMENTS (Continued)
NOTE 14. LOANS AND BORROWINGS (Continued)
Senior Term Loan B matures November 4, 2020 and carries an interest rate of LIBOR plus 3.75% per annum. The agreement isstructured such that LIBOR will be deemed to be not less than 1% per annum (‘‘LIBOR Floor’’). Senior Term Loan B is subject tomandatory prepayments. The term loan is secured by a second lien over all inventory and accounts receivables, a first lien oversubstantially all other assets as well as a pledge of the shares of certain of the Company’s subsidiaries.
A portion of the proceeds from Senior Term Loan B were used to repay in full the HBC Term Loan and the Lord & Taylor GE CapitalTerm Loan, while the remainder was used in financing the Acquisition. In connection with the repayment of the HBC Term Loan andLord & Taylor GE Capital Term Loan, $1 million and $4 million of deferred financing costs were written off, respectively.
On February 25, 2014, HBC repaid U.S. $150 million of Senior Term Loan B (note 28). In connection with the repayment, $5 million ofdeferred financing costs were written off and $1 million of penalties and fees for early repayment were incurred (note 6).
On December 3, 2014, HBC repaid U.S. $1,200 million of Senior Term Loan B using proceeds from the Saks Mortgage. In connectionwith the repayment, $34 million of deferred financing costs were written off (note 6).
Junior Term Loan
Concurrently with the close of Senior Term Loan B, the Company obtained an incremental junior secured term facility ofU.S.$300 million (the ‘‘Junior Term Loan’’). The Junior Term Loan was scheduled to mature on November 4, 2021 and had an initialinterest rate of LIBOR (with a LIBOR Floor) plus 7.25% per annum. The remaining credit terms of the Junior Term Loan weresubstantially consistent with Senior Term Loan B with the exception that the Junior Term Loan was not subject to Senior Term Loan B’spreviously required quarterly principal repayments.
The Junior Term Loan was secured by a third lien over all of the Company’s inventory and accounts receivable, a second lien oversubstantially all other assets as well as a pledge of the shares of certain of the Company’s subsidiaries. Proceeds from the Junior TermLoan were used to finance the Acquisition.
On February 25, 2014, HBC repaid the Junior Term Loan in full (note 28). In connection with the repayment of the Junior Term Loan,$13 million of deferred financing costs were written off and $11 million of penalties and fees for early repayment were incurred (note 6).
Yorkdale Mortgage
On May 22, 2013 the Company entered into an agreement with Murray & Company Holdings Limited for a $50 million mortgage(the ‘‘Yorkdale Mortgage’’). The Yorkdale Mortgage matures on May 22, 2023, bears interest at 4.89% per annum over a twenty-fiveyear amortization schedule and is secured by a first mortgage of a leasehold interest of the Hudson’s Bay store at the YorkdaleShopping Centre in Toronto, Ontario. The proceeds of the Yorkdale Mortgage were used to partially prepay the HBC Term Loan. OnDecember 1, 2014, Murray & Company Holdings Limited assigned the mortgage to GMI Servicing Inc.
Lord & Taylor Mortgage
On September 7, 2012, LT 424 LLC (‘‘LT 424’’), which is an indirect subsidiary of L&T, entered into a U.S.$250 million syndicatedfloating rate senior mortgage loan with an affiliate of CIBC World Markets Inc. as the administrative agent of the syndicate of lenders,which matures on September 10, 2017 (the ‘‘Lord & Taylor Mortgage’’).
The Lord & Taylor Mortgage is guaranteed by L&T. Interest is charged at a rate of LIBOR plus 3% and is structured to be interest onlyduring the first 3 years, with monthly amortization payments required during the final 2 years, based on a thirty year amortizationschedule at an interest rate of 7%. LT 424 has the ability to prepay the Lord & Taylor Mortgage after the first 2 years with a fee to thelenders of 2%, which decreases to 1% after 3 years, and without fees after September 10, 2016. Any prepayments are applied to reducethe then remaining scheduled installments. As security for the Lord & Taylor Mortgage, LT 424 granted a first priority mortgage on theFifth Avenue Lord & Taylor property.
The Lord & Taylor Mortgage contains representations and warranties, positive and negative covenants, reporting requirements andevents of default. As at January 31, 2015 and February 1, 2014, the Company was in compliance with the covenants contained in theLord & Taylor Mortgage.
On November 26, 2012, LT 424 entered into interest rate swap arrangements, the effect of which is to fix the floating portion of theinterest rate related to the Lord & Taylor Mortgage at 0.85%. The swap arrangements are being accounted for as a cash flow hedge(note 18).
F-30

HUDSON’S BAY COMPANY
NOTES TO CONSOLIDATED FINANCIAL STATEMENTS (Continued)
NOTE 14. LOANS AND BORROWINGS (Continued)
Saks Mortgage
On December 3, 2014, Saks Flagship Real Property LLC (‘‘Saks Flagship’’), an indirect subsidiary of Saks, obtained aU.S.$1,250 million, twenty year mortgage on the ground portion of its Saks Fifth Avenue flagship store in New York City, located at611 Fifth Avenue (the ‘‘Saks Mortgage’’) with Bank of America, N.A. as the administrative agent.
The Saks Mortgage matures December 3, 2034, carries a fixed interest rate of 4.39% and requires interest only payments. The mortgageis secured by a first mortgage lien on the fee interest in the property, together with all ground lease rents, profits and revenue.
Net of associated fees and expenses, all proceeds from the Saks Mortgage were utilized to permanently pay down U.S.$1,200 million ofSenior Term Loan B.
The Saks Mortgage contains representations and warranties, positive and negative covenants, reporting requirements and events ofdefault. As at January 31, 2015, the Company was in compliance with the covenants contained in the Saks Mortgage.
HBC Term Loan (Canadian properties)
Concurrently with the closing of the IPO on November 26, 2012, the Company entered into an agreement with BMO Capital Marketsand Canadian Imperial Bank of Commerce, as co-lead arrangers and joint bookrunners, and certain other lenders for a $250 millionsenior non-revolving term loan facility (the ‘‘HBC Term Loan’’).
The HBC Term Loan was paid in full on November 4, 2013, using a portion of the proceeds from Senior Term Loan B.
The HBC Term Loan had a maturity date of November 26, 2014, bore interest at the bankers’ acceptance rate plus 2.25% stamping feeand was secured by a first priority security interest in certain of the real property of the Company and its subsidiaries (other than L&Tand its subsidiaries). There were certain mandatory repayments in specified circumstances.
The HBC Term Loan contained representations and warranties, positive and negative covenants, reporting requirements and a numberof events of default. The agreement contained covenants to maintain fixed charge coverage and leverage ratios.
Lord & Taylor GE Capital Term Loan
As part of the Lord & Taylor credit facility agreement with General Electric Capital Corporation executed on May 23, 2013, theCompany obtained a U.S.$200 million term loan (‘‘Lord & Taylor GE Capital Term Loan’’). Together with cash on hand, the proceedsof the Lord & Taylor GE Capital Term Loan repaid the Lord & Taylor term loan (lender was Credit Suisse Securities LLC) in full. Inconnection with the repayment of the Lord & Taylor term loan, $6 million of deferred financing costs were written off and are includedin finance costs (note 6).
The Lord & Taylor GE Capital Term Loan was repaid in full on November 4, 2013 using a portion of the proceeds of Senior TermLoan B.
Other mortgage
As at February 1, 2014, HBC had a mortgage outstanding with a principal balance of $10 million, which required annual payments of$3 million, including interest, and a final balloon payment of $10 million in February 2014. On February 3, 2014, the mortgage wasrepaid in full. The interest on the mortgage was 7.0% per annum, paid on a monthly basis.
Finance leases
As at January 31, 2015, the liability related to real estate finance leases was $130 million (February 1, 2014: $118 million). The liabilityincludes $93 million (February 1, 2014: $79 million) primarily related to presumed lease renewals that the Company is not contractuallycommitted to.
As at January 31, 2015, the liability related to equipment finance leases was $25 million (February 1, 2014: $32 million).
F-31

HUDSON’S BAY COMPANY
NOTES TO CONSOLIDATED FINANCIAL STATEMENTS (Continued)
NOTE 14. LOANS AND BORROWINGS (Continued)
The future required minimum gross rental payments under finance leases for property and equipment, and their net present values as atJanuary 31, 2015 are as follows:
(millions of Canadian dollars)
Less than 1 year . . . . . . . . . . . . . . . . . . . . . . . . . . . . . . . . . . . . . . . . . . . . . . . . . . . . . . . . . . . . . . . . . . . . 30Between 1 and 5 years . . . . . . . . . . . . . . . . . . . . . . . . . . . . . . . . . . . . . . . . . . . . . . . . . . . . . . . . . . . . . . . . 55Thereafter . . . . . . . . . . . . . . . . . . . . . . . . . . . . . . . . . . . . . . . . . . . . . . . . . . . . . . . . . . . . . . . . . . . . . . . 437
Total minimum lease payments . . . . . . . . . . . . . . . . . . . . . . . . . . . . . . . . . . . . . . . . . . . . . . . . . . . . . . . . . . . 522Less: imputed interest . . . . . . . . . . . . . . . . . . . . . . . . . . . . . . . . . . . . . . . . . . . . . . . . . . . . . . . . . . . . . . . . (367)
Total finance lease obligations . . . . . . . . . . . . . . . . . . . . . . . . . . . . . . . . . . . . . . . . . . . . . . . . . . . . . . . . . . . 155
NOTE 15. PROVISIONS
Year ended January 31, 2015
Severance, StoreSelf Restructuring Closing
(millions of Canadian dollars) Insurance & HR Legal ARO’s Costs Other Total
Balance at beginning of year . . . . . . . . . . . . . . . . . . . . . . 62 64 16 18 5 165Additional provisions recognized . . . . . . . . . . . . . . . . . . . . 39 48 1 1 3 92Utilized . . . . . . . . . . . . . . . . . . . . . . . . . . . . . . . . . . . (39) (80) — (17) (3) (139)Released . . . . . . . . . . . . . . . . . . . . . . . . . . . . . . . . . . . — (22) — (2) (3) (27)Transfer from liabilities of discontinued operations . . . . . . . . — 75 — — 3 78Net foreign currency exchange . . . . . . . . . . . . . . . . . . . . . 6 1 2 — — 9
Balance at end of year . . . . . . . . . . . . . . . . . . . . . . . . . . 68 86 19 — 5 178
Non-current . . . . . . . . . . . . . . . . . . . . . . . . . . . . . . . . . — 44 19 — — 63Current . . . . . . . . . . . . . . . . . . . . . . . . . . . . . . . . . . . 68 42 — — 5 115
68 86 19 — 5 178
Year ended February 1, 2014
Severance, StoreSelf Restructuring Closing
(millions of Canadian dollars) Insurance & HR Legal ARO’s Costs Other Total
Balance at beginning of year . . . . . . . . . . . . . . . . . . . . . . 34 51 14 — — 99Additional provisions recognized . . . . . . . . . . . . . . . . . . . . 30 53 1 1 — 85Assumed through business combination . . . . . . . . . . . . . . . 26 4 — 16 5 51Utilized . . . . . . . . . . . . . . . . . . . . . . . . . . . . . . . . . . . (31) (41) — — — (72)Released . . . . . . . . . . . . . . . . . . . . . . . . . . . . . . . . . . . — (5) — — — (5)Net foreign currency exchange . . . . . . . . . . . . . . . . . . . . . 3 2 1 1 — 7
Balance at end of year . . . . . . . . . . . . . . . . . . . . . . . . . . 62 64 16 18 5 165
Non-current . . . . . . . . . . . . . . . . . . . . . . . . . . . . . . . . . — — 16 — — 16Current . . . . . . . . . . . . . . . . . . . . . . . . . . . . . . . . . . . 62 64 — 18 5 149
62 64 16 18 5 165
Self insurance
The Company purchases third party insurance for automobile, workers’ compensation (U.S. only), medical (U.S. only) and generalliability claims that exceed a certain dollar level. The Company is responsible for the payment of claims under these insured limits. Theself-insurance provision is based on claims filed and an estimate of claims incurred but not yet reported. Insurance claims are settled ona case by case basis over a period which can exceed 7 years. The amounts that the Company will ultimately disburse could differmaterially from the accrued amounts.
F-32

HUDSON’S BAY COMPANY
NOTES TO CONSOLIDATED FINANCIAL STATEMENTS (Continued)
NOTE 15. PROVISIONS (Continued)
Severance, Restructuring & HR Legal
Severance and restructuring relates to Company initiatives to lower operating costs and improve profitability. The initiatives areassociated with the closure of the discount store business and evaluation of stores with sub-optimal performance. Restructuring chargesin prior years relating directly to the closure of Zellers stores were reported within discontinued operations. In fiscal 2014, the Companytransferred the liability previously reported in discontinued operations to continuing operations.
During fiscal 2014, these initiatives included additional provisions related to Home Outfitters stores of $14 million (2013: nil).Severance charges of $26 million (2013: $13 million) were incurred for changes to senior leadership, management teams and othersupporting employees as the Company continued to streamline its organizational and management structures as a result of theintegration of its department store operations and the wind-down of Zellers. Severance charges of $2 million (2013: nil) were incurredrelated to store closures. During fiscal 2013, the Company incurred $29 million of severance and related expenses in connection with theAcquisition, $4 million related to the relocation of the information technology support function and $5 million related to realignment ofthe logistics network related to the consolidation of excess capacity at certain locations. As at January 31, 2015, $75 million (February 1,2014: $58 million) remains accrued.
The Human Resources (‘‘HR’’) legal component of the provision relates to compensation claims made by current and formeremployees. During fiscal 2014, the Company recorded a charge of $6 million (2013: $2 million). Compensation claims are settled on acase by case basis over an indeterminate period. The balance of the provision remaining as at January 31, 2015 was $11 million(February 1, 2014: $6 million).
Asset retirement obligations (‘‘ARO’s’’)
The Company has certain operating leases that require it to remove leasehold improvements and replace or remove other structures atthe end of the lease term. The Company also has obligations to dispose of potentially hazardous materials (principally, asbestos) inaccordance with relevant legislation. The estimate is based on the date of expiry of the lease or, where relevant, the mandatory timelinesof relevant legislation.
Store closing costs
The Company continuously evaluates its real estate portfolio and closes underproductive stores in the normal course of business asleases expire or as other circumstances dictate. Store closing costs include lease termination fees, asset disposals and other closureactivities.
NOTE 16. OPERATING LEASE ARRANGEMENTS
The Company conducts a substantial part of its operations from leased stores in shopping and power centres, and also leases warehousefacilities, administrative facilities and equipment.
Many of the Company’s store leases require equal monthly rent payments over the lease term. However, numerous store leaseagreements include rent holidays, rent escalation clauses and/or contingent rent provisions that require additional payments based on apercentage of sales in excess of specified levels. Rent for renewal periods of the Company’s leases varies.
Rental expense related to operating leases charged to earnings in fiscal 2014 was $276 million (2013: $162 million).
Minimum payments under non-cancelable operating leases
The future minimum payments under non-cancelable operating leases are as follows:
(millions of Canadian dollars)
Fiscal year:2015 . . . . . . . . . . . . . . . . . . . . . . . . . . . . . . . . . . . . . . . . . . . . . . . . . . . . . . . . . . . . . . . . . . . . . . . . . . . 1432016 . . . . . . . . . . . . . . . . . . . . . . . . . . . . . . . . . . . . . . . . . . . . . . . . . . . . . . . . . . . . . . . . . . . . . . . . . . . 1332017 . . . . . . . . . . . . . . . . . . . . . . . . . . . . . . . . . . . . . . . . . . . . . . . . . . . . . . . . . . . . . . . . . . . . . . . . . . . 1232018 . . . . . . . . . . . . . . . . . . . . . . . . . . . . . . . . . . . . . . . . . . . . . . . . . . . . . . . . . . . . . . . . . . . . . . . . . . . 1102019 . . . . . . . . . . . . . . . . . . . . . . . . . . . . . . . . . . . . . . . . . . . . . . . . . . . . . . . . . . . . . . . . . . . . . . . . . . . 99Thereafter . . . . . . . . . . . . . . . . . . . . . . . . . . . . . . . . . . . . . . . . . . . . . . . . . . . . . . . . . . . . . . . . . . . . . . . 1,064
Total minimum lease payments . . . . . . . . . . . . . . . . . . . . . . . . . . . . . . . . . . . . . . . . . . . . . . . . . . . . . . . . . . 1,672
F-33

HUDSON’S BAY COMPANY
NOTES TO CONSOLIDATED FINANCIAL STATEMENTS (Continued)
NOTE 16. OPERATING LEASE ARRANGEMENTS (Continued)
Of the total minimum lease payments, $19 million relates to Zellers leases that were not assigned to Target Corporation (‘‘Target’’)(note 29). For those leases which have been assigned to Target and for which the Company remains the lessee on the master leaseagreement, HBC has guaranteed the commitment over the remaining term of the lease (note 25).
NOTE 17. PENSIONS AND EMPLOYEE BENEFITS
Aggregate information about the Company’s Canadian (‘‘CDN’’) and U.S. pension and benefit plans are presented below. TheU.S. pension plans are sponsored by Saks for which there are no future benefit accruals for all remaining participants. Both L&T andSaks sponsor defined contribution plans (401(k) retirement savings plans) which are discussed in the Defined Contribution PensionPlans section below.
Amounts Recognized in Consolidated Balance Sheets
2014 2013
CDN CDN U.S. CDN CDN U.S.Pension Benefit Pension Pension Benefit Pension
(millions of Canadian dollars) Plans Plans Plans Plans Plans Plans
Funded status . . . . . . . . . . . . . . . . . . . . . . . . . . . . . . . . . . 69 (36) (46) 72 (35) (31)Less: current portion . . . . . . . . . . . . . . . . . . . . . . . . . . . . . — 3 1 — 3 2
69 (33) (45) 72 (32) (29)Other long-term employee benefits liability . . . . . . . . . . . . . . . — (31) — — (35) —
Pension and employee benefits asset (liability) . . . . . . . . . . . . . 69 (64) (45) 72 (67) (29)
The current portion of the pension and employee benefits liability is included in other payables and accrued liabilities in theconsolidated balance sheets.
Employer contributions to defined benefit pension plans in fiscal 2015 will approximate $1 million.
Changes in the Fair Value of Plan Assets
2014 2013
CDN CDN U.S. CDN CDN U.S.Pension Benefit Pension Pension Benefit Pension
(millions of Canadian dollars) Plans(1) Plans Plans Plans(1) Plans Plans
Fair value at beginning of year . . . . . . . . . . . . . . . . . . . . . . . 1,213 — 135 1,240 — —Acquired through business combination . . . . . . . . . . . . . . . . . — — — — — 129Return on plan assets (excluding interest) . . . . . . . . . . . . . . . . 65 — 8 68 — 1Interest income . . . . . . . . . . . . . . . . . . . . . . . . . . . . . . . . . 103 — 4 85 — 1Employer contributions . . . . . . . . . . . . . . . . . . . . . . . . . . . . 1 3 — — 4 —Employee contributions . . . . . . . . . . . . . . . . . . . . . . . . . . . 10 — — 11 — —Administration costs . . . . . . . . . . . . . . . . . . . . . . . . . . . . . (3) — (2) (3) — (1)Benefits paid . . . . . . . . . . . . . . . . . . . . . . . . . . . . . . . . . . (125) (3) (14) (188) (4) (4)Net foreign currency exchange . . . . . . . . . . . . . . . . . . . . . . . — — 20 — — 9
Fair value at end of year . . . . . . . . . . . . . . . . . . . . . . . . . . . 1,264 — 151 1,213 — 135
(1) Includes defined contribution plan assets of $527 million (February 1, 2014: $512 million).
F-34
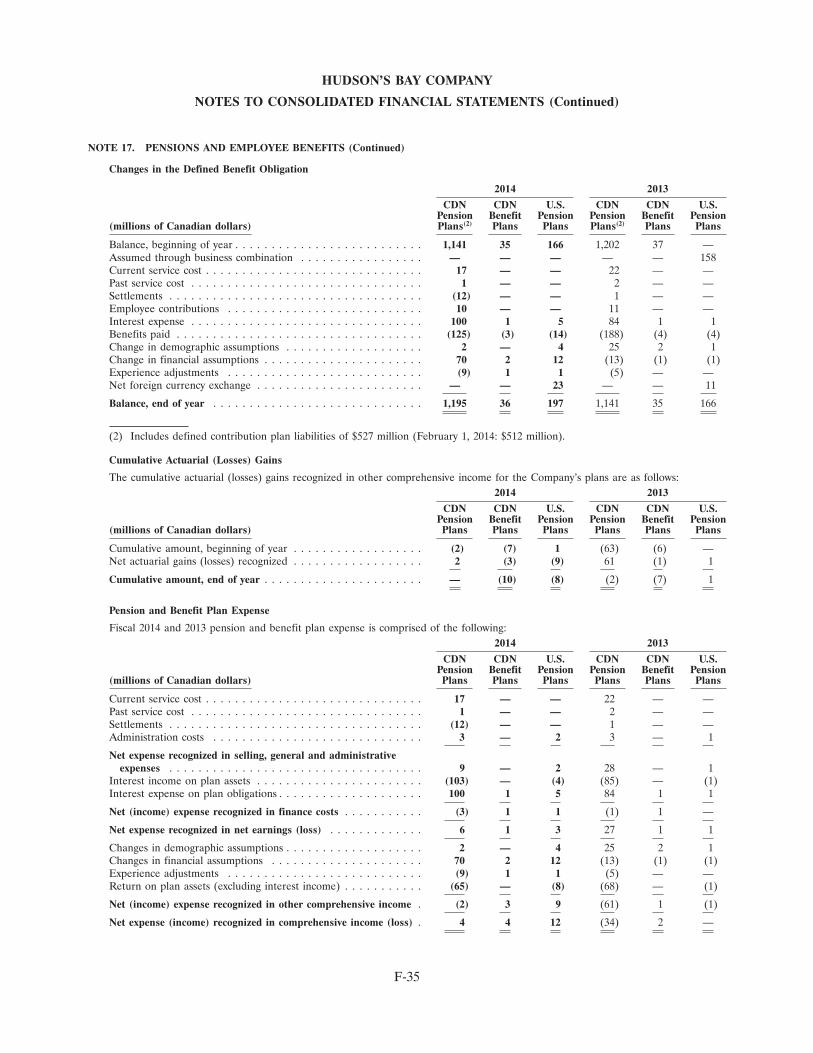
HUDSON’S BAY COMPANY
NOTES TO CONSOLIDATED FINANCIAL STATEMENTS (Continued)
NOTE 17. PENSIONS AND EMPLOYEE BENEFITS (Continued)
Changes in the Defined Benefit Obligation
2014 2013
CDN CDN U.S. CDN CDN U.S.Pension Benefit Pension Pension Benefit Pension
(millions of Canadian dollars) Plans(2) Plans Plans Plans(2) Plans Plans
Balance, beginning of year . . . . . . . . . . . . . . . . . . . . . . . . . . 1,141 35 166 1,202 37 —Assumed through business combination . . . . . . . . . . . . . . . . . — — — — — 158Current service cost . . . . . . . . . . . . . . . . . . . . . . . . . . . . . . 17 — — 22 — —Past service cost . . . . . . . . . . . . . . . . . . . . . . . . . . . . . . . . 1 — — 2 — —Settlements . . . . . . . . . . . . . . . . . . . . . . . . . . . . . . . . . . . (12) — — 1 — —Employee contributions . . . . . . . . . . . . . . . . . . . . . . . . . . . 10 — — 11 — —Interest expense . . . . . . . . . . . . . . . . . . . . . . . . . . . . . . . . 100 1 5 84 1 1Benefits paid . . . . . . . . . . . . . . . . . . . . . . . . . . . . . . . . . . (125) (3) (14) (188) (4) (4)Change in demographic assumptions . . . . . . . . . . . . . . . . . . . 2 — 4 25 2 1Change in financial assumptions . . . . . . . . . . . . . . . . . . . . . . 70 2 12 (13) (1) (1)Experience adjustments . . . . . . . . . . . . . . . . . . . . . . . . . . . (9) 1 1 (5) — —Net foreign currency exchange . . . . . . . . . . . . . . . . . . . . . . . — — 23 — — 11
Balance, end of year . . . . . . . . . . . . . . . . . . . . . . . . . . . . . 1,195 36 197 1,141 35 166
(2) Includes defined contribution plan liabilities of $527 million (February 1, 2014: $512 million).
Cumulative Actuarial (Losses) Gains
The cumulative actuarial (losses) gains recognized in other comprehensive income for the Company’s plans are as follows:2014 2013
CDN CDN U.S. CDN CDN U.S.Pension Benefit Pension Pension Benefit Pension
(millions of Canadian dollars) Plans Plans Plans Plans Plans Plans
Cumulative amount, beginning of year . . . . . . . . . . . . . . . . . . (2) (7) 1 (63) (6) —Net actuarial gains (losses) recognized . . . . . . . . . . . . . . . . . . 2 (3) (9) 61 (1) 1
Cumulative amount, end of year . . . . . . . . . . . . . . . . . . . . . . — (10) (8) (2) (7) 1
Pension and Benefit Plan Expense
Fiscal 2014 and 2013 pension and benefit plan expense is comprised of the following:2014 2013
CDN CDN U.S. CDN CDN U.S.Pension Benefit Pension Pension Benefit Pension
(millions of Canadian dollars) Plans Plans Plans Plans Plans Plans
Current service cost . . . . . . . . . . . . . . . . . . . . . . . . . . . . . . 17 — — 22 — —Past service cost . . . . . . . . . . . . . . . . . . . . . . . . . . . . . . . . 1 — — 2 — —Settlements . . . . . . . . . . . . . . . . . . . . . . . . . . . . . . . . . . . (12) — — 1 — —Administration costs . . . . . . . . . . . . . . . . . . . . . . . . . . . . . 3 — 2 3 — 1
Net expense recognized in selling, general and administrativeexpenses . . . . . . . . . . . . . . . . . . . . . . . . . . . . . . . . . . . 9 — 2 28 — 1
Interest income on plan assets . . . . . . . . . . . . . . . . . . . . . . . (103) — (4) (85) — (1)Interest expense on plan obligations . . . . . . . . . . . . . . . . . . . . 100 1 5 84 1 1
Net (income) expense recognized in finance costs . . . . . . . . . . . (3) 1 1 (1) 1 —
Net expense recognized in net earnings (loss) . . . . . . . . . . . . . 6 1 3 27 1 1
Changes in demographic assumptions . . . . . . . . . . . . . . . . . . . 2 — 4 25 2 1Changes in financial assumptions . . . . . . . . . . . . . . . . . . . . . 70 2 12 (13) (1) (1)Experience adjustments . . . . . . . . . . . . . . . . . . . . . . . . . . . (9) 1 1 (5) — —Return on plan assets (excluding interest income) . . . . . . . . . . . (65) — (8) (68) — (1)
Net (income) expense recognized in other comprehensive income . (2) 3 9 (61) 1 (1)
Net expense (income) recognized in comprehensive income (loss) . 4 4 12 (34) 2 —
F-35

HUDSON’S BAY COMPANY
NOTES TO CONSOLIDATED FINANCIAL STATEMENTS (Continued)
NOTE 17. PENSIONS AND EMPLOYEE BENEFITS (Continued)
Defined Contribution Pension Plans
Included in CDN Pensions Plans’ current service cost above is a $12 million expense in fiscal 2014 (2013: $15 million, of which$9 million related to continuing operations) that represents contributions made in connection with the defined contribution plans.
In fiscal 2014, Saks and L&T contributed $10 million (2013: $4 million) to their U.S. defined contribution plans.
Other Long Term Employee Benefits
During fiscal 2014, the Company recognized a $6 million (2013: $6 million) expense in selling, general and administrative expensesrelated to its other long term employee benefits.
Actuarial Assumptions
HBC and its non-executive employees contribute in equal amounts to HBC’s defined contribution plans. The defined benefit plans arefunded by employee contributions, as a percentage of salary, and by HBC to support the actuarial based pension benefits. The definedbenefit plans provide benefits based on members’ earnings and service.
The Company’s pension and benefits obligation and expense are dependent on the assumptions used in calculating these amounts.These assumptions include discount rate, rate of compensation increase and overall Canadian health care cost trend rate.
2014 2013
CDN CDNCDN CDN Other U.S. CDN CDN Other U.S.
Pension Benefit Long Term Pension Pension Benefit Long Term PensionPlans Plans Benefits Plans Plans Plans Benefits Plans
Defined benefit obligations, end ofthe fiscal yearDiscount rate . . . . . . . . . . . . . . 3.40% 3.20% 2.75% 2.90% 4.40% 4.20% 3.60% 3.80%Rate of compensation increase . . . 3.00% N/A N/A N/A 3.00% N/A N/A N/A
Net benefit expense for the fiscal yearDiscount rate . . . . . . . . . . . . . . 4.40% 4.20% 3.60% 3.80% 4.25% 4.00% 3.50% 3.80%Rate of compensation increase . . . 3.00% N/A N/A N/A 3.25% N/A N/A N/A
Health care trend rate:Defined benefit obligations, end of
the fiscal yearImmediate . . . . . . . . . . . . . . . N/A 6.43% 6.43% N/A N/A 6.04% 6.04% N/AUltimate . . . . . . . . . . . . . . . . N/A 4.50% 4.50% N/A N/A 4.50% 4.50% N/A
Net benefit expense for the fiscalyearImmediate . . . . . . . . . . . . . . . N/A 6.04% 6.04% N/A N/A 6.14% 6.14% N/AUltimate . . . . . . . . . . . . . . . . N/A 4.50% 4.50% N/A N/A 4.50% 4.50% N/A
Life expectancy (years):Life expectancy from age 65
Male . . . . . . . . . . . . . . . . . . 86.5 86.5 N/A 85.9 86.1 86.1 N/A 83.8Female . . . . . . . . . . . . . . . . . 89.0 89.0 N/A 87.5 88.3 88.3 N/A 85.6
Defined Benefit Obligation by Participant Status
2014 2013
CDN CDNCDN CDN Other U.S. CDN CDN Other U.S.
Pension Benefit Long Term Pension Pension Benefit Long Term PensionPlans(3) Plans Benefits Plans Plans(3) Plans Benefits Plans
Active members . . . . . . . . . . . . . . 185 1 44 57 189 1 49 50Vested deferred members . . . . . . . . 59 — — 60 51 — — 55Retirees . . . . . . . . . . . . . . . . . . . 424 35 — 80 389 34 — 61
Total . . . . . . . . . . . . . . . . . . . . . 668 36 44 197 629 35 49 166
(3) Excludes plan liabilities of $527 million (February 1, 2014: $512 million) for defined contribution plan participants.
F-36
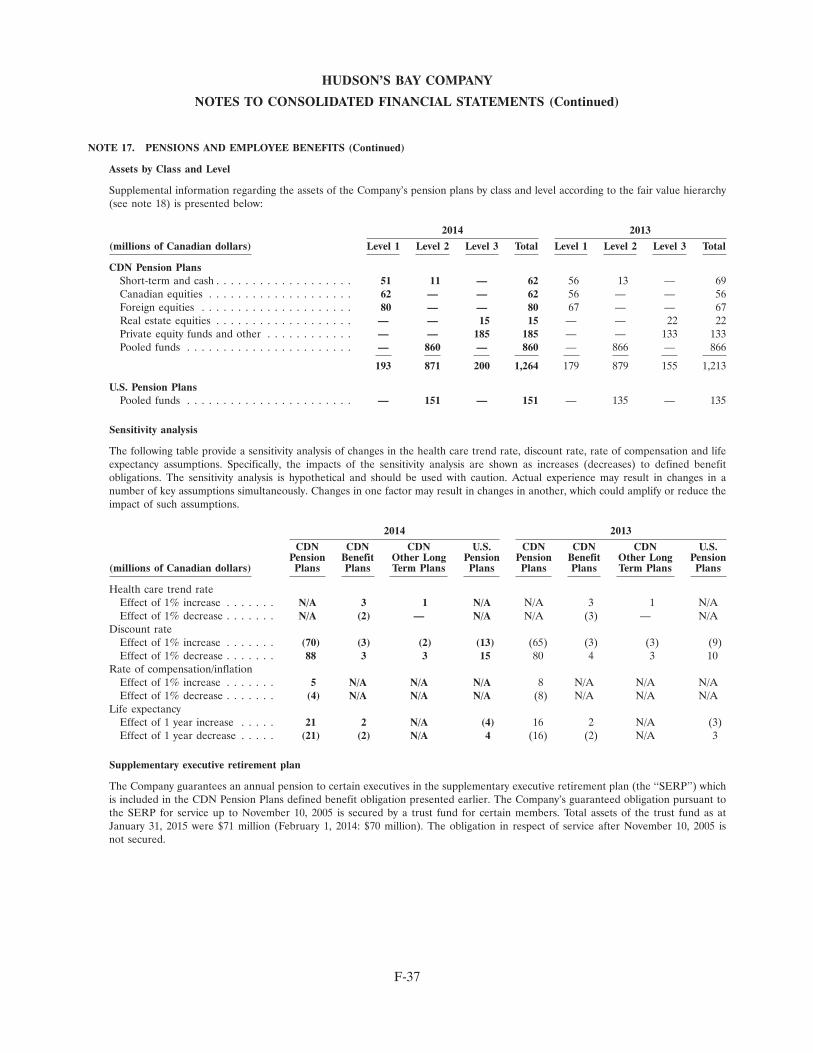
HUDSON’S BAY COMPANY
NOTES TO CONSOLIDATED FINANCIAL STATEMENTS (Continued)
NOTE 17. PENSIONS AND EMPLOYEE BENEFITS (Continued)
Assets by Class and Level
Supplemental information regarding the assets of the Company’s pension plans by class and level according to the fair value hierarchy(see note 18) is presented below:
2014 2013
(millions of Canadian dollars) Level 1 Level 2 Level 3 Total Level 1 Level 2 Level 3 Total
CDN Pension PlansShort-term and cash . . . . . . . . . . . . . . . . . . . 51 11 — 62 56 13 — 69Canadian equities . . . . . . . . . . . . . . . . . . . . 62 — — 62 56 — — 56Foreign equities . . . . . . . . . . . . . . . . . . . . . 80 — — 80 67 — — 67Real estate equities . . . . . . . . . . . . . . . . . . . — — 15 15 — — 22 22Private equity funds and other . . . . . . . . . . . . — — 185 185 — — 133 133Pooled funds . . . . . . . . . . . . . . . . . . . . . . . — 860 — 860 — 866 — 866
193 871 200 1,264 179 879 155 1,213
U.S. Pension PlansPooled funds . . . . . . . . . . . . . . . . . . . . . . . — 151 — 151 — 135 — 135
Sensitivity analysis
The following table provide a sensitivity analysis of changes in the health care trend rate, discount rate, rate of compensation and lifeexpectancy assumptions. Specifically, the impacts of the sensitivity analysis are shown as increases (decreases) to defined benefitobligations. The sensitivity analysis is hypothetical and should be used with caution. Actual experience may result in changes in anumber of key assumptions simultaneously. Changes in one factor may result in changes in another, which could amplify or reduce theimpact of such assumptions.
2014 2013
CDN CDN CDN U.S. CDN CDN CDN U.S.Pension Benefit Other Long Pension Pension Benefit Other Long Pension
(millions of Canadian dollars) Plans Plans Term Plans Plans Plans Plans Term Plans Plans
Health care trend rateEffect of 1% increase . . . . . . . N/A 3 1 N/A N/A 3 1 N/AEffect of 1% decrease . . . . . . . N/A (2) — N/A N/A (3) — N/A
Discount rateEffect of 1% increase . . . . . . . (70) (3) (2) (13) (65) (3) (3) (9)Effect of 1% decrease . . . . . . . 88 3 3 15 80 4 3 10
Rate of compensation/inflationEffect of 1% increase . . . . . . . 5 N/A N/A N/A 8 N/A N/A N/AEffect of 1% decrease . . . . . . . (4) N/A N/A N/A (8) N/A N/A N/A
Life expectancyEffect of 1 year increase . . . . . 21 2 N/A (4) 16 2 N/A (3)Effect of 1 year decrease . . . . . (21) (2) N/A 4 (16) (2) N/A 3
Supplementary executive retirement plan
The Company guarantees an annual pension to certain executives in the supplementary executive retirement plan (the ‘‘SERP’’) whichis included in the CDN Pension Plans defined benefit obligation presented earlier. The Company’s guaranteed obligation pursuant tothe SERP for service up to November 10, 2005 is secured by a trust fund for certain members. Total assets of the trust fund as atJanuary 31, 2015 were $71 million (February 1, 2014: $70 million). The obligation in respect of service after November 10, 2005 isnot secured.
F-37

HUDSON’S BAY COMPANY
NOTES TO CONSOLIDATED FINANCIAL STATEMENTS (Continued)
NOTE 18. FINANCIAL INSTRUMENTS
The following table provides a comparison of carrying and fair values of financial instruments as at January 31, 2015 andFebruary 1, 2014:
2014 2013
Carrying Fair Carrying Fair(millions of Canadian dollars) Value Value Value Value
Classified as fair value through profit or lossEmbedded foreign currency derivatives(1) . . . . . . . . . . . . . . . . . . . . . . . . . . . . (1) (1) (1) (1)Warrants(2) . . . . . . . . . . . . . . . . . . . . . . . . . . . . . . . . . . . . . . . . . . . . . . . (68) (68) (24) (24)
Classified as loans and receivablesCash . . . . . . . . . . . . . . . . . . . . . . . . . . . . . . . . . . . . . . . . . . . . . . . . . . . 153 153 19 19Restricted cash . . . . . . . . . . . . . . . . . . . . . . . . . . . . . . . . . . . . . . . . . . . . 15 15 2 2Trade and other receivables(5) . . . . . . . . . . . . . . . . . . . . . . . . . . . . . . . . . . . 212 212 139 139
Classified as held to maturityShort-term deposits(3) . . . . . . . . . . . . . . . . . . . . . . . . . . . . . . . . . . . . . . . . 2 2 2 2
Financial derivatives designated as cash flow hedgesForward foreign currency contracts(3) . . . . . . . . . . . . . . . . . . . . . . . . . . . . . . . 22 22 5 5Interest rate swaps(4) . . . . . . . . . . . . . . . . . . . . . . . . . . . . . . . . . . . . . . . . . (1) (1) 1 1
Classified as other liabilityTrade payables(5) . . . . . . . . . . . . . . . . . . . . . . . . . . . . . . . . . . . . . . . . . . . (945) (945) (589) (589)Other payables and accrued liabilities(5) . . . . . . . . . . . . . . . . . . . . . . . . . . . . . (345) (345) (228) (228)HBC Revolving Credit Facility . . . . . . . . . . . . . . . . . . . . . . . . . . . . . . . . . . . (159) (159) (88) (88)U.S. Revolving Credit Facility . . . . . . . . . . . . . . . . . . . . . . . . . . . . . . . . . . . (108) (108) (418) (418)Senior Term Loan B . . . . . . . . . . . . . . . . . . . . . . . . . . . . . . . . . . . . . . . . . (826) (830) (2,228) (2,258)Junior Term Loan . . . . . . . . . . . . . . . . . . . . . . . . . . . . . . . . . . . . . . . . . . . — — (334) (345)Yorkdale Mortgage . . . . . . . . . . . . . . . . . . . . . . . . . . . . . . . . . . . . . . . . . . (48) (48) (49) (49)Lord & Taylor Mortgage . . . . . . . . . . . . . . . . . . . . . . . . . . . . . . . . . . . . . . (318) (318) (279) (279)Saks Mortgage . . . . . . . . . . . . . . . . . . . . . . . . . . . . . . . . . . . . . . . . . . . . . (1,599) (1,599) — —Other mortgage . . . . . . . . . . . . . . . . . . . . . . . . . . . . . . . . . . . . . . . . . . . . — — (10) (10)Other liability(6) . . . . . . . . . . . . . . . . . . . . . . . . . . . . . . . . . . . . . . . . . . . . (65) (63) — —
(1) Included in financial liabilities — current
(2) Included in financial liabilities — non-current
(3) Included in financial assets — current
(4) Included in financial liabilities — current (2013: included in financial assets — current)
(5) Includes assets/liabilities of discontinued operations (note 29)
(6) See note 13
The fair value of the HBC Revolving Credit Facility, U.S. Revolving Credit Facility, Senior Term Loan B, Junior Term Loan, YorkdaleMortgage, Lord & Taylor Mortgage and Saks Mortgage are valued using a discounted cash flow model, taking into consideration thefixed interest rate spread included in the related debt compared to fixed interest rate spreads on similar debt available in the market atthe balance sheet dates.
The fair values of foreign currency options, interest rate swaps, forward foreign currency contracts, Equity Commitment Forwards andwarrants reflect the estimated amounts the Company would receive or pay if it were to settle the contracts at the reporting date, and aredetermined using valuation techniques based on observable market input data. The fair values of embedded foreign currency derivativesreflect the estimated amounts the Company would receive or pay to settle forward foreign exchange contracts with similar terms usingvaluation techniques using observable market input data.
F-38
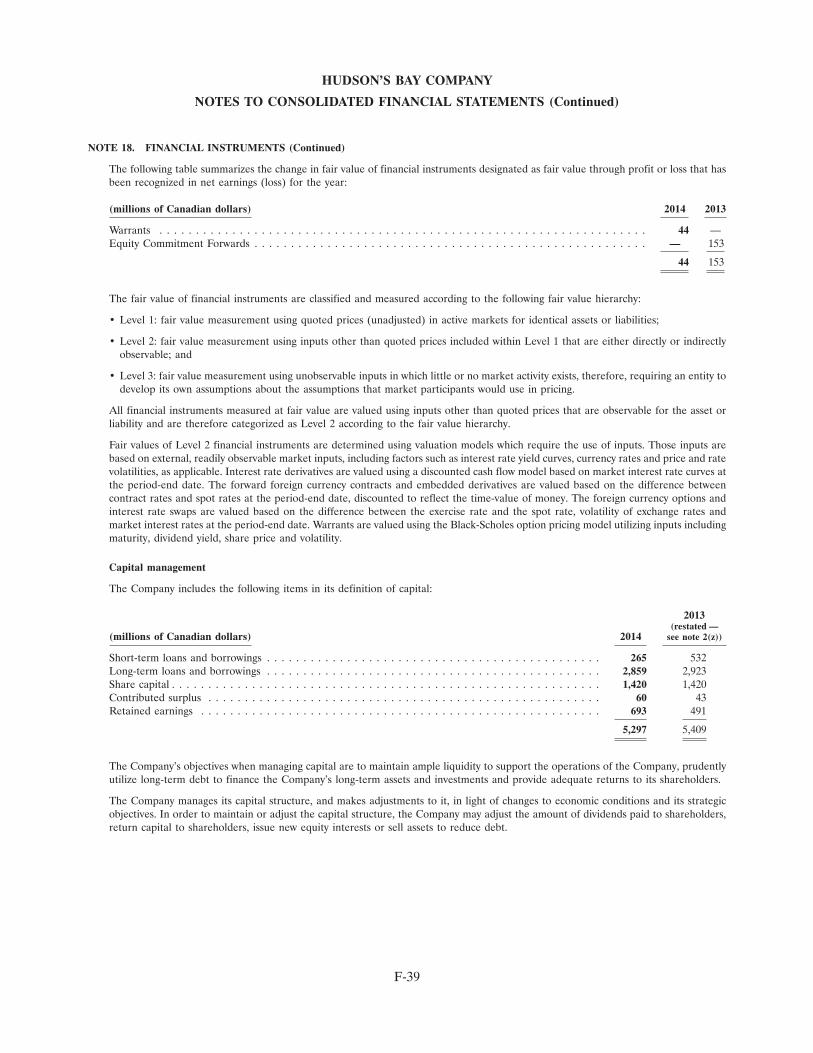
HUDSON’S BAY COMPANY
NOTES TO CONSOLIDATED FINANCIAL STATEMENTS (Continued)
NOTE 18. FINANCIAL INSTRUMENTS (Continued)
The following table summarizes the change in fair value of financial instruments designated as fair value through profit or loss that hasbeen recognized in net earnings (loss) for the year:
(millions of Canadian dollars) 2014 2013
Warrants . . . . . . . . . . . . . . . . . . . . . . . . . . . . . . . . . . . . . . . . . . . . . . . . . . . . . . . . . . . . . . . . . . . 44 —Equity Commitment Forwards . . . . . . . . . . . . . . . . . . . . . . . . . . . . . . . . . . . . . . . . . . . . . . . . . . . . . . — 153
44 153
The fair value of financial instruments are classified and measured according to the following fair value hierarchy:
• Level 1: fair value measurement using quoted prices (unadjusted) in active markets for identical assets or liabilities;
• Level 2: fair value measurement using inputs other than quoted prices included within Level 1 that are either directly or indirectlyobservable; and
• Level 3: fair value measurement using unobservable inputs in which little or no market activity exists, therefore, requiring an entity todevelop its own assumptions about the assumptions that market participants would use in pricing.
All financial instruments measured at fair value are valued using inputs other than quoted prices that are observable for the asset orliability and are therefore categorized as Level 2 according to the fair value hierarchy.
Fair values of Level 2 financial instruments are determined using valuation models which require the use of inputs. Those inputs arebased on external, readily observable market inputs, including factors such as interest rate yield curves, currency rates and price and ratevolatilities, as applicable. Interest rate derivatives are valued using a discounted cash flow model based on market interest rate curves atthe period-end date. The forward foreign currency contracts and embedded derivatives are valued based on the difference betweencontract rates and spot rates at the period-end date, discounted to reflect the time-value of money. The foreign currency options andinterest rate swaps are valued based on the difference between the exercise rate and the spot rate, volatility of exchange rates andmarket interest rates at the period-end date. Warrants are valued using the Black-Scholes option pricing model utilizing inputs includingmaturity, dividend yield, share price and volatility.
Capital management
The Company includes the following items in its definition of capital:
2013(restated —
(millions of Canadian dollars) 2014 see note 2(z))
Short-term loans and borrowings . . . . . . . . . . . . . . . . . . . . . . . . . . . . . . . . . . . . . . . . . . . . . . 265 532Long-term loans and borrowings . . . . . . . . . . . . . . . . . . . . . . . . . . . . . . . . . . . . . . . . . . . . . . 2,859 2,923Share capital . . . . . . . . . . . . . . . . . . . . . . . . . . . . . . . . . . . . . . . . . . . . . . . . . . . . . . . . . . . 1,420 1,420Contributed surplus . . . . . . . . . . . . . . . . . . . . . . . . . . . . . . . . . . . . . . . . . . . . . . . . . . . . . . 60 43Retained earnings . . . . . . . . . . . . . . . . . . . . . . . . . . . . . . . . . . . . . . . . . . . . . . . . . . . . . . . 693 491
5,297 5,409
The Company’s objectives when managing capital are to maintain ample liquidity to support the operations of the Company, prudentlyutilize long-term debt to finance the Company’s long-term assets and investments and provide adequate returns to its shareholders.
The Company manages its capital structure, and makes adjustments to it, in light of changes to economic conditions and its strategicobjectives. In order to maintain or adjust the capital structure, the Company may adjust the amount of dividends paid to shareholders,return capital to shareholders, issue new equity interests or sell assets to reduce debt.
F-39

HUDSON’S BAY COMPANY
NOTES TO CONSOLIDATED FINANCIAL STATEMENTS (Continued)
NOTE 18. FINANCIAL INSTRUMENTS (Continued)
Financial risk management
The Company has exposure to credit, liquidity and market risk from its use of financial instruments. The following is a description ofthose risks and how the exposures are managed:
a) Credit risk
The Company’s exposure to credit risk arises if a debtor or counterparty to a financial instrument fails to meet its obligations, and arisesprincipally from short-term deposits, receivables, and derivative instruments that are in a gain position. Credit risk is mitigated byvarious techniques including selecting counterparties based on acceptable credit ratings and minimizing the concentration of positionswith individual counterparties. There is no concentration of accounts receivable balances. The Company does not consider its exposureto credit risk to be material.
b) Liquidity risk
Liquidity risk is the risk that the Company will not be able to meet its financial obligations as they fall due. The Company managesliquidity risk by continuously monitoring actual and projected cash flows, taking into account the seasonality of the Company’s workingcapital needs, sales and earnings. The HBC Revolving Credit Facility, the U.S. Revolving Credit Facility and the bank overdraft facilitiesare used to maintain liquidity.
Undiscounted contractual maturities (including interest) of the Company’s financial liabilities are as follows:
Trade and Loans and Other(millions of Canadian dollars) other payables Derivatives borrowings liabilities Total
Fiscal year:2015 . . . . . . . . . . . . . . . . . . . . . . . . . . . . . . . . . . . . . . 1,290 1 418 27 1,7362016 . . . . . . . . . . . . . . . . . . . . . . . . . . . . . . . . . . . . . . — — 147 27 1742017 . . . . . . . . . . . . . . . . . . . . . . . . . . . . . . . . . . . . . . — — 441 11 4522018 . . . . . . . . . . . . . . . . . . . . . . . . . . . . . . . . . . . . . . — 68 118 — 1862019 . . . . . . . . . . . . . . . . . . . . . . . . . . . . . . . . . . . . . . — — 118 — 118Thereafter . . . . . . . . . . . . . . . . . . . . . . . . . . . . . . . . . . — — 3,992 — 3,992
1,290 69 5,234 65 6,658
The HBC Revolving Credit Facility matures December 17, 2019 and the U.S. Revolving Credit Facility matures November 4, 2018.These amounts have been reflected as due in fiscal 2015 in the table above to be consistent with presentation in the consolidatedbalance sheets.
c) Market risk
The Company is exposed to foreign currency risk and interest rate risk:
i. Foreign currency risk
HBC is a Canadian dollar functional currency entity that purchases a significant amount of inventory for its Canadian operations inU.S. dollars. HBC enters into forward foreign exchange contracts and foreign currency options to reduce the foreign exchange risk withrespect to these U.S. dollar denominated purchases. The forward foreign exchange contracts are designated and accounted for as a cashflow hedge of U.S. dollar purchases.
In accordance with the Company’s risk management policy, HBC may hedge up to 100% of all foreign currency transactions andeconomic exposures that are recognized in the consolidated balance sheets, or deemed as firm commitments (e.g. purchase orders thathave been issued for goods and services in foreign currency). It may further hedge up to 70% of forecasted transactions (anticipatedtransactions for which there are no firm commitments). HBC’s net U.S. dollar exposure is determined based on entities with the
F-40

HUDSON’S BAY COMPANY
NOTES TO CONSOLIDATED FINANCIAL STATEMENTS (Continued)
NOTE 18. FINANCIAL INSTRUMENTS (Continued)
Canadian dollar as their functional currency. HBC’s net U.S. dollar exposure as at January 31, 2015 and February 1, 2014, excluding itsinvestment in L&T Acquisition, is as follows:
U.S. Dollar Exposure (millions of U.S. dollars) 2014 2013
Trade payables . . . . . . . . . . . . . . . . . . . . . . . . . . . . . . . . . . . . . . . . . . . . . . . . . . . . . . . . . . . . . . . . (60) (56)HBC Revolving Credit Facility . . . . . . . . . . . . . . . . . . . . . . . . . . . . . . . . . . . . . . . . . . . . . . . . . . . . . . (125) (5)Senior Term Loan B . . . . . . . . . . . . . . . . . . . . . . . . . . . . . . . . . . . . . . . . . . . . . . . . . . . . . . . . . . . . (650) (2,000)Junior Term Loan . . . . . . . . . . . . . . . . . . . . . . . . . . . . . . . . . . . . . . . . . . . . . . . . . . . . . . . . . . . . . . — (300)Outstanding purchase orders . . . . . . . . . . . . . . . . . . . . . . . . . . . . . . . . . . . . . . . . . . . . . . . . . . . . . . . (17) (20)Forward foreign exchange contracts . . . . . . . . . . . . . . . . . . . . . . . . . . . . . . . . . . . . . . . . . . . . . . . . . . 176 161U.S. dollar denominated inter-company receivables . . . . . . . . . . . . . . . . . . . . . . . . . . . . . . . . . . . . . . . . . 886 1,503
Total exposure . . . . . . . . . . . . . . . . . . . . . . . . . . . . . . . . . . . . . . . . . . . . . . . . . . . . . . . . . . . . . . . . 210 (717)
The settlement dates of the forward foreign currency contracts range from February 2015 to December 2015 and the weighted averageforeign exchange rate is 1.15.
For fiscal 2014, HBC recorded a gain of $11 million (2013: loss of $2 million) relating to the translation or settlement of foreigncurrency denominated monetary items.
The estimated gains and losses on derivatives designated as cash flow hedges expected to be reclassified to earnings within the nexttwelve months is a net gain of $11 million.
The Company’s net investment in L&T Acquisition presents a foreign exchange risk to HBC. HBC used a net investment hedge tomitigate this risk. HBC had originally designated U.S.$800 million of Senior Term Loan B as a hedge of the first U.S.$800 million of netassets of L&T Acquisition. The hedge was subsequently reduced to U.S.$350 million upon pay down of certain debt (note 28)and further to nil, upon pay down of Senior Term Loan B (note 14). Foreign currency translation of the net earnings of L&T Acquisitionimpacts consolidated net earnings (loss). Foreign currency translation of HBC’s investment in L&T Acquisition impacts othercomprehensive income.
On an annualized basis, after considering the Company’s hedge of its exposure to foreign currency risk, a strengthening of theU.S. dollar against the Canadian dollar by 1% at January 31, 2015 would have impacted net earnings for fiscal 2014 by nil (2013:increased net loss by $2 million).
ii. Interest rate risk
The Company’s interest rate risk arises from short-term and long-term borrowings. Borrowings issued at variable rates expose theCompany to cash flow interest rate risk. During fiscal 2014 and 2013, the Company’s variable rate borrowings were denominated in bothU.S. and Canadian dollars.
Cash flow interest rate risk is mitigated by the use of interest rate swaps.
The Senior Term Loan B, U.S. Revolving Credit Facility and the Lord & Taylor Mortgage all have a variable component to interestbased on LIBOR. There is exposure to interest rate cash flow risk if variable rates rise.
On November 26, 2012, LT 424 entered into interest rate swap arrangements, the effect of which is to fix the interest rate related to theLord & Taylor Mortgage at 3.85%. The interest rate swap is designated as a cash flow hedge. The net interest income received underthis arrangement is included in finance costs. The arrangements have an effective date of September 7, 2012 and a maturity date ofSeptember 10, 2017.
An increase of 100 basis points in LIBOR over the past year would have decreased net earnings for fiscal 2014 by $5 million (2013:increased net loss by $3 million). This sensitivity analysis does not include the impact that an increase of 1% in LIBOR rates would haveon the fair value of the interest rate swaps.
In connection with the Saks Mortgage transaction (note 14), the Company entered into 2 separate interest rate swap lock forwardcontracts (the ‘‘Rate Locks’’) during fiscal 2014 that resulted in the Company fixing the interest rate to be paid over the entire term ofthe mortgage. The Company designated the Rate Locks as hedges of the cash flows from the forecasted proceeds of the Saks Mortgagetransaction. Each hedging relationship was assessed to be highly effective and as at January 31, 2015, a net realized loss of $9 million,with related deferred taxes of $4 million, was included in other comprehensive income representing the mark-to-market adjustments tofair value from the date of execution of each Rate Lock, October 10, 2014 and November 5, 2014, respectively, to December 3, 2014, thedate of close of the Saks Mortgage.
F-41
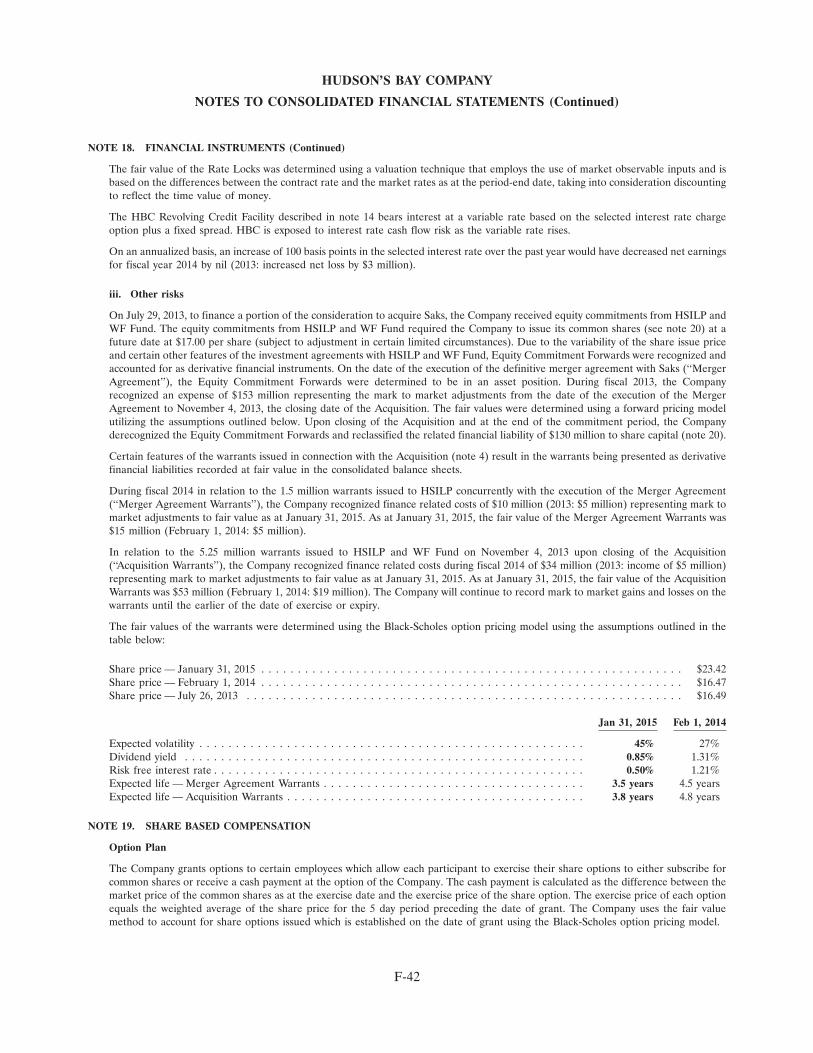
HUDSON’S BAY COMPANY
NOTES TO CONSOLIDATED FINANCIAL STATEMENTS (Continued)
NOTE 18. FINANCIAL INSTRUMENTS (Continued)
The fair value of the Rate Locks was determined using a valuation technique that employs the use of market observable inputs and isbased on the differences between the contract rate and the market rates as at the period-end date, taking into consideration discountingto reflect the time value of money.
The HBC Revolving Credit Facility described in note 14 bears interest at a variable rate based on the selected interest rate chargeoption plus a fixed spread. HBC is exposed to interest rate cash flow risk as the variable rate rises.
On an annualized basis, an increase of 100 basis points in the selected interest rate over the past year would have decreased net earningsfor fiscal year 2014 by nil (2013: increased net loss by $3 million).
iii. Other risks
On July 29, 2013, to finance a portion of the consideration to acquire Saks, the Company received equity commitments from HSILP andWF Fund. The equity commitments from HSILP and WF Fund required the Company to issue its common shares (see note 20) at afuture date at $17.00 per share (subject to adjustment in certain limited circumstances). Due to the variability of the share issue priceand certain other features of the investment agreements with HSILP and WF Fund, Equity Commitment Forwards were recognized andaccounted for as derivative financial instruments. On the date of the execution of the definitive merger agreement with Saks (‘‘MergerAgreement’’), the Equity Commitment Forwards were determined to be in an asset position. During fiscal 2013, the Companyrecognized an expense of $153 million representing the mark to market adjustments from the date of the execution of the MergerAgreement to November 4, 2013, the closing date of the Acquisition. The fair values were determined using a forward pricing modelutilizing the assumptions outlined below. Upon closing of the Acquisition and at the end of the commitment period, the Companyderecognized the Equity Commitment Forwards and reclassified the related financial liability of $130 million to share capital (note 20).
Certain features of the warrants issued in connection with the Acquisition (note 4) result in the warrants being presented as derivativefinancial liabilities recorded at fair value in the consolidated balance sheets.
During fiscal 2014 in relation to the 1.5 million warrants issued to HSILP concurrently with the execution of the Merger Agreement(‘‘Merger Agreement Warrants’’), the Company recognized finance related costs of $10 million (2013: $5 million) representing mark tomarket adjustments to fair value as at January 31, 2015. As at January 31, 2015, the fair value of the Merger Agreement Warrants was$15 million (February 1, 2014: $5 million).
In relation to the 5.25 million warrants issued to HSILP and WF Fund on November 4, 2013 upon closing of the Acquisition(‘‘Acquisition Warrants’’), the Company recognized finance related costs during fiscal 2014 of $34 million (2013: income of $5 million)representing mark to market adjustments to fair value as at January 31, 2015. As at January 31, 2015, the fair value of the AcquisitionWarrants was $53 million (February 1, 2014: $19 million). The Company will continue to record mark to market gains and losses on thewarrants until the earlier of the date of exercise or expiry.
The fair values of the warrants were determined using the Black-Scholes option pricing model using the assumptions outlined in thetable below:
Share price — January 31, 2015 . . . . . . . . . . . . . . . . . . . . . . . . . . . . . . . . . . . . . . . . . . . . . . . . . . . . . . . . . . $23.42Share price — February 1, 2014 . . . . . . . . . . . . . . . . . . . . . . . . . . . . . . . . . . . . . . . . . . . . . . . . . . . . . . . . . . $16.47Share price — July 26, 2013 . . . . . . . . . . . . . . . . . . . . . . . . . . . . . . . . . . . . . . . . . . . . . . . . . . . . . . . . . . . . $16.49
Jan 31, 2015 Feb 1, 2014
Expected volatility . . . . . . . . . . . . . . . . . . . . . . . . . . . . . . . . . . . . . . . . . . . . . . . . . . . . . 45% 27%Dividend yield . . . . . . . . . . . . . . . . . . . . . . . . . . . . . . . . . . . . . . . . . . . . . . . . . . . . . . . 0.85% 1.31%Risk free interest rate . . . . . . . . . . . . . . . . . . . . . . . . . . . . . . . . . . . . . . . . . . . . . . . . . . . 0.50% 1.21%Expected life — Merger Agreement Warrants . . . . . . . . . . . . . . . . . . . . . . . . . . . . . . . . . . . . 3.5 years 4.5 yearsExpected life — Acquisition Warrants . . . . . . . . . . . . . . . . . . . . . . . . . . . . . . . . . . . . . . . . . 3.8 years 4.8 years
NOTE 19. SHARE BASED COMPENSATION
Option Plan
The Company grants options to certain employees which allow each participant to exercise their share options to either subscribe forcommon shares or receive a cash payment at the option of the Company. The cash payment is calculated as the difference between themarket price of the common shares as at the exercise date and the exercise price of the share option. The exercise price of each optionequals the weighted average of the share price for the 5 day period preceding the date of grant. The Company uses the fair valuemethod to account for share options issued which is established on the date of grant using the Black-Scholes option pricing model.
F-42
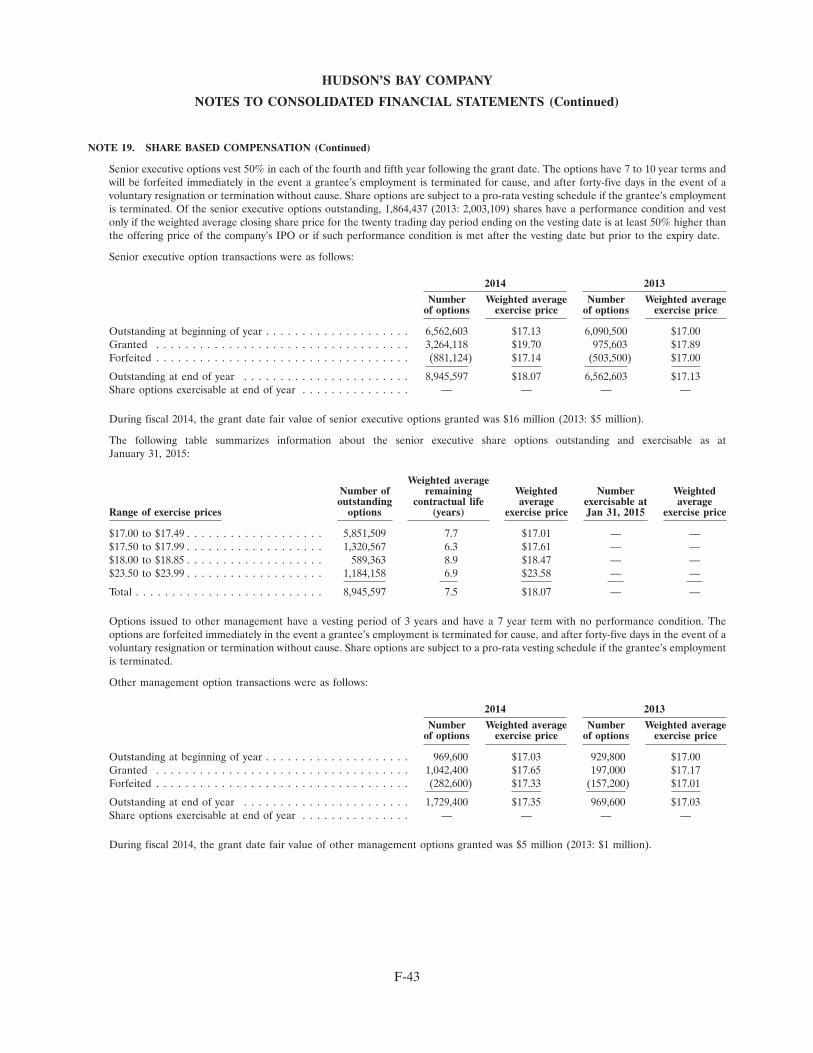
HUDSON’S BAY COMPANY
NOTES TO CONSOLIDATED FINANCIAL STATEMENTS (Continued)
NOTE 19. SHARE BASED COMPENSATION (Continued)
Senior executive options vest 50% in each of the fourth and fifth year following the grant date. The options have 7 to 10 year terms andwill be forfeited immediately in the event a grantee’s employment is terminated for cause, and after forty-five days in the event of avoluntary resignation or termination without cause. Share options are subject to a pro-rata vesting schedule if the grantee’s employmentis terminated. Of the senior executive options outstanding, 1,864,437 (2013: 2,003,109) shares have a performance condition and vestonly if the weighted average closing share price for the twenty trading day period ending on the vesting date is at least 50% higher thanthe offering price of the company’s IPO or if such performance condition is met after the vesting date but prior to the expiry date.
Senior executive option transactions were as follows:
2014 2013
Number Weighted average Number Weighted averageof options exercise price of options exercise price
Outstanding at beginning of year . . . . . . . . . . . . . . . . . . . . 6,562,603 $17.13 6,090,500 $17.00Granted . . . . . . . . . . . . . . . . . . . . . . . . . . . . . . . . . . . 3,264,118 $19.70 975,603 $17.89Forfeited . . . . . . . . . . . . . . . . . . . . . . . . . . . . . . . . . . . (881,124) $17.14 (503,500) $17.00
Outstanding at end of year . . . . . . . . . . . . . . . . . . . . . . . 8,945,597 $18.07 6,562,603 $17.13Share options exercisable at end of year . . . . . . . . . . . . . . . — — — —
During fiscal 2014, the grant date fair value of senior executive options granted was $16 million (2013: $5 million).
The following table summarizes information about the senior executive share options outstanding and exercisable as atJanuary 31, 2015:
Weighted averageNumber of remaining Weighted Number Weightedoutstanding contractual life average exercisable at average
Range of exercise prices options (years) exercise price Jan 31, 2015 exercise price
$17.00 to $17.49 . . . . . . . . . . . . . . . . . . . 5,851,509 7.7 $17.01 — —$17.50 to $17.99 . . . . . . . . . . . . . . . . . . . 1,320,567 6.3 $17.61 — —$18.00 to $18.85 . . . . . . . . . . . . . . . . . . . 589,363 8.9 $18.47 — —$23.50 to $23.99 . . . . . . . . . . . . . . . . . . . 1,184,158 6.9 $23.58 — —
Total . . . . . . . . . . . . . . . . . . . . . . . . . . 8,945,597 7.5 $18.07 — —
Options issued to other management have a vesting period of 3 years and have a 7 year term with no performance condition. Theoptions are forfeited immediately in the event a grantee’s employment is terminated for cause, and after forty-five days in the event of avoluntary resignation or termination without cause. Share options are subject to a pro-rata vesting schedule if the grantee’s employmentis terminated.
Other management option transactions were as follows:
2014 2013
Number Weighted average Number Weighted averageof options exercise price of options exercise price
Outstanding at beginning of year . . . . . . . . . . . . . . . . . . . . 969,600 $17.03 929,800 $17.00Granted . . . . . . . . . . . . . . . . . . . . . . . . . . . . . . . . . . . 1,042,400 $17.65 197,000 $17.17Forfeited . . . . . . . . . . . . . . . . . . . . . . . . . . . . . . . . . . . (282,600) $17.33 (157,200) $17.01
Outstanding at end of year . . . . . . . . . . . . . . . . . . . . . . . 1,729,400 $17.35 969,600 $17.03Share options exercisable at end of year . . . . . . . . . . . . . . . — — — —
During fiscal 2014, the grant date fair value of other management options granted was $5 million (2013: $1 million).
F-43

HUDSON’S BAY COMPANY
NOTES TO CONSOLIDATED FINANCIAL STATEMENTS (Continued)
NOTE 19. SHARE BASED COMPENSATION (Continued)
The following table summarizes information about the other management share options outstanding and exercisable as atJanuary 31, 2015:
Weighted averageNumber of remaining Weighted Number Weightedoutstanding contractual life average exercisable at average
Range of exercise prices options (years) exercise price Jan 31, 2015 exercise price
$17.00 to $17.49 . . . . . . . . . . . . . . . . . . . 955,800 5.1 $17.04 — —$17.50 to $17.99 . . . . . . . . . . . . . . . . . . . 756,000 6.3 $17.61 — —$23.50 to $23.99 . . . . . . . . . . . . . . . . . . . 17,600 6.9 $23.58 — —
Total . . . . . . . . . . . . . . . . . . . . . . . . . . 1,729,400 5.7 $17.35 — —
The assumptions used to measure the fair value at the grant date of senior executive and other management options granted duringfiscal 2014 and 2013 under the Black-Scholes option pricing model were as follows:
2014 2013
Expected dividend yield . . . . . . . . . . . . . . . . . . . . . . . . . . . . . . . . . . . . . . . . . . . . 0.9% to 1.2% 1.1% to 2.4%Expected share price volatility . . . . . . . . . . . . . . . . . . . . . . . . . . . . . . . . . . . . . . . . 24.1% to 35.8% 30.3% to 38.7%Risk-free interest rate . . . . . . . . . . . . . . . . . . . . . . . . . . . . . . . . . . . . . . . . . . . . . . 1.0% to 1.6% 1.4% to 1.6%Expected life of options (years) . . . . . . . . . . . . . . . . . . . . . . . . . . . . . . . . . . . . . . . . 5.0 to 6.5 6.5
Phantom Share Plan
The Company grants phantom shares to certain employees. During fiscal 2014, the Company granted 183,150 (2013: nil) phantom shareunits with a grant date fair value of $3 million (2013: nil). Phantom share units have a vesting period of 3 years that will be settled incommon shares of the Company or in cash at the Company’s option. As at January 31, 2015, 271,125 (February 1, 2014: 166,500)phantom share units were outstanding.
Restricted Share Units
The Company grants restricted share units (‘‘RSUs’’) to certain employees. During fiscal 2014, the Company granted 272,252 (2013:115,980) RSUs with a term of 3 years, all of which are expected to vest. The grant date fair value of the RSUs was $5 million (2013:$2 million) and was determined based on the Company’s share price at the date of the grant. RSUs were granted under similar termsand conditions as those granted concurrently with the IPO. As at January 31, 2015, 414,240 (February 1, 2014: 153,752) RSUs wereoutstanding.
Performance Share Units
Performance share unit (‘‘PSUs’’) transactions were as follows:
2014 2013
Outstanding at beginning of year . . . . . . . . . . . . . . . . . . . . . . . . . . . . . . . . . . . . . . . . . . . . . . . . 660,162 —Granted . . . . . . . . . . . . . . . . . . . . . . . . . . . . . . . . . . . . . . . . . . . . . . . . . . . . . . . . . . . . . . . . 1,158,187 674,939Forfeited . . . . . . . . . . . . . . . . . . . . . . . . . . . . . . . . . . . . . . . . . . . . . . . . . . . . . . . . . . . . . . . (155,594) (14,777)
Outstanding at end of year . . . . . . . . . . . . . . . . . . . . . . . . . . . . . . . . . . . . . . . . . . . . . . . . . . . . 1,662,755 660,162Weighted average contract life (years) remaining at end of year . . . . . . . . . . . . . . . . . . . . . . . . . . . . . 2.0 2.9
During fiscal 2014, the grant date fair value of the PSUs granted was $20 million (2013: $10 million), of which $15 million (2013:$8 million) is expected to vest. The fair value was determined based on the Company’s share price at the date of the grant and adjustedto reflect non-entitlement of dividends to PSUs. The PSUs vest 3 years from the date of grant at the end of that calendar year and areforfeited immediately in the event a grantee’s employment is terminated for cause, and after forty-five days in the event of a voluntaryresignation or termination without cause, subject to a pro-rata vesting schedule if the grantee’s employment is terminated.
F-44

HUDSON’S BAY COMPANY
NOTES TO CONSOLIDATED FINANCIAL STATEMENTS (Continued)
NOTE 19. SHARE BASED COMPENSATION (Continued)
Deferred Share Units
The Company grants deferred share units (‘‘DSUs’’) to members of the Board of Directors. During fiscal 2014, the Company granted52,240 units (2013: 49,823) with a grant date fair value of $1 million (2013: $1 million). The fair value was determined based on theCompany’s share price at the date of grant. No Director will have the right to receive any benefit under the DSU plan until theparticipant ceases to be a Director. As at January 31, 2015, 110,221 (February 1, 2014: 57,981) DSUs were outstanding.
Share Based Compensation Expense
Total share based compensation expense for fiscal 2014 and 2013 is summarized as follows:
2014 2013
Share options . . . . . . . . . . . . . . . . . . . . . . . . . . . . . . . . . . . . . . . . . . . . . . . . . . . . . . . . . . . . . . . . . 11 7Other share based compensation(1) . . . . . . . . . . . . . . . . . . . . . . . . . . . . . . . . . . . . . . . . . . . . . . . . . . . . 6 3
17 10
(1) Includes Phantom shares, RSUs, PSUs and DSUs.
Long Term Incentive Plans
The Company and its subsidiaries maintain a long-term incentive plan (‘‘LTIP’’) for certain senior executives. Under this plan amaximum of 100,000,000 incentive units may be granted, which entitle participants to receive cash payments or, at the sole discretion ofthe Board of Directors, shares of the granting entity in lieu of cash. As of January 28, 2012, the Company ceased making grants underthis program.
Incentive units had up to a 10 year term, vested in equal installments over a 5 year service period, and were paid out upon a change ofcontrol event or an initial public offering, as defined in the LTIP. Each incentive unit was paid out based on the unit appreciation value,according to the terms of each grant.
The unit appreciation value reflected the performance of the equity value of the entity against a target equity value established at thegrant date, according to the terms of the grant. These grants were made at the HBC level and at individual subsidiaries and ultimateamounts payable were determined based upon performance at either the HBC level or the individual subsidiary to which thegrant relates.
During fiscal 2014, nil (2013: $8 million) was paid related to the redemption of long-term incentive plan units. The liability for futurepayments related to these redemptions as at January 31, 2015 was nil (February 1, 2014: nil).
NOTE 20. SHARE CAPITAL
As at January 31, 2015 the authorized shares of HBC consist of an unlimited number of common shares and an unlimited number ofpreferred shares issuable in series.
The holders of common shares are entitled to receive dividends as declared from time to time and are entitled to one vote per share atmeetings of the shareholders.
Common Shares
On July 29, 2013, to finance a portion of the consideration to acquire Saks, the Company received equity commitments from HSILP andWF Fund for the Canadian dollar equivalent of up to U.S.$500 million and U.S.$250 million of equity funding, respectively. Asconsideration for HSILP’s equity commitment, concurrently with the execution of the Merger Agreement, the Company issued1.5 million share purchase warrants to HSILP, and subsequently issued an additional 3.5 million warrants to HSILP upon the closing ofthe Acquisition. In consideration for WF Fund’s commitment, upon closing of the Acquisition, the Company issued 1.75 millionwarrants to WF Fund (note 18).
On September 10, 2013 the Company issued 16,050,000 subscription receipts at a price of $17.15 per subscription receipt, for aggregategross proceeds of $275 million, net of costs of $11 million. The subscription receipts were issued to finance a portion of theconsideration required to acquire Saks. The net proceeds of the subscription receipts offering were held in escrow until closing of theAcquisition. Accordingly on November 4, 2013, the Company issued 16,050,000 common shares in exchange for the subscriptionreceipts.
F-45

HUDSON’S BAY COMPANY
NOTES TO CONSOLIDATED FINANCIAL STATEMENTS (Continued)
NOTE 20. SHARE CAPITAL (Continued)
On November 4, 2013, upon closing of the Acquisition, the Company issued 30,673,530 common shares for proceeds of $521 million(U.S.$500 million) to HSILP and 15,376,471 common shares for proceeds of $261 million (U.S.$250 million) to WF Fund.
The change in common shares issued and outstanding is as follows:
Number Share Capital(millions of Canadian dollars, except shares) of Shares ($)
Issued and outstanding at February 2, 2013 . . . . . . . . . . . . . . . . . . . . . . . . . . . . . . . . . . . . 120,000,000 246Conversion of subscription receipts to common shares (net of offering costs, transaction costs and
income taxes of $9 million) . . . . . . . . . . . . . . . . . . . . . . . . . . . . . . . . . . . . . . . . . . . . . 16,050,000 266Issuance of common shares to HSILP and WF Fund (net of transaction costs and income taxes of
$4 million) . . . . . . . . . . . . . . . . . . . . . . . . . . . . . . . . . . . . . . . . . . . . . . . . . . . . . . . 46,050,001 778Fair value of Equity Commitment Forwards transferred to equity (note 18) . . . . . . . . . . . . . . . . — 130
Issued and outstanding as at February 1, 2014 and January 31, 2015 . . . . . . . . . . . . . . . . . . . . 182,100,001 1,420
During the year ended January 31, 2015, the Company declared and paid dividends to the holders of the common shares totaling$36 million (2013: $43 million).
Preferred Shares
The preferred shares are issuable at any time and from time to time in one or more series. The Board of Directors are authorized to fixbefore issue the number of, the consideration per share of, the designation of, and the provisions attaching to, the preferred shares ofeach series, which may include voting rights. The preferred shares of each series will rank on parity with the preferred shares of everyother series and will be entitled to preference over the common shares and any other shares ranking junior to the preferred shares withrespect to payment of dividends and distribution of any property or assets in the event of the Company’s liquidation, dissolution orwinding-up, whether voluntary or involuntary.
As at January 31, 2015 and February 1, 2014, there were no preferred shares issued and outstanding.
Warrants
As at January 31, 2015 and February 1, 2014, the 6.75 million warrants issued to HSILP and WF Fund as consideration for the equitycommitments are outstanding. The warrants are exercisable into common shares of the Company at an exercise price of $17.00 perwarrant which in certain circumstances is subject to adjustment. The warrants expire on November 4, 2018.
F-46

HUDSON’S BAY COMPANY
NOTES TO CONSOLIDATED FINANCIAL STATEMENTS (Continued)
NOTE 21. EARNINGS (LOSS) PER COMMON SHARE
Net earnings (loss) per common share and weighted average common shares outstanding are calculated as follows:
(millions of Canadian dollars or shares except per share amounts) 2014 2013
Net earnings (loss) from continuing operations for basic earnings per share . . . . . . . . . . . . . . . . . . . . . . . . 238 (177)Net loss from discontinued operations for basic earnings per share . . . . . . . . . . . . . . . . . . . . . . . . . . . . . . — (82)
Net earnings (loss) for basic earnings per share . . . . . . . . . . . . . . . . . . . . . . . . . . . . . . . . . . . . . . . . . . 238 (259)Net earnings (loss) from continuing operations for basic earnings per share . . . . . . . . . . . . . . . . . . . . . . . . 238 (177)Impact of warrants . . . . . . . . . . . . . . . . . . . . . . . . . . . . . . . . . . . . . . . . . . . . . . . . . . . . . . . . . . . . — (5)
Net earnings (loss) from continuing operations for diluted earnings per share . . . . . . . . . . . . . . . . . . . . . . . 238 (182)Net loss from discontinued operations for diluted earnings per share . . . . . . . . . . . . . . . . . . . . . . . . . . . . . — (82)
Net earnings (loss) for diluted earnings per share . . . . . . . . . . . . . . . . . . . . . . . . . . . . . . . . . . . . . . . . . 238 (264)
Weighted average common shares outstanding . . . . . . . . . . . . . . . . . . . . . . . . . . . . . . . . . . . . . . . . . . . 182 135Dilutive effect of options and RSUs . . . . . . . . . . . . . . . . . . . . . . . . . . . . . . . . . . . . . . . . . . . . . . . . . 1 —
Diluted weighted average common shares outstanding . . . . . . . . . . . . . . . . . . . . . . . . . . . . . . . . . . . . . . 183 135
Basic net earnings (loss) per common shareContinuing operations . . . . . . . . . . . . . . . . . . . . . . . . . . . . . . . . . . . . . . . . . . . . . . . . . . . . . . . . . 1.31 (1.31)Discontinued operations . . . . . . . . . . . . . . . . . . . . . . . . . . . . . . . . . . . . . . . . . . . . . . . . . . . . . . . — (0.61)
1.31 (1.92)
Diluted net earnings (loss) per common shareContinuing operations . . . . . . . . . . . . . . . . . . . . . . . . . . . . . . . . . . . . . . . . . . . . . . . . . . . . . . . . . 1.30 (1.34)Discontinued operations . . . . . . . . . . . . . . . . . . . . . . . . . . . . . . . . . . . . . . . . . . . . . . . . . . . . . . . — (0.61)
1.30 (1.95)
Excluded from the computation of diluted net earnings (loss) per common share were 7,321,079 (2013: 9,183,476) potentially dilutiveinstruments, as they were anti-dilutive.
NOTE 22. RELATED PARTY TRANSACTIONS
Transactions between HBC and its subsidiaries (note 27), which are related parties, have been eliminated on consolidation and are notdisclosed in this note. Details of transactions with other related parties are disclosed below.
On May 6, 2011, a subsidiary of L&T Acquisition entered into a 2 year lease with SP 35 L.P. (the ‘‘Landlord’’) for approximately31,000 sq. ft. in Shrewsbury, NJ. The lease was amended on January 17, 2013 to include 3 renewal options. The first 2 renewal optionsare for terms of 2 and 3 years, respectively at an annual cost of U.S.$440 thousand. The third renewal option is for a term of 5 years atan annual cost of U.S.$484 thousand. The first and second renewal options were exercised. Amounts charged to the Company under therental arrangement for fiscal 2014 were U.S.$440 thousand (2013: U.S.$376 thousand). The Landlord is an affiliate of National Realty &Development Corp. (‘‘NRDC’’). Richard and Robert Baker, the principals of NRDC, are Directors of the Company.
During fiscal 2014, the Company accrued $314 thousand (2013: $300 thousand) from Hudson’s Bay Trading Company, LP, a shareholderof the Company, with respect to the reimbursement of expenses for services provided by HBC on their behalf.
On February 25, 2014, the Company closed its agreement to sell its downtown Toronto flagship retail complex and the Simpson’s Towerto an affiliate of The Cadillac Fairview Corporation Limited, an affiliate of HSILP, for a purchase price of $650 million (note 28).
All of the above amounts have been recorded at the exchange value of the transaction.
F-47
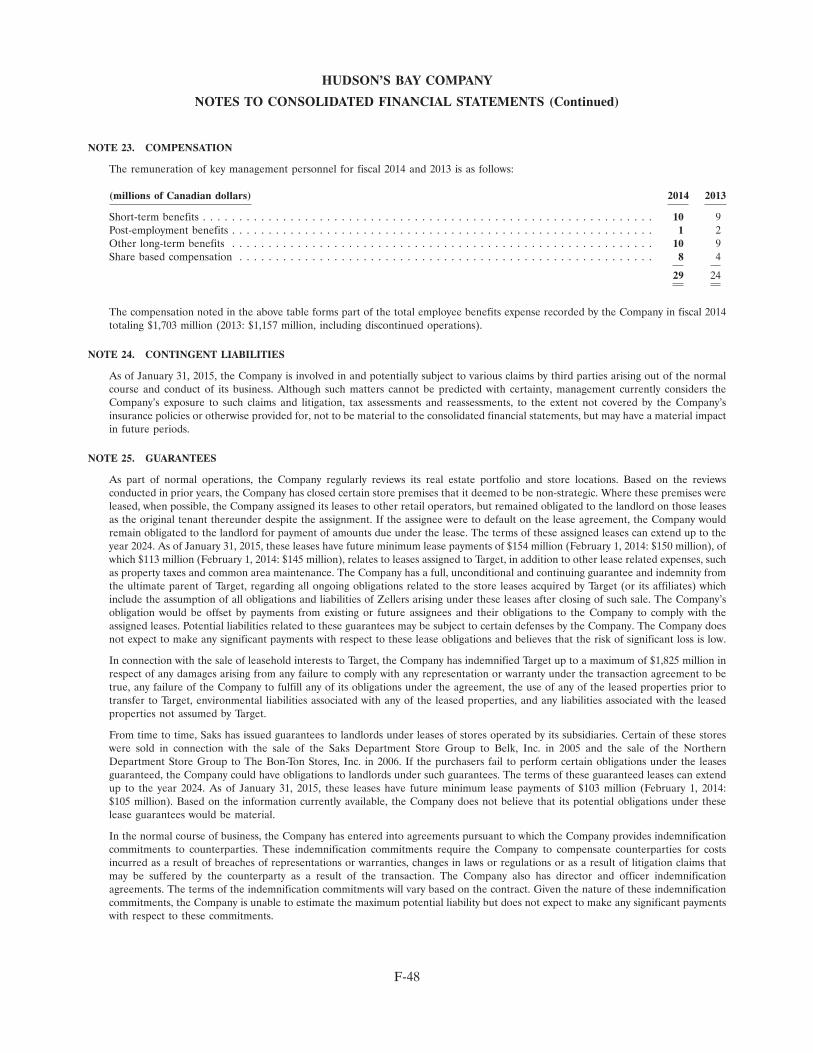
HUDSON’S BAY COMPANY
NOTES TO CONSOLIDATED FINANCIAL STATEMENTS (Continued)
NOTE 23. COMPENSATION
The remuneration of key management personnel for fiscal 2014 and 2013 is as follows:
(millions of Canadian dollars) 2014 2013
Short-term benefits . . . . . . . . . . . . . . . . . . . . . . . . . . . . . . . . . . . . . . . . . . . . . . . . . . . . . . . . . . . . . . 10 9Post-employment benefits . . . . . . . . . . . . . . . . . . . . . . . . . . . . . . . . . . . . . . . . . . . . . . . . . . . . . . . . . . 1 2Other long-term benefits . . . . . . . . . . . . . . . . . . . . . . . . . . . . . . . . . . . . . . . . . . . . . . . . . . . . . . . . . . 10 9Share based compensation . . . . . . . . . . . . . . . . . . . . . . . . . . . . . . . . . . . . . . . . . . . . . . . . . . . . . . . . . 8 4
29 24
The compensation noted in the above table forms part of the total employee benefits expense recorded by the Company in fiscal 2014totaling $1,703 million (2013: $1,157 million, including discontinued operations).
NOTE 24. CONTINGENT LIABILITIES
As of January 31, 2015, the Company is involved in and potentially subject to various claims by third parties arising out of the normalcourse and conduct of its business. Although such matters cannot be predicted with certainty, management currently considers theCompany’s exposure to such claims and litigation, tax assessments and reassessments, to the extent not covered by the Company’sinsurance policies or otherwise provided for, not to be material to the consolidated financial statements, but may have a material impactin future periods.
NOTE 25. GUARANTEES
As part of normal operations, the Company regularly reviews its real estate portfolio and store locations. Based on the reviewsconducted in prior years, the Company has closed certain store premises that it deemed to be non-strategic. Where these premises wereleased, when possible, the Company assigned its leases to other retail operators, but remained obligated to the landlord on those leasesas the original tenant thereunder despite the assignment. If the assignee were to default on the lease agreement, the Company wouldremain obligated to the landlord for payment of amounts due under the lease. The terms of these assigned leases can extend up to theyear 2024. As of January 31, 2015, these leases have future minimum lease payments of $154 million (February 1, 2014: $150 million), ofwhich $113 million (February 1, 2014: $145 million), relates to leases assigned to Target, in addition to other lease related expenses, suchas property taxes and common area maintenance. The Company has a full, unconditional and continuing guarantee and indemnity fromthe ultimate parent of Target, regarding all ongoing obligations related to the store leases acquired by Target (or its affiliates) whichinclude the assumption of all obligations and liabilities of Zellers arising under these leases after closing of such sale. The Company’sobligation would be offset by payments from existing or future assignees and their obligations to the Company to comply with theassigned leases. Potential liabilities related to these guarantees may be subject to certain defenses by the Company. The Company doesnot expect to make any significant payments with respect to these lease obligations and believes that the risk of significant loss is low.
In connection with the sale of leasehold interests to Target, the Company has indemnified Target up to a maximum of $1,825 million inrespect of any damages arising from any failure to comply with any representation or warranty under the transaction agreement to betrue, any failure of the Company to fulfill any of its obligations under the agreement, the use of any of the leased properties prior totransfer to Target, environmental liabilities associated with any of the leased properties, and any liabilities associated with the leasedproperties not assumed by Target.
From time to time, Saks has issued guarantees to landlords under leases of stores operated by its subsidiaries. Certain of these storeswere sold in connection with the sale of the Saks Department Store Group to Belk, Inc. in 2005 and the sale of the NorthernDepartment Store Group to The Bon-Ton Stores, Inc. in 2006. If the purchasers fail to perform certain obligations under the leasesguaranteed, the Company could have obligations to landlords under such guarantees. The terms of these guaranteed leases can extendup to the year 2024. As of January 31, 2015, these leases have future minimum lease payments of $103 million (February 1, 2014:$105 million). Based on the information currently available, the Company does not believe that its potential obligations under theselease guarantees would be material.
In the normal course of business, the Company has entered into agreements pursuant to which the Company provides indemnificationcommitments to counterparties. These indemnification commitments require the Company to compensate counterparties for costsincurred as a result of breaches of representations or warranties, changes in laws or regulations or as a result of litigation claims thatmay be suffered by the counterparty as a result of the transaction. The Company also has director and officer indemnificationagreements. The terms of the indemnification commitments will vary based on the contract. Given the nature of these indemnificationcommitments, the Company is unable to estimate the maximum potential liability but does not expect to make any significant paymentswith respect to these commitments.
F-48

HUDSON’S BAY COMPANY
NOTES TO CONSOLIDATED FINANCIAL STATEMENTS (Continued)
NOTE 26. SEGMENTED REPORTING
The Company has one reportable segment, Department Stores, which earns revenue from the sale of fashion apparel, accessories,cosmetics and home products to customers in a similar target market. The Department Stores segment, which includes Hudson’s Bay,Lord & Taylor, Saks Fifth Avenue, OFF 5TH and Home Outfitters, is managed by the Chief Operating Decision Maker and supportedby an integrated shared services function.
The following summarizes retail sales from continuing operations, total operating income from continuing operations and total assets bygeographic area:
(millions of Canadian dollars) 2014 2013
Total retail salesCanada . . . . . . . . . . . . . . . . . . . . . . . . . . . . . . . . . . . . . . . . . . . . . . . . . . . . . . . . . . . . . . 2,810 2,719United States . . . . . . . . . . . . . . . . . . . . . . . . . . . . . . . . . . . . . . . . . . . . . . . . . . . . . . . . . . 5,359 2,504
8,169 5,223
2013(restated —
(millions of Canadian dollars) 2014 see note 2(z))
Total operating income (loss)Canada . . . . . . . . . . . . . . . . . . . . . . . . . . . . . . . . . . . . . . . . . . . . . . . . . . . . . . . . . . . . . . 413 38United States . . . . . . . . . . . . . . . . . . . . . . . . . . . . . . . . . . . . . . . . . . . . . . . . . . . . . . . . . . 68 (33)
481 5
2013(restated —see note 2(z)
(millions of Canadian dollars) 2014 and note 4)
Non-current assets(1)
Canada . . . . . . . . . . . . . . . . . . . . . . . . . . . . . . . . . . . . . . . . . . . . . . . . . . . . . . . . . . . . . . 666 695United States . . . . . . . . . . . . . . . . . . . . . . . . . . . . . . . . . . . . . . . . . . . . . . . . . . . . . . . . . . 5,268 4,616
5,934 5,311
Total assetsCanada . . . . . . . . . . . . . . . . . . . . . . . . . . . . . . . . . . . . . . . . . . . . . . . . . . . . . . . . . . . . . . 1,903 1,749United States . . . . . . . . . . . . . . . . . . . . . . . . . . . . . . . . . . . . . . . . . . . . . . . . . . . . . . . . . . 7,169 6,193
9,072 7,942
(1) Excludes deferred tax assets and pensions and employee benefits
NOTE 27. SUBSIDIARIES
Entities controlled by HBC are included in these consolidated financial statements. Control exists when the Company has the ability todirect the relevant activities and the return of an entity. The financial statements of such entities are included in the consolidatedfinancial statements from the date control commences until the date that control ceases. Significant subsidiaries of the Company are:
OwnershipCountry of interestincorporation andName of subsidiary operation 2014 2013
Zellers Inc. . . . . . . . . . . . . . . . . . . . . . . . . . . . . . . . . . . . . . . . . . . . . . . . . . . . . Canada N/A 100%Lord & Taylor LLC . . . . . . . . . . . . . . . . . . . . . . . . . . . . . . . . . . . . . . . . . . . . . . United States 100% 100%LT Propco LLC . . . . . . . . . . . . . . . . . . . . . . . . . . . . . . . . . . . . . . . . . . . . . . . . . United States 100% 100%LT 424 LLC . . . . . . . . . . . . . . . . . . . . . . . . . . . . . . . . . . . . . . . . . . . . . . . . . . . United States 100% 100%Saks Incorporated . . . . . . . . . . . . . . . . . . . . . . . . . . . . . . . . . . . . . . . . . . . . . . . . United States 100% 100%Saks Flagship Real Property LLC . . . . . . . . . . . . . . . . . . . . . . . . . . . . . . . . . . . . . . United States 100% N/A
F-49
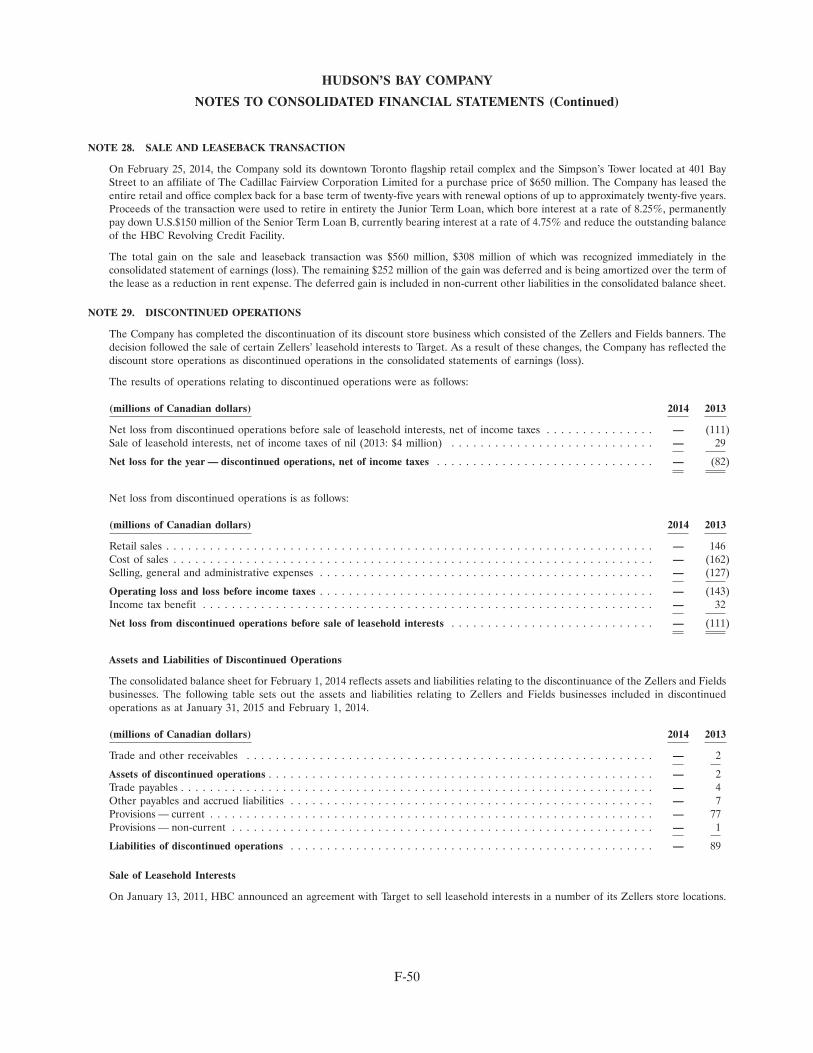
HUDSON’S BAY COMPANY
NOTES TO CONSOLIDATED FINANCIAL STATEMENTS (Continued)
NOTE 28. SALE AND LEASEBACK TRANSACTION
On February 25, 2014, the Company sold its downtown Toronto flagship retail complex and the Simpson’s Tower located at 401 BayStreet to an affiliate of The Cadillac Fairview Corporation Limited for a purchase price of $650 million. The Company has leased theentire retail and office complex back for a base term of twenty-five years with renewal options of up to approximately twenty-five years.Proceeds of the transaction were used to retire in entirety the Junior Term Loan, which bore interest at a rate of 8.25%, permanentlypay down U.S.$150 million of the Senior Term Loan B, currently bearing interest at a rate of 4.75% and reduce the outstanding balanceof the HBC Revolving Credit Facility.
The total gain on the sale and leaseback transaction was $560 million, $308 million of which was recognized immediately in theconsolidated statement of earnings (loss). The remaining $252 million of the gain was deferred and is being amortized over the term ofthe lease as a reduction in rent expense. The deferred gain is included in non-current other liabilities in the consolidated balance sheet.
NOTE 29. DISCONTINUED OPERATIONS
The Company has completed the discontinuation of its discount store business which consisted of the Zellers and Fields banners. Thedecision followed the sale of certain Zellers’ leasehold interests to Target. As a result of these changes, the Company has reflected thediscount store operations as discontinued operations in the consolidated statements of earnings (loss).
The results of operations relating to discontinued operations were as follows:
(millions of Canadian dollars) 2014 2013
Net loss from discontinued operations before sale of leasehold interests, net of income taxes . . . . . . . . . . . . . . . — (111)Sale of leasehold interests, net of income taxes of nil (2013: $4 million) . . . . . . . . . . . . . . . . . . . . . . . . . . . . — 29
Net loss for the year — discontinued operations, net of income taxes . . . . . . . . . . . . . . . . . . . . . . . . . . . . . . — (82)
Net loss from discontinued operations is as follows:
(millions of Canadian dollars) 2014 2013
Retail sales . . . . . . . . . . . . . . . . . . . . . . . . . . . . . . . . . . . . . . . . . . . . . . . . . . . . . . . . . . . . . . . . . . . — 146Cost of sales . . . . . . . . . . . . . . . . . . . . . . . . . . . . . . . . . . . . . . . . . . . . . . . . . . . . . . . . . . . . . . . . . . — (162)Selling, general and administrative expenses . . . . . . . . . . . . . . . . . . . . . . . . . . . . . . . . . . . . . . . . . . . . . . — (127)
Operating loss and loss before income taxes . . . . . . . . . . . . . . . . . . . . . . . . . . . . . . . . . . . . . . . . . . . . . . — (143)Income tax benefit . . . . . . . . . . . . . . . . . . . . . . . . . . . . . . . . . . . . . . . . . . . . . . . . . . . . . . . . . . . . . . — 32
Net loss from discontinued operations before sale of leasehold interests . . . . . . . . . . . . . . . . . . . . . . . . . . . . — (111)
Assets and Liabilities of Discontinued Operations
The consolidated balance sheet for February 1, 2014 reflects assets and liabilities relating to the discontinuance of the Zellers and Fieldsbusinesses. The following table sets out the assets and liabilities relating to Zellers and Fields businesses included in discontinuedoperations as at January 31, 2015 and February 1, 2014.
(millions of Canadian dollars) 2014 2013
Trade and other receivables . . . . . . . . . . . . . . . . . . . . . . . . . . . . . . . . . . . . . . . . . . . . . . . . . . . . . . . . — 2
Assets of discontinued operations . . . . . . . . . . . . . . . . . . . . . . . . . . . . . . . . . . . . . . . . . . . . . . . . . . . . . — 2Trade payables . . . . . . . . . . . . . . . . . . . . . . . . . . . . . . . . . . . . . . . . . . . . . . . . . . . . . . . . . . . . . . . . . — 4Other payables and accrued liabilities . . . . . . . . . . . . . . . . . . . . . . . . . . . . . . . . . . . . . . . . . . . . . . . . . . — 7Provisions — current . . . . . . . . . . . . . . . . . . . . . . . . . . . . . . . . . . . . . . . . . . . . . . . . . . . . . . . . . . . . . — 77Provisions — non-current . . . . . . . . . . . . . . . . . . . . . . . . . . . . . . . . . . . . . . . . . . . . . . . . . . . . . . . . . . — 1
Liabilities of discontinued operations . . . . . . . . . . . . . . . . . . . . . . . . . . . . . . . . . . . . . . . . . . . . . . . . . . — 89
Sale of Leasehold Interests
On January 13, 2011, HBC announced an agreement with Target to sell leasehold interests in a number of its Zellers store locations.
F-50
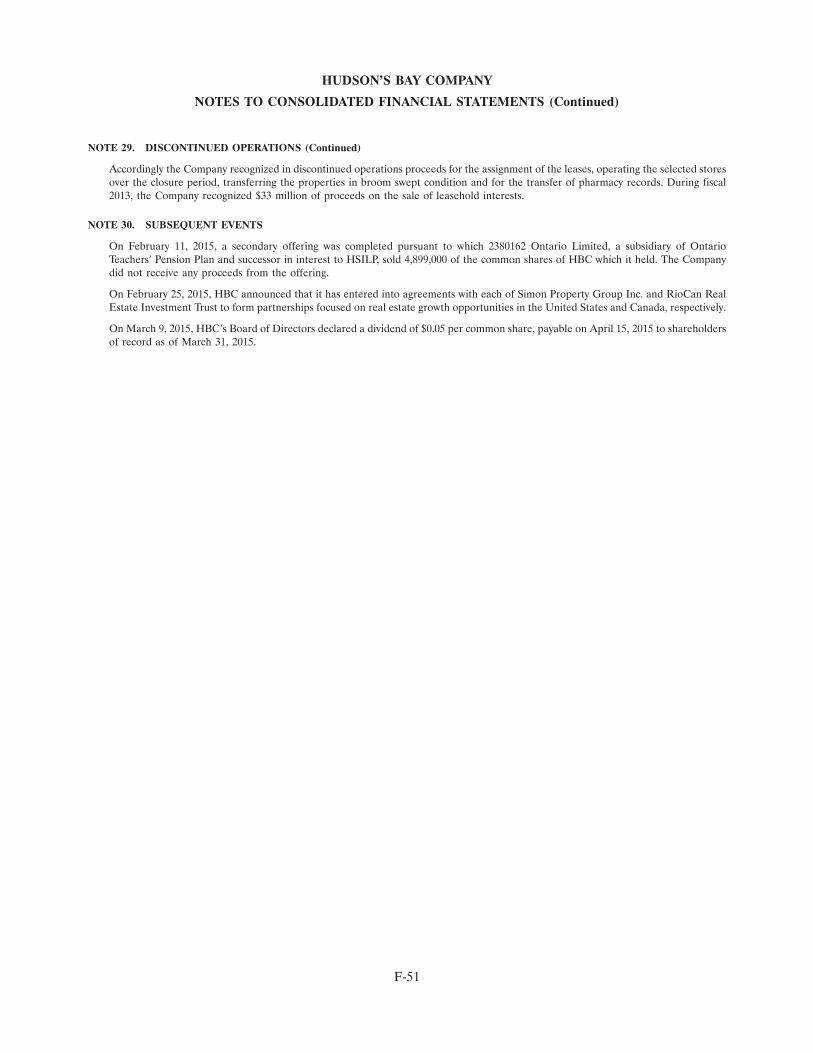
HUDSON’S BAY COMPANY
NOTES TO CONSOLIDATED FINANCIAL STATEMENTS (Continued)
NOTE 29. DISCONTINUED OPERATIONS (Continued)
Accordingly the Company recognized in discontinued operations proceeds for the assignment of the leases, operating the selected storesover the closure period, transferring the properties in broom swept condition and for the transfer of pharmacy records. During fiscal2013, the Company recognized $33 million of proceeds on the sale of leasehold interests.
NOTE 30. SUBSEQUENT EVENTS
On February 11, 2015, a secondary offering was completed pursuant to which 2380162 Ontario Limited, a subsidiary of OntarioTeachers’ Pension Plan and successor in interest to HSILP, sold 4,899,000 of the common shares of HBC which it held. The Companydid not receive any proceeds from the offering.
On February 25, 2015, HBC announced that it has entered into agreements with each of Simon Property Group Inc. and RioCan RealEstate Investment Trust to form partnerships focused on real estate growth opportunities in the United States and Canada, respectively.
On March 9, 2015, HBC’s Board of Directors declared a dividend of $0.05 per common share, payable on April 15, 2015 to shareholdersof record as of March 31, 2015.
F-51

RICHARD BAKERGovernor and Executive Chairman,Hudson’s Bay Company
ROBERT BAKERChairman and CEO,National Realty & Development Corporation
DAVID LEITHLead Director,Chair of Manitoba TelecomServices Inc. / MTS Allstream
WILLIAM MACKFounder and Chairman,Mack Real Estate Group
LEE NEIBARTSenior Partner and Co-Head of the Real Estate Group,Ares Management LLC
DENISE PICKETT President,American Express OPEN
WAYNE POMMENVice President,TorQuest Partners
EARL ROTMANChairman,Venator Capital Management Ltd.
MATTHEW RUBEL Senior Advisor,to TPG Capital
ANDREA WONGPresident,International Production Sony Pictures TelevisionPresident,International, Sony PicturesEntertainment
BOARD OF DIRECTORS
RICHARD BAKERGovernor and Executive Chairman
GERALD STORCHChief Executive Offi cer
PAUL BEESLEYChief Financial Offi cer
BONNIE BROOKSVice Chairman, HBC
MICHAEL BURGESSPresident, HBC Digital
STEPHEN CERRONEChief Human Resources Offi cer
JONATHAN GRELLERPresident, Outlets
MARC METRICK President, Saks Fifth Avenue
JOHN NORDEENChief Information Offi cer
BRIAN PALLPresident, Real Estate
DAVID PICKWOADGeneral Counsel
IAN PUTNAMChief Corporate Development Offi cer
ELIZABETH RODBELLPresident, HBC Department Store Group
DONALD WATROSPresident, HBC International
TODD ZATORChief Accounting Offi cer
EXECUTIVE OFFICERS

CORPORATE INFORMATION
HEAD OFFICE401 Bay Street, Suite 500Toronto, Ontario M5H 2Y4
TRANSFER AGENTAND REGISTRARTMX Equity Transfer Services200 University Avenue, Suite 300Toronto, Ontario M5H 4H1
AUDITORSDeloitte LLP181 Bay StreetBay-Wellington TowerBrookfi eld Place, Suite 1400Toronto, Ontario M5J 2V1
LEGAL COUNSELStikeman Elliott LLP5300 Commerce Court West199 Bay StreetToronto, Ontario M5L 1B9
INVESTOR RELATIONS CONTACT(416) [email protected]
STOCK EXCHANGELISTINGToronto Stock Exchange:“HBC”
ANNUAL GENERALMEETINGTuesday, June 9, 2015at 2:00 pm ETTMX Broadcast CentreThe Exchange Tower130 King Street WestToronto, Ontario M5X 1J2
HBC CSR REPORTwww.hbc.com/hbc/socialresponsibility/csr-reporting
Subject to fi nancial results, capital requirements, available cash fl ow and any other factors that the Board of Directors may consider relevant, it is the intention of the Board of Directors to declare a quarterly dividend on an ongoing basis. It is expected that future dividend payments will be made to shareholders of record as of the close of business on the last business day of each calendar quarter of each year and that the related payment date will be the 15th day of the month following the record date, or if such day is not a business day, the immediately preceding business day. All dividends to be paid by the Company, unless otherwise indicated, are designated as eligible dividends in accordance with subsection 89(14) of the Income Tax Act (Canada) and any applicable corresponding provincial or territorial provisions.
Following the acquisition of Saks Inc., the Company reduced its quarterly dividend from $0.09375 per common share to $0.05 per common share to accelerate deleveraging in the short term. The Company’s credit facilities restrict our ability to declare dividends in certain circumstances. The amount and timing of the payment of any dividends are not guaranteed and are subject to the discretion of the Board of Directors.
DIVIDEND POLICY

VISIT US ONLINE:
hbc.com • thebay.com • saksfi fthavenue.com • lordandtaylor.com • saksoff5th.com