management problem solving techniques for decision … · management problem solving techniques for...
TRANSCRIPT
ASA 2013 Annual Conference
Management Problem Solving Techniques for Decision
Makers

GEORGE J. RINGGER, MAS, P.E.FAA-DER FAA-DAR
Providing Engineering, Quality System, Training, and Airworthiness services
to the aviation industry
office 954-655-6509fax 954-680-5326

TRAINING PROVIDED TO THE AVIATION COMMUNITY
Overview1; Introductions/Purpose2: Approaches to solving problems 3: Where do problems come from? (CARs)4: Defining some terms5: Steps to an effective Problem Solving Strategy (RCA)6: Management tools for problem-solving with examples7: Summary

ExerciseWhile pouring yourself a cup of coffee in the cafeteria, a
supervisor of Customer Service walks up to you for help:
Supervisor: “You know, ever since Sally was transferred to my department, reported customer complaints have skyrocketed!I had my best employee, Sam, train her. I really need some help
here. Any suggestions?”
1. What is your impression of the Supervisor?2. What is your impression of Sally’s performance?3. What do you recommend?4. What information (data) have you collected and analyzed
to support your recommendations?
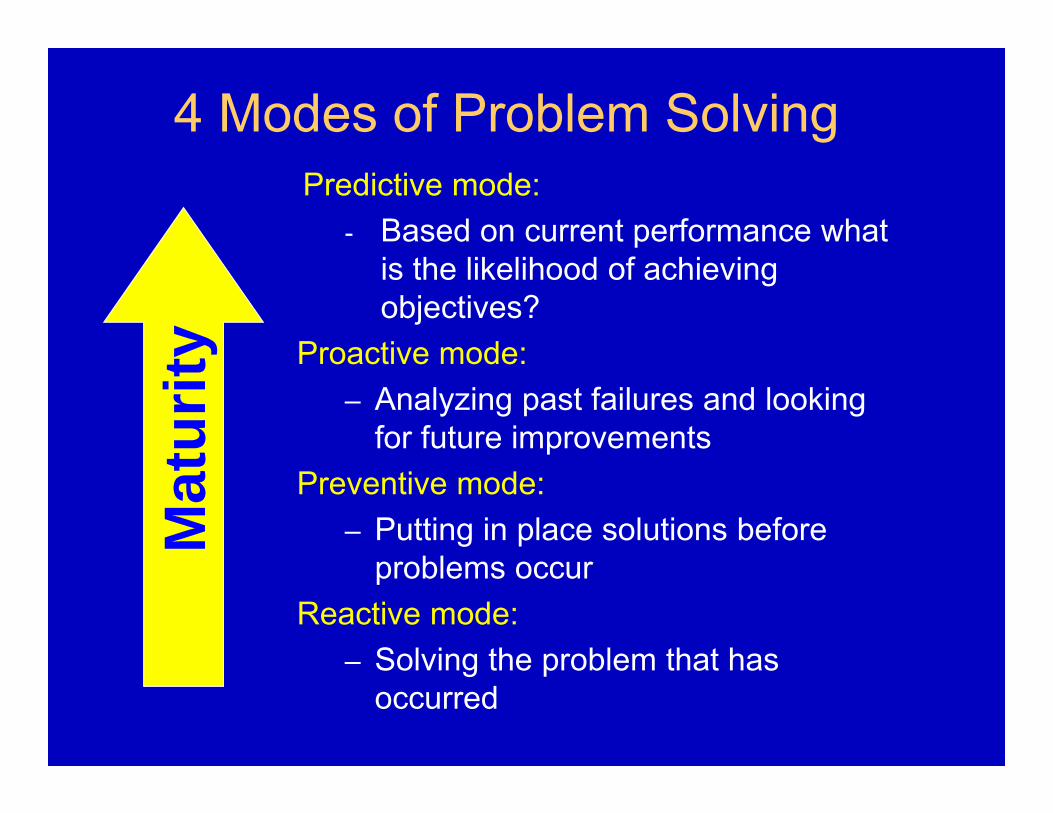
4 Modes of Problem SolvingPredictive mode:
- Based on current performance what is the likelihood of achieving objectives?
Proactive mode: – Analyzing past failures and looking
for future improvementsPreventive mode:
– Putting in place solutions before problems occur
Reactive mode:– Solving the problem that has
occurred
Mat
urity
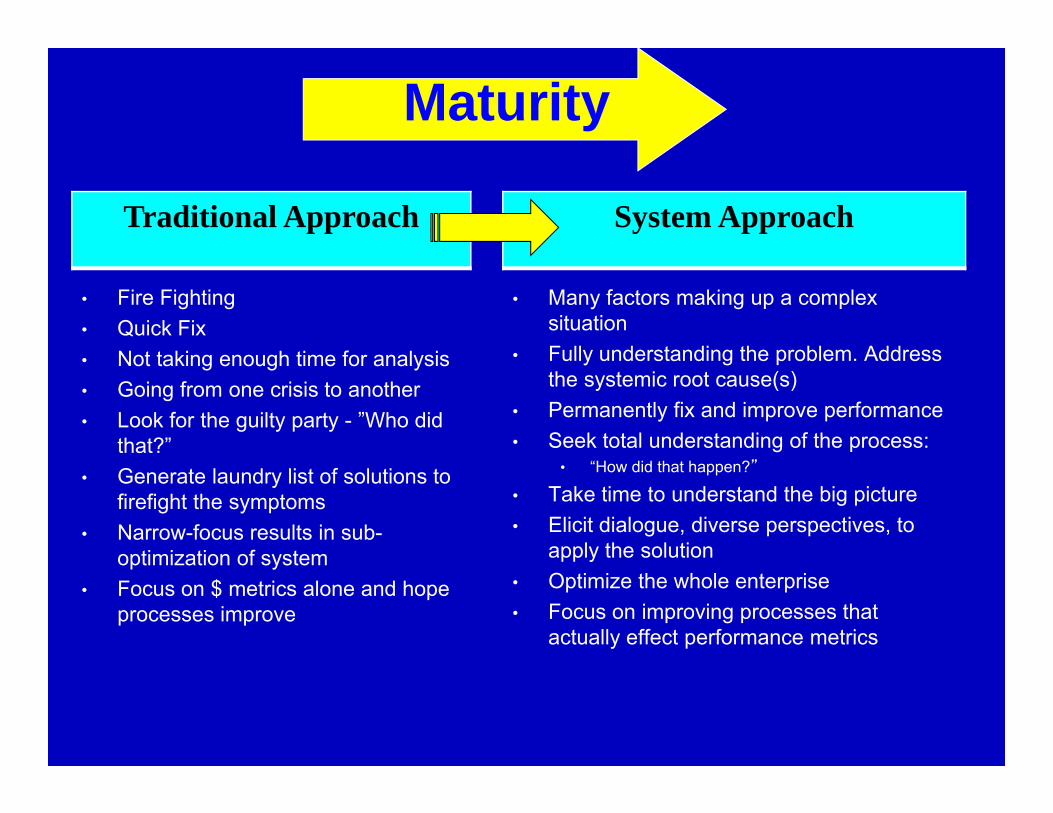
Traditional Approach
• Many factors making up a complex situation
• Fully understanding the problem. Address the systemic root cause(s)
• Permanently fix and improve performance• Seek total understanding of the process:
• “How did that happen?”
• Take time to understand the big picture• Elicit dialogue, diverse perspectives, to
apply the solution• Optimize the whole enterprise• Focus on improving processes that
actually effect performance metrics
• Fire Fighting• Quick Fix• Not taking enough time for analysis• Going from one crisis to another• Look for the guilty party - ”Who did
that?”• Generate laundry list of solutions to
firefight the symptoms• Narrow-focus results in sub-
optimization of system• Focus on $ metrics alone and hope
processes improve
System Approach
Maturity

The Scientific Process
Identify a problem
Identify a problem
Gather Information
Gather Information
Formulate a hypothesis
Formulate a hypothesis
Design and ExperimentDesign and Experiment
Record and Organize Data
Record and Organize DataAnalyze DataAnalyze Data
Draw Conclusions
Draw Conclusions
Use conclusions to develop a new hypothesis

The Management ProcessApplies the Scientific Method (PDCA cycle)
to Management Systems . . .
Activities
adjusted
Activities executed
Results reported
Activities planned
Problems
InvestigatedRCs & CFs Identified
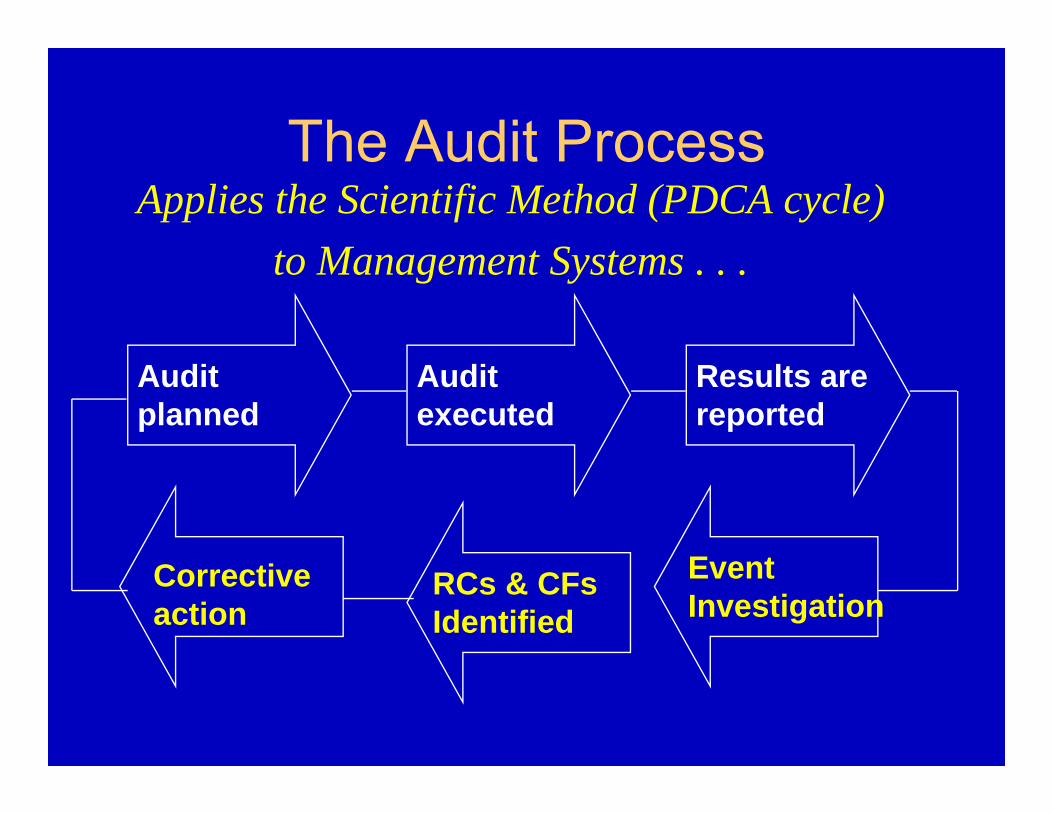
The Audit ProcessApplies the Scientific Method (PDCA cycle)
to Management Systems . . .
Corrective action
Audit executed
Results are reported
Audit planned
Event Investigation
RCs & CFs Identified
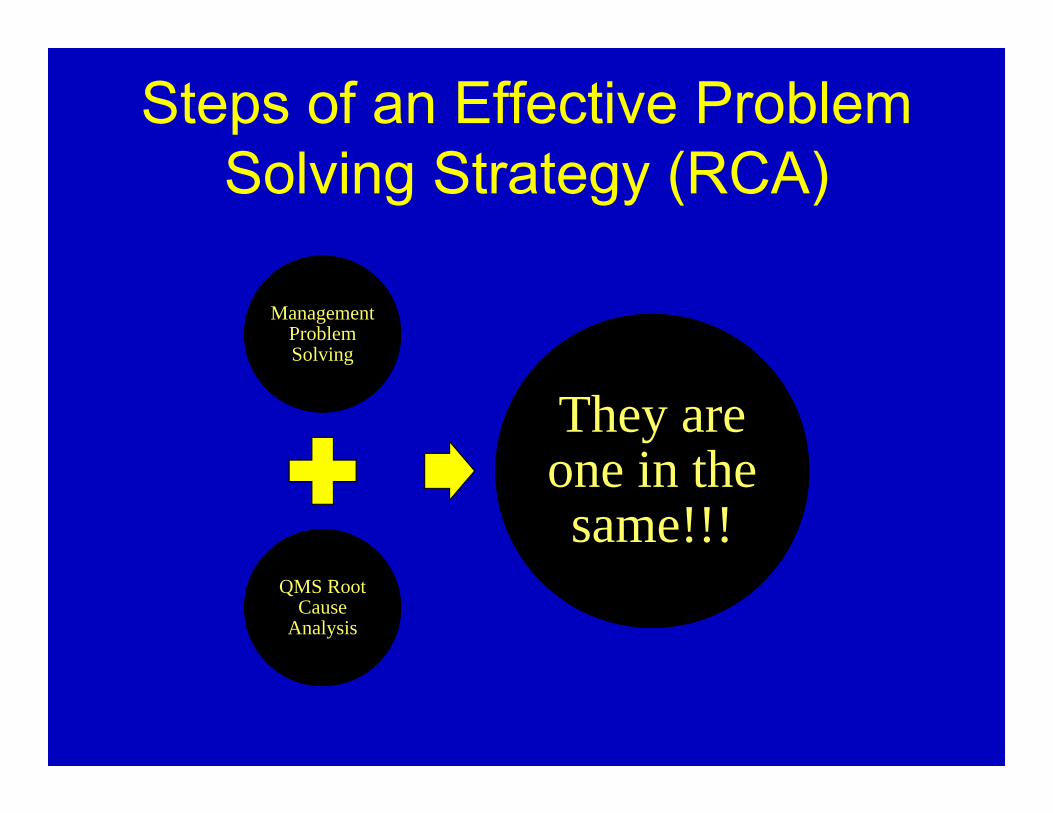
Steps of an Effective Problem Solving Strategy (RCA)
Management Problem Solving
Management Problem Solving
QMS Root Cause
Analysis
QMS Root Cause
Analysis
They are one in the same!!!
They are one in the same!!!
So, where do Management Problems come from?
From unintended results!
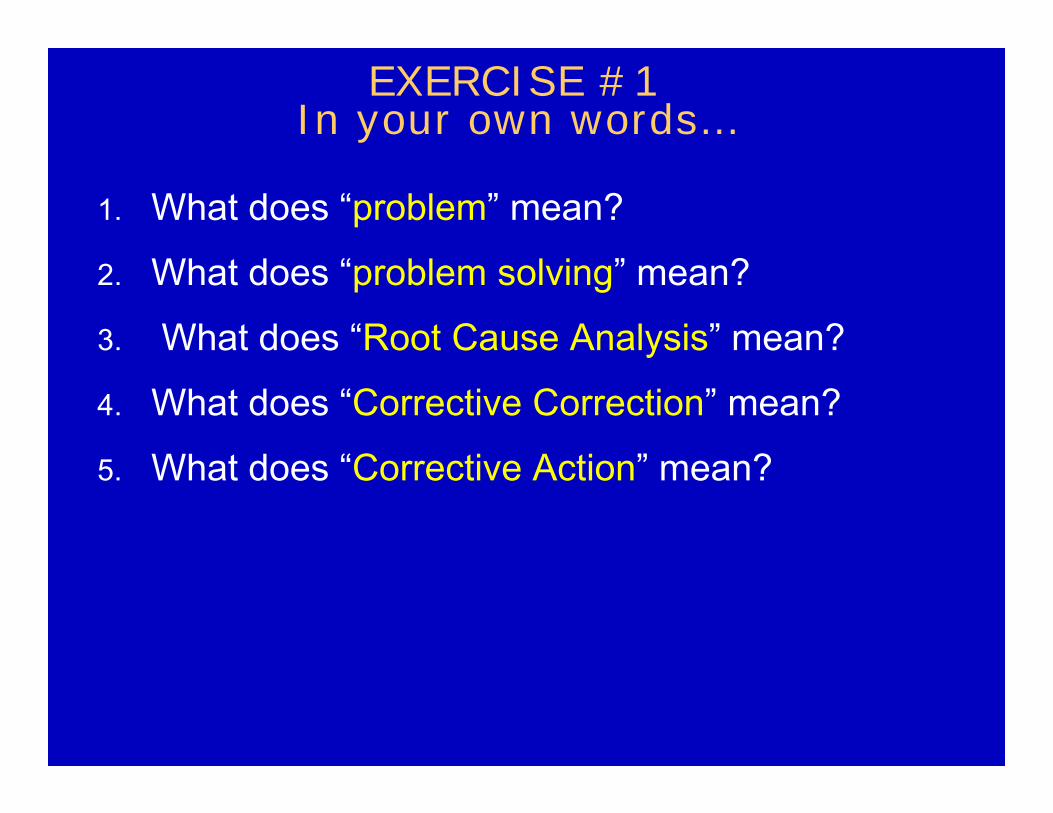
EXERCISE #1In your own words…
1. What does “problem” mean?
2. What does “problem solving” mean?
3. What does “Root Cause Analysis” mean?
4. What does “Corrective Correction” mean?
5. What does “Corrective Action” mean?

5 Steps to an Effective Problem-Solving Strategy
1. Conduct Investigation (Data Collection)
2. Perform Root Cause Analysis(using problem-solving management tools)
3. Implement Corrective Actions
4. Report your Results
5. Follow Up to Prevent Recurrence

Management Problem-Solving Tools
Used by hundreds of major corporations including: Boeing, Airbus, NASA, Lockheed, Apple, Microsoft, GE, ASQ, major universities, FAA, DOD, ICAO etc.
Six Sigma, Lean Manufacturing, Certified Quality Managers.
Taught at major universities in Quality Management, Industrial engineering, Operations Management & MBA programs.

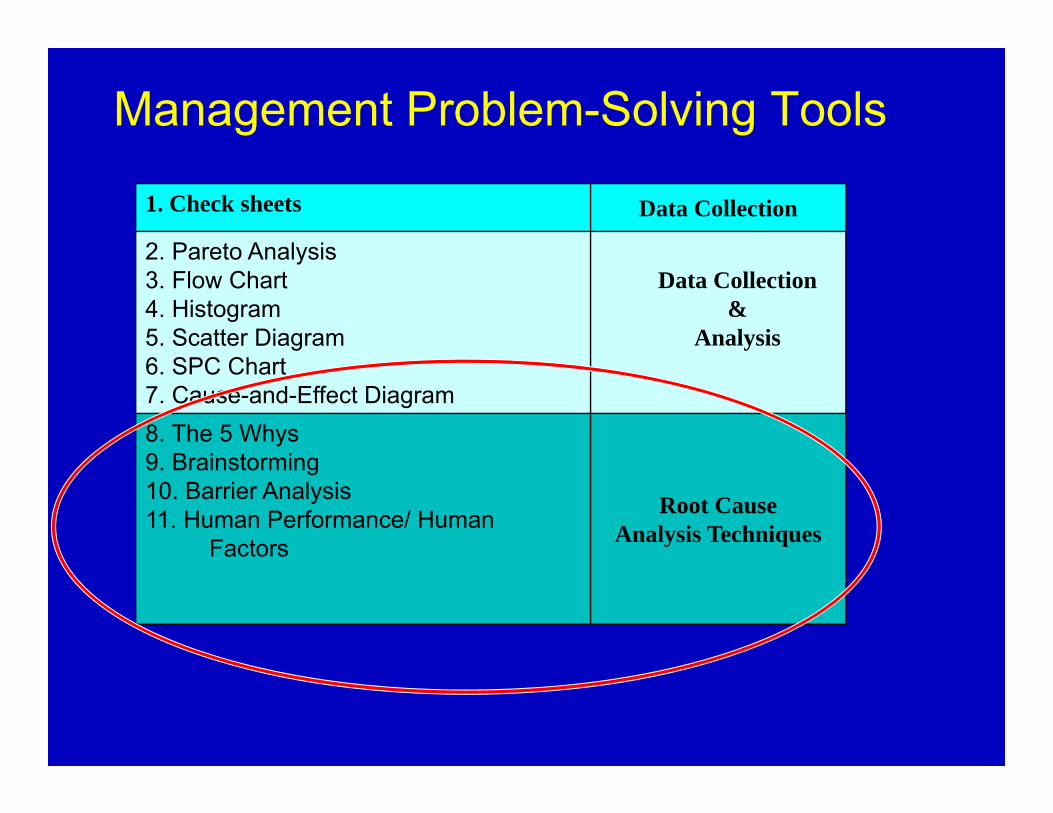
Management Problem-Solving Tools
Check sheets Data Collection
Pareto AnalysisFlow ChartHistogramScatter DiagramSPC ChartCause-and-Effect Diagram
Data Collection &
Analysis
The 5 WhysBrainstormingBarrier AnalysisHuman Performance/ Human Factors Root Cause
Analysis Techniques
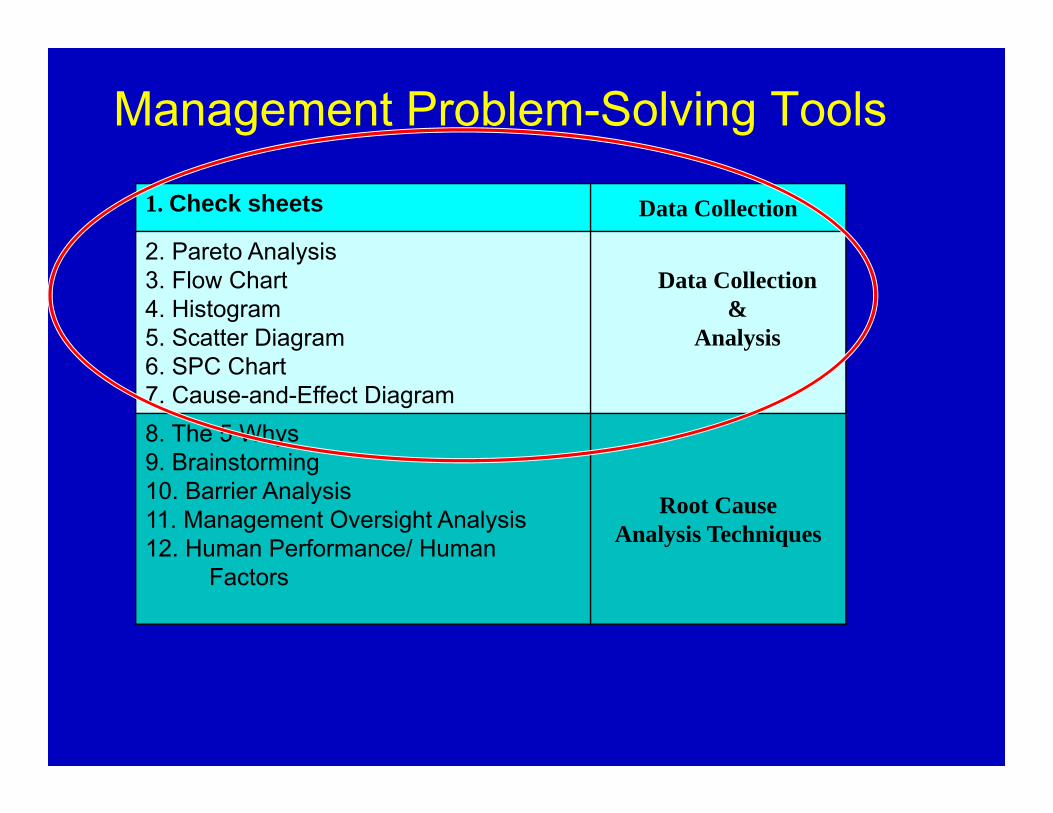
Management Problem-Solving Tools
1. Check sheets Data Collection
2. Pareto Analysis3. Flow Chart4. Histogram5. Scatter Diagram6. SPC Chart7. Cause-and-Effect Diagram
Data Collection &
Analysis
8. The 5 Whys9. Brainstorming10. Barrier Analysis11. Management Oversight Analysis12. Human Performance/ Human
Factors
Root Cause Analysis Techniques
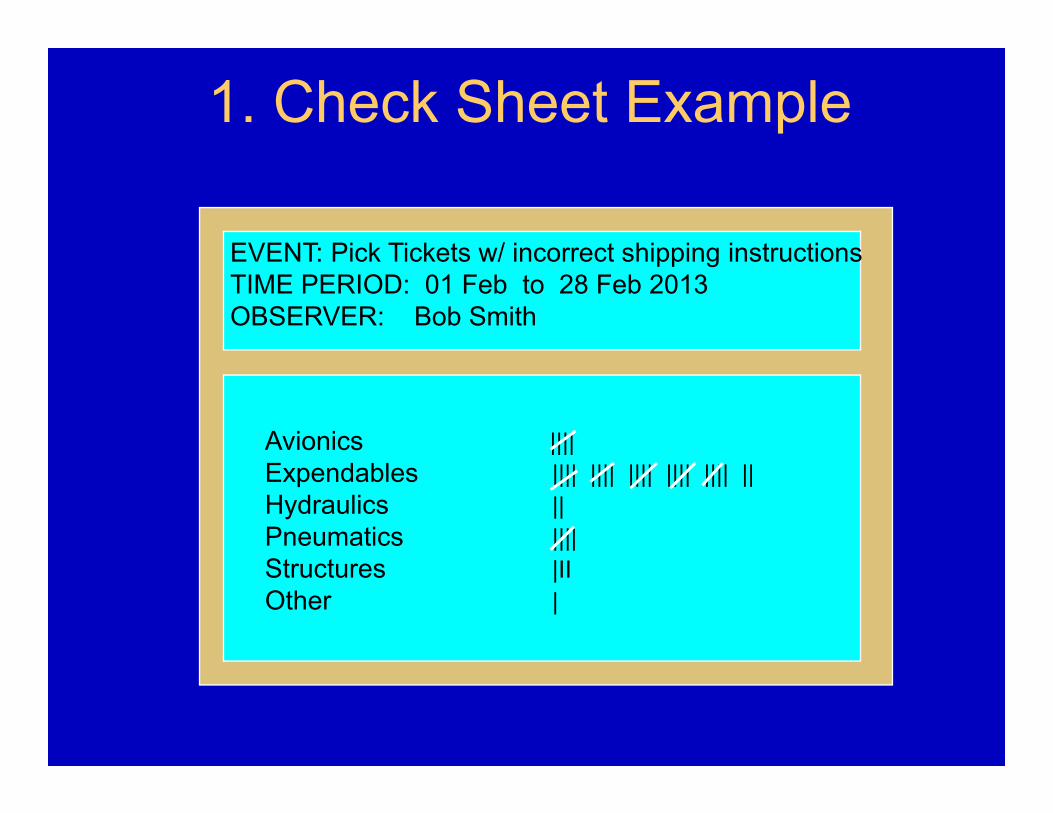
1. Check Sheet Example
EVENT: Pick Tickets w/ incorrect shipping instructionsTIME PERIOD: 01 Feb to 28 Feb 2013OBSERVER: Bob Smith
Avionics ||||Expendables |||| |||| |||| |||| |||| ||Hydraulics ||Pneumatics ||||Structures |IIOther |

2. Pareto AnalysisNUMBER OF
CAUSE DEFECTS PERCENTAGE
Poor design 80 64 %Wrong part dimensions 16 13Defective parts 12 10Incorrect machine calibration 7 6Operator errors 4 3Defective material 3 2Surface abrasions 3 2
125 100 %
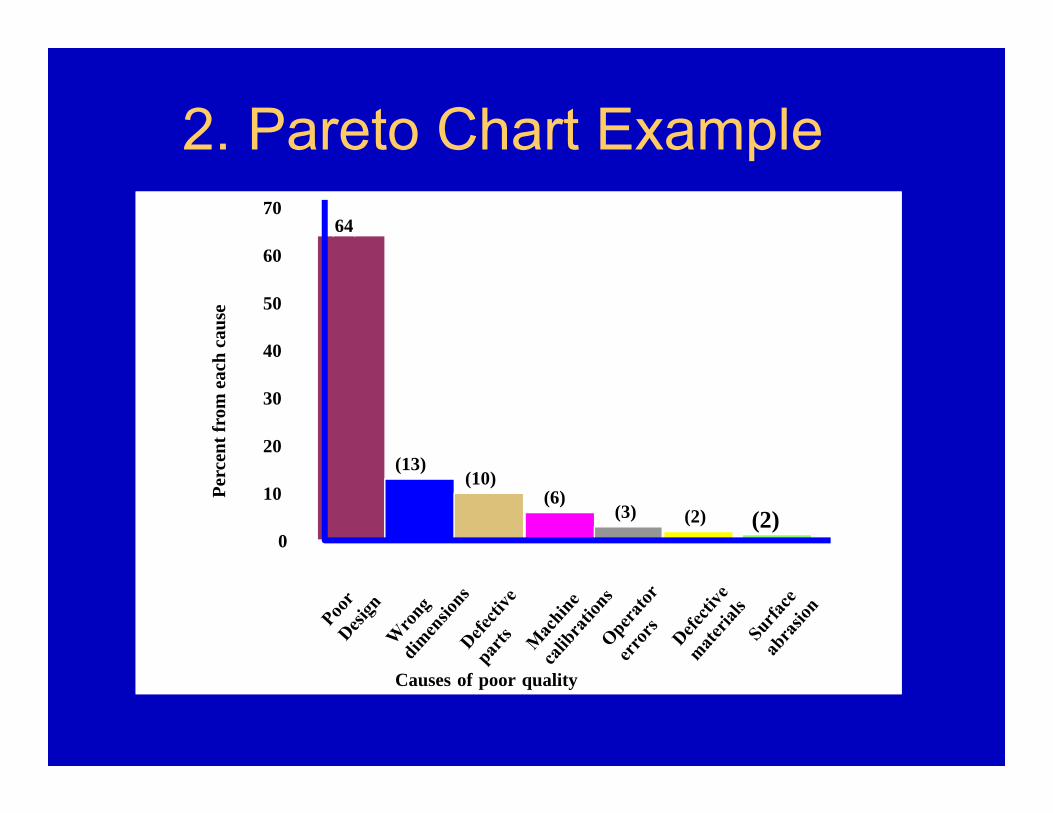
2. Pareto Chart ExamplePe
rcen
t fro
m e
ach
caus
e
Causes of poor quality
0
10
20
30
40
50
60
70(64)
(13)(10)
(6)(3) (2) (2)

3. Flow Chart
Start/ Finish
OperationOperation
Decision
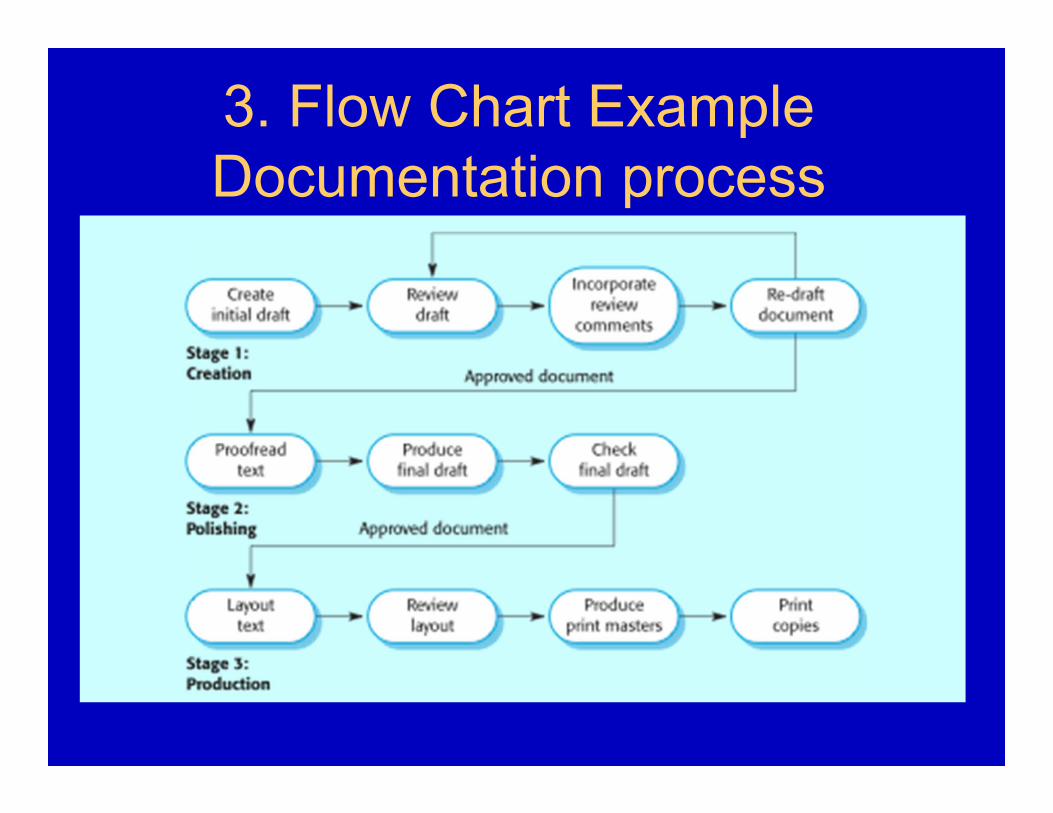
3. Flow Chart ExampleDocumentation process
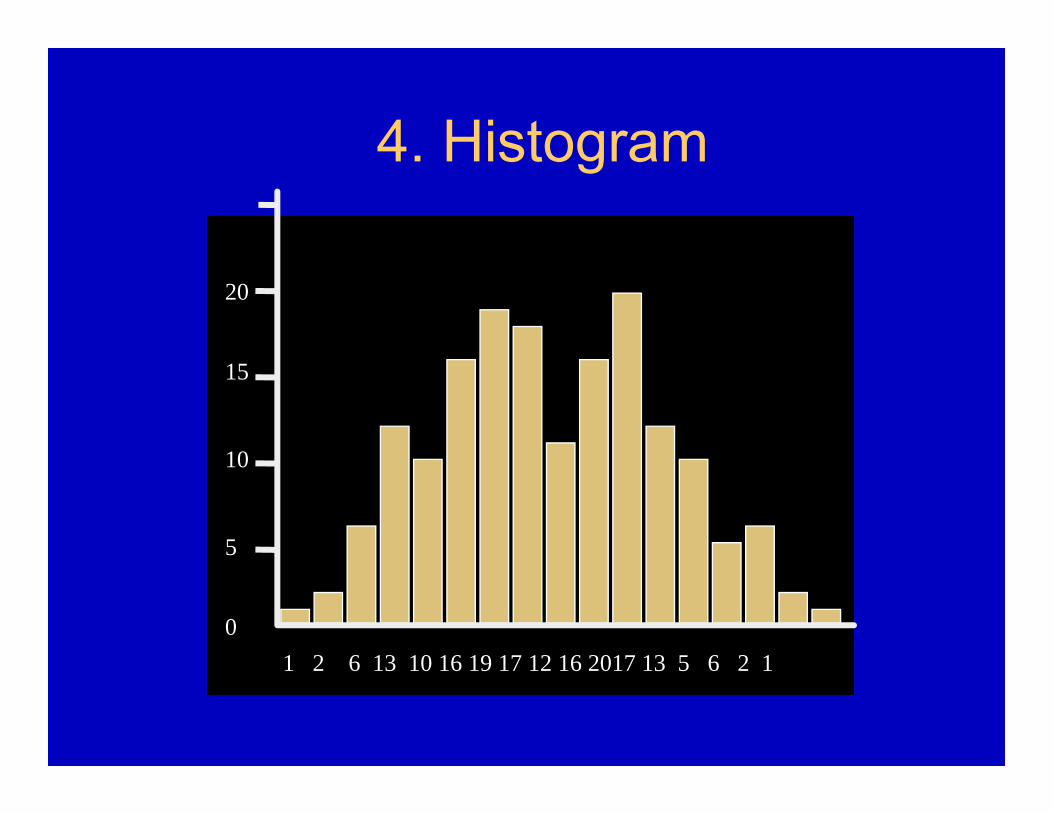
4. Histogram
0
5
10
15
20
1 2 6 13 10 16 19 17 12 16 2017 13 5 6 2 1
4. Histogram• Bar-graph used to show the distribution of a set
of data• Helps determine:
• If a process is in control (steady-state; bell-shaped
• If outcomes of two processes are combined in one set of data (Bi-modal; double-hump)
– e. g. day-shift & night-shift; airline customers and distributor-customers
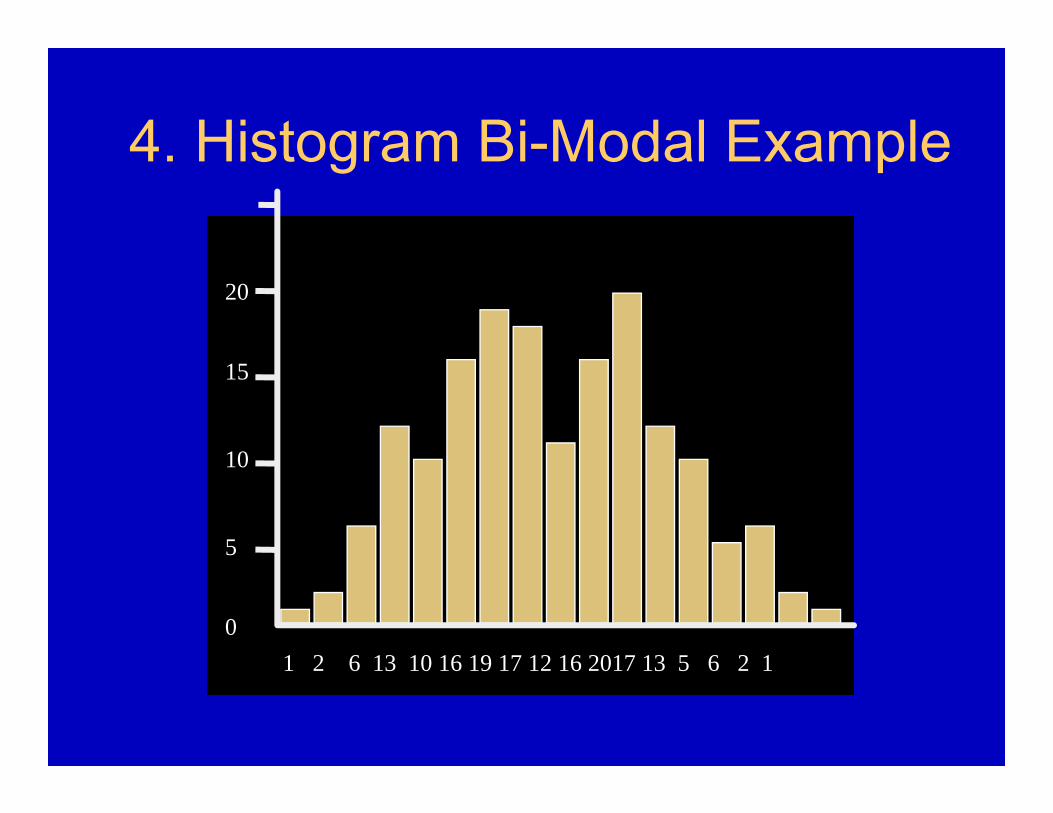
4. Histogram Bi-Modal Example
0
5
10
15
20
1 2 6 13 10 16 19 17 12 16 2017 13 5 6 2 1
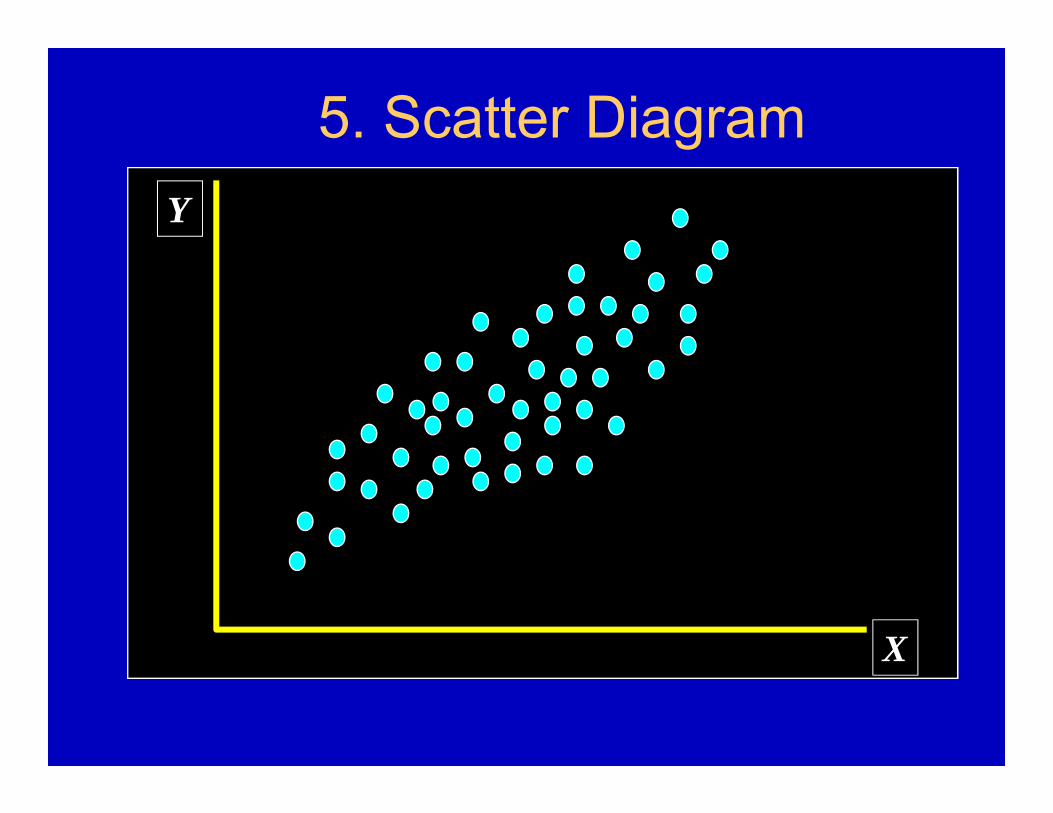
5. Scatter DiagramY
X

Your boss wants to improve efficiency in your inventory operations. The current process to receive and stock bulk inventory takes 4 ¾ hours per crate. Your boss has proposed a new process. You conducted a test and gathered the following data that describes the new proposed process. The data is shown below:
New Proposed Process Test ResultsTrial 1 2 3 4 5 6 7 8Time (Hours) 7.5 6.4 5.8 5.4 5.1 4.9 4.8 4.6
Comparing ProcessesCurrent process Average = 4.75 hours/process
Proposed new process Average = 5.6 hours/process Range = 4.6 to 7.5 hours/process
A rival department head doesn’t like your boss, doesn’t like change, and believes in sticking with the current “tried-and-true” process. He wants to leave things “just the way they are”! The rival has evaluated the above data (your data!) to support his position. Based on his review (of your data!) he claims your boss’s new process will require 5 hours and sometimes up to 7 ½ hours per crate; a possible 68% increase in workload above the way things are being done now! He chants in the halls, “Don't fix what’s not broken!” Your boss and the rival supervisor have been called into the President’s office to settle this matter and make an executive decision to either: (1) Roll out your boss’s new process, or (2) Abandon the new idea and leave things the way they are.
5. Class Exercise
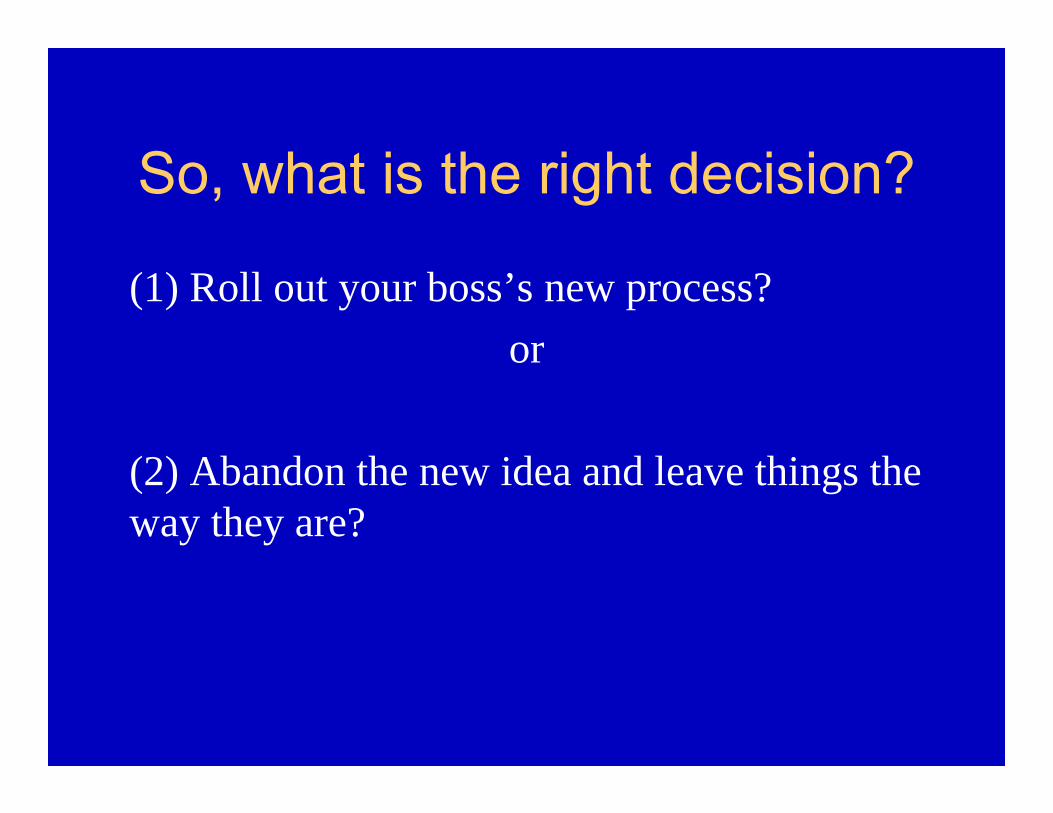
So, what is the right decision?
(1) Roll out your boss’s new process?or
(2) Abandon the new idea and leave things the way they are?

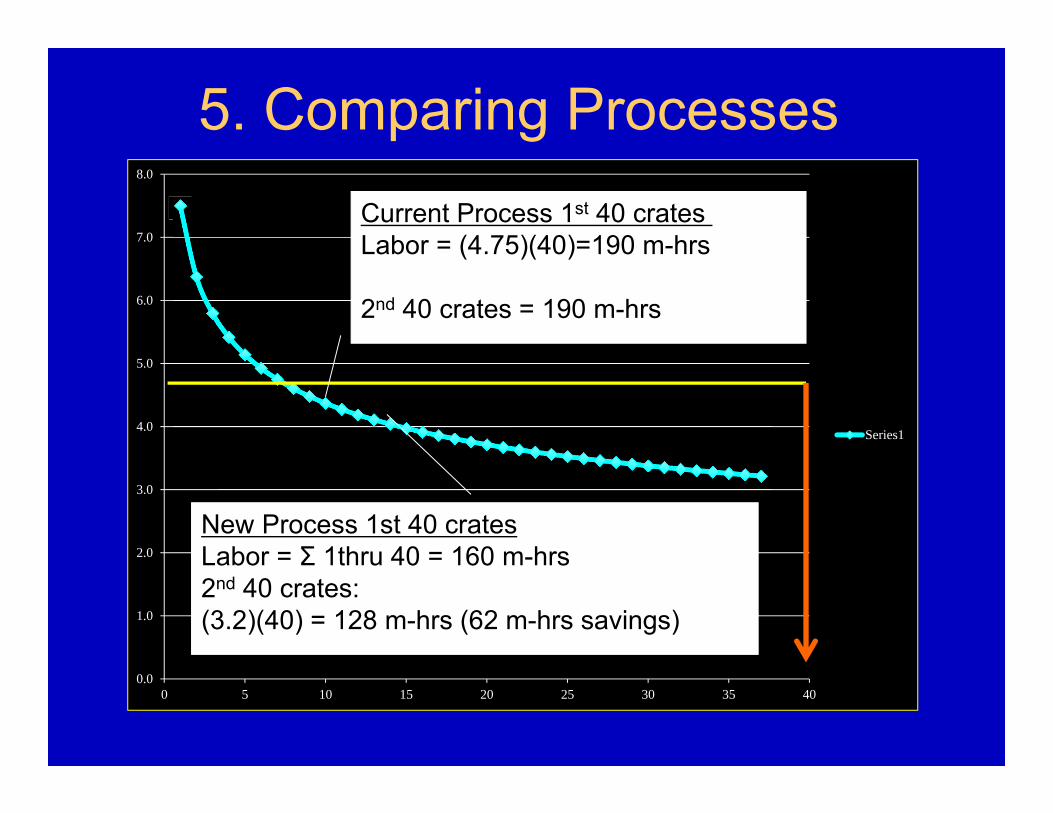
5. Comparing Processes
0.0
1.0
2.0
3.0
4.0
5.0
6.0
7.0
8.0
0 5 10 15 20 25 30 35 40
Series1
New Process
Current Process
5. Comparing Processes
0.0
1.0
2.0
3.0
4.0
5.0
6.0
7.0
8.0
0 5 10 15 20 25 30 35 40
Series1
New Process 1st 40 cratesLabor = Σ 1thru 40 = 160 m-hrs2nd 40 crates:(3.2)(40) = 128 m-hrs (62 m-hrs savings)
Current Process 1st 40 crates Labor = (4.75)(40)=190 m-hrs
2nd 40 crates = 190 m-hrs

6. Control Chart
18
12
6
3
9
15
21
24
2 4 6 8 10 12 14 16
Sample number
Num
ber
of d
efec
ts
UCL = 23.35
LCL = 1.99
c = 12.67
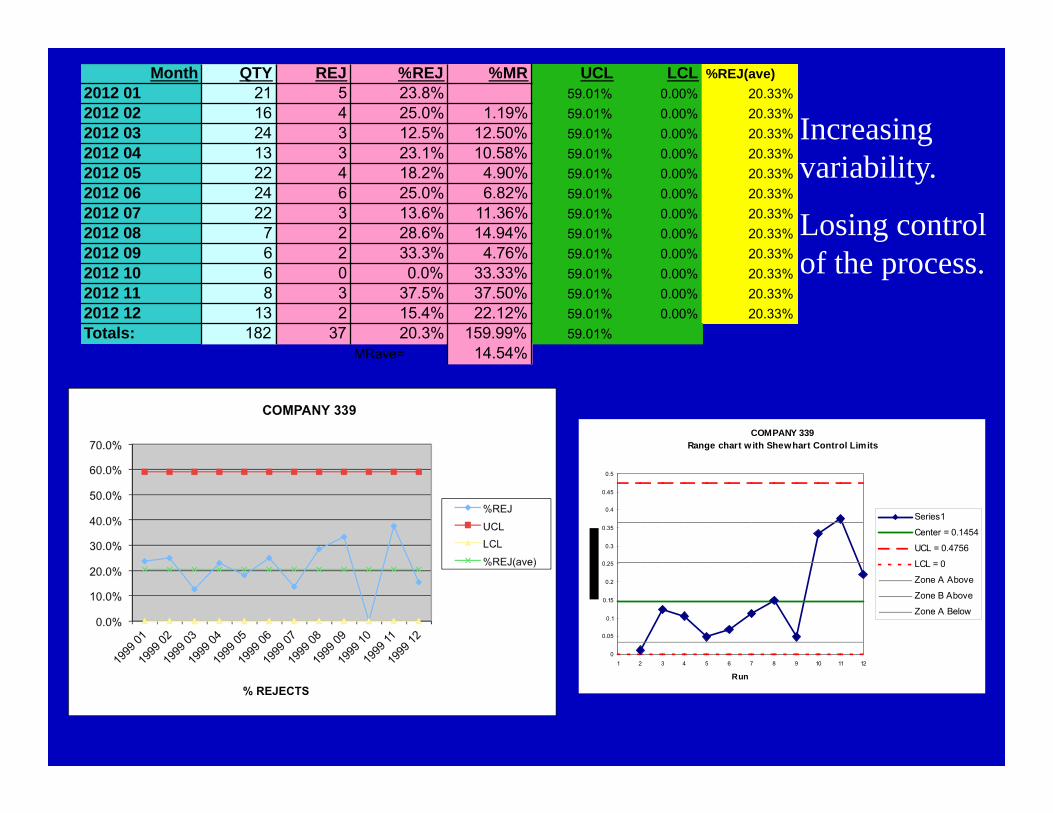
Month QTY REJ %REJ %MR UCL LCL %REJ(ave)2012 01 21 5 23.8% 59.01% 0.00% 20.33%2012 02 16 4 25.0% 1.19% 59.01% 0.00% 20.33%2012 03 24 3 12.5% 12.50% 59.01% 0.00% 20.33%2012 04 13 3 23.1% 10.58% 59.01% 0.00% 20.33%2012 05 22 4 18.2% 4.90% 59.01% 0.00% 20.33%2012 06 24 6 25.0% 6.82% 59.01% 0.00% 20.33%2012 07 22 3 13.6% 11.36% 59.01% 0.00% 20.33%2012 08 7 2 28.6% 14.94% 59.01% 0.00% 20.33%2012 09 6 2 33.3% 4.76% 59.01% 0.00% 20.33%2012 10 6 0 0.0% 33.33% 59.01% 0.00% 20.33%2012 11 8 3 37.5% 37.50% 59.01% 0.00% 20.33%2012 12 13 2 15.4% 22.12% 59.01% 0.00% 20.33%Totals: 182 37 20.3% 159.99% 59.01%
MRave= 14.54%
Increasing variability.
Losing control of the process.
COMPANY 339 Range chart w ith Shewhart Control Limits
0
0.05
0.1
0.15
0.2
0.25
0.3
0.35
0.4
0.45
0.5
1 2 3 4 5 6 7 8 9 10 11 12
Run
Series1
Center = 0.1454
UCL = 0.4756
LCL = 0
Zone A Above
Zone B Above
Zone A Below
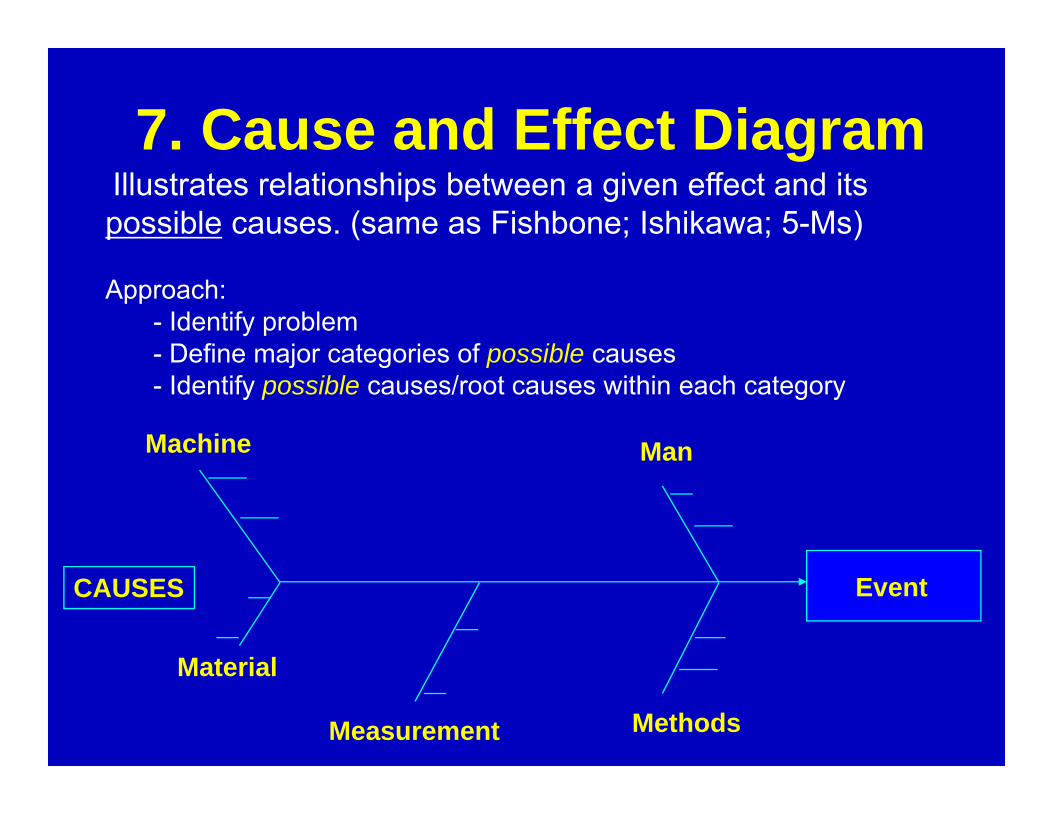
7. Cause and Effect Diagram
CAUSES
Illustrates relationships between a given effect and its possible causes. (same as Fishbone; Ishikawa; 5-Ms)
Approach:- Identify problem- Define major categories of possible causes- Identify possible causes/root causes within each category
Event
Machine Man
Material
MethodsMeasurement

7. Cause-Effect Diagram
QualityProblem
Out of adjustment
Tooling problems
Old / worn
MachinesFaultytesting equipment
Incorrect specifications
Improper methods
Measurement
Poor supervision
Lack of concentration
Inadequate training
Human
Deficienciesin product design
Ineffective qualitymanagement
Poor process design
( )Methods(Process)
Inaccuratetemperature control
Dust and Dirt
Environment
Defective from vendor
Not to specifications
Material-handling problems
Materials
Management Problem-Solving Tools
1. Check sheets Data Collection
2. Pareto Analysis3. Flow Chart4. Histogram5. Scatter Diagram6. SPC Chart7. Cause-and-Effect Diagram
Data Collection &
Analysis
8. The 5 Whys9. Brainstorming10. Barrier Analysis11. Human Performance/ Human
Factors
Root Cause Analysis Techniques
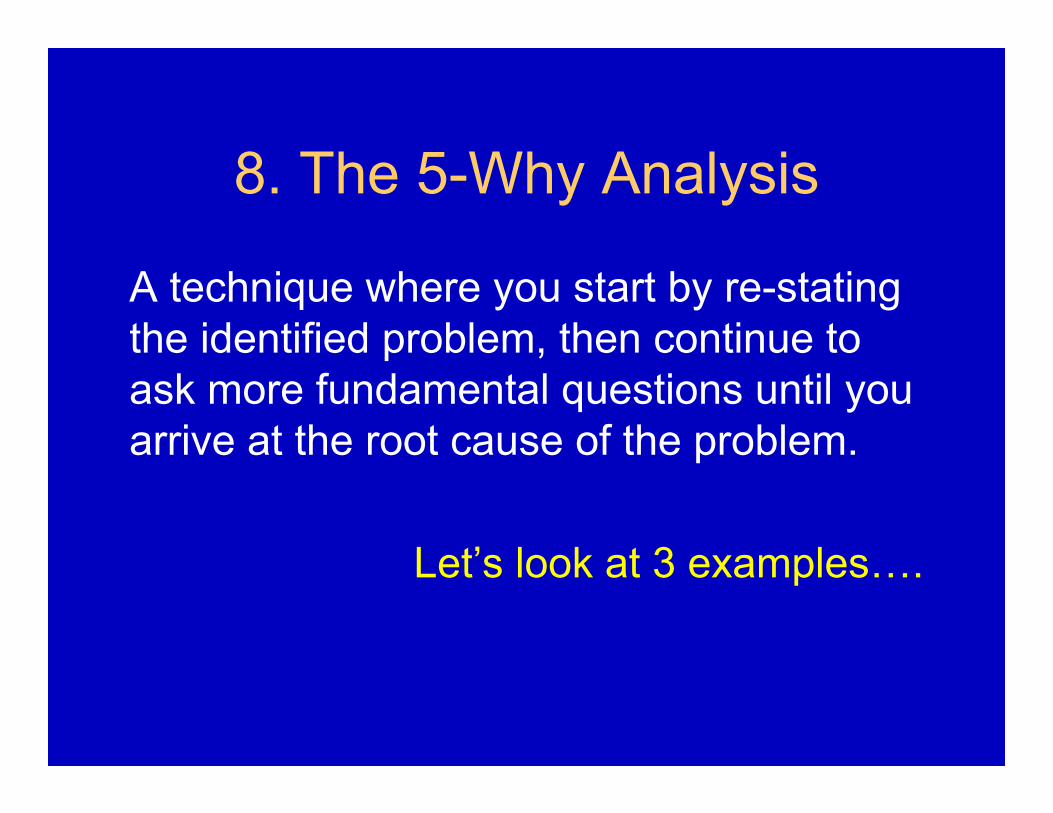
8. The 5-Why Analysis
A technique where you start by re-stating the identified problem, then continue to ask more fundamental questions until you arrive at the root cause of the problem.
Let’s look at 3 examples….
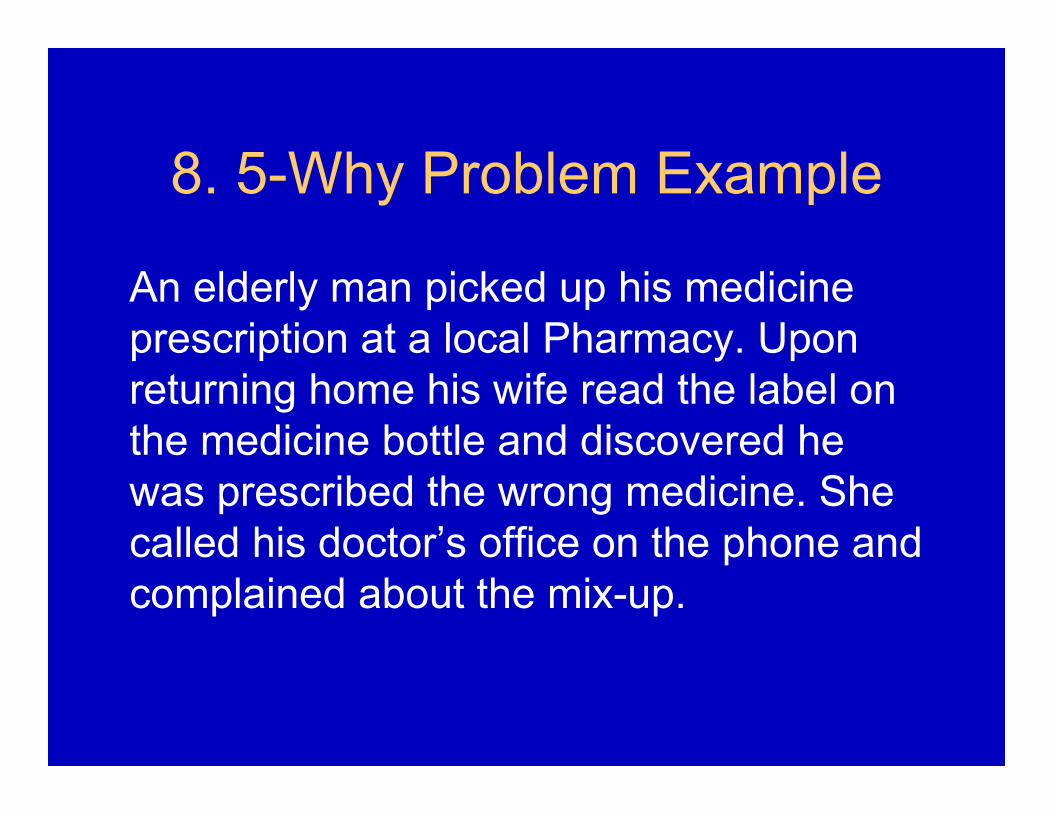
8. 5-Why Problem Example
An elderly man picked up his medicine prescription at a local Pharmacy. Upon returning home his wife read the label on the medicine bottle and discovered he was prescribed the wrong medicine. She called his doctor’s office on the phone and complained about the mix-up.
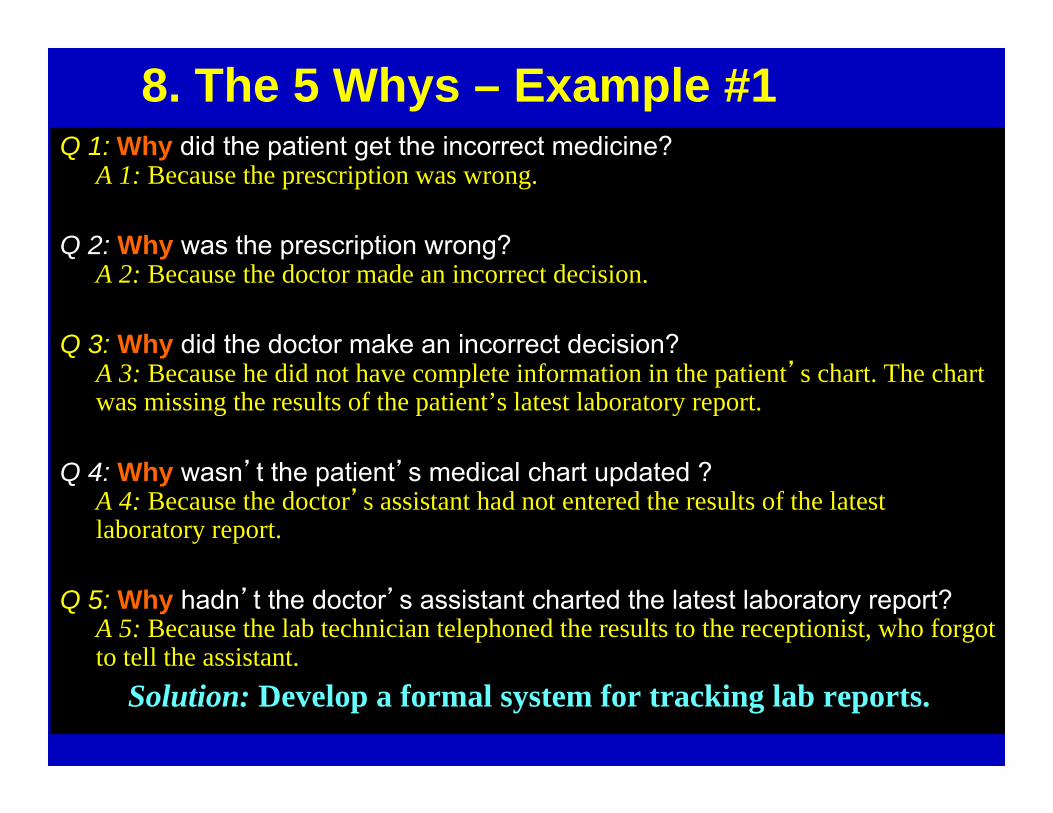
8. The 5 Whys – Example #1Q 1: Why did the patient get the incorrect medicine?
A 1: Because the prescription was wrong.
Q 2: Why was the prescription wrong? A 2: Because the doctor made an incorrect decision.
Q 3: Why did the doctor make an incorrect decision?A 3: Because he did not have complete information in the patient’s chart. The chart was missing the results of the patient’s latest laboratory report.
Q 4: Why wasn’t the patient’s medical chart updated ? A 4: Because the doctor’s assistant had not entered the results of the latest laboratory report.
Q 5: Why hadn’t the doctor’s assistant charted the latest laboratory report?A 5: Because the lab technician telephoned the results to the receptionist, who forgot to tell the assistant.
Solution: Develop a formal system for tracking lab reports.
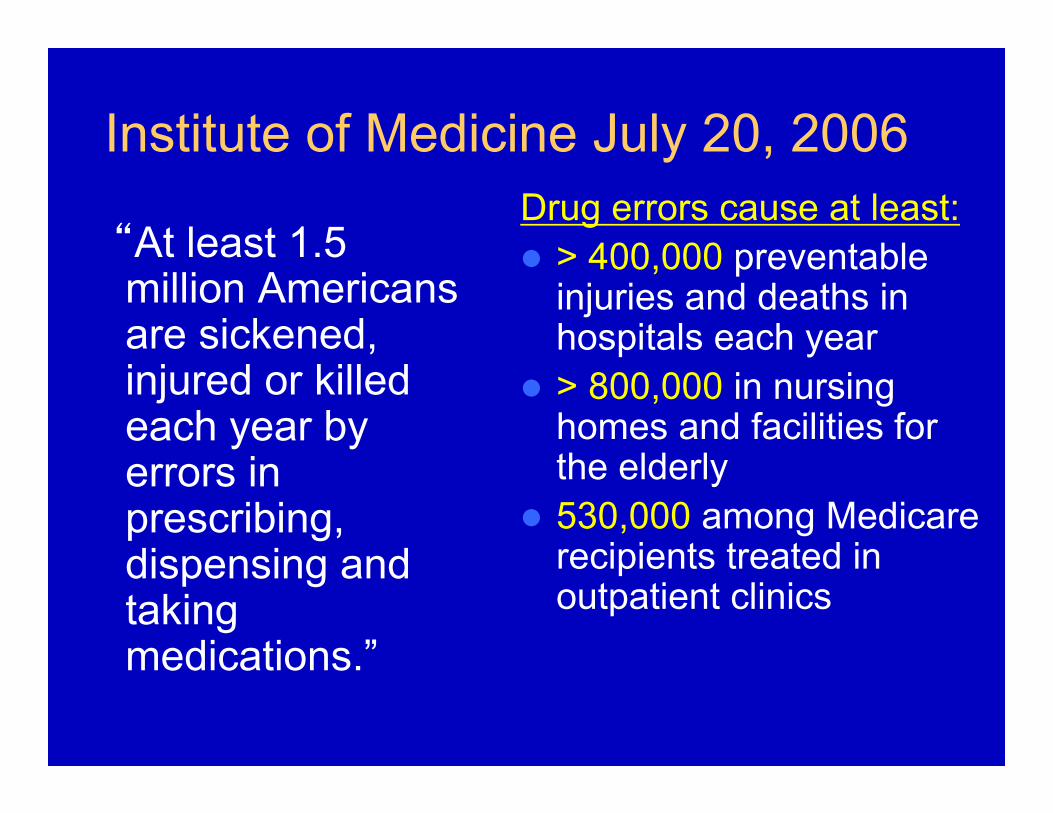
Institute of Medicine July 20, 2006
“At least 1.5 million Americans are sickened, injured or killed each year by errors in prescribing, dispensing and taking medications.”
Drug errors cause at least: > 400,000 preventable
injuries and deaths in hospitals each year
> 800,000 in nursing homes and facilities for the elderly
530,000 among Medicare recipients treated in outpatient clinics
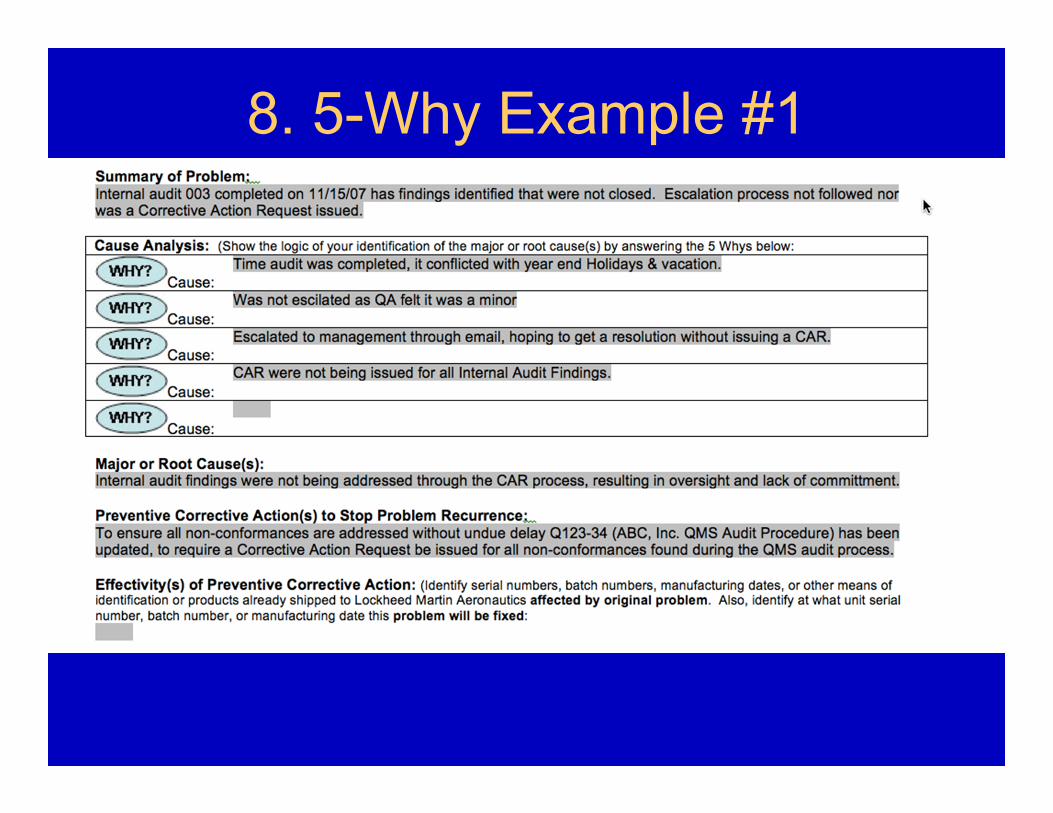
8. 5-Why Example #1
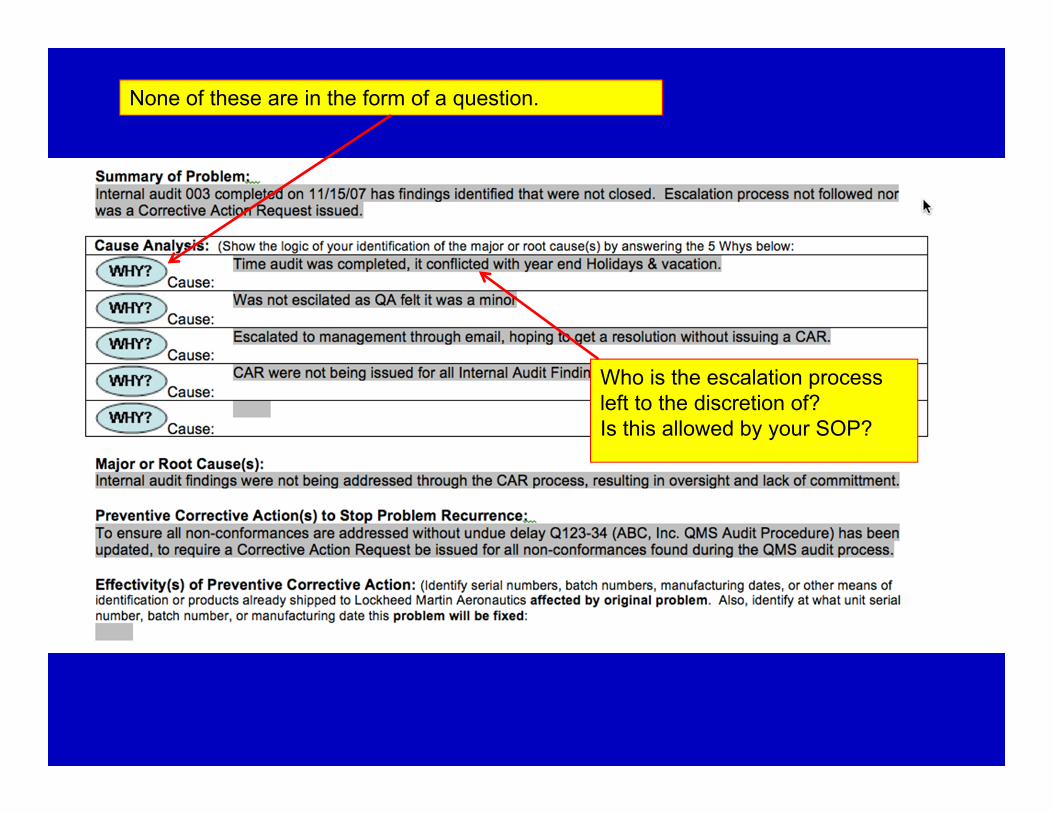
Who is the escalation process left to the discretion of? Is this allowed by your SOP?
None of these are in the form of a question.
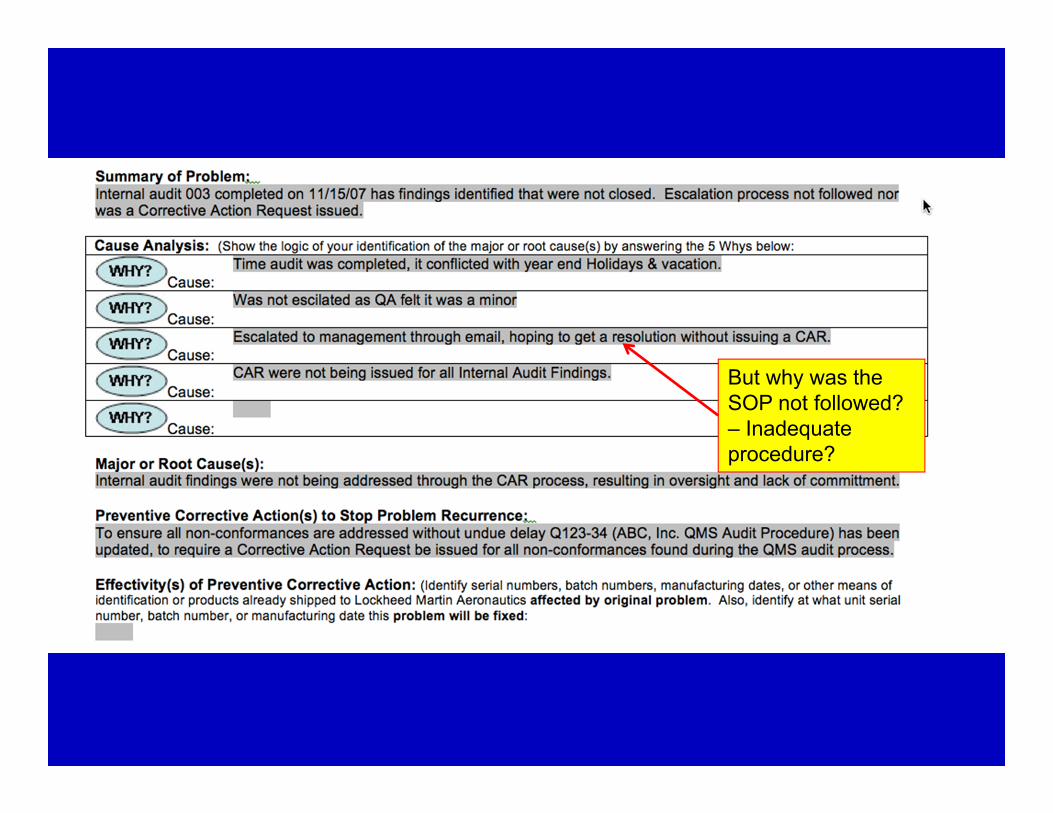
But why was the SOP not followed? – Inadequate procedure?
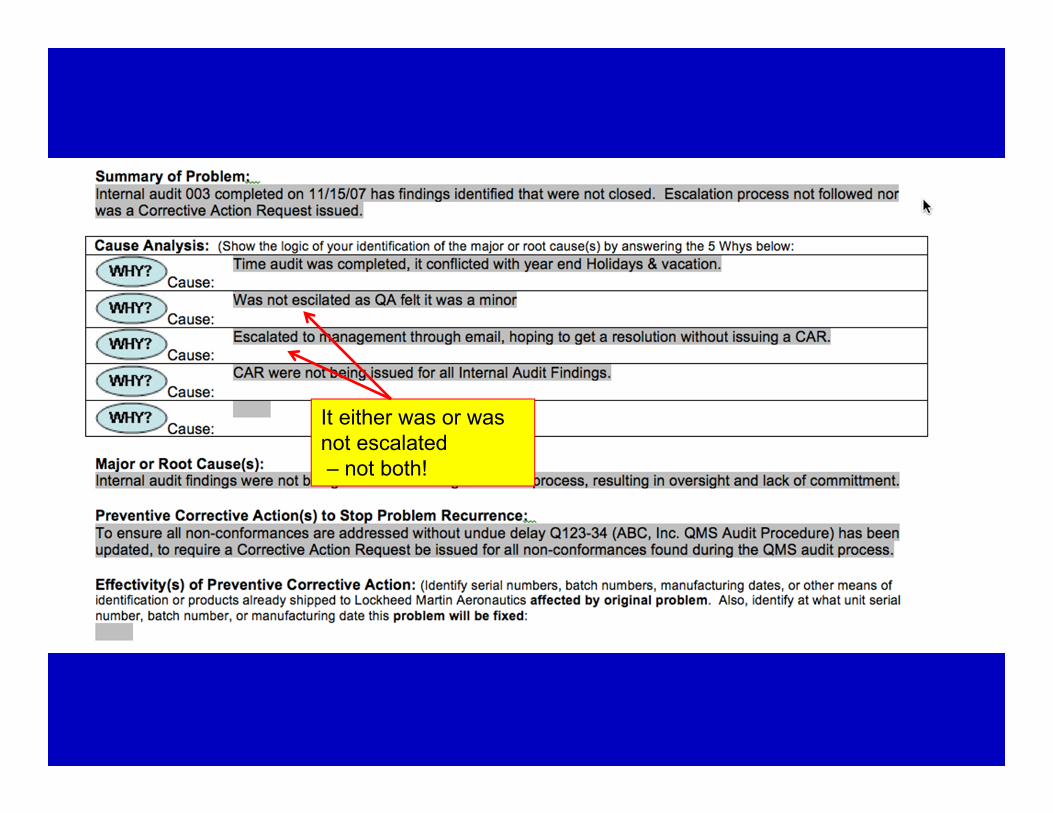
It either was or was not escalated– not both!

Why not!?

This is just a restatement of the finding and is not a root cause.You need to address why CARs take a backseat to vacations & Holiday schedules. For instance, is this a symptom of lack of Top Management commitment? Some digging may be required here.

What are your plans to train employees and top management in the revised procedures?

Who is the escalation process left to the discretion of? Is this allowed by your SOP?
But why wasn’t the SOP followed? – Inadequate procedure?
It either was or was not escalated– not both!
Why not!?
This is just a restatement of the finding and is not a root cause.You need to address why CARs take a backseat to vacations & Holiday schedules. For instance, is this a symptom of lack of Top Management commitment? Some digging may be required here.
What are your plans to train employees and top management in the revised procedures?
8. 5-Why Example #3
(Let’s revisit Sally!)
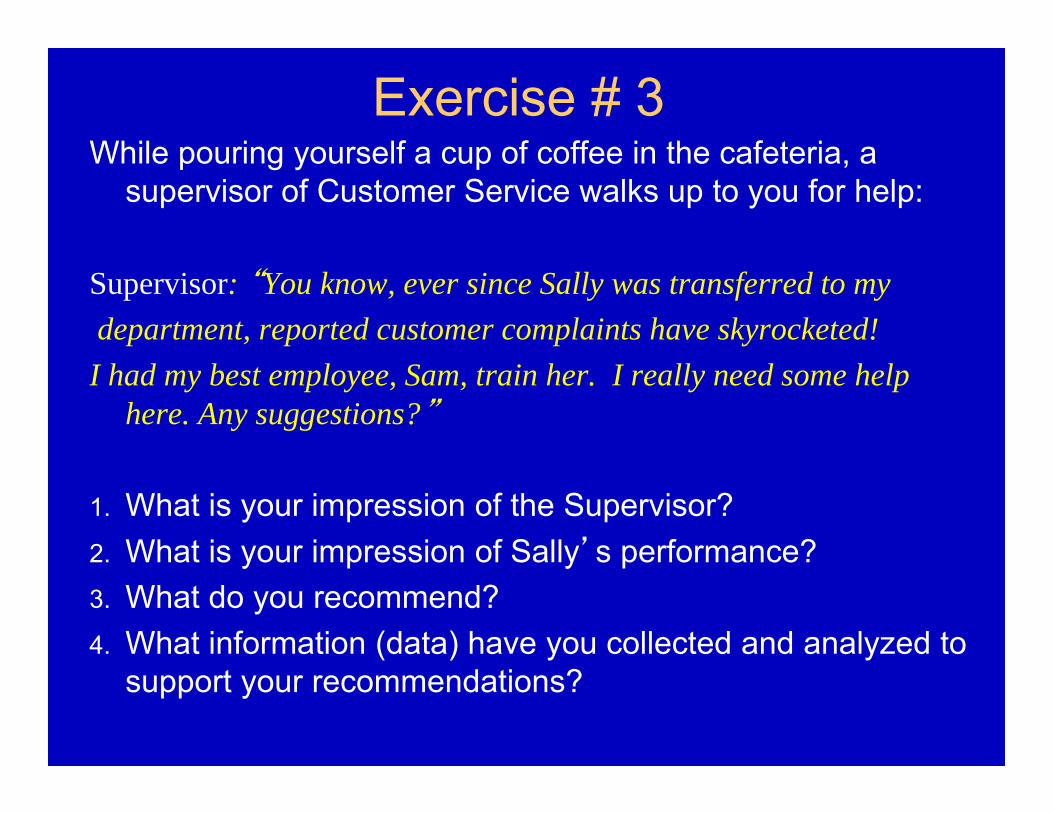
Exercise # 3While pouring yourself a cup of coffee in the cafeteria, a
supervisor of Customer Service walks up to you for help:
Supervisor: “You know, ever since Sally was transferred to my department, reported customer complaints have skyrocketed!I had my best employee, Sam, train her. I really need some help
here. Any suggestions?”
1. What is your impression of the Supervisor?2. What is your impression of Sally’s performance?3. What do you recommend?4. What information (data) have you collected and analyzed to
support your recommendations?
Step #1 Perform Event Investigation:
Supervisor: “You know, ever since Sally was transferred to my department, reported customer complaints have skyrocketed! I had my best employee, Sam, train her. I really need some help here. Any suggestions?”
So, what exactly is the problem?...
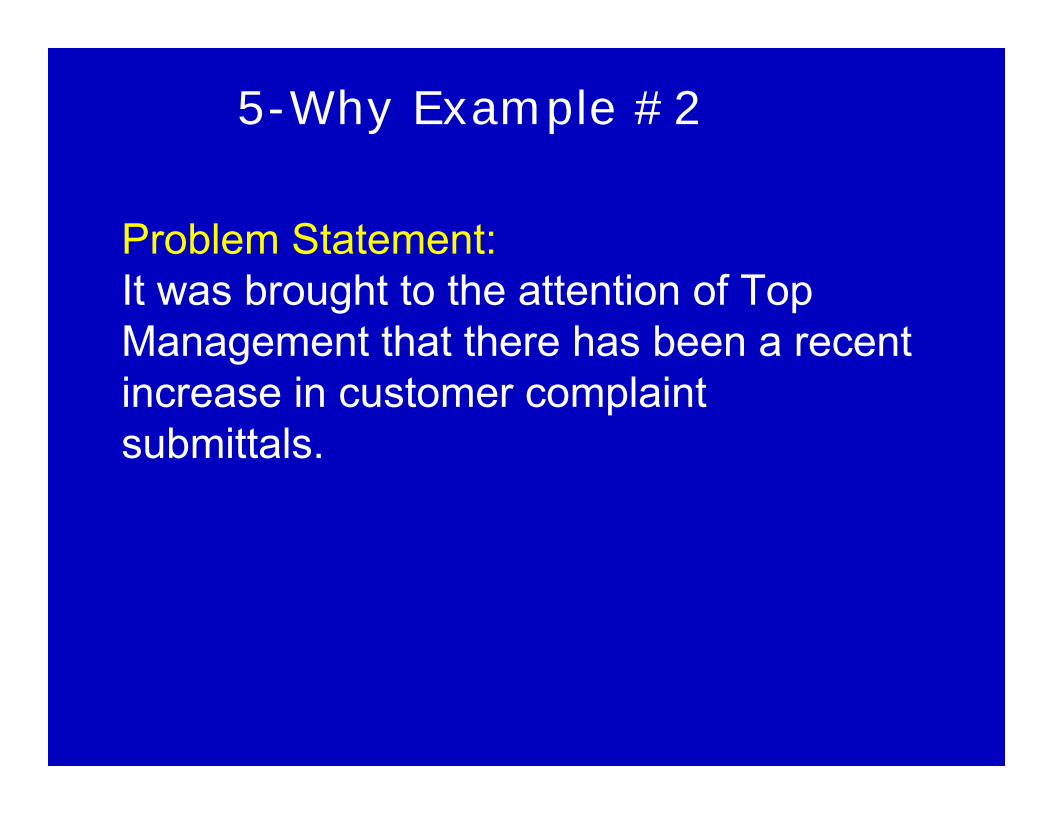
Problem Statement:It was brought to the attention of Top Management that there has been a recent increase in customer complaint submittals.
5-Why Example #2

Conduct InterviewsSupervisor: “You know, ever since Sally was transferred to my
department, reported customer complaints have skyrocketed! Sam trained her. I really need some help here. Any suggestions?”
Sally: When Sam trained me before I took over full-time he told me I didn’t need to complete the Customer Complaint form, even though it is required by Procedure A02. The procedure isn’t very clearly written but it requires the form to be completed and forwarded to the CS Manager for every customer complaint received, so that’s what I do.
Sam: The Customer Complaint form? Sally shouldn’t be using it. It’s a waste of time to fill them out! I’ve been here for over 10 years and nobody ever reads those forms. We stopped using that ‘ole thing long ago. Don’t worry, if there’s a real complaint we fix it right on the spot! We don’t need a form to tell us what to do. We’ve always done it this way!

Review current CS Procedure A02
A review of the Customer Service Procedure was conducted and Section 7 was found to be ambiguous with respect to the use of the Customer Complaint form. See below except from Procedure A02:
“Section 7: Any customer complaints should be documented and
responded to by the CS Manager (ref: Form # 123).”
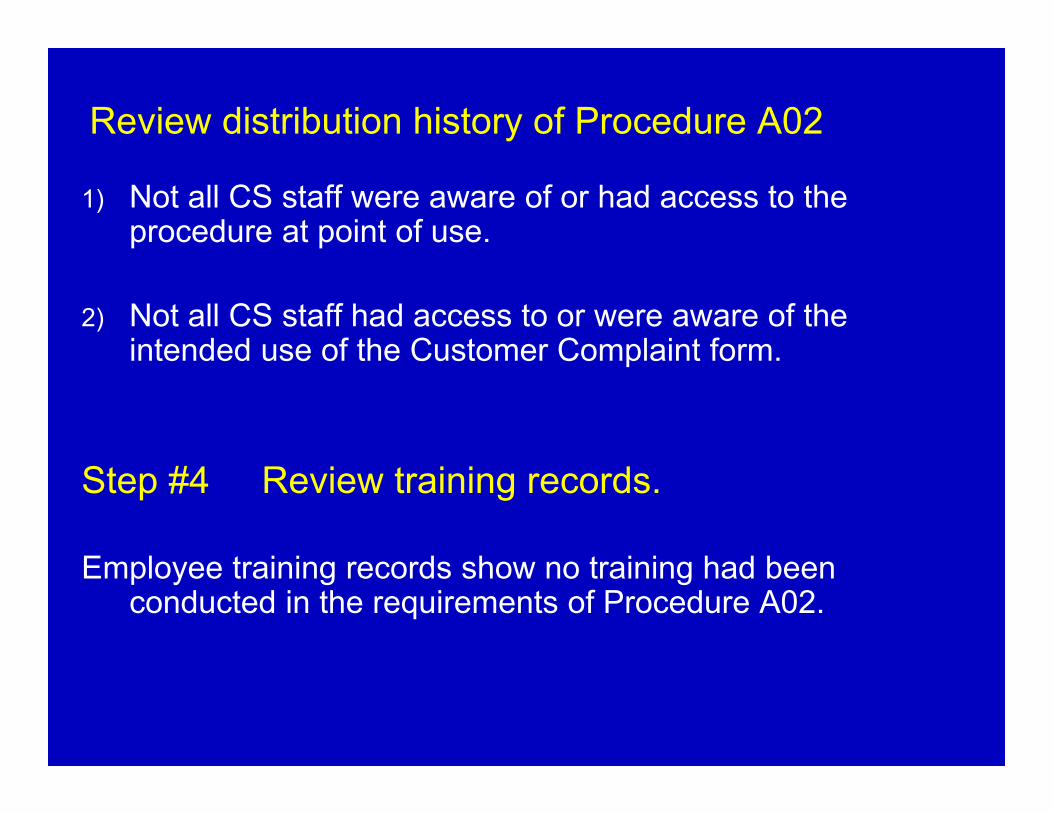
Review distribution history of Procedure A02
1) Not all CS staff were aware of or had access to the procedure at point of use.
2) Not all CS staff had access to or were aware of the intended use of the Customer Complaint form.
Step #4 Review training records.
Employee training records show no training had been conducted in the requirements of Procedure A02.
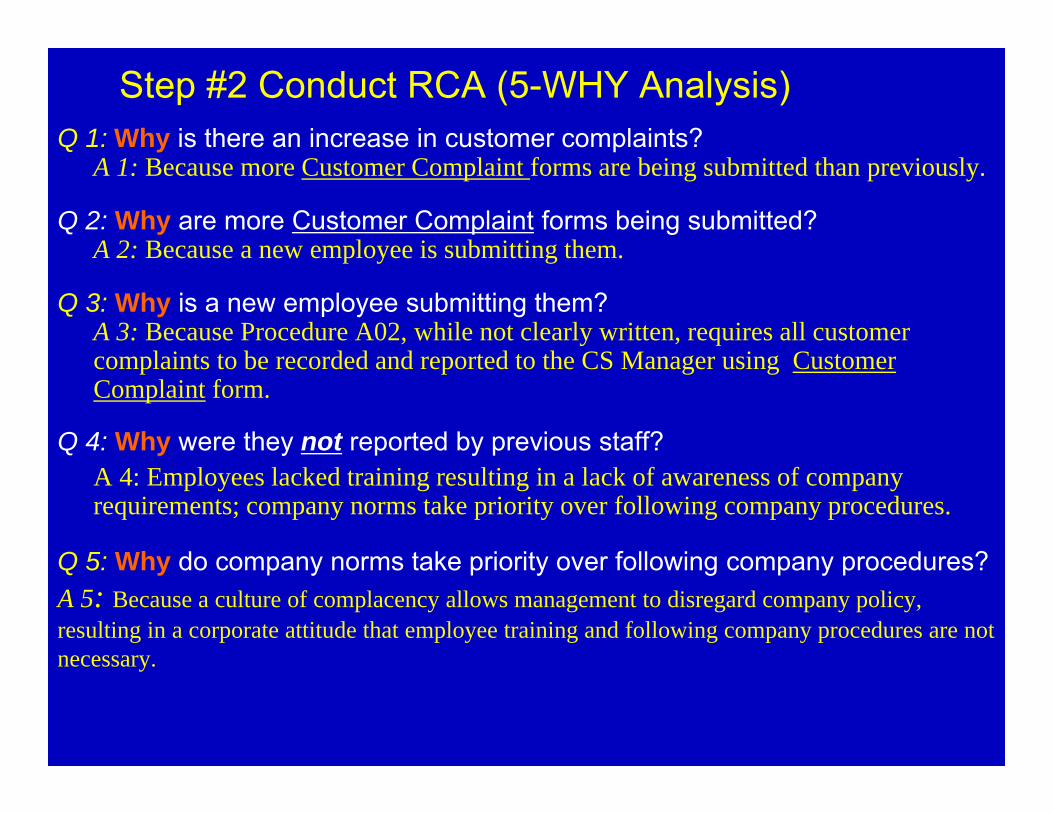
Step #2 Conduct RCA (5-WHY Analysis)Q 1: Why is there an increase in customer complaints?
A 1: Because more Customer Complaint forms are being submitted than previously.
Q 2: Why are more Customer Complaint forms being submitted?A 2: Because a new employee is submitting them.
Q 3: Why is a new employee submitting them?A 3: Because Procedure A02, while not clearly written, requires all customer complaints to be recorded and reported to the CS Manager using Customer Complaint form.
Q 4: Why were they not reported by previous staff?A 4: Employees lacked training resulting in a lack of awareness of company requirements; company norms take priority over following company procedures.
Q 5: Why do company norms take priority over following company procedures?A 5: Because a culture of complacency allows management to disregard company policy, resulting in a corporate attitude that employee training and following company procedures are not necessary.

#1 Event Investigation:1) Interviewed CS Manager and Staff2) Reviewed distribution history of Procedure A02 3) Reviewed current CS Procedure A02 4) Reviewed employee training records 5) Conducted a 5-Why Analysis
#2 Root Cause:1) A culture of complacency allows management to disregard company policy, resulting in a corporate attitude that employee training and following company procedures are not necessary.
2) This caused employees to disregard company procedures resulting in some of the staff not recognizing the importance in forwarding the Customer Complaint form to the CS Manager.
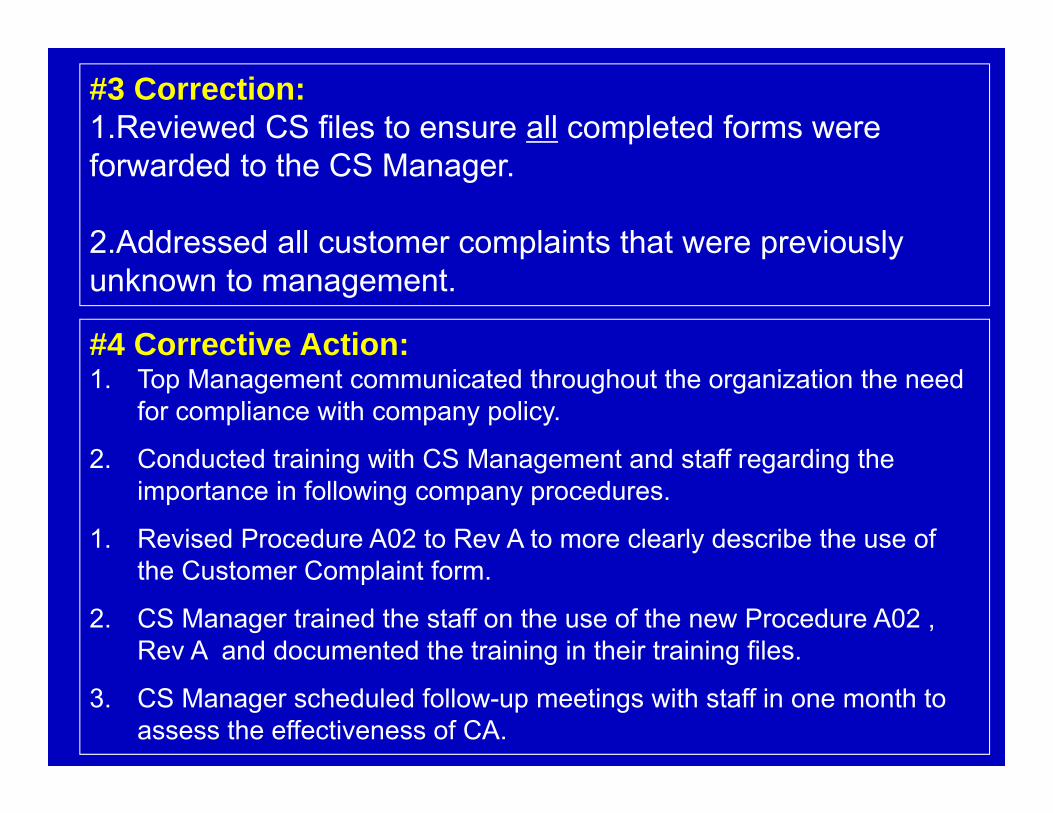
#4 Corrective Action:1. Top Management communicated throughout the organization the need
for compliance with company policy.
2. Conducted training with CS Management and staff regarding the importance in following company procedures.
1. Revised Procedure A02 to Rev A to more clearly describe the use of the Customer Complaint form.
2. CS Manager trained the staff on the use of the new Procedure A02 , Rev A and documented the training in their training files.
3. CS Manager scheduled follow-up meetings with staff in one month to assess the effectiveness of CA.
#3 Correction:1.Reviewed CS files to ensure all completed forms were forwarded to the CS Manager.
2.Addressed all customer complaints that were previously unknown to management.
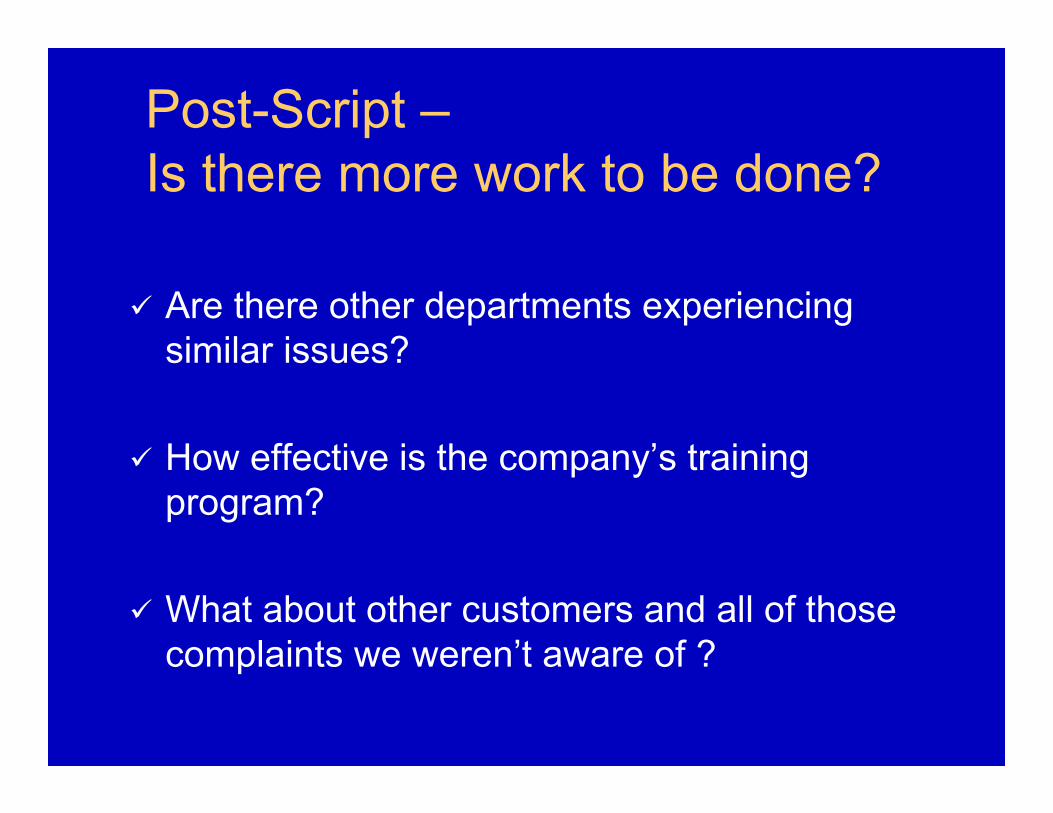
Post-Script –Is there more work to be done?
Are there other departments experiencing similar issues?
How effective is the company’s training program?
What about other customers and all of those complaints we weren’t aware of ?
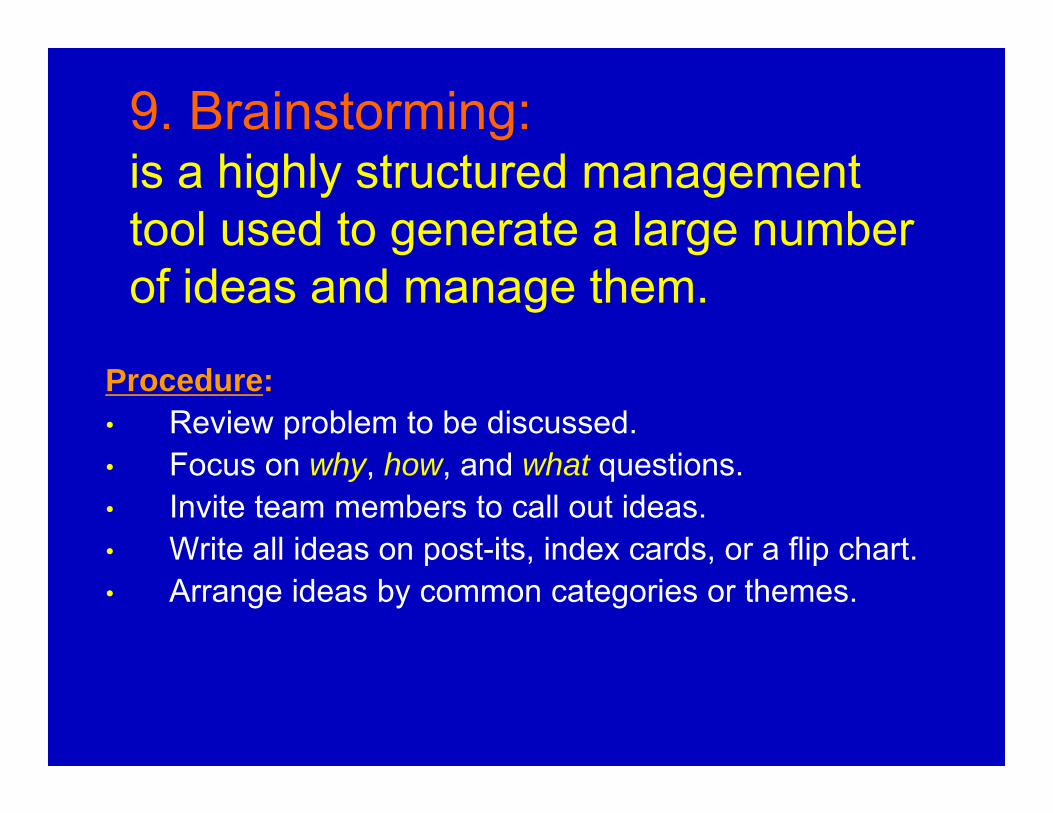
9. Brainstorming:is a highly structured management tool used to generate a large number of ideas and manage them.
Procedure:• Review problem to be discussed.• Focus on why, how, and what questions.• Invite team members to call out ideas.• Write all ideas on post-its, index cards, or a flip chart.• Arrange ideas by common categories or themes.
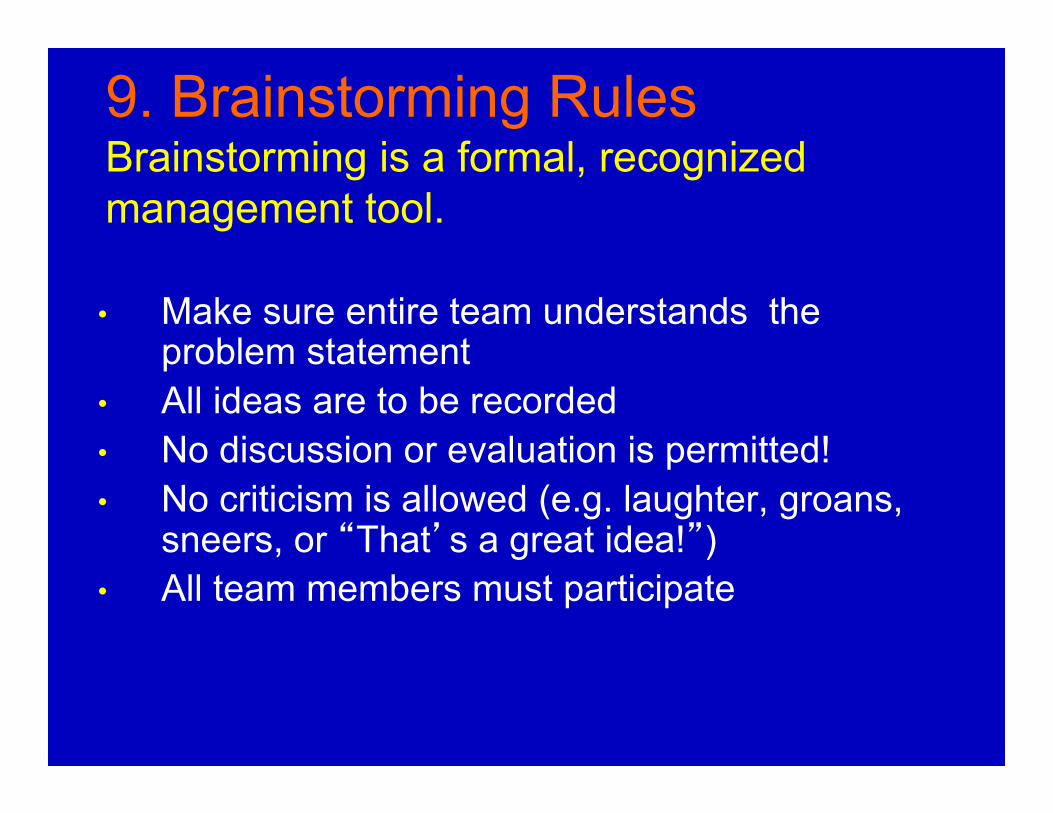
9. Brainstorming RulesBrainstorming is a formal, recognized management tool.
• Make sure entire team understands the problem statement
• All ideas are to be recorded• No discussion or evaluation is permitted!• No criticism is allowed (e.g. laughter, groans,
sneers, or “That’s a great idea!”)• All team members must participate

10. Barrier Analysis
Identifies physical, administrative, and procedural barriers or controls that should (or could) have prevented the problem, but did not.

Barriers in place No Barriers in place
10. Barrier Analysis
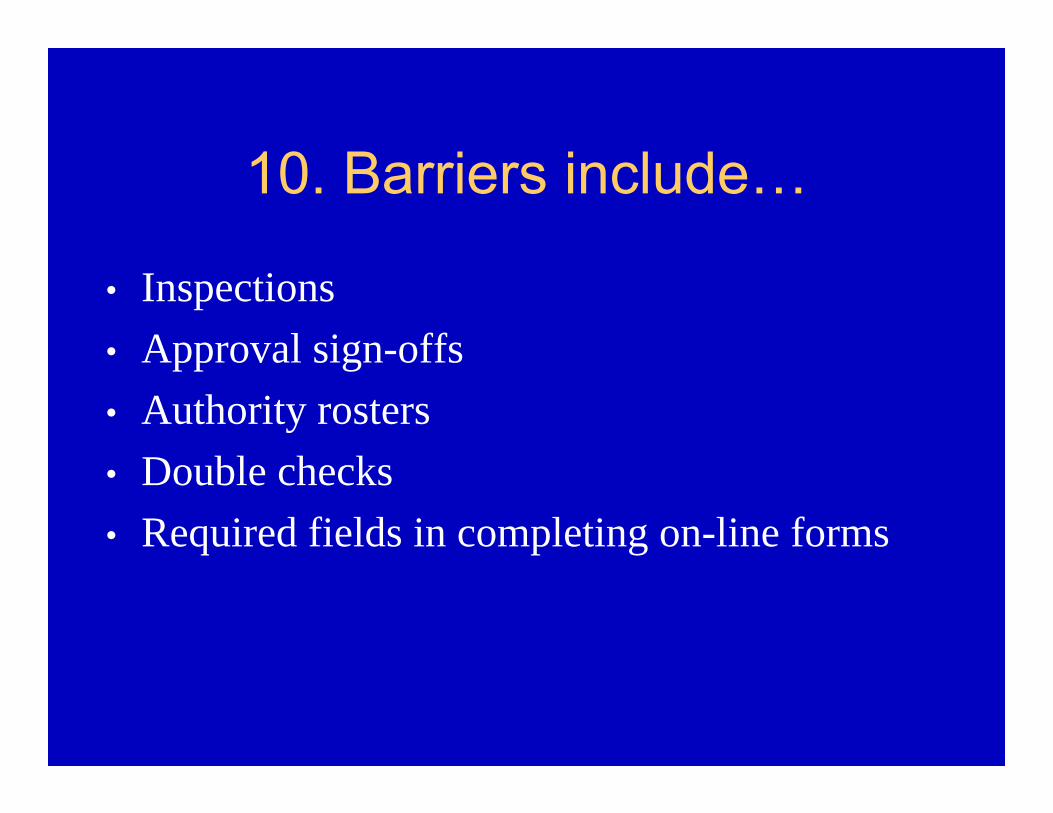
10. Barriers include…
• Inspections• Approval sign-offs• Authority rosters• Double checks• Required fields in completing on-line forms
11. Human Factors – The Goal
“Maximize human performanceand
Minimize errors”

Human Error EstimatesSystem % Due to Human Error
Airlines 70-80%
Air Traffic Control 90%
Ships 80%
Process Control 80%
Nuclear Power 70%
Road Transportation 85%

Human Errors
Human errors can be minimized, not eliminated.
Errors must be:– detected and corrected, or– at least managed.

11. Human Factors Models
Edward’s SHELL MODEL
• Heinrich’s Domino Theory
• Reason’s Swiss Cheese Model
• Boeing’s MEDA* Error Model
* Maintenance Error Decision Aid

SHELL MODEL
H
S E
L
L
1972 Elwyn Edward; 1987 Hawkins (modified)
H: Hardware
S : Software
E : Environment
L: Liveware
Manuals, procedures, WI’s, computer programs
Tools, equipment, vehicles
Temp,humidity,noise, light,rain,ice, etc.
Health, knowledge, attitude, stress, culture, pressure, complacency, norms, awareness,teamwork, leadership,communication

Human Error - Example
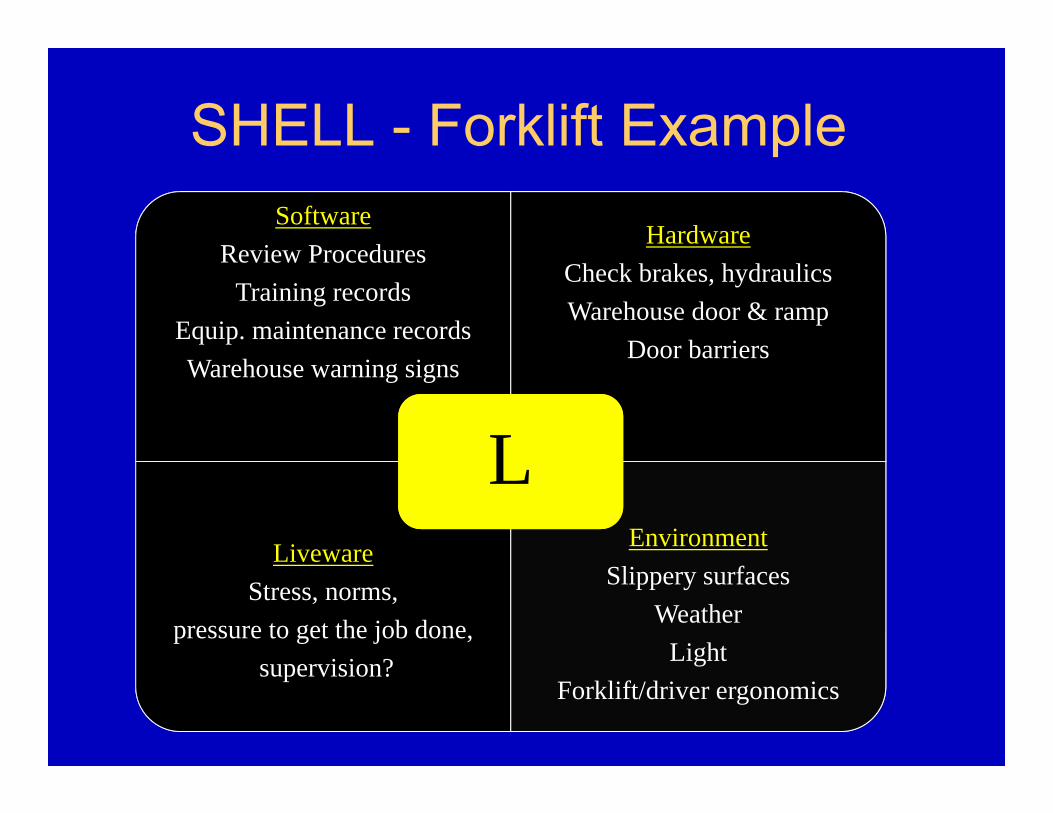
SHELL - Forklift ExampleSoftware
Review ProceduresTraining records
Equip. maintenance recordsWarehouse warning signs
HardwareCheck brakes, hydraulicsWarehouse door & ramp
Door barriers
LivewareStress, norms,
pressure to get the job done,supervision?
EnvironmentSlippery surfaces
WeatherLight
Forklift/driver ergonomics
LL

ForkliftAccident
SoftwareInadequate procedures
Inadequate training method
Imbalance in hydraulic pressure
Inadequate maintenance inspections
HardwareNew/unintentional brake action by operator
Lack of experience/training
Environment
Poor Supervision
Lack of supervision
Slippery surface?
Authority protocol not working
Weight/balance placards?
Time of day– sun in eyes?
Liveware
Skill level
Stress/fatigue(duty-time)
7a. Cause and Effect Diagram Example
Liveware
Imbalance in hydraulic pressure
Poor forklift ergonomics?
Pressureto get job done on-time
Substance abuse
Door & ramp operation?

Summary Learned the 4 modes of problem-solving.
The “Scientific Method” should be used for all problem investigations.
Management problems and QMS problems are one and the same.
Identified a 5-step structured approach to solving company problems.
Learned 12 management problem-solving techniques and reviewed actual examples for making decisions.
Thanks for attending!
and remember…
“To stop learning…. is to stop living.”© 2007 George J. Ringger
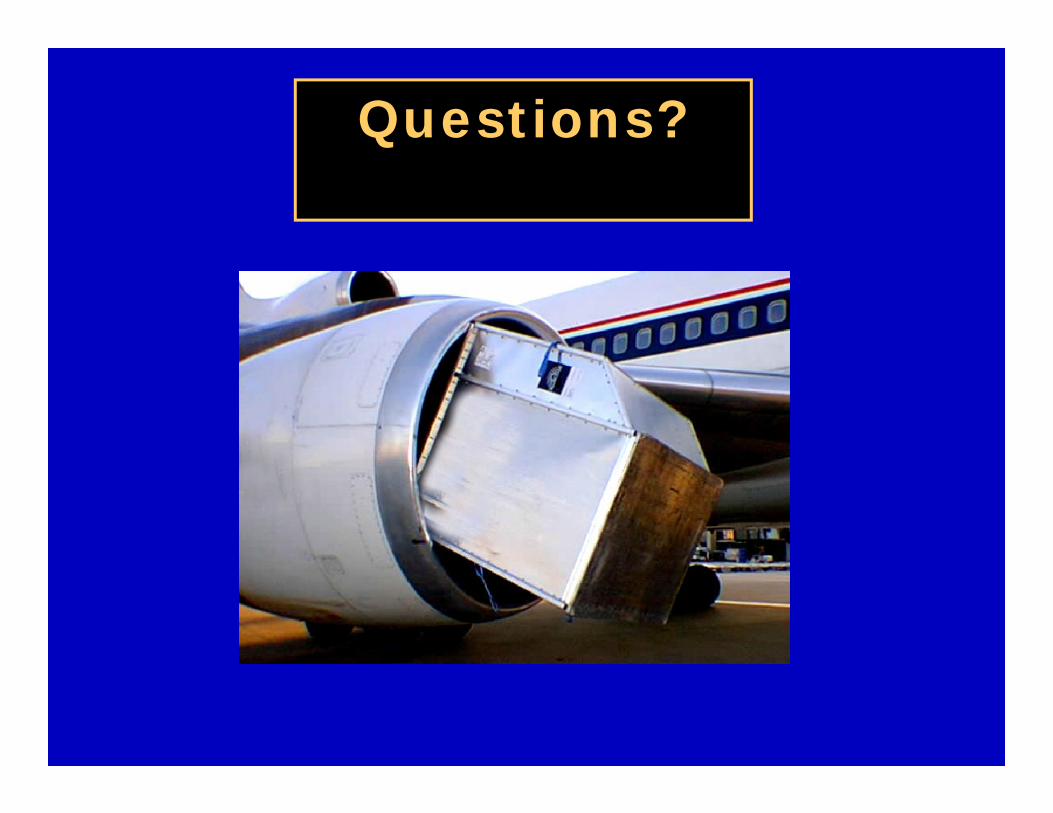
Questions?

GEORGE J. RINGGER, MAS, P.E.FAA-DER FAA-DAR
Providing Engineering, Quality System, Training, and Airworthiness services
to the aviation industry
office 954-655-6509fax 954-680-5326