marketbeat san francisco - cushmanwakefield.com/media/marketbeat/2018/04/sanfrancisc… · 208 utah...
TRANSCRIPT
MARKETBEAT
San Francisco Office Q1 2018
cushmanwakefield.com | 1
$0
$10
$20
$30
$40
$50
$60
$70
$80
-400
-200
0
200
400
600
800
1,000
2012 2013 2014 2015 2016 2017 2018
Net Absorption, SF (thousands) Asking Rent, $ PSF
SAN FRANCISCO OFFICE
Economic Indicators*
Q1 17 Q1 18 12-Month Forecast
San Francisco Metro Employment 1,111K 1,131K
San Francisco Metro Unemployment 3.1% 2.5%
U.S. Unemployment 4.7% 4.1%
*Feb 2018 data used to represent Q1 18 for San Francisco Metro
Market Indicators (Overall, All Classes)
Q1 17 Q1 18 12-Month Forecast
Overall Vacancy 8.7% 7.6%
Net Absorption (sf) -259K 2.2M
Under Construction (sf) 6.5M 4.7M
Average Asking Rent* $69.66 $71.40
*Rental rates reflect full service asking $psf/year
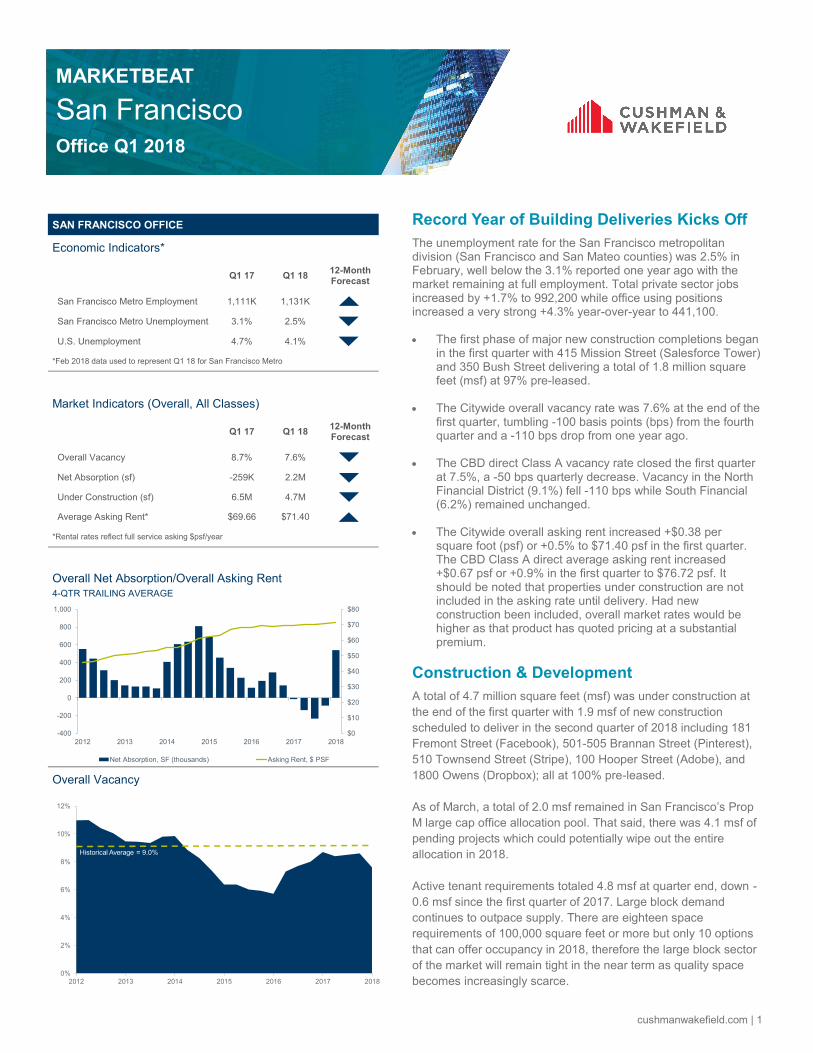
Overall Net Absorption/Overall Asking Rent
4-QTR TRAILING AVERAGE
Overall Vacancy
0%
2%
4%
6%
8%
10%
12%
2012 2013 2014 2015 2016 2017 2018
Historical Average = 9.0%
Record Year of Building Deliveries Kicks Off
The unemployment rate for the San Francisco metropolitan division (San Francisco and San Mateo counties) was 2.5% in February, well below the 3.1% reported one year ago with the market remaining at full employment. Total private sector jobs increased by +1.7% to 992,200 while office using positions increased a very strong +4.3% year-over-year to 441,100. The first phase of major new construction completions began
in the first quarter with 415 Mission Street (Salesforce Tower) and 350 Bush Street delivering a total of 1.8 million square feet (msf) at 97% pre-leased.
The Citywide overall vacancy rate was 7.6% at the end of the
first quarter, tumbling -100 basis points (bps) from the fourth quarter and a -110 bps drop from one year ago.
The CBD direct Class A vacancy rate closed the first quarter
at 7.5%, a -50 bps quarterly decrease. Vacancy in the North Financial District (9.1%) fell -110 bps while South Financial (6.2%) remained unchanged.
The Citywide overall asking rent increased +$0.38 per
square foot (psf) or +0.5% to $71.40 psf in the first quarter. The CBD Class A direct average asking rent increased +$0.67 psf or +0.9% in the first quarter to $76.72 psf. It should be noted that properties under construction are not included in the asking rate until delivery. Had new construction been included, overall market rates would be higher as that product has quoted pricing at a substantial premium.
Construction & Development
A total of 4.7 million square feet (msf) was under construction at
the end of the first quarter with 1.9 msf of new construction
scheduled to deliver in the second quarter of 2018 including 181
Fremont Street (Facebook), 501-505 Brannan Street (Pinterest),
510 Townsend Street (Stripe), 100 Hooper Street (Adobe), and
1800 Owens (Dropbox); all at 100% pre-leased.
As of March, a total of 2.0 msf remained in San Francisco’s Prop
M large cap office allocation pool. That said, there was 4.1 msf of
pending projects which could potentially wipe out the entire
allocation in 2018.
Active tenant requirements totaled 4.8 msf at quarter end, down -
0.6 msf since the first quarter of 2017. Large block demand
continues to outpace supply. There are eighteen space
requirements of 100,000 square feet or more but only 10 options
that can offer occupancy in 2018, therefore the large block sector
of the market will remain tight in the near term as quality space
becomes increasingly scarce.
cushmanwakefield.com | 2
MARKETBEAT
San Francisco Office Q1 2018
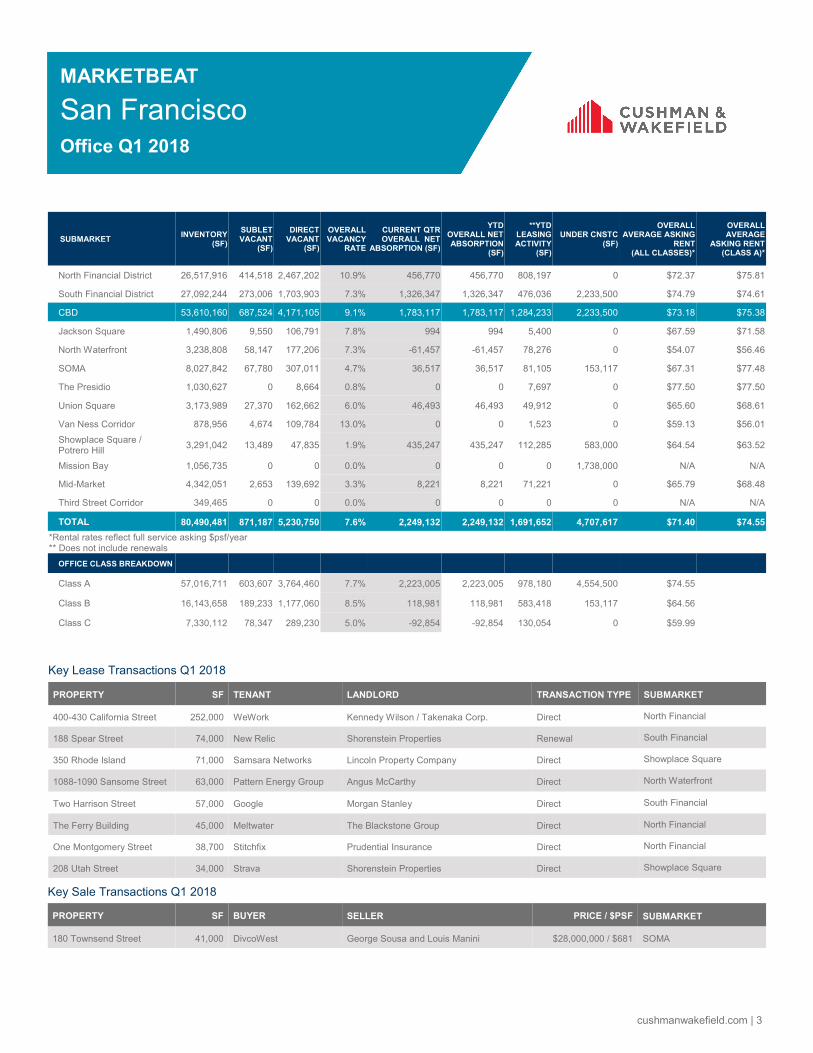
254
145
120
32
0-5K
5-10K
10-20K
20K+
552
Listings
$25
$30
$35
$40
$45
$50
$55
$60
$65
$70
$75
2012 2013 2014 2015 2016 2017 2018
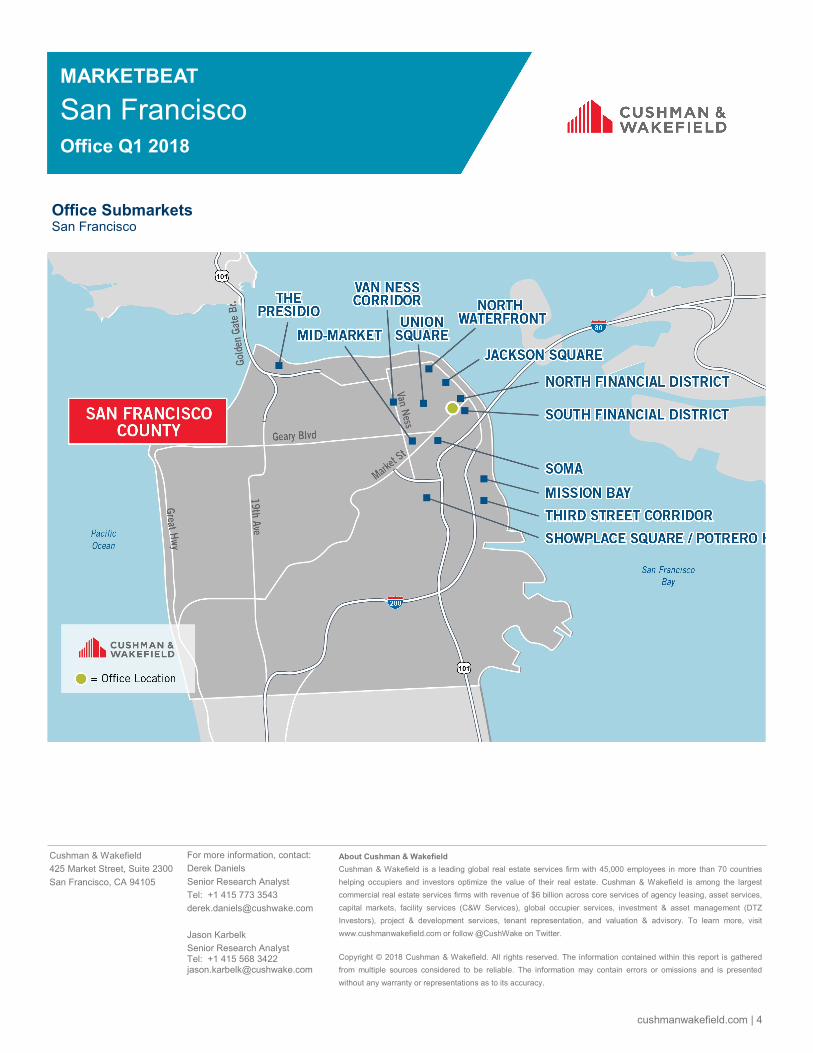
Class A Class B
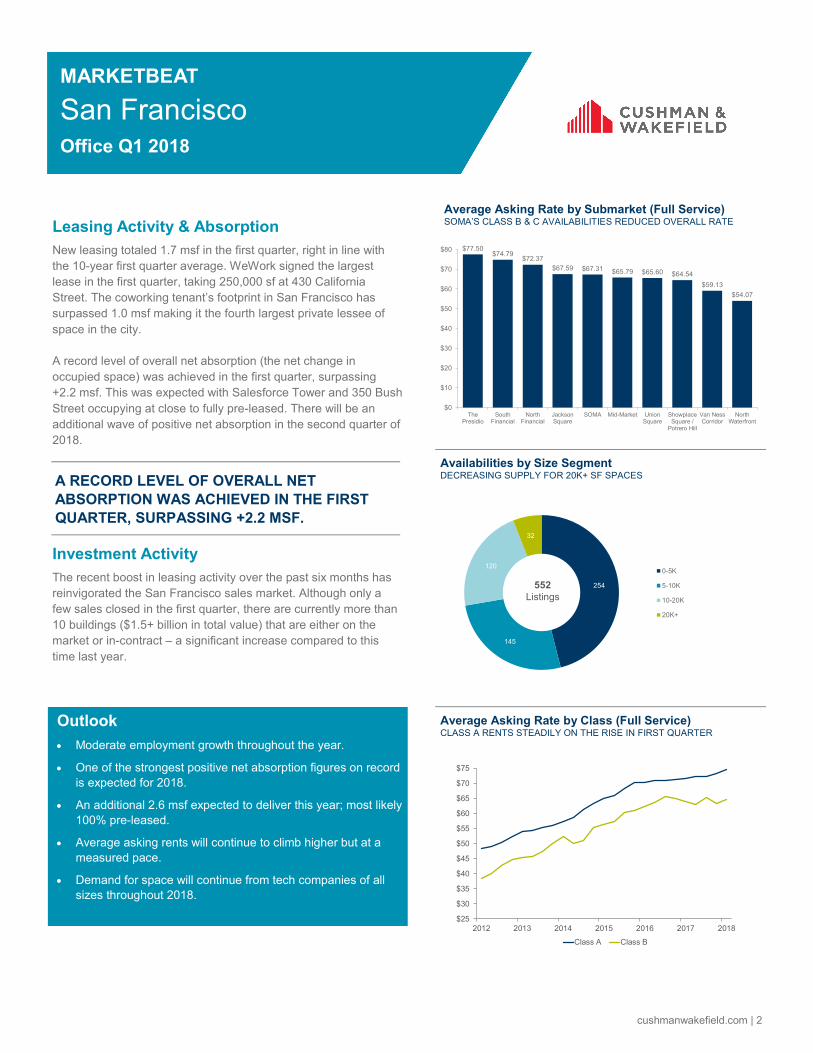
$77.50 $74.79
$72.37
$67.59 $67.31 $65.79 $65.60 $64.54
$59.13
$54.07
$0
$10
$20
$30
$40
$50
$60
$70
$80
ThePresidio
SouthFinancial
NorthFinancial
JacksonSquare
SOMA Mid-Market UnionSquare
ShowplaceSquare /
Potrero Hill
Van NessCorridor
NorthWaterfront
Average Asking Rate by Submarket (Full Service) SOMA’S CLASS B & C AVAILABILITIES REDUCED OVERALL RATE
Availabilities by Size Segment DECREASING SUPPLY FOR 20K+ SF SPACES
Average Asking Rate by Class (Full Service) CLASS A RENTS STEADILY ON THE RISE IN FIRST QUARTER
Outlook
Moderate employment growth throughout the year.
One of the strongest positive net absorption figures on record
is expected for 2018.
An additional 2.6 msf expected to deliver this year; most likely
100% pre-leased.
Average asking rents will continue to climb higher but at a
measured pace.
Demand for space will continue from tech companies of all
sizes throughout 2018.
Leasing Activity & Absorption
New leasing totaled 1.7 msf in the first quarter, right in line with
the 10-year first quarter average. WeWork signed the largest
lease in the first quarter, taking 250,000 sf at 430 California
Street. The coworking tenant’s footprint in San Francisco has
surpassed 1.0 msf making it the fourth largest private lessee of
space in the city.
A record level of overall net absorption (the net change in
occupied space) was achieved in the first quarter, surpassing
+2.2 msf. This was expected with Salesforce Tower and 350 Bush
Street occupying at close to fully pre-leased. There will be an
additional wave of positive net absorption in the second quarter of
2018.
Investment Activity
The recent boost in leasing activity over the past six months has
reinvigorated the San Francisco sales market. Although only a
few sales closed in the first quarter, there are currently more than
10 buildings ($1.5+ billion in total value) that are either on the
market or in-contract – a significant increase compared to this
time last year.
A RECORD LEVEL OF OVERALL NET
ABSORPTION WAS ACHIEVED IN THE FIRST
QUARTER, SURPASSING +2.2 MSF.
cushmanwakefield.com | 3
MARKETBEAT
San Francisco Office Q1 2018
SUBMARKET INVENTORY
(SF)
SUBLET VACANT
(SF)
DIRECT VACANT
(SF)
OVERALL VACANCY
RATE
CURRENT QTR OVERALL NET
ABSORPTION (SF)
YTD OVERALL NET ABSORPTION
(SF)
**YTD LEASING ACTIVITY
(SF)
UNDER CNSTC (SF)
OVERALL AVERAGE ASKING
RENT (ALL CLASSES)*
OVERALL AVERAGE
ASKING RENT (CLASS A)*
North Financial District 26,517,916 414,518 2,467,202 10.9% 456,770 456,770 808,197 0 $72.37 $75.81 South Financial District 27,092,244 273,006 1,703,903 7.3% 1,326,347 1,326,347 476,036 2,233,500 $74.79 $74.61 CBD 53,610,160 687,524 4,171,105 9.1% 1,783,117 1,783,117 1,284,233 2,233,500 $73.18 $75.38 Jackson Square 1,490,806 9,550 106,791 7.8% 994 994 5,400 0 $67.59 $71.58 North Waterfront 3,238,808 58,147 177,206 7.3% -61,457 -61,457 78,276 0 $54.07 $56.46 SOMA 8,027,842 67,780 307,011 4.7% 36,517 36,517 81,105 153,117 $67.31 $77.48 The Presidio 1,030,627 0 8,664 0.8% 0 0 7,697 0 $77.50 $77.50 Union Square 3,173,989 27,370 162,662 6.0% 46,493 46,493 49,912 0 $65.60 $68.61 Van Ness Corridor 878,956 4,674 109,784 13.0% 0 0 1,523 0 $59.13 $56.01 Showplace Square / Potrero Hill
3,291,042 13,489 47,835 1.9% 435,247 435,247 112,285 583,000 $64.54 $63.52 Mission Bay 1,056,735 0 0 0.0% 0 0 0 1,738,000 N/A N/A Mid-Market 4,342,051 2,653 139,692 3.3% 8,221 8,221 71,221 0 $65.79 $68.48 Third Street Corridor 349,465 0 0 0.0% 0 0 0 0 N/A N/A
TOTAL 80,490,481 871,187 5,230,750 7.6% 2,249,132 2,249,132 1,691,652 4,707,617 $71.40 $74.55
*Rental rates reflect full service asking $psf/year ** Does not include renewals
OFFICE CLASS BREAKDOWN
Class A 57,016,711 603,607 3,764,460 7.7% 2,223,005 2,223,005 978,180 4,554,500 $74.55
Class B 16,143,658 189,233 1,177,060 8.5% 118,981 118,981 583,418 153,117 $64.56
Class C 7,330,112 78,347 289,230 5.0% -92,854 -92,854 130,054 0 $59.99
Key Lease Transactions Q1 2018
PROPERTY SF TENANT LANDLORD TRANSACTION TYPE SUBMARKET
400-430 California Street 252,000 WeWork Kennedy Wilson / Takenaka Corp. Direct North Financial
188 Spear Street 74,000 New Relic Shorenstein Properties Renewal South Financial
350 Rhode Island 71,000 Samsara Networks Lincoln Property Company Direct Showplace Square
1088-1090 Sansome Street 63,000 Pattern Energy Group Angus McCarthy Direct North Waterfront
Two Harrison Street 57,000 Google Morgan Stanley Direct South Financial
The Ferry Building 45,000 Meltwater The Blackstone Group Direct North Financial
One Montgomery Street 38,700 Stitchfix Prudential Insurance Direct North Financial
208 Utah Street 34,000 Strava Shorenstein Properties Direct Showplace Square
Key Sale Transactions Q1 2018
PROPERTY SF BUYER SELLER PRICE / $PSF SUBMARKET
180 Townsend Street 41,000 DivcoWest George Sousa and Louis Manini $28,000,000 / $681 SOMA
About Cushman & Wakefield
Cushman & Wakefield is a leading global real estate services firm with 45,000 employees in more than 70 countries
helping occupiers and investors optimize the value of their real estate. Cushman & Wakefield is among the largest
commercial real estate services firms with revenue of $6 billion across core services of agency leasing, asset services,
capital markets, facility services (C&W Services), global occupier services, investment & asset management (DTZ
Investors), project & development services, tenant representation, and valuation & advisory. To learn more, visit
www.cushmanwakefield.com or follow @CushWake on Twitter.
Copyright © 2018 Cushman & Wakefield. All rights reserved. The information contained within this report is gathered
from multiple sources considered to be reliable. The information may contain errors or omissions and is presented
without any warranty or representations as to its accuracy.
For more information, contact:
Derek Daniels
Senior Research Analyst
Tel: +1 415 773 3543
Jason Karbelk
Senior Research Analyst Tel: +1 415 568 3422 [email protected]
Office Submarkets San Francisco
cushmanwakefield.com | 4
Cushman & Wakefield
425 Market Street, Suite 2300
San Francisco, CA 94105
MARKETBEAT
San Francisco Office Q1 2018