measuring corruption v1.3 - university of missouriweb.missouri.edu/~milyoj/files/measuring...
TRANSCRIPT
Measuring Public Corruption in the United States: Evidence from Administrative Records of Federal Prosecutions
Adriana Cordis* Winthrop University
and
Jeffrey Milyo* University of Missouri [email protected]
December 2013
Abstract: A growing empirical literature examines the causes and consequences of public corruption in
the United States; however, most of these studies measure corruption using data on federal convictions
that is of dubious quality and provenance. We document these concerns and describe an alternative
data source that provides more reliable and detailed information on corruption prosecutions and
convictions by type of state official and even by lead charge. We employ these data to construct a
taxonomy of public corruption that dispels some popular and academic misconceptions. Our findings
call into question the lessons from previous empirical research; earlier studies of the causes and
consequences of corruption in the states should be re‐examined with more appropriate measures of
corruption convictions.
JEL CODES: D78, H11, H83, K14, K42, Z18
KEY WORDS: Bribery, Conspiracy, Embezzlement, False Statements, Fraud, Hobbs Act, Kickbacks,
Political Scandals, and Public Corruption
*The authors gratefully acknowledge support for this project from the Mercatus Center at George Mason
University, including research assistance from Megan Patrick. We are especially indebted to Richard Boylan, who generously provided both his old data and advice on obtaining records from the DOJ.

1
Measuring Public Corruption in the United States: Evidence from Administrative Records of Federal Prosecutions
Adriana Cordis and Jeffrey Milyo
I've got this thing and it's f****** golden. And … I'm just not giving it up for f****** nothing... If I get nothing back from Obama, then I’m going in another direction. You know what I’m saying?
‐‐‐ Illinois Governor Rod Blagojevich1
1. Introduction
For many Americans, the phrase “public corruption” likely conjures up lurid examples
from recent federal sting operations. Whether it is a wiretap recording of Governor Rod
Blagojevich extolling his ability to appoint a replacement to the U.S. Senate for President‐elect
Barack Obama (see the quote above), a scan of California Representative Randy “Duke”
Cunningham’s U.S. House stationary listing a menu of federal contract amounts and
corresponding kickbacks,2 or a surveillance video of Massachusetts State Senator Diane
Wilkerson accepting a payoff by stuffing $100 bills into her bra,3 the popular understanding of
corruption is likely shaped by media coverage of the most sensational failures of high officials.
But how representative are these cases? Is corruption common among elected officials and
high‐ranking bureaucrats? And what kinds of crimes constitute most public corruption cases?
1 http://talkingpointsmemo.com/muckraker/listen‐blago‐says‐i‐ve‐got‐this‐thing‐and‐it‐s‐f‐cking‐golden‐audio (viewed December 10, 2013). 2 http://legacy.utsandiego.com/news/politics/cunningham/20060222‐9999‐1n22duke.html (viewed December 10, 2013). 3 http://www.boston.com/news/local/massachusetts/gallery/10_28_08_wilkerson_surveillance?pg=4 (viewed December 10, 2013).
2
Despite a growing social science scholarship on corruption in America, fundamental questions
like these have yet to be answered, primarily for want of the requisite data.
Empirical research on the causes and consequences of public corruption in the United
States typically measures corrupt activity by the number of federal convictions for “official
corruption.” 4 In nearly all such studies, the data employed by scholars are taken from annual
reports to Congress made by the Public Integrity Section (PIN) of the Department of Justice
(DOJ). The PIN reports to Congress are readily accessible and from these it is possible to cull
annual data by state covering the better part of four decades. This, together with the
imprimatur of originating from official documents, explains the pervasiveness of the PIN data in
the empirical literature on public corruption in America.
Boylan and Long (2003) have questioned both the provenance and quality of the PIN
data, although other scholars (e.g., Glaeser and Saks 2006) downplay those concerns and
continue to use PIN data in their research.5 In this study, we compare more detailed and
reliable data on official corruption to the commonly employed PIN data; in doing so, we amplify
some of the arguments made by Boylan and Long (2003) while dismissing others, but we also
document even more severe problems with the PIN data. In short, we demonstrate that the
data‐generating process for the PIN data is highly suspect and poorly documented; not
surprisingly then, many scholars have used this data with an insufficient understanding of what
4 For example, Nice (1983), Goel and Rich (1989), Meier and Holbrook (1992), Goel and Nelson (1998), Fisman and Gatti (2002), Meier and Schlesinger (2002), Adsera et al. (2003), Fredricksson et al. (2003), Hill (2003), Maxwell and Winters (2005), Berkowitz and Clay (2006), Depken and LaFountain (2006), Glaeser and Saks (2006), Goel and Nelson (2007), Alt and Lassen (2008), Leeson and Sobel (2008), Dincer (2008), Cordis (2009), Dincer et al. (2010), Goel and Nelson (20111,b), Johnson et al. (2011), Cordis (2012), Cordis and Warren (2012), Simpson et al. (2012) and Cordis and Milyo (2013a,b). 5 PIN data on corruption are often reported in the popular press; recent prominent examples include: Kushner (2010), Maciag (2012), Maddigan (2013), Marsh (2008) and Wile (2013).
3
exactly is being measured in the data. Consequently, erstwhile lessons on corruption in the
United States generated by earlier empirical research using these data should be set aside for
re‐examination with higher quality data.6
In contrast to most published studies, we analyze actual administrative records on
corruption prosecutions from the Department of Justice (DOJ). In doing so, we follow Boylan
and Long (2003) who obtained administrative records on convictions from the Federal Justice
Statistics Resource Center (FJSRC). However, beginning in 2001, the FJSRC changed its
classification system so that it no longer identifies public corruption cases.7 Instead, we access
the DOJ administrative records via the Transactional Records Access Clearinghouse (TRAC), a
non‐profit group dedicated to facilitating public access to federal data.8 TRAC uses Freedom of
Information requests to collect a plethora of up‐to‐date government records; this information is
available to the public, albeit under a limited license.9
To date, only a few recent studies exploit this data resource from TRAC. One apt
example is Cordis and Warren (2012), who examine the effects of Freedom of Information laws
on official corruption. Alt and Lassen (forthcoming) study behavior of federal prosecutors.
Cordis and Milyo (2013a) estimate the effects of state campaign finance reforms on state
corruption; and Cordis and Milyo (2013b) re‐examine whether federal disaster aid induces
corruption in affected areas.
6 Elsewhere, we re‐examine the finding in Leeson and Sobel (2008) that federal disaster aid leads to increased public corruption; we demonstrate that their results are sensitive to both the source of data and the time period considered (see Cordis and Milyo 2013b). 7 See the online data dictionary available at: http://fjsrc.urban.org/datadictionary.cfm?p=dd_chooser (viewed December 15, 2013). 8 See Long et al. (2004) for a discussion of strategies employed by TRAC to ensure data quality. 9 See: http://tracfed.syr.edu/. We have submitted our own freedom of information request to the DOJ for the purpose of making the data employed in this study freely available to other scholars. Our request, while approved by the DOJ, has still not been fulfilled after nearly 2 years.

4
Little is known about the frequency and types of crimes that constitute official
corruption in the United States; therefore, we provide a brief taxonomy of public corruption
(see Section Four, below). One lesson that emerges is that contrary to popular perception very
few corruption cases involve elected officials stuffing bribes into their undergarments; instead,
the typical public corruption case is decidedly less salacious. For example, most cases appear to
involve stealing and lying by non‐elected and lower‐ranking officials. We then compare state
corruption measures using TRAC data to other prominent measures; this likewise presents a
somewhat different picture of the geography of corruption in the United States.
However, before describing public corruption convictions in detail, we first consider
alternative measures of corruption, as well as some of the arguments for and against using
convictions as a measure of corruption. For example, Boylan and Long (2003) raise three major
concerns: 1) federal data do not include corruption prosecutions at the state and local level; 2)
federal authorities may exaggerate or misclassify drug cases as official corruption; and 3)
prosecutorial effort may vary systematically across states, perhaps in response to state
prosecutions.
2. Objective and Subjective Measures of Corruption
Public corruption is something of a contested term; it may be defined most simply as
the misuse of public office for private gain or more broadly as an abuse of public trust (Meier
and Holbrook 1992).10 The former definition has the advantage of readily lending itself to
10 Nye (1967) describes corruption as any “behavior which deviates from the formal duties of a public role because of private‐regarding (personal, close family, private clique) pecuniary or status gains; or violates rules against the exercise of certain types of private‐regarding influence.” Shleifer and Vishny (1993) describe it as “the sale by government officials of government property for personal gain.” Rose‐Ackerman (2002) identifies corrupt activity with “an illegal payment to a public agent to obtain a benefit that may or may not be deserved in the absence of payoffs.”
5
objective measurement by official crime statistics, while the notion of “an abuse of public trust”
is more nebulous and subjective. For this reason, abuses of public trust in a polity are typically
gauged indirectly via expert rankings or opinion surveys of beliefs about the extent of
corruption or overall trust in government.11 Even so, most studies that employ subjective
measures of corruption treat these as proxies for criminal activity qua corruption.12
Of course, evidence of public corruption may not be fully documented in official records,
since a compromised government may not pursue corruption with as much vigor and
competence as other types of crimes. These challenges are compounded when comparing
corruption across countries, due to differences in legal standards, prosecutorial resources,
record‐keeping conventions, and public access to records. For these reasons, investigations of
corruption across countries tend to rely on subjective surveys of experts or the attitudes of the
general public to measure corruption. 13
In principle, similar challenges may arise when examining government corruption in the
United States. However, such problems are greatly mitigated by the fact that nearly all official
corruption cases in the United States are handled by independent federal prosecutors within
the Department of Justice and tried in federal courts under consistent legal standards (Glaeser
11 There are several such international indices that are freely available to researchers: the Corruption Perceptions Index, compiled by Transparency International (http://www.transparency.org/research/cpi/overview; viewed November 20, 2013), the Control of Corruption Index (Kaufmann, Kraay and Mastruzzi 2010), and the Freedom from Corruption Index, compiled by the Heritage Foundation (http://www.heritage.org/index/freedom‐from‐corruption; viewed November 20, 2013). 12 For a recent survey of the academic literature on corruption, see Treisman (2007). 13 A growing body of scholarship finds that public sector corruption across countries hinders trade, reduces economic growth, distorts the allocation of government spending, and creates economic inefficiency and inequality: Murphy, Shleifer and Vishny (1993), Mauro (1995, 1996 and 1998), Brunetti (1997), Lambsdorff (1998 and 2003), Li, Xu, and Zou (2000), Gupta, de Mello, and Sharan (2001), Leite and Weidmann (2002), Tanzi and Davoodi (2002), Gyimah‐Brempong (2002), Fisman and Svensson (2007), Baraldi (2008), Hessami (2010), Johnson, LaFountain and Yamarik (2011), and Swaleheen (2011).
6
and Saks 2006; and Goel and Nelson 2007 and 2011). But for this fact, federal prosecutions
may well not be a useful indicator of corruption in the United States.
Do Federal Authorities Really Prosecute Most Corruption Cases?
It is therefore disconcerting that the only external support that we have found for the
claim that federal prosecutions are ubiquitous is from Russell Mokhiber, a self‐described
progressive activist and editor of the Corporate Crime Reporter, a legal newsletter.14 Mokhiber
quotes himself in the Corporate Crime Reporter (2004 and 2007), stating “… the vast majority of
public corruption prosecutions – perhaps as many as 80 percent – are brought by federal
officials.”15 But Mr. Mokhiber provides no original source for his assertion; nor has he
responded to our repeated queries regarding his sources.
As it turns out, Mokhiber’s oft‐cited estimate (however arrived at) is probably
conservative. In the next section, we provide evidence which suggests that about 95% of all
public corruption cases are handled by federal authorities. This addresses the first major
complaint raised by Boylan and Long (2003) regarding the use of federal corruption convictions.
A second complaint is that the set of crimes that are categorized by the DOJ as official
corruption may include drug charges or other crimes far removed from the misuse of public
office or the abuse of public trust. Alt and Lassen (2003) echo this concern, albeit without
further elaboration.
Are Unrelated Drug Cases Included in Corruption Statistics?
14 http://www.commondreams.org/russell‐mokhiber; viewed November 20, 2013. 15 The identical quote is provided in both a 2004 report (http://www.corporatecrimereporter.com/corruptreport.pdf; viewed November 20, 2013); and in a 2007 newsletter article (http://www.corporatecrimereporter.com/news/200/2007/10/; viewed November 20, 2013).
7
Publicly available administrative records from the DOJ do not identify individual
defendants. Consequently, it is not possible to independently classify these records as public
corruption; instead, scholars must rely on the coding done by prosecutors. At the time a charge
is referred for prosecution, federal prosecutors assign cases to one of eleven broad categories
(e.g., immigration, narcotics, weapons, organized crime, white collar crime, official corruption,
etc.) based on the lead charges and details of each case. This coding leaves room for accidental
or even purposeful misclassifications of cases, hence the concern about drug cases being
included in official corruption statistics.
Boylan and Long (2003) provide only a single example of such a conviction, that of “a
former assistant to a state attorney general indicted for use and possession of cocaine (p.422).”
However, this description is not quite accurate or complete; in fact, there is much more to the
story.16 The person in question, Henry Barr, was a long‐time associate of Pennsylvania
politician and former U.S. Attorney General, Dick Thornburgh. Barr himself was a former
federal prosecutor; deputy attorney general in Pennsylvania; deputy counsel and later general
counsel to then Pennsylvania Governor Thornburgh; and finally a special assistant to U.S.
Attorney General Thornburgh. But shortly after he joined Thornburgh in Washington, a drug
raid back in Harrisburg turned up connections to Henry Barr (along with an Uzi machine gun).
Subsequent court testimony alleged that Barr purchased and used cocaine over several years,
including during his tenure as general counsel to the governor. He was eventually convicted on
two counts of making false statements to the DOJ, as well as for possession and conspiracy to
use cocaine. Consequently, there is no mystery why this case is categorized as “official
16 The nature of Henry Barr’s career and crime are described in several contemporaneous media stories; our account is derived from Lewis (1991a,b) and Biddle and Lounsberry (1990).

8
corruption.” Henry Barr lied about his drug use in order to obtain a high‐ranking position in the
DOJ, then as a federal official he lied again to FBI investigators.
The Barr case certainly fits the description of an “abuse of public trust,” but it is perhaps
more debatable as to whether this incident represents an abuse of public office. As such, this
case does serve to illustrate the potential for subjective judgments among prosecutors in
classifying cases as official corruption. Of course, this is just one anecdote. In the next section
we show that official corruption includes very few instances of drug charges. In fact, just over
2% of all federal corruption convictions are for drug‐related offenses, while fewer than 0.1% are
for simple possession. Instead, most official corruption cases involve bribes, kickbacks,
embezzlement or theft of public property (e.g., activities more closely tied to official duties).
Misunderstanding the Nature of PIN Data
Boylan and Long (2003) may have been wrong in some particulars regarding federal
corruption data, but they also make a crucial observation that no prior study has acknowledged
(and very few since): the PIN data used by most scholars are not a download of administrative
records. Rather, the Public Integrity Section of the DOJ surveys U.S. district attorneys in March
about their activities in corruption cases during the last calendar year. As we note below, it is
unclear to what extent U.S. district attorneys consider the accurate completion of these surveys
to be a high priority (e.g., not all district offices comply and some responses are hand‐written).
Another common misconception regarding PIN data is that public corruption convictions
are composed mainly of elected or high‐ranking public officials. 17 However, the PIN instructs
17 For example, in order to compare corruption rates across states, Adsera et al. (2003) scale convictions by the number of elected officials in a state (as do Meier and Holbrook 1992 and Alt and Lassen 2008). In addition, Glaeser and Saks (2006) scale convictions across states by government employment, but state that: “Ideally, we
9
prosecutors to include incidents involving low‐ranking public employees that are not otherwise
classified as official corruption in the DOJ records. While we cannot state definitively how many
elected or high ranking officials are convicted in the United States, in Section 4 we do observe
that state and federal elected officials likely comprise fewer than 2% of all convictions reported
by the PIN.
Yet another misconception is that corruption convictions include many cases related to
election crimes (vote fraud, vote suppression, and campaign finance violations); again, we show
this is simply not the case. Consequently, Boylan and Long are quite right to question the
composition of official corruption cases reported by the PIN, since many scholars employ this
data without a detailed understanding of what is really being measured or of the nature of the
data‐generating process. In Section 3, we demonstrate that the PIN data are, to be blunt, a
mess.
Prosecutorial Effort
Boylan and Long (2003) also worry about prosecutorial discretion as a source of bias in
federal prosecutions. They argue that federal prosecution may be a substitute for state or local
prosecution and that federal prosecutors may have different preferences for allocating their
limited resources across different types of crimes. However, as noted above, federal
authorities pursue nearly all corruption cases in the U.S.; this blunts the first concern regarding
substitution. Further, the FBI lists combatting official corruption as its top criminal priority. 18
This also means that malfeasant prosecutors who do not act on cases referred to them by the
would calculate the corruption rate as the number of convictions relative to the total number of public officials, but these data are not available by state for our entire sample period” (p. 1059). 18 See: http://www.fbi.gov/about‐us/investigate/corruption (viewed December 10, 2013).

10
FBI may themselves become targets of investigation. Beyond this, federal prosecutors have
strong positive incentives to pursue corruption cases. Most offenses classified as official
corruption are designated National Priorities by the DOJ (this is the highest priority
designation).19 And if that weren’t enough, successful crusaders against public corruption enjoy
popular acclaim and enhanced political prospects. Consider the examples of just two former
U.S. attorneys: “America’s Mayor” Rudy Giuliani and New Jersey Governor Chris Christie (both
of whom have been or are considered Presidential candidates). For these reasons, we expect
self‐interested and public‐service minded federal prosecutors to exert a high degree of effort in
combating corruption.
Even so, prosecutorial effort is no doubt a function of the underlying severity of public
corruption. Whether and to what extent this produces bias in studies of corruption is context
dependent. For example, absent any omitted systematic determinants of prosecutorial effort,
researchers may confidently examine the reduced‐form relationship between corruption
convictions and other exogenous determinants of corruption. But it is incumbent on the
researcher to investigate possible endogeneity bias stemming from unobserved prosecutorial
effort. Especially since prosecutors are not immune to economic incentives or ideological
influence. For example, Boylan (2004) investigates how federal prosecutors respond to
financial incentives, while Gordon (2009) explores claims that prosecutions may be motivated
in part by partisan politics. Other recent studies that explicitly consider the endogeneity of
19 See: http://tracfed.syr.edu/help/codes/progcode.html (viewed November 20, 2013); all official corruption cases involving federal employees are classified as National Priorities, as are cases involving high‐ranking state officials (“governors, legislators, department or agency heads, court officials, law enforcement officials at policymaking or managerial levels, or their staffs”) and local officials (“mayors, city council members or equivalents, city managers or equivalents, department or agency heads, court officials, law enforcement officials at policymaking or managerial levels, or their staffs”).
11
prosecutorial effort include Boylan and Long (2003), Alt and Lassen (forthcoming) and Cordis
and Milyo (2013a).20
The Boylan‐Long Corruption Perceptions Index
Motivated by concerns about the quality of PIN data, Boylan and Long (2003) conducted
a survey of about 300 state house reporters for the purpose of constructing a measure of
corruption perceptions among elites. Aside from the small sample size and subjective nature of
the survey itself, it is unclear how knowledgeable a reporter might be about the relative level of
corruption in his own state versus all other states (Glaser and Saks 2006). Further, this survey
was administered only in 1999, so it is not useful for analyzing trends or more recent
conditions. Nevertheless, the corruption perceptions measure developed by Boylan and Long
has been employed in several subsequent studies (e.g., Alt and Lassen 2003 and 2008, and
Rosenson 2009).
The State Integrity Index
In 2011, a coalition of progressive groups including the Center for Public Integrity and
Public Radio International completed a State Integrity Investigation (SII); the project resulted in
another (single‐year) measure of public corruption based on the observations of one veteran
political reporter in each state.21 However, this measure is not constructed directly from
perceptions of corruption, but instead from the existence of various state laws and regulations
that are presumed to reduce corruption, as well as perceptions regarding enforcement of these
20 Boylan and Long (2003) use DOJ records of federal prosecutors’ reported time allocation as a proxy for effort; they also use state house reporters’ opinions about prosecutorial effort. Several other studies employ expenditures on law enforcement or the judiciary as a proxy for effort (e.g., Cordis and Warren 2012). Cordis and Milyo (2013a) exploit the richness of the TRAC dataset and use prosecutions of federal officials as a proxy for effort in prosecuting state officials. 21 Available at http://www.stateintegrity.org/ (viewed November 20, 2013).
12
laws. The set of institutions selected for this index is based upon input received after
contacting “nearly 100 state‐level organizations working in the areas of good government and
public sector reform around the country.”22 However, there is no explicit consideration of
whether any of the institutions included in the index actually work in practice.23 For this
reason, the SII “risk of corruption” score for each state is best viewed as a report card on a
state’s progress toward a wish‐list of “good government” initiatives. Below, we demonstrate
that this index is weakly and positively correlated to recent corruption convictions among state
officials.
Counts of News Reports
Historical research on corruption is limited by the lack of systematic data on convictions
or even perceptions of corruption. Consequently, scholars have had to be more creative in
order to examine corruption over longer swaths of time. Glaeser and Goldin (2006) use an
index based on counts of news reports in U.S. newspapers containing the words “corruption”
and “fraud.” They argue based on the time trend in these counts of news reports that
corruption in the United States has declined dramatically over the last two centuries. However,
the decline in the relative frequency of these terms occurs during the period 1875‐1950, which
corresponds to the era of increased professionalization in journalism (Gentzkow, Glaeser and
22 Neither the response rate, the groups contacted, or the content of these communications are described (http://www.stateintegrity.org/methodology#Rankingsdate; viewed December 15, 2013). 23 For example, restrictive campaign finance and lobbying regulations are included as key measures, even though there is no convincing evidence that such laws reduce public corruption (Cordis and Milyo 2013a) or improve trust in government (Milyo 2012). On the other hand, there is evidence that Freedom of Information laws impact corruption (Cordis and Warren 2012) and the SII does count such laws favorably.
13
Goldin 2006). Thus it is difficult to determine to what extent actual corruption was falling apart
from the decline in yellow journalism in the United States.24
Corruption indices based on counts of news reports represent a relatively low‐cost
alternative measure of corruption that has not yet been well‐explored, at least as applied to
gauging corruption in recent years. A notable exception is Dincer and Fredriksson (2013), who
derive a similar proxy for corruption from counts of Associated Press newswire reports.
However, a cursory examination of the hits from this type of search reveals a large number of
international stories and other articles not directly related to public corruption. Below we show
that two examples of indices based article counts in the New York Times are not highly
correlated with actual corruption rates over time.
Reconsidering the PIN Data
The absence of good alternatives to PIN data may explain its continued use as a
measure of corruption in the United States. For example, Glaeser and Saks (2006) justify
continued reliance on PIN convictions data by noting that it is correlated with the Boylan‐Long
index but is available over a longer time period. However, we argue in the next section that the
PIN data are unreliable beyond salvaging. But we also strike a more positive note: the
availability of detailed and reliable administrative records from DOJ via TRAC is a boon to future
research in that it alleviates the need to rely on imperfect or one‐off surveys and rankings.
3. Comparing PIN and TRAC on Data on Corruption Convictions
24 For example, the first professional school of journalism was established in 1908 at the University of Missouri. Also, consider the opinion of Howell Raines, former Executive Editor of the New York Times, “Our greatest accomplishment as a profession is the development since WWII of a news reporting craft that is truly non‐partisan, and non‐ideological, and that strives to be independent of undue commercial or governmental influence. It is a legacy that we must protect with diligent stewardship.” (quoted on CSPAN, February 20, 2003).
14
The most widely used measure of public corruption in the United States is derived from
criminal convictions data published in the annual report to Congress by the PIN; however, few
scholars even appear to recognize that these data are derived from surveys, let alone
acknowledge this fact. The PIN is an agency within the DOJ, as is the Executive Office of the
Unites States Attorneys (EOUSA), which oversees the individual U.S. District Attorneys and their
staffs located in each of the 94 federal judicial districts (there is at least one district per state).
It is these U.S. district attorneys that handle almost all federal corruption cases, although the
PIN provides assistance and sometimes takes over investigations and prosecutions when there
is a conflict of interest or a case that involves a federal judge. For example, from 2007‐2011,
the PIN handled 40‐60 convictions per year, or about 4% of all the corruption convictions
reported by the PIN in its annual reports to Congress.25 The remaining 96% of convictions are
reported to the PIN via surveys turned in by each district.
The PIN was created in 1976 and since 1978 it has issued annual reports to Congress
that describe aggregate data on federal corruption convictions broken down in tables by the
type of official (federal, state, local), or by federal district ‐‐‐ but not both (see Tables 2 and 3 in
the PIN annual reports to Congress). Federal judicial districts are wholly within or coincident
with state and territorial borders, so it is straightforward to construct a state‐level data series
on convictions from the PIN annual reports. It is this data source that most scholars use to
measure corruption in the states; this is also why these same studies cannot isolate corruption
rates among local or state officials by state.
25 See Table 4 of the PIN annual reports to Congress for 2007‐2011. From 1993‐2006, the PIN handled about 42 cases per year (see the DOJ Fact Sheet available at: http://www.justice.gov/opa/pr/2008/March/08_ag_246.html; viewed November 20, 2013).
15
Prior to 2000, not all U.S. Attorney offices responded to the PIN surveys, so many
scholars simply fill in the missing data by linearly interpolating missing values from adjacent
years for the same district (e.g., Glaeser and Saks 2006). For all of the PIN data presented here,
we follow suit and linearly interpolate missing data based on the five year period surrounding
the missing values. However, this adjustment has no substantive bearing on the patterns and
problems that we discuss in this section.
As noted above, federal prosecutors code each case at the time a referral is filed for
possible prosecution; “official corruption” is the designation for any prosecution in federal
court of federal, state, or local public employees for official misconduct or misuse of office. The
EOUSA has issued an annual statistical report since 1992; total official corruption cases by fiscal
year are listed in Table 3 of these annual reports, albeit not broken down by district. Finally,
TRAC maintains a database on federal prosecutions that includes these same coding
designations; the TRAC data are generated from FOIA requests placed with the DOJ from 1986
onward and cover all federal prosecutions not otherwise withheld by the DOJ. However, no
information is available regarding cases that are appealed (the same is true for data from PIN
and EOUSA).
The TRAC data are available at the case level, so they include details such as the dates
for referral, filing and disposition; the referring agency; sentences and fines; and lead charges
by title and section of the U.S. code. The DOJ does not provide TRAC with and identifying
information on defendants (not even demographics or occupation); however, official corruption
cases are coded by the type of official involved in corruption (federal, state, local, or private
16
persons connected to corrupt acts). Consequently, TRAC data provide researchers a wealth of
information not available from the PIN or EOUSA.
Inconsistencies in the PIN data
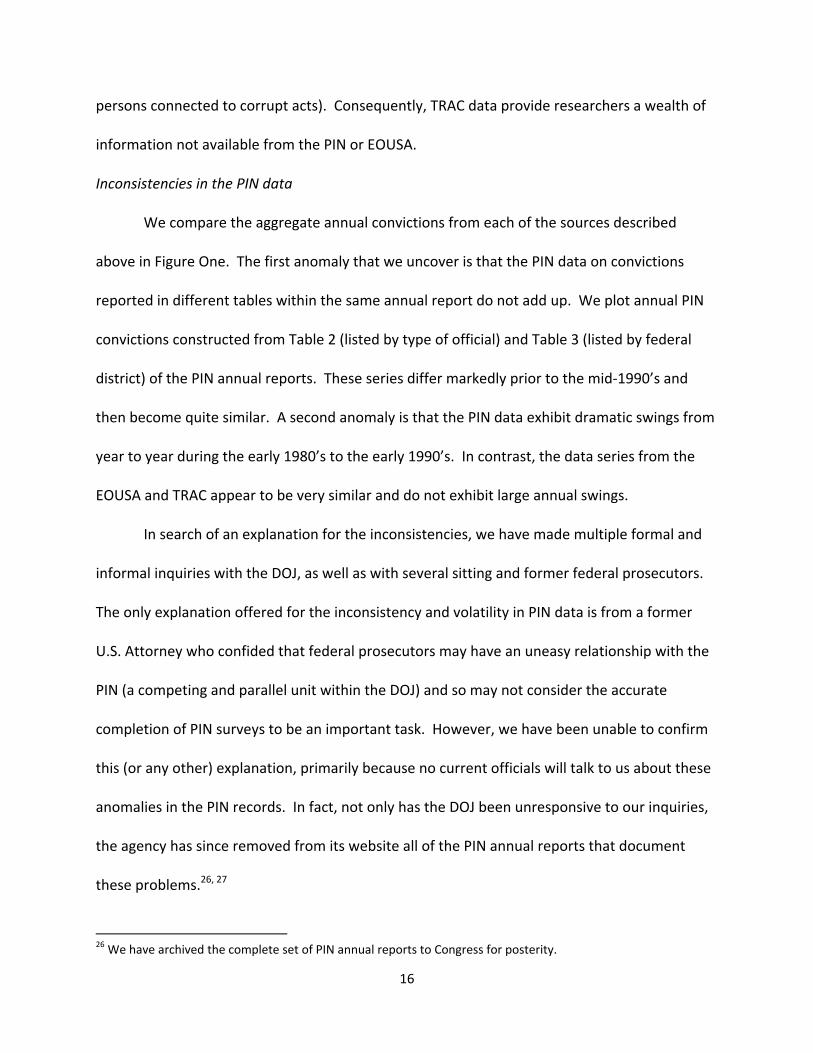
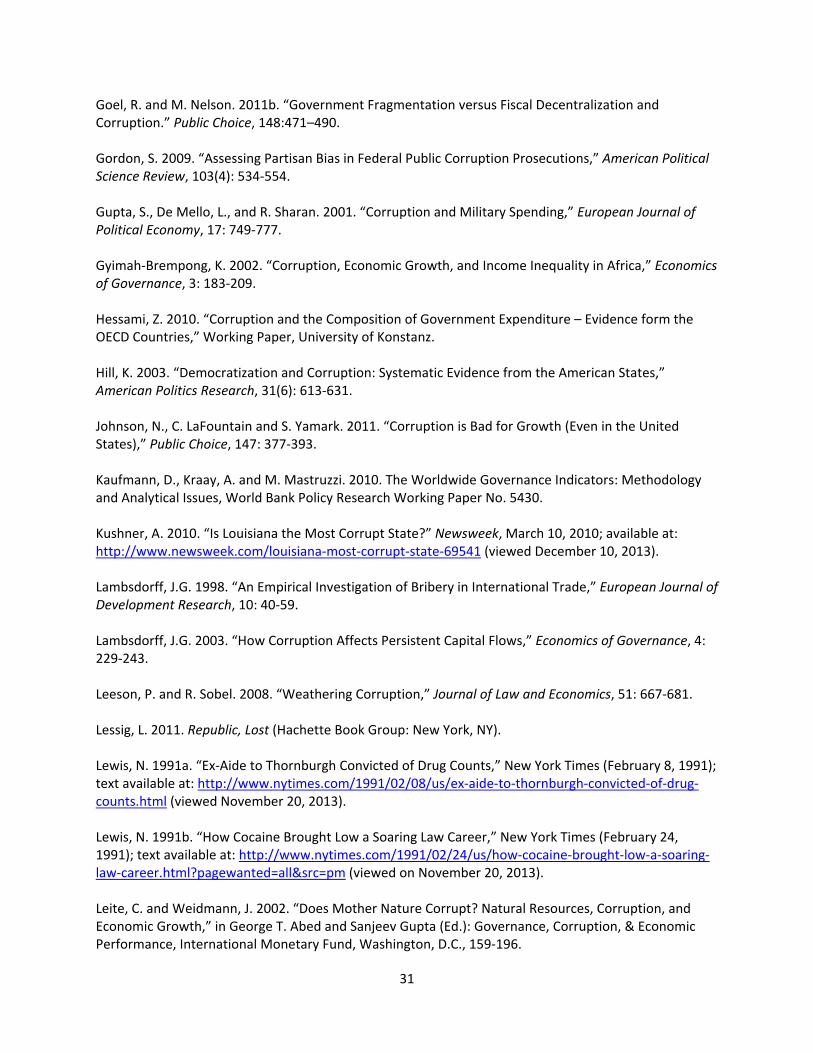
We compare the aggregate annual convictions from each of the sources described
above in Figure One. The first anomaly that we uncover is that the PIN data on convictions
reported in different tables within the same annual report do not add up. We plot annual PIN
convictions constructed from Table 2 (listed by type of official) and Table 3 (listed by federal
district) of the PIN annual reports. These series differ markedly prior to the mid‐1990’s and
then become quite similar. A second anomaly is that the PIN data exhibit dramatic swings from
year to year during the early 1980’s to the early 1990’s. In contrast, the data series from the
EOUSA and TRAC appear to be very similar and do not exhibit large annual swings.
In search of an explanation for the inconsistencies, we have made multiple formal and
informal inquiries with the DOJ, as well as with several sitting and former federal prosecutors.
The only explanation offered for the inconsistency and volatility in PIN data is from a former
U.S. Attorney who confided that federal prosecutors may have an uneasy relationship with the
PIN (a competing and parallel unit within the DOJ) and so may not consider the accurate
completion of PIN surveys to be an important task. However, we have been unable to confirm
this (or any other) explanation, primarily because no current officials will talk to us about these
anomalies in the PIN records. In fact, not only has the DOJ been unresponsive to our inquiries,
the agency has since removed from its website all of the PIN annual reports that document
these problems.26, 27
26 We have archived the complete set of PIN annual reports to Congress for posterity.
17
Yet another anomaly apparent in Figure One is that the PIN data almost always indicate
many more corruption convictions than either EOUSA or TRAC data. This is because both the
EOUSA and TRAC report only those cases that are contemporaneously coded by federal
prosecutors as “official corruption”; in contrast, the PIN surveys require prosecutors to make a
retrospective accounting of annual activity based on a more expansive definition of corruption.
Since 1983 the PIN survey explicitly instructs respondents to report offenses by low‐level public
employees (including postal employees) that are not otherwise coded as official corruption.28 It
is also interesting to note that prior to 1983, the annual PIN data series were at least highly
correlated with each other and arguably more on line with the subsequent trends in convictions
derived from EOUSA and TRAC.
Examining PIN Surveys
We have submitted FOIA requests for copies of the completed PIN surveys for the last
several years; our request has been approved by the DOJ and we have paid for the expense of
photocopying these records. However, after nearly two years, we have received only 14
completed surveys from 2006.29 Undaunted, we have checked this sample to better
understand the differences in convictions reported by PIN and EOUSA\TRAC. While identifying
information for defendants has been redacted from these reports, most of the cases we
27 There is yet another inconsistency in the PIN reports. Prior to 2007, the annual reports do not enumerate all cases handled solely by PIN and there is no indication as to whether these cases are included in reported totals or not. From 2007 to 2011, cases handled by the PIN are separately enumerated in a new Table 4 of the annual reports, but there is no indication whether these cases are also included in other tables or not. In 2012, the PIN report notes that all corruption totals now include cases handled by the PIN but that earlier reports did not include these cases. However, the totals reported in the 2012 report for all prior years are identical to those reported in prior reports for the same years. Suffice it to say that the data documentation in PIN reports is both inadequate and contradictory; this is yet another reason to eschew using PIN data in future empirical work. 28 This practice is documented in a footnote to Table 3 in the 1983 PIN annual report to Congress. 29 Our FOIA request was lost by the DOJ ‐‐‐ twice. This does shed some light on the difficulties that Congressional oversight committees have in obtaining information from the DOJ.

18
observe in our sample include the name of the employing agency of officials involved in
corruption prosecutions. However, because specific dates in these surveys are also redacted
(and PIN data are reported on the calendar year rather than the fiscal year), we cannot directly
compare totals from the original surveys to the records from EOUSA or TRAC.
Our sample of original PIN surveys reveals that of the 166 total convictions across 14
districts, at least 31% are for crimes committed by postal employees (some of the employer
information is redacted). Furthermore, a minimum of 74% of all federal officials convicted of
corruption are postal employees charged with either theft of Postal Service property or
destroying, obstructing, or theft of mail. To the extent these types of cases involve higher
ranking postal officers, they would be categorized as official corruption by federal prosecutors;
however, this is not a common occurrence. Overall, only 5% of all official corruption cases
involving federal officials from 1986‐2012 have a lead charge of theft or destruction of mail by
an officer or employee (see Table 1). So while our sample of PIN surveys is limited, it does
suggest that a large part of the difference between the total corruption cases in PIN data versus
EOUSA\TRAC data involve theft, destruction and delay of the U.S. mail perpetrated by postal
workers.
The pool of postal crimes that might be added to official corruption by prosecutors
filling out PIN surveys is actually quite large, at least relative to cases coded as official
corruption. For the period 1986‐2012, there were about 15,000 convictions for official
corruption, but over 37,000 convictions for postal crimes and nearly 5,000 convictions with the
specific lead charge of theft or destruction of mail by an officer or employee (section 1709 of
19
Title 18 of the U.S. Code).30 Consequently, it appears that the PIN data include a large
proportion of illegal acts committed by low‐level employees, quite possibly mainly involving
stolen or delayed mail.31
To further check the source of the discrepancy between total PIN convictions and total
EOUSA\TRAC convictions, we collected newspaper and newswire accounts of federal
prosecutions for corruption‐related crimes by public officials for 2010‐2012.32 If the PIN data
actually contain hundreds of high‐profile convictions that are omitted from the TRAC data, then
we may well find some evidence of this from news reports. Specifically, we would expect to
find more convictions covered in press reports than identified in the TRAC records. However,
this is not the case for any state.
We have also checked for the frequency of drug charges in the sample of surveys
obtained from PIN. Only two of the 166 convictions are for drug charges under Title 21 of the
U.S. Code (Food and Drugs) and just one of these cases was for simple possession. Another
eight cases involve military personnel convicted of “conspiracy to use the uniform to transport
cocaine” under Title 18 (Crimes and Criminal Procedure). Of course, some official corruption
convictions for making false statements or other crimes may well be drug‐related, as in the case
of Henry Barr described above. However, the paucity of actual drug charges in this sample of
PIN surveys is consistent with our taxonomy of corruption convictions for 1986‐2012 (see
below).
4. A Taxonomy of Corruption in the United States
30 Source: TRAC. 31 For an interesting field experiment on postal corruption in less developed countries, see: Castillo et al. 2014. 32 We searched Lexis‐Nexis for news accounts from each state in 2010‐2012; the search parameters included terms related to political corruption and scandal, as well as bribery, conspiracy, embezzlement, fraud, kickbacks and misappropriation.
20
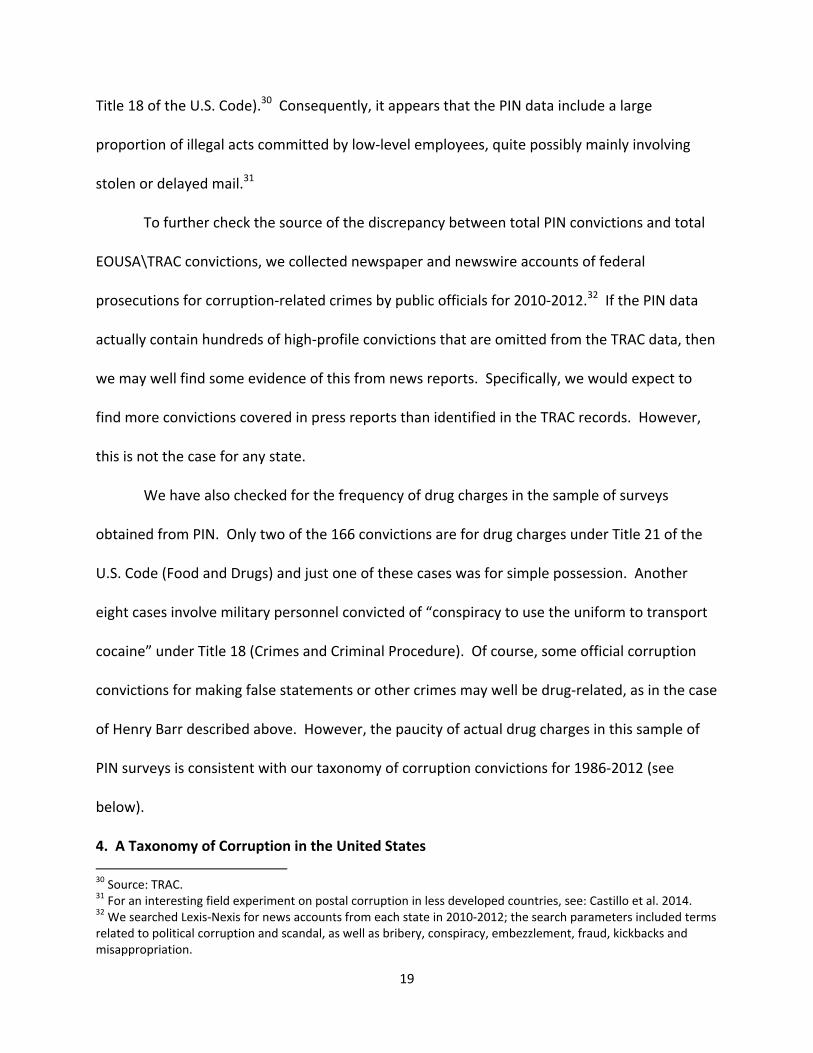
Public corruption is often portrayed as a growing problem in the United States, although
Glaeser and Goldin (2006) argue that corruption in America has been declining for the last 150
years and is much lower in recent decades than at any point in U.S. history. The time trend in
convictions data from TRAC data is more consistent with the historical research than popular
wisdom, since there has been no persistent increase in corruption convictions even with the
growth in government over the last 20 years (see Figure 1).
Likewise, headline grabbing stories about high ranking elected officials ensnared in
corruption prosecutions are not representative of the vast majority of official corruption cases.
For example, Basinger (2013) identifies only 29 instances of criminal corruption scandals among
members of Congress since 1974; in comparison, the TRAC data identify over 8,500 corruption
convictions among federal employees since just 1986.
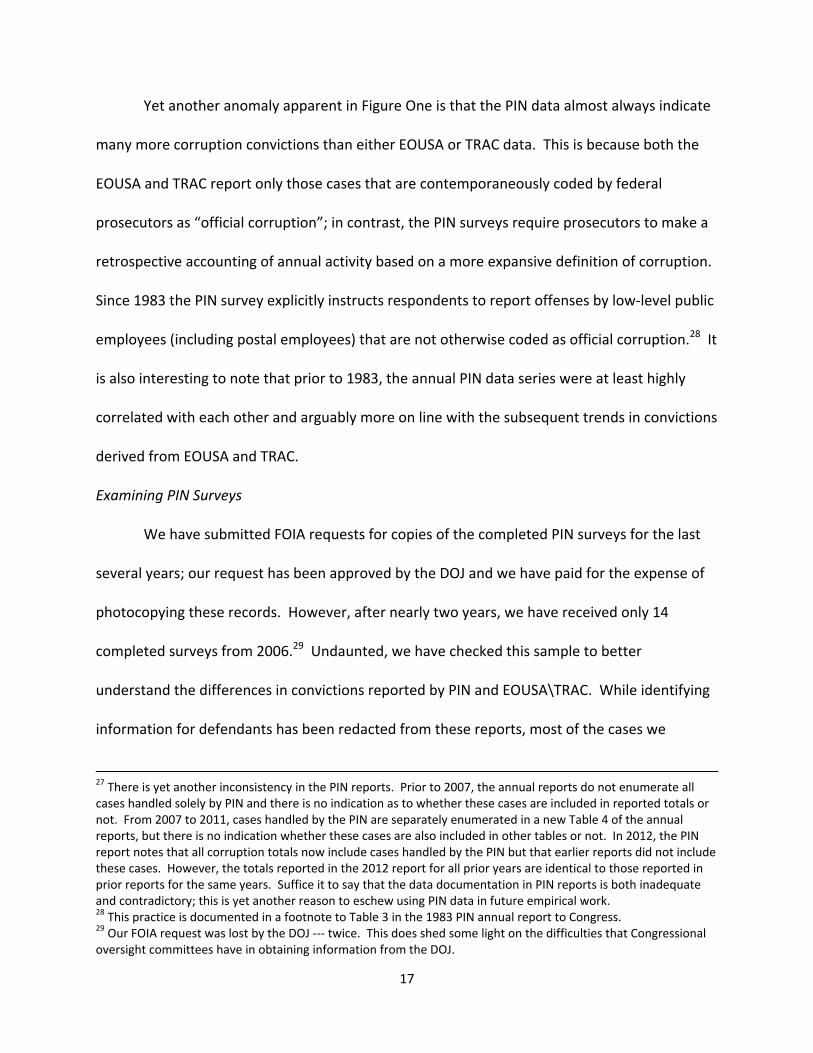
While many previous studies have used total official corruption convictions by state to
examine state‐level corruption, relatively few corruption cases actually involve state officials.
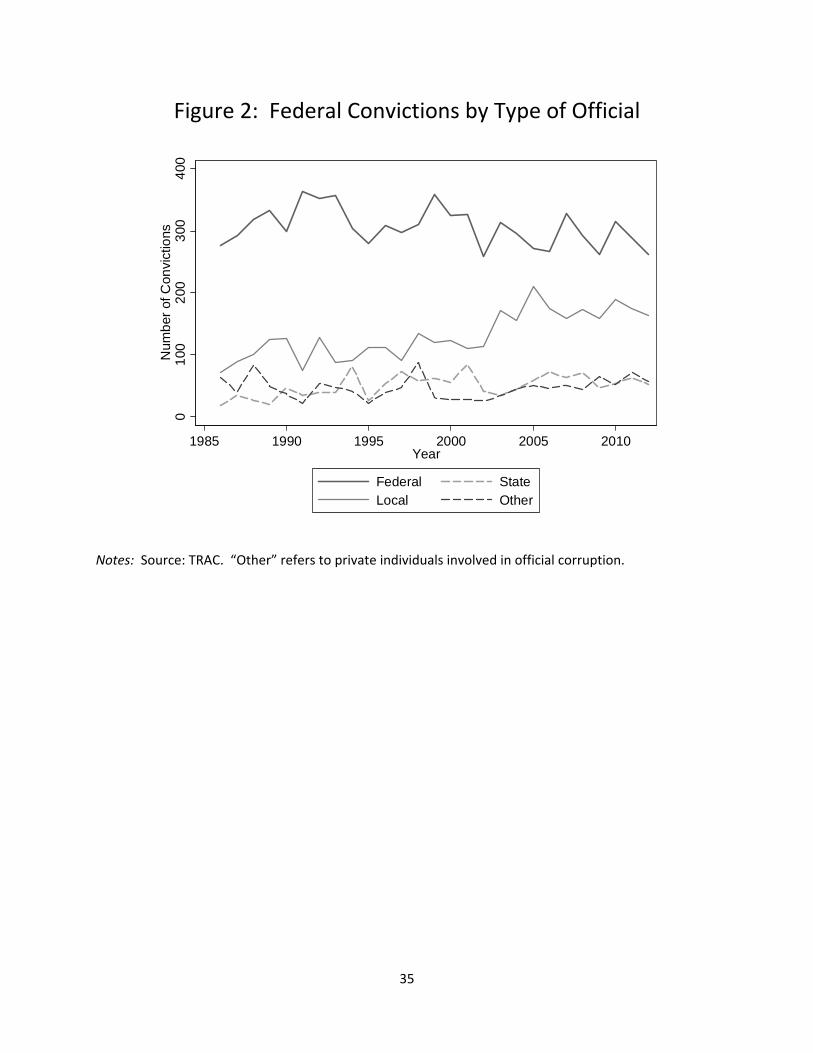
We plot convictions by type of official from TRAC in Figure 2; on average, fewer than 10% of
corruption convictions are state officials or employees (or a little over one per state, per year).
Not surprisingly, convictions of federal officials and employees are the most common category,
comprising about 56% of all convictions. Corruption by local officials has consistently been the
second most frequent category, accounting for about 25% of all official corruption cases since
1986. Only convictions among local officials shows a strong trend; these cases have been on
the rise since the early 2000’s and now account for about 30% of all corruption convictions.
As noted in several earlier studies, corruption convictions obtained in non‐federal courts
by state and local prosecutors will not be recorded by the DOJ. In order to get a sense of the
21
frequency of such prosecutions, we searched Lexis‐Nexis for all newspaper and newswire
coverage of political corruption and scandals, as well as terms related to bribery, conspiracy,
embezzlement, fraud, kickbacks and misappropriation from 1986 to 2012. We then searched
returned articles to see whether they identified a prosecution involving a public employee by a
non‐federal prosecutor. In doing so, we cast a wide net and included any public employees, not
just high‐ranking officials.33 Even so, we are only able to document a total of 799 convictions in
non‐federal courts that might be classified as public corruption (compared to 15,318
convictions in federal courts). Of these, 270 cases involved state employees; frequent examples
include motor vehicle licensing clerks selling licenses or thefts by university employees, state
police and prison guards. The remaining 529 cases involved local government employees; the
most frequent examples include thefts by public school teachers and administrators, local
police, firefighters, etc. This analysis suggests that since 1986 about 95% of all official
corruption convictions were handled by federal prosecutors.34
As part of our search of Lexis‐Nexis records, we also recorded instances of state
legislators or high‐ranking state executive branch officials (e.g., governors, lieutenant
governors, attorneys general, secretaries of state, state insurance or education commissioners,
etc.) convicted for corruption‐related charges in federal or state courts. Again, we cannot be
sure that our Lexis‐Nexis search will capture all such instances, but it does seem safe to assume
33 For example, one bribery case prosecuted by local authorities in Florida led to a no contest plea by Ms. Tamara Tootle, a middle school teacher who charged students $1 a day to skip gym classes (http://staugustine.com/stories/010407/state_4314726.shtml). 34 An example of a state employee convicted in federal court involves John “Quarters” Boyle, who stole $4 million in quarters from the Illinois Tollway Authority. Boyle is also an example of a local official who was convicted for corruption in federal court. After leaving prison, Boyle was hired by the City of Chicago under Mayor Daly; he was later convicted again for taking bribes to award city contracts to trucking firms (http://www.suntimes.com/2206911‐417/boyle‐chicago‐prison‐quarters‐owes.html).
22
that such events are generally considered newsworthy and so should be included. We find that
only 11% of the state employees convicted on corruption charges from 1986‐2012 were elected
or high‐ranking officials. Combining this with the findings in Basinger (2013) noted above,
elected officials account for fewer than 2% of all convictions of federal and state employees.
Types of Corruption Charges
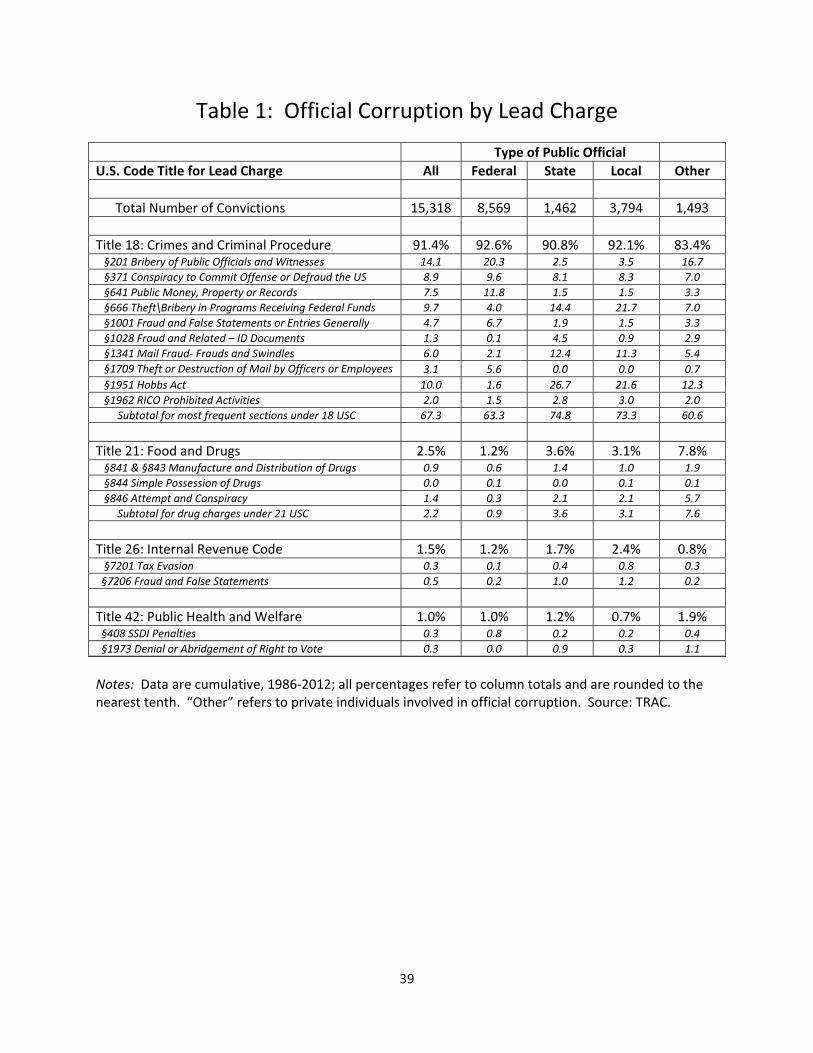
In Table 1, we exploit the detailed case information contained in the TRAC records to
describe corruption convictions by lead charges for each type of official. Nearly all convictions
are for lead charges under Title 18 (Crimes and Criminal Procedure) with the most common
specific charges being related to bribery, conspiracy, embezzlement, false statements and theft.
As noted above, drug charges are rare among public officials and simple possession almost
never categorized as official corruption. It is also interesting to note that despite popular
concern, election related crimes are quite rare. From 1986 to 2012, there were only 41 official
corruption cases with lead charges related to denial or abridgement of the right to vote.35
The composition of lead charges varies by type of official. Most notably the Hobbs Act is
deployed against state and local officials most frequently. The Hobbs Act was passed in 1951 to
combat racketeering and labor union corruption; it prohibits attempts, conspiracies and actual
extortion and robbery that affect interstate trade. In public corruption cases, this statute is also
applied whenever a public official obtains property or payment to which they are not entitled
“under color of right.”36 Consequently, the burden of proof for prosecutors going after public
officials is somewhat lower in Hobbs Act cases as compared to bribery; this is because
35 Source: TRAC. 36 See the DOJ criminal resource manual for U.S. attorneys at: http://www.justice.gov/usao/eousa/foia_reading_room/usam/title9/crm02404.htm (viewed November 20, 2013).
23
recipients of a bribe must intend to provide a service, while the Hobbs Act outlaws the mere
receipt of payment by office holders (or attempts or conspiracy to do so).37
The difference in the composition of corruption charges across federal and non‐federal
officials raises concerns about any corruption measure that lumps these cases together (as is
done in nearly all previous studies). To further examine the comparability of these cases, we
examine the prison sentences associated with them.
Prison Terms for Corruption Convictions
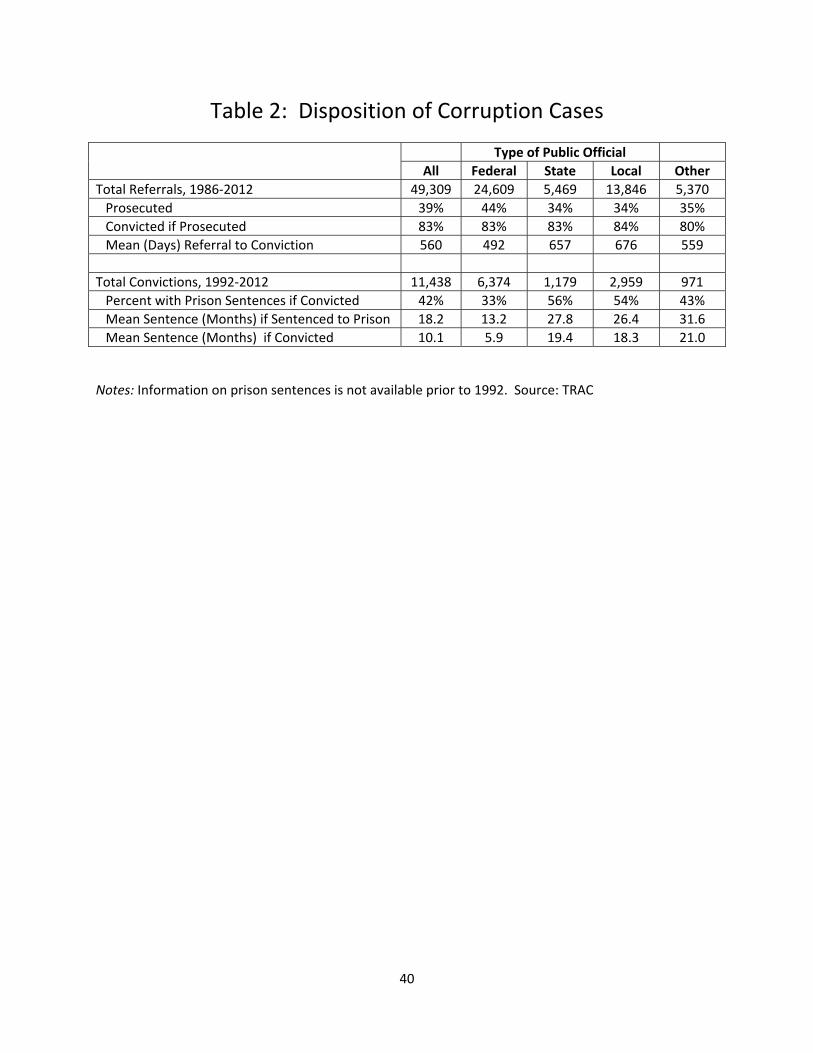
Beginning in 1992, TRAC data also include information on prison terms associated with
convictions, so it is possible to weight conviction counts by severity. We provide descriptive
statistics on the disposition of corruption cases in Table 2. While conviction rates are similar in
corruption cases across types of officials, state and local officials are more likely to receive a
prison term and receive much longer sentences on average. Conditional on any prison
sentence, the expected sentence is twice as long for non‐federal officials compared to federal
officials (about 26 months versus 13 months). Conditional on conviction, the expected
sentence for non‐federal officials is three times longer. Further, while the average prison
months per government full‐time equivalent (FTE) employment has been fairly constant over
time for non‐federal officials, it has been increasing somewhat among federal officials (see
Figure 3). Consequently, adding up convictions across all types of officials may give a distorted
picture of corruption at the state level, especially since federal officials make up the majority of
government officials convicted of corruption.
37 An exception to this exists for campaign contributions to elected officials; the Supreme Court requires that there exist evidence of a quid pro quo even for applications of the Hobbs Act (McCormick v. United States, 500 U.S. 257 1991).
24
The Timing of Corruption versus Convictions
Dincer and Fredriksson (2013) note that previous studies have largely ignored the time
delay from corrupt acts to observed convictions. While the exact timing and duration of illegal
activity is generally not knowable, we can observe the date of criminal referrals and convictions
in the TRAC data. Table 2 indicates that on average this delay is 1‐2 years. Once again, state
and local officials are comparable on this measure, but the delay is much shorter for federal
officials. Presumably this is a reflection of the more serious nature of the crimes in the case mix
associated with non‐federal officials being prosecuted by federal authorities.
5. Comparing Measures of Corruption
In the previous section, we demonstrated that TRAC data on federal corruption
prosecutions contain a wealth of unexploited information of interest to scholars who wish to
investigate the causes and consequences of corruption in the United States. In this section, we
consider a simple application by comparing corruption measures across time and states. We
have identified severe flaws in the PIN data on convictions and have expressed some doubts
about the reliability of other proxies for corruption based on surveys of reporters or article
counts. However, these concerns would be moot if other measures turn out to be highly
correlated with corruption measures generated from TRAC data. Instead, we demonstrate that
previous measures of corruption are simply not good proxies for corruption among state
officials in the U.S.
Correlation of Corruption Measures over Time
In Table 3, we list the correlation coefficients for several aggregate annual corruption
measures over the period 1986‐2012. We consider as our baseline measures of corruption in

25
the states either total corruption convictions per government FTE (federal, state and local), or
convictions of state officials per state government FTE. We have argued that the former may
not be a good indicator of the latter and indeed, we find the correlation in annual observations
over time in these measures is just 0.29. Not surprisingly, PIN‐sourced data on total convictions
per FTE is essentially uncorrelated with the TRAC‐sourced data on total convictions per FTE (and
not highly correlated with state convictions).
We next consider two simple count‐based indices. New York Times I is a simple
replication of the Glaeser and Goldin (2006) measure; it is derived by summing article counts
containing “corruption” or “fraud” and dividing the total by the count of articles containing
“political.” This scaling was done by Glaeser and Golding to account for the change in
newspaper pages that occurred over the historical period that they examine. However, even a
casual glance at the search results from this exercise reveals a large number of articles that are
irrelevant to corruption among state officials. For this reason, we construct a simple variant,
New York Times II. This index is simply a count of articles containing “corruption” but also
indexed by “United States,” “Crime and Law Enforcement” and “Government and Public
Administration.” The two article‐count indices are positively correlated with each other
(p=0.44), but negatively correlated with the TRAC‐sourced measure of total convictions and
essentially uncorrelated with state convictions.
Correlation of Corruption Measures across States
In Table 4, we list correlation coefficients for several cross‐sectional measures of state‐
level corruption. Again, the baseline measures are generated form TRAC data. We calculate
the average convictions and prison months per FTE for state officials for the period 1992‐2012
26
(i.e., for all years that data on prison sentences are available). These two measures are highly
correlated (p=0.67). Somewhat surprisingly, the Boylan‐Long Index is also positively correlated
with both of these measures, even though it is generated by survey responses from 1999.
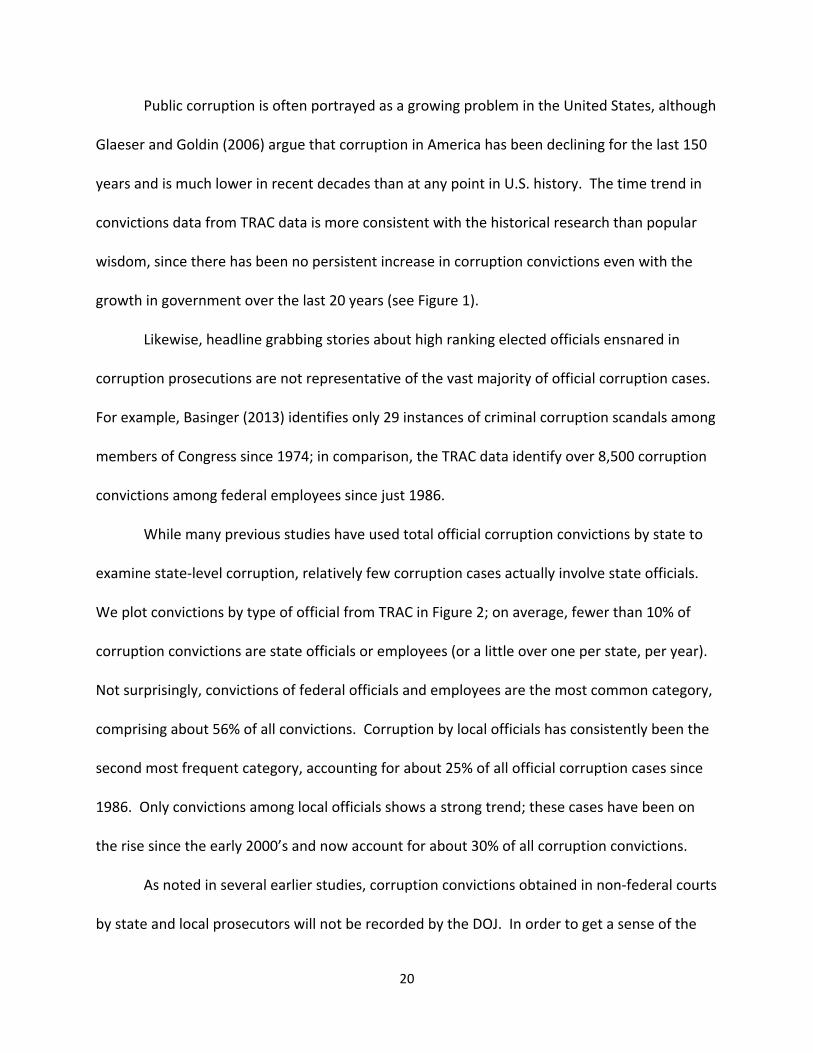
The State Integrity Index, despite being intended as a measure of good government and
low corruption risk, is positively correlated with our baseline measures, as well. Of course, this
may be due to states adopting reforms in response to past corruption. Consequently we check
whether the State Integrity Index fares better when compared to average annual convictions
for the most recent 5‐year period. It does not; the correlation coefficient remains positive at
0.25 (see Figure 4).
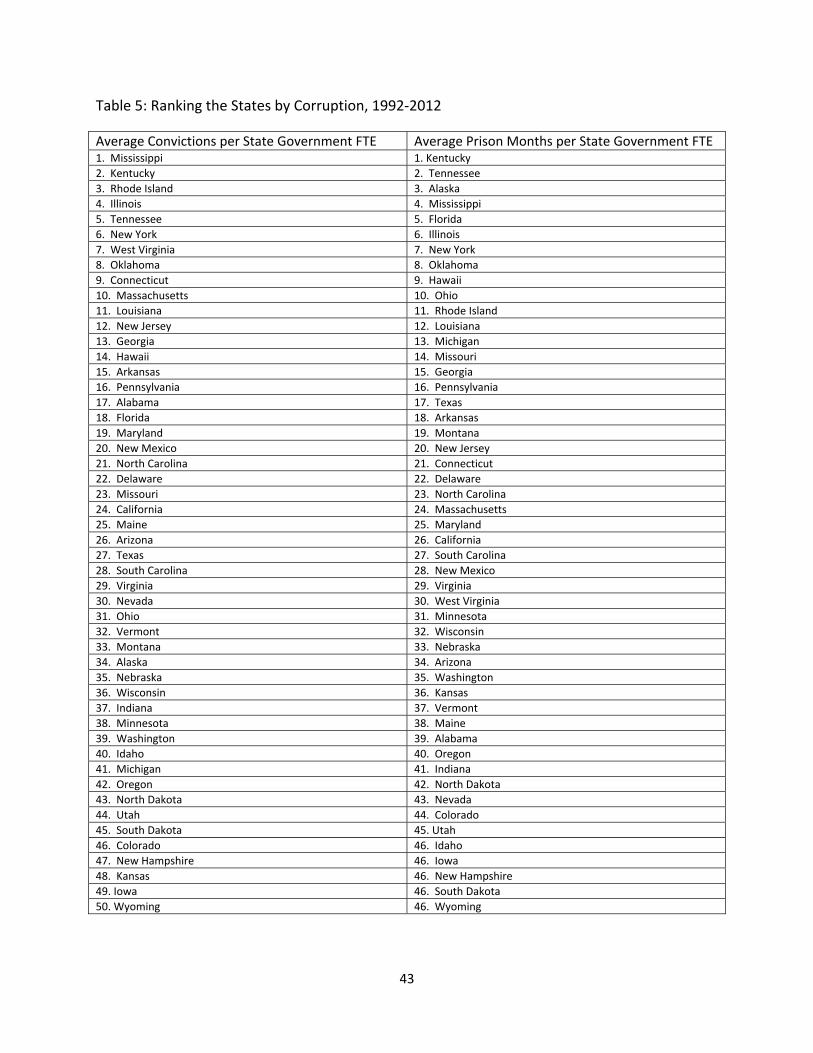
Ranking the States
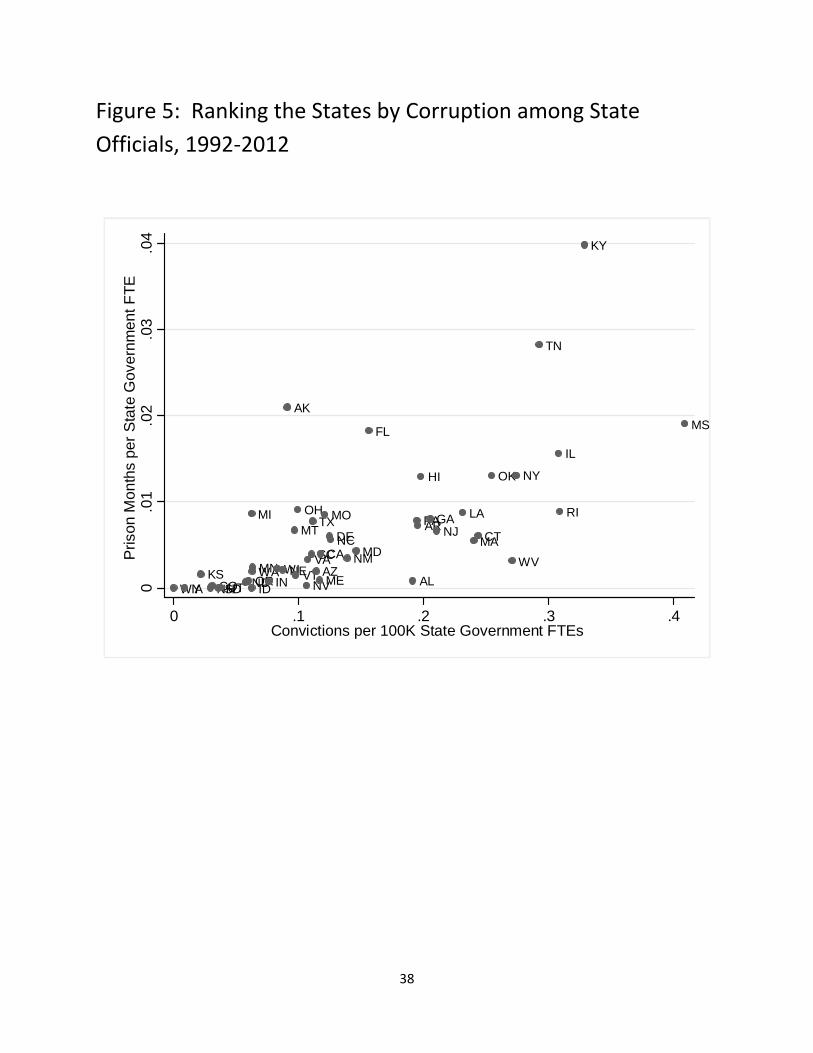
As a final exercise, we rank the states based on the two measures of corruption
generated by the TRAC data. In Table 5, we list all 50 states from most to least corrupt, based
on either average annual convictions or prison terms among state FTEs from 1992‐2012 (also
see Figure 5). Over the last 20 years, Kentucky and Tennessee stand out in both dimensions;
while Mississippi has the most convictions per FTE over this time period. Florida and Alaska are
notable for ranking relatively high on average prison months but lower on convictions, while
Alabama and West Virginia are just the opposite. True to their reputations for corruption,
Illinois, New York and Oklahoma rank among the top‐10 most corrupt states in both categories.
By these measures, the least corrupt states are found in the heartland (Colorado, the Dakotas,
Idaho, Iowa, Utah and Wyoming), although there are two exceptions from the coasts: New
Hampshire and Oregon.
6. Conclusion
27
We demonstrate that much of the empirical literature on the causes and consequences
of public corruption in the United States is based on severely flawed data. Convictions of public
officials from the Public Integrity Section of the Department of Justice are poorly documented,
internally inconsistent and composed mainly of federal officials. The failure of the PIN data to
add‐up for the period 1976‐1995 is quite problematic, since this is also the same period that
many previous empirical studies examine. Further, federal officials tend to commit different
crimes than non‐federal officials and they serve fewer months in prison. Beyond this, the PIN
survey data includes a large number of low‐ranking federal employees (e.g., postal workers).
Not surprisingly, convictions data from PIN are not highly correlated with superior measures
generated form TRAC data (nor are other proxy measures based on word‐counts or surveys of
journalists).
Taken together, this suggests that scholars should discount lessons from earlier research
and re‐examine old questions with new and improved data. For example, in concurrent work,
we demonstrate that state campaign finance laws are unrelated to state‐level corruption
(Cordis and Milyo 2013a). Further, we re‐examine the claim made by Leeson and Sobel (2008)
that federal disaster aid leads to increased public corruption; again we find no support for this
using improved measures of corruption (Cordis and Milyo 2013b).
We also examine other proxies for corruption based surveys of journalists or article
counts. The most prominent surveys exist for only a single year, so are of limited use. Beyond
this, the State Integrity Index, while launched with some fanfare, is particularly problematic in
its construction and not a useful indicator of corruption convictions. Our examination of

28
measures based on article counts reveals that these are also very noisy indicators of state
corruption convictions.
Lastly, we demonstrate that administrative records on federal corruption prosecutions
hold much promise for research, since most corruption cases are pursued by federal authorities
and these data can be disaggregated down to the case level. Consequently, it is possible to
analyze corruption by referrals, convictions or punishments; in addition, cases can be broken
down easily by type of charge, type of official and geographic district. Our initial examination of
the descriptive statistics reveals several lessons that have been underappreciated in both the
academic literature and in popular commentaries on corruption. For example, relatively few
corruption cases involve state‐level employees and even fewer are elected or high‐ranking
individuals. Further, the types of crimes committed by federal employees are different than
those for non‐federal officials and carry shorter mean prison sentences. Drug charges and
election‐crimes (including campaign finance violations) are exceedingly rare among corruption
convictions. Finally, our ranking of states by corruption convictions and prison months sheds
light on the geography of corruption; at least for some cases, the choice of corruption proxy can
greatly affect the placement of a particular state in these rankings. Even these few basic
lessons make clear that the availability of federal administrative records on corruption
prosecutions is a boon for future empirical work on the causes and consequences of public
corruption.
29
References Adsera, A., C. Boix, and M. Payne. 2003. “Are You Being Served? Political Accountability and Quality of Government,” Journal of Law, Economics and Organization, 19(2): 445‐490. Alt, J. and D. Lassen. 2003. “The Political Economy of Institutions and Corruption in American States,” Journal of Theoretical Politics, 15(3): 341‐365. Alt, J. and D. Lassen. 2008. “Political and Judicial Checks on Corruption: Evidence from American State Governments,” Economics and Politics, 20: 33‐61. Alt, J. and D. Lassen. (forthcoming). “Enforcement and Public Corruption: Evidence from US States,” Journal of Law Economics and Organization. Baraldi, L.A. 2008. “Effects of Electoral Rules, Political Competition and Corruption on the Size and Composition of Government Consumption Spending: an Italian Regional Analysis,” The B.E. Journal of Economic Analysis & Policy, 8. Basinger, S. 2013. “Scandals and Congressional Elections in the Post‐Watergate Era,” Political Research Quarterly, 66(2): 385‐398. Berkowitz, D. and K. Clay. 2006. "The Effect of Judicial Independence on Courts: Evidence from the American States," Journal of Legal Studies, 35(2): 399‐440. Biddle, D. and E. Lounsberry. 1990. “Barr Used Cocaine, Briefs Say Guida Lawyer Names Ex‐Thornburgh Aide,” Philadelphia Inquirer (July 15, 1990); text available at: http://articles.philly.com/1990‐07‐15/news/25895919_1_cocaine‐henry‐g‐barr‐richard‐l‐guida (viewed November 20, 2013). Boylan, R. 2004. “Salaries, Turnover, and Performance in The Federal Criminal Justice System,” Journal of Law and Economics, 47: 75‐92. Boylan, R. and C. Long. 2003. “Measuring Public Corruption in the American States: A Survey of State House Reporters,” State Politics and Policy Quarterly, 3(4): 420‐438. Brunetti, A. 1997. “Political Variables in Cross‐Country Growth Analysis,” Journal of Economic Surveys, 11: 163‐190. Castillo, M., R. Petrie, M. Torero and A. Viceisza. 2014. “Lost in the Mail: A Field Experiment in Crime,” Economic Inquiry, 52(1): 285‐303. Cordis, A. 2009. “Judicial Checks on Corruption in the United States,” Economics of Governance, 10: 375‐401. Cordis, A. 2012. “Corruption and the Composition of Public Spending in the United States,” working paper, Winthrop University. Cordis, A. and J. Milyo. 2013a. “Do State Campaign Finance Reforms Reduce Political Corruption?” working paper, University of Missouri.
30
Cordis, A. and J. Milyo. 2013b. “Don’t Blame the Weather: Federal Natural Disaster Aid and Public Corruption,” working paper, University of Missouri. Cordis, A. and P. Warren. 2012. “Sunshine as Disinfectant: The Effects of State Freedom of Information Act Laws on Public Corruption,” working paper, Winthrop University. Depken, C. and C. LaFountain. 2006. “Fiscal Consequences or Public Corruption: Empirical Evidence from State Bond Ratings,” Public Choice, 126(1): 75‐85. Dincer, O. 2008. “Ethnic and Religious Diversity and Corruption,” Economics Letters, 99: 98‐102. Dincer, O., C. Ellis and G. Waddell. 2010. “Corruption, Decentralization and Yardstick Competition,” Economics of Governance, 11: 269‐294. Dincer, O. and P. Fredriksson. 2013. “Does Trust Matter? Corruption and Environmental Regulatory Policy in the United States,” Edmond J. Safra Working Paper, No. 28 (Harvard University). Fisman, R. and R. Gatti. 2002. “Decentralization and Corruption: Evidence form U.S. Federal Transfer Programs,” Public Choice, 113: 25‐35. Fisman, R. and J. Svensson. 2007. “Are Corruption and Taxation Really Harmful to Growth? Firm Level Evidence,” Journal of Development Economics, 83: 63‐75. Fredriksson, P., J. List, and D. Millimet. 2003., “Bureaucratic Corruption, Environmental Policy and Inbound US FDI: Theory and Evidence,” Journal of Public Economics, 87(7‐8): 1407‐30. Gentzkow, M., E. Glaeser and C. Golden. 2006. “The Rise of the Fourth Estate: How Newspapers Became Informative and Why It Mattered,” in Corruption and Reform. Edited by E. Glaeser and C. Goldin (University of Chicago Press: Chicago, IL). Glaeser, E. and R. Saks. 2006. “Corruption in America,” Journal of Public Economics, 90: 1053‐1072. Glaeser, E. and C. Goldin. 2006. “Corruption and Reform: Introduction,” in Corruption and Reform. Edited by E. Glaeser and C. Goldin (University of Chicago Press: Chicago, IL). Goel, R. and D. Rich. 1989. “On the Economic Incentives for Taking Bribes,” Public Choice, 61: 269‐275. Goel, R. and M. Nelson. 1998. “Corruption and Government Size: A Disaggregated Analysis,” Public Choice, 97: 107–120. Goel, R. and M. Nelson. 2007. “Are Corrupt Acts Contagious? Evidence from the United States.” Journal of Policy Modeling, 29: 839–850. Goel, R. and M. Nelson. 2011a. “Measures of Corruption and Determinants of US Corruption,” Economics of Governance, 12: 155‐176.
31
Goel, R. and M. Nelson. 2011b. “Government Fragmentation versus Fiscal Decentralization and Corruption.” Public Choice, 148:471–490. Gordon, S. 2009. “Assessing Partisan Bias in Federal Public Corruption Prosecutions,” American Political Science Review, 103(4): 534‐554. Gupta, S., De Mello, L., and R. Sharan. 2001. “Corruption and Military Spending,” European Journal of Political Economy, 17: 749‐777. Gyimah‐Brempong, K. 2002. “Corruption, Economic Growth, and Income Inequality in Africa,” Economics of Governance, 3: 183‐209. Hessami, Z. 2010. “Corruption and the Composition of Government Expenditure – Evidence form the OECD Countries,” Working Paper, University of Konstanz. Hill, K. 2003. “Democratization and Corruption: Systematic Evidence from the American States,” American Politics Research, 31(6): 613‐631. Johnson, N., C. LaFountain and S. Yamark. 2011. “Corruption is Bad for Growth (Even in the United States),” Public Choice, 147: 377‐393. Kaufmann, D., Kraay, A. and M. Mastruzzi. 2010. The Worldwide Governance Indicators: Methodology and Analytical Issues, World Bank Policy Research Working Paper No. 5430. Kushner, A. 2010. “Is Louisiana the Most Corrupt State?” Newsweek, March 10, 2010; available at: http://www.newsweek.com/louisiana‐most‐corrupt‐state‐69541 (viewed December 10, 2013). Lambsdorff, J.G. 1998. “An Empirical Investigation of Bribery in International Trade,” European Journal of Development Research, 10: 40‐59. Lambsdorff, J.G. 2003. “How Corruption Affects Persistent Capital Flows,” Economics of Governance, 4: 229‐243. Leeson, P. and R. Sobel. 2008. “Weathering Corruption,” Journal of Law and Economics, 51: 667‐681. Lessig, L. 2011. Republic, Lost (Hachette Book Group: New York, NY). Lewis, N. 1991a. “Ex‐Aide to Thornburgh Convicted of Drug Counts,” New York Times (February 8, 1991); text available at: http://www.nytimes.com/1991/02/08/us/ex‐aide‐to‐thornburgh‐convicted‐of‐drug‐counts.html (viewed November 20, 2013). Lewis, N. 1991b. “How Cocaine Brought Low a Soaring Law Career,” New York Times (February 24, 1991); text available at: http://www.nytimes.com/1991/02/24/us/how‐cocaine‐brought‐low‐a‐soaring‐law‐career.html?pagewanted=all&src=pm (viewed on November 20, 2013). Leite, C. and Weidmann, J. 2002. “Does Mother Nature Corrupt? Natural Resources, Corruption, and Economic Growth,” in George T. Abed and Sanjeev Gupta (Ed.): Governance, Corruption, & Economic Performance, International Monetary Fund, Washington, D.C., 159‐196.
32
Li, H., Xu, L.C., and H.F. Zou. 2000. “Corruption, Income Distribution, and Growth,” Economics and Politics, 12: 155‐182. Long, S.B, L. Roberge, J.T. Lamicela, and M. Murugesan. 2004. “Balancing Data Quality Against Time and Money Constraints,” Proceedings of the 29th Annual SUGI Conference, SAS Institute. Maciag, M. 2012. “Which States Have the Highest Public Corruption Convictions? See how your state compares to others.” Governing, March 23, 2012; available at: http://www.governing.com/blogs/by‐the‐numbers/state‐public‐corruption‐convictions‐data.html (viewed December 10, 2013). Maddigan, N. 2013. “Arrests of 3 Mayors Reinforce Florida’s Notoriety as a Hothouse for Corruption,” New York Times, September 1, 2013; available at: http://www.nytimes.com/2013/09/02/us/arrests‐of‐3‐mayors‐reinforce‐floridas‐notoriety‐as‐a‐hothouse‐for‐corruption.html?smid=tw‐nytnational&seid=auto&_r=0 (viewed December 10, 2013). Marsh, B. 2008. “Illinois Is Trying. It Really Is. But the Most Corrupt State Is Actually . . .” New York Times, December 13, 2008; available at: http://www.nytimes.com/2008/12/14/weekinreview/14marsh.html?_r=0 (viewed December 10, 2013). Mauro, P. 1995. “Corruption and Growth,” Quarterly Journal of Economics, 60: 681‐712. Mauro, P. 1996. “The Effects of Corruption on Growth, Investment, and Government Expenditure,” International Monetary Fund, IMF Working Paper WP/96/98, Washington, D.C. Mauro, P. 1998. “Corruption and the Composition of Government Expenditure,” Journal of Public Economics, 69: 263‐279. Maxwell, A. and R. Winters. 2005. “Political Corruption in America,” working paper, Dartmouth University. Meier, K. and T. Holbrook. 1992. “I Seen My Opportunities and I Took ‘Em: Political Corruption in the American States,” Journal of Politics, 54(1): 135‐155. Meier, K. and T. Schlesinger. 2002. “Variations in Corruption among the American States,” in Heidenheimer and Johnson (ed.). Political Corruption: Concepts and Contexts. Transaction Publishers (New Brunswick, NJ). Milyo, J. 2012. “Do State Campaign Finance Reforms Increase Trust and Confidence in State Government?” working paper, University of Missouri. Murphy, K.M., A. Shleifer, and R.W. Vishny. 1993. “Why is Rent‐Seeking So Costly to Growth?,” American Economic Review, 83: 409‐414. Nice, D. 1983. “Political Corruption in the American States,” American Politics Quarterly, 11: 507‐511. Nye, J.S. 1967. “Corruption and Political Development: A Cost‐Benefit Analysis,” American Political Science Review, 61: 417‐427.
33
Rose‐Ackerman, S. 2002, “When is Corruption Harmful?,” in A.J. Heidenheimer and M. Johnston, eds., Political Corruption: Concepts and Contexts, London: Transaction Publishers. Rosenson, B. 2009. “The Effect of Reform Measures on Perceptions of Corruption,” Election Law Journal, 8(1): 31‐46. Shleifer, A. and R. Vishny. 1993. “Corruption,” Quarterly Journal of Economics, 108: 599‐617. Simpson, D., J. Nowlan, T. Gradel, M. Mouritsen Zmuda, D. Sterrett and D. Cantor. 2012. “Chicago and Illinois, Leading the Pack in Corruption,” Anti‐Corruption Report Number 5, Institute for Government and Public Affairs, University of Illinois at Chicago; available at: http://www.uic.edu/depts/pols/ChicagoPolitics/leadingthepack.pdf (viewed on December 20, 2013). Swaleheen, M. 2011. “Economic Growth with Endogenous Corruption: an Empirical Study,” Public Choice, 146: 23‐41. Tanzi, V. and H.R. Davoodi. 2002. “Corruption, Public Investment, and Growth,” in George T. Abed and Sanjeev Gupta (Ed.): Governance, Corruption, & Economic Performance, International Monetary Fund, Washington, D.C., 280‐299. Treisman, D. 2007. “What Have We Learned about the Causes of Corruption from Ten Years of Cross‐National Empirical Research?” Annual Review of Political Science, 10:211‐244. Wile, R. 2013. “Ranked: the Most Corrupt States,” Business Insider, September 3, 2013; available at: http://www.businessinsider.com/most‐corrupt‐states‐and‐territories‐2013‐9 (viewed December 10, 2013).
34
Figure 1: Official Corruption in the United States
Notes: All four series are from the United States Department of Justice (DOJ), but differ by referring agency. PIN refers to the Public Integrity Section; table numbers identify the table within the PIN annual reports to Congress from which the data is obtained. TRAC refers to the Transactional Record Clearinghouse at Syracuse University; this data series is compiled from multiple FOIA requests from the DOJ (use of this data is under license from TRAC). EOUSA refers to the Executive Office of the United States District Attorneys; data are taken from Table 3 of the EOUSA annual statistical reports.
05
001
000
150
0N
umb
er o
f Con
vict
ions
1980 1990 2000 2010Year
PIN_Table_3 PIN_Table_2EOUSA_T3 TRACFed
35
Figure 2: Federal Convictions by Type of Official
Notes: Source: TRAC. “Other” refers to private individuals involved in official corruption.
01
002
003
004
00N
umb
er o
f Con
vict
ions
1985 1990 1995 2000 2005 2010Year
Federal StateLocal Other

36
Figure 3: Prison Months by Type of Official
050
100
150
Pris
on
Mon
ths
per
100K
Gov
ernm
ent FTEs
1990 1995 2000 2005 2010Year
Federal State
Local

37
Figure 4: Corruption among State Officials, 2008‐2012
AK AL
AR
AZ
CA
CO
CT
DE
FL
GA
HI
IA
ID
IL
IN KS
KY
LA
MA
MD
ME
MI
MN
MO
MS
MT
NC
ND
NE
NH
NJ
NM
NV
NYOH
OKOR
PA
RI
SC
SD
TN
TX
UTVA
VT
WAWI
WV
WY0.2
.4.6
Co
nvic
tions
per
10
0K S
tate
Gov
ern
me
nt F
TE
s
.5 .6 .7 .8 .9
State Integrity Index
38
Figure 5: Ranking the States by Corruption among State
Officials, 1992‐2012
WYIAKS
NHCOSDUT NDOR
MI
IDWAMN
INWINE
AK
MT
VT
OH
NV
VASC
TX
AZME
CA
MO
DENC
NMMD
FL
AL
PAAR
HI
GANJ
LA
MACT
OK
WV
NY
TN
IL
RI
KY
MS
0.0
1.0
2.0
3.0
4P
rison
Mon
ths
per
Sta
te G
over
nmen
t FT
E
0 .1 .2 .3 .4Convictions per 100K State Government FTEs
39
Table 1: Official Corruption by Lead Charge
Type of Public Official
U.S. Code Title for Lead Charge All Federal State Local Other
Total Number of Convictions 15,318 8,569 1,462 3,794 1,493
Title 18: Crimes and Criminal Procedure 91.4% 92.6% 90.8% 92.1% 83.4% §201 Bribery of Public Officials and Witnesses 14.1 20.3 2.5 3.5 16.7
§371 Conspiracy to Commit Offense or Defraud the US 8.9 9.6 8.1 8.3 7.0
§641 Public Money, Property or Records 7.5 11.8 1.5 1.5 3.3
§666 Theft\Bribery in Programs Receiving Federal Funds 9.7 4.0 14.4 21.7 7.0
§1001 Fraud and False Statements or Entries Generally 4.7 6.7 1.9 1.5 3.3
§1028 Fraud and Related – ID Documents 1.3 0.1 4.5 0.9 2.9
§1341 Mail Fraud‐ Frauds and Swindles 6.0 2.1 12.4 11.3 5.4
§1709 Theft or Destruction of Mail by Officers or Employees 3.1 5.6 0.0 0.0 0.7
§1951 Hobbs Act 10.0 1.6 26.7 21.6 12.3
§1962 RICO Prohibited Activities 2.0 1.5 2.8 3.0 2.0
Subtotal for most frequent sections under 18 USC 67.3 63.3 74.8 73.3 60.6
Title 21: Food and Drugs 2.5% 1.2% 3.6% 3.1% 7.8% §841 & §843 Manufacture and Distribution of Drugs 0.9 0.6 1.4 1.0 1.9
§844 Simple Possession of Drugs 0.0 0.1 0.0 0.1 0.1
§846 Attempt and Conspiracy 1.4 0.3 2.1 2.1 5.7
Subtotal for drug charges under 21 USC 2.2 0.9 3.6 3.1 7.6
Title 26: Internal Revenue Code 1.5% 1.2% 1.7% 2.4% 0.8% §7201 Tax Evasion 0.3 0.1 0.4 0.8 0.3
§7206 Fraud and False Statements 0.5 0.2 1.0 1.2 0.2
Title 42: Public Health and Welfare 1.0% 1.0% 1.2% 0.7% 1.9% §408 SSDI Penalties 0.3 0.8 0.2 0.2 0.4
§1973 Denial or Abridgement of Right to Vote 0.3 0.0 0.9 0.3 1.1
Notes: Data are cumulative, 1986‐2012; all percentages refer to column totals and are rounded to the nearest tenth. “Other” refers to private individuals involved in official corruption. Source: TRAC.
40
Table 2: Disposition of Corruption Cases
Type of Public Official
All Federal State Local Other
Total Referrals, 1986‐2012 49,309 24,609 5,469 13,846 5,370
Prosecuted 39% 44% 34% 34% 35%
Convicted if Prosecuted 83% 83% 83% 84% 80%
Mean (Days) Referral to Conviction 560 492 657 676 559
Total Convictions, 1992‐2012 11,438 6,374 1,179 2,959 971
Percent with Prison Sentences if Convicted 42% 33% 56% 54% 43%
Mean Sentence (Months) if Sentenced to Prison 18.2 13.2 27.8 26.4 31.6
Mean Sentence (Months) if Convicted 10.1 5.9 19.4 18.3 21.0
Notes: Information on prison sentences is not available prior to 1992. Source: TRAC

41
Table 3: Correlations Over Time, 1986‐2012
TRAC Total Convictions per Government FTE
TRAC StateConvictions per State Government FTE
PIN Total Convictions per Government FTE
New York Times Index I
TRAC Convictions per 100K State FTE
.29
PIN Total Convictions per 100K Gov’t FTE
‐.01 .16
New York Times Index I
‐.22 ‐.06 .12
New York Times Index II
‐.43 .00 .21 .44
Notes: New York Times Index I is based on Glaeser and Goldin (2006); it is a count of articles containing
“corruption” or “fraud,” divided by the count of articles containing “politics”. New York Times Index II is a count of
articles on corruption among those indexed under “United States,” “Crime” and “Government.”

42
Table 4: Correlations Across States, 1992‐2012
TRAC Prison Months per State FTE
TRAC Convictions per 100K State FTE
Boylan‐Long Index
TRAC Convictions per 100K State FTE
.67
Boylan‐Long Index
.30 .55
State Integrity Index
.21 .32 .30
43
Table 5: Ranking the States by Corruption, 1992‐2012
Average Convictions per State Government FTE Average Prison Months per State Government FTE 1. Mississippi 1. Kentucky
2. Kentucky 2. Tennessee
3. Rhode Island 3. Alaska
4. Illinois 4. Mississippi
5. Tennessee 5. Florida
6. New York 6. Illinois
7. West Virginia 7. New York
8. Oklahoma 8. Oklahoma
9. Connecticut 9. Hawaii
10. Massachusetts 10. Ohio
11. Louisiana 11. Rhode Island
12. New Jersey 12. Louisiana
13. Georgia 13. Michigan
14. Hawaii 14. Missouri
15. Arkansas 15. Georgia
16. Pennsylvania 16. Pennsylvania
17. Alabama 17. Texas
18. Florida 18. Arkansas
19. Maryland 19. Montana
20. New Mexico 20. New Jersey
21. North Carolina 21. Connecticut
22. Delaware 22. Delaware
23. Missouri 23. North Carolina
24. California 24. Massachusetts
25. Maine 25. Maryland
26. Arizona 26. California
27. Texas 27. South Carolina
28. South Carolina 28. New Mexico
29. Virginia 29. Virginia
30. Nevada 30. West Virginia
31. Ohio 31. Minnesota
32. Vermont 32. Wisconsin
33. Montana 33. Nebraska
34. Alaska 34. Arizona
35. Nebraska 35. Washington
36. Wisconsin 36. Kansas
37. Indiana 37. Vermont
38. Minnesota 38. Maine
39. Washington 39. Alabama
40. Idaho 40. Oregon
41. Michigan 41. Indiana
42. Oregon 42. North Dakota
43. North Dakota 43. Nevada
44. Utah 44. Colorado
45. South Dakota 45. Utah
46. Colorado 46. Idaho
47. New Hampshire 46. Iowa
48. Kansas 46. New Hampshire
49. Iowa 46. South Dakota
50. Wyoming 46. Wyoming