mini presentation on “water supply and sewerage in …voorburggroup.org/documents/2012...
TRANSCRIPT

1 / 14
27th
Voorburg Group Meeting on Services Statistics
Warsaw, Poland October 1st - 5th, 2012
Mini presentation on “Water supply and sewerage in France”
ISIC 4.0 : 3600 and 3700
NACE rev.2 : 36.00 and 37.00
Alain Gallais, Insee, France Denis Gac, Insee, France
The views expressed in this paper are those of the author alone and do not necessarily represent the position of Insee or any other organization with whom the author may be affiliated.

2 / 14
Introduction
The purpose of this paper is to provide a brief overview of the structural and short term statistics established by Insee on “water collection, treatment and supply services” (ISIC 3600) and “sewerage services” (ISIC 3700), especially what France does and wants to do for Producer Price Indices. By the way, these PPI are not true SPPI, as these divisions belong to industry according to NACE and CPA rev.2, but the SPPI site of Nantes was fully involved in the conception and the field visits to enterprises for these two activities, achieved in 2010-2011.
1 Classification
The French classifications of activities (NAF 2008) and products (CPF 2008) are fully identical to the European classifications (NACE and CPA 2008):
Activities
Division Group Class Sub-Class Description
36 36.0 36.00 36.00Z Water collection, treatment and supply
37 37.0 37.00 37.00Z Sewerage
Products
Item Description
36.00.11 Drinking water
36.00.12 Non-drinking water
36.00.20 Treatment and distribution services of water through mains
36.00.30 Trade services of water through mains
37.00.11 Sewage removal and treatment services
37.00.12 Treatment services of cesspools and septic tanks
37.00.20 Sewage sludge
There is no breakdown of the activities within the division level, and it is justified by the fact that enterprises are generally involved in most products of these activities together, and even very often in both activities (see point 2 on market characteristics). The French consumer is concerned by only one common bill. This bill comprises also taxes, which are only conventionally attributed to supply or sewerage.
Conceptually, anyway, the first activity concerns mainly a good: “water” (and secondarily auxiliary services), and the second activity mainly a service (because the final output is rarely valuable). It is the reason why, in former classifications, “Water collection, treatment and supply” was considered as an industrial activity and “Sewerage” as a service activity (hence, far away from eachother in the classification).

3 / 14
2 Market characteristics
a. Some statistics on physical quantities
34 billions m3 were collected in France in 2009, the vast majority in surface waters. More than half of the water removed (55%) was used to cool the nuclear power plants. Only 6 billions m3 were really "consumed" in the sense that they did not return directly to the natural environment (evaporation, absorption, leaks in the network, etc.).
The finality of these 6 billions m3 "consumed" was: - 48% for irrigation (2.88 billions m3); - 24% for domestic use (1.44 billion m3); - 22% for energy production (1.32 billion m3); - 6% in industry (excluding energy) (0.36 billion m3).
Anyway, this analysis of water collection and consumption does not fit right with what we will describe later in “business statistics”, where a little more than 3 billions m3 will be accounted as “distributed”. These statistics are mainly provided by a private agency “BIPE”, for the use of the sector and the Ministry of Ecology, Sustainable Development and Energy.
Chart 1: quantities of water collected for different uses
2,4
3,6
2,21,4
3,6
1,2
19,1
0
drinking water
6
manufactures
3,6
irrigation
4,8
energy
19,1
water withdrawn from nature (in billions m3)
ground water
surface water
source: BIPE, IFEN, Medad, RNDE
b. Scale effect and decreasing quantities
According to firms engaged in water services, fixed costs (manpower, management and maintenance of equipments, relations with customers, studies, R&D, risks management, some taxes) represent ~80 % of total costs, while variable costs linked to quantities of water distributed and sewed (energy, products for water treatment, purchase of water, waste management, some taxes) weight only ~20 %.
These large scale effects explain, if needed, the situation of « local natural monopoly » for water services and, usually, the predominance of local public bodies (see next section).
Looking at composition of water bills, we can observe the opposite: the fixed part (subscription) accounts for only ~20 % and the variable part for ~80 %. Whenever possible, and especially for big consumers, the water services firms try to increase the subscription fee and to decrease the marginal price of water distributed per m3, in order to align as much as possible prices structure with costs structure.

4 / 14
This economic view of a degressive price of water has nevertheless been recently contested by ecologist and social views, which consider that polluters and wasters should pay more, and thrifty households less, per m3. Hence, the tariff of water m3 has moved recently from degressive prices to fixed prices, and even more recently some municipalities have experimented progressive prices, taking into account the size of the household, etc., and the government envisages a law on this subject.
These political considerations happen after some years of decreasing quantities consumed, which result because of the scale effects into this apparent paradox or scandal: “French consumers pay more (per water m3) because they consume less”. This phenomenon is apparently general to developed countries and linked to more efficient washing machines, more efficient factories (and also fewer factories in western Europe!), and perhaps new ecological sensibility or economic crisis.
Chart 2: decreasing quantities of water consumed in European cities (1991-2001)
French private operators in water services are very sensitive to this phenomenon and to its transcription into economic performance: they think they are more and more cost-efficient, but they appear to be less productive (if their activity is measured only by number of water m3 distributed and sewed) and more expensive with time. The “standard” consumption of a household: 120 m3 per year, which is followed by CPI seems no longer adapted; it should be reduced to 100 m3 or even less.
c. A co-production between public and private bodies
The situation of « local natural monopoly » has led most countries to devote the management of water services to public bodies in Europe. In United Kingdom, they are operated by private operators. It is likely that the private operators in one country do exactly the same activity as public bodies in another one.

5 / 14
Germany
33
67
UK
100
0
Spain
56
44
France
71
29
Netherlands
0
100
Poland
3
97
Germany
8
92
UK
100
0
Spain
62
38
France
56
44
Netherlands
5
95
Poland
3
97
Chart 3: public and private bodies in Europe
Water management
Sewerage managementx
Private bodies
Public bodies
Source: BIPE
In France, however, the picture is more complicate, as public bodies and private operators are generally associated at the local level.
The local government (municipality) is almost always the owner of the facilities. The mayor himself is both responsible as the State representative for the quality of services provided, and as the head of the local government for rates applied to users. He may be criminally convicted for failing to manage correctly water services. The municipalities can be grouped to form a local syndicate responsible for water services.
This local authority can decide to operate itself as a local government-run firm or trust in a company run by a regime of public service delegation. There are several systems of organization and status of public service delegation (see annex 4). The Water Agencies (there are six in France, corresponding to major watersheds) participate in the funding of services and provide support to municipalities through investment taxes on the distribution and wastewater. There are about 35,000 public local authorities responsible for part or totality of water services (to compare to the number of municipalities: ~ 36,000, but sometimes an inhabitant can face 4 or 5 different public local authorities in water services).

6 / 14
Chart 3: economic flows between public and private bodies
taxes: 700 licence fees:1 600
General
Government
bills w/o taxes: 6 700 (= 5 000 + 1 700)
payment to private operator
subcontracting +
different steps in water
treatment chain
community share : 1 700
departments
regions
bills w/o taxes:3 300
treatment
services
other subsidies on
production: 1 200
other subsidies
on production: 1 100
consumers connected to water network:
bills w/o taxes: 10 000
bills with taxes included: 12 300
wate
r ag
en
cie
s
private operators in water services
turnover = 5 000 + x + y
public local authorities responsible of water services
direct payment to public body
(source: professionnal organisation FPEE and BIPE, year 2009)
d. Concentration and Make Matrix industries x products
In front of this multitude of local, private companies working mainly on behalf of them, or by delegation thereof, have the distinction of being highly concentrated. The three largest French enterprises (Veolia, Sita-Lyonnaise des Eaux and Saur) represent 66 % of private activity in the water supply services and 46 % in sewerage (products), and their corresponding groups at least 75 % and 56 % respectively, indicating a particularly net oligopoly system in these markets. This essentially means that access to the major national markets is concentrated in the hands of two major groups, the competition is perhaps not very severe, as changes in service on major markets are relatively rare, typically once every 15 or 20 years, the average duration of a contract between a public local authority and a private operator.
Table 1: structure of turnover in enterprises of water services, by size in millions € Enterprises (main activity)
Size of enterprise Water supply 36 Sewerage -37
0-9 full time employees equivalent 1 202.5 988.8
10-19 full time employees equivalent 147.2 151.8
20-249 full time employees equivalent 1 928.0 814.3
>250 full time employees equivalent 9 034.6 495.2
total 12 312.3 2 450.1
Turnover by industry / Insee: Esane 2010
This concentration explains also the particular structure of the Make matrix: industries (main activity) x products, i.e. the major contribution of industry 36 to production of branch (product) 37 as secondary activity:
Table 2: structure of Make matrix industries x products in millions € Products
Industries Water supply 36 Sewerage -37 Others Total
Water supply 36 7 066.3 2 289.2 1 854.1 11 209.6
Sewerage -37 105.5 1 560.4 209.2 1 875.1
Others 67.8 149.5
Total 7 239.6 3 999.1
Turnover by industry and products (branches) / Insee: Esane 2009
7 / 14
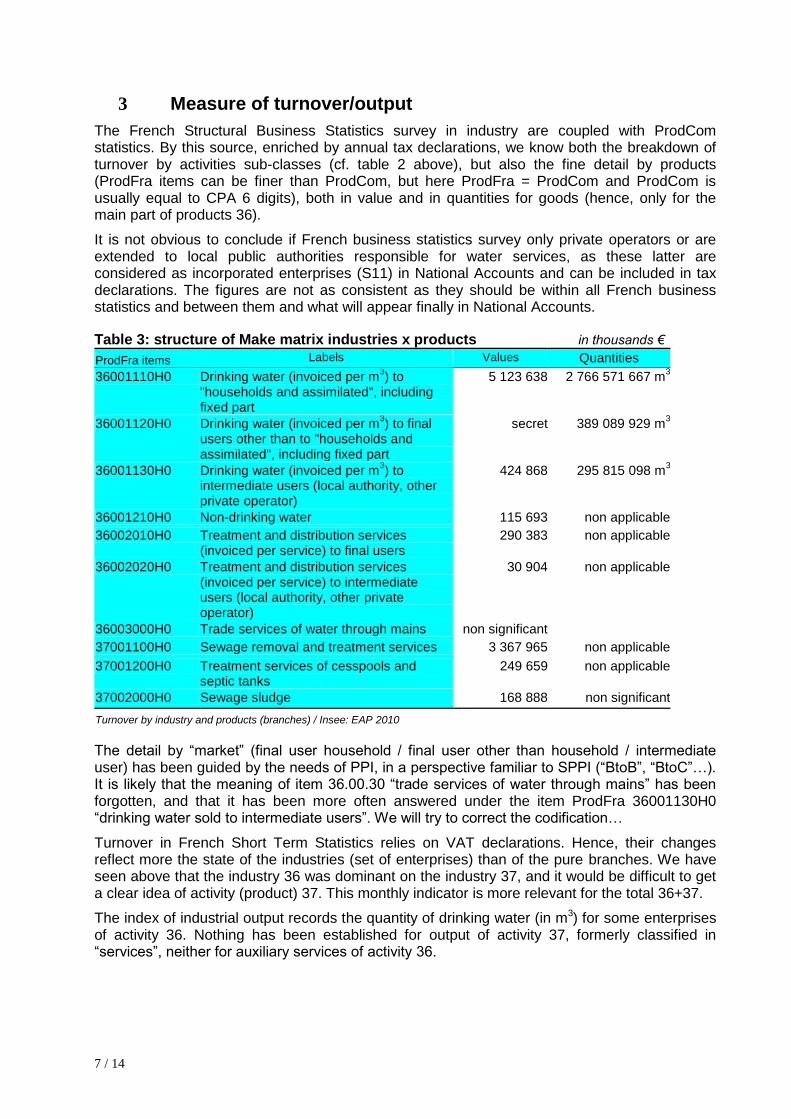
3 Measure of turnover/output
The French Structural Business Statistics survey in industry are coupled with ProdCom statistics. By this source, enriched by annual tax declarations, we know both the breakdown of turnover by activities sub-classes (cf. table 2 above), but also the fine detail by products (ProdFra items can be finer than ProdCom, but here ProdFra = ProdCom and ProdCom is usually equal to CPA 6 digits), both in value and in quantities for goods (hence, only for the main part of products 36).
It is not obvious to conclude if French business statistics survey only private operators or are extended to local public authorities responsible for water services, as these latter are considered as incorporated enterprises (S11) in National Accounts and can be included in tax declarations. The figures are not as consistent as they should be within all French business statistics and between them and what will appear finally in National Accounts.
Table 3: structure of Make matrix industries x products in thousands €
ProdFra items Labels Values Quantities
36001110H0 Drinking water (invoiced per m3) to
"households and assimilated", including fixed part
5 123 638 2 766 571 667 m3
36001120H0 Drinking water (invoiced per m3) to final
users other than to "households and assimilated", including fixed part
secret 389 089 929 m3
36001130H0 Drinking water (invoiced per m3) to
intermediate users (local authority, other private operator)
424 868 295 815 098 m3
36001210H0 Non-drinking water 115 693 non applicable
36002010H0 Treatment and distribution services (invoiced per service) to final users
290 383 non applicable
36002020H0 Treatment and distribution services (invoiced per service) to intermediate users (local authority, other private operator)
30 904 non applicable
36003000H0 Trade services of water through mains non significant
37001100H0 Sewage removal and treatment services 3 367 965 non applicable
37001200H0 Treatment services of cesspools and septic tanks
249 659 non applicable
37002000H0 Sewage sludge 168 888 non significant
Turnover by industry and products (branches) / Insee: EAP 2010
The detail by “market” (final user household / final user other than household / intermediate user) has been guided by the needs of PPI, in a perspective familiar to SPPI (“BtoB”, “BtoC”…). It is likely that the meaning of item 36.00.30 “trade services of water through mains” has been forgotten, and that it has been more often answered under the item ProdFra 36001130H0 “drinking water sold to intermediate users”. We will try to correct the codification…
Turnover in French Short Term Statistics relies on VAT declarations. Hence, their changes reflect more the state of the industries (set of enterprises) than of the pure branches. We have seen above that the industry 36 was dominant on the industry 37, and it would be difficult to get a clear idea of activity (product) 37. This monthly indicator is more relevant for the total 36+37.
The index of industrial output records the quantity of drinking water (in m3) for some enterprises of activity 36. Nothing has been established for output of activity 37, formerly classified in “services”, neither for auxiliary services of activity 36.

8 / 14
Producer Price Indices in water services
a. price determining variables
Goods and services to be measured in price can almost always be linked to volumes of water (number of m3) distributed, treated, sewed. Sometimes, other physical units are used: cost of work of an engineer per day, price for the control of a pipe per metre, price of a well defined and repeated service, etc. and of course subscription is measured per consumer.
As PPI is not supposed to measure absolute levels of prices (per m3) but only changes of prices, the price-determining characteristics are only asked in the recruitment survey for a qualitative knowledge and potential control of a high rate of change some years later.
For instance, it is asked for water distribution (36) if the water collected is surface water, or ground water, or desalination water, and if there are difficulties in delivery of water that need to build lift stations in order to send water throughout the territory. For sewerage (37), it is asked if the water sewerage network is single (stormwater and sewerage in the same network) or divisive (two separate pipes) and above all if the treatment is primary (pretreatment for the removal of solids, oil, and minerals that can be recovered), secondary (biological treatment) or tertiary (removal in addition of nitrogen and phosphorus discharges to less polluting). Are there sanitation lagoons (more natural, ecological method), what is the network cleaning frequency ?
b. Activity and products: at least 4 price indices in one survey
In French industrial PPI, it is quite common to disseminate two kinds of series:
- at basic price (without taxes and subsidies on the products, including intra-group transactions), for NA use, more by activity at NACE 4 digits;
- at purchaser price (with taxes and subsidies on the products, excluding intra-group transactions), for contract-escalation use, more by products at CPA 4 digits and infra.
Most often, they are the same for a same class of activitity and product. In water distribution (36), the tradition was to survey only the price for big consumers (> 6 000 m3 per year) at purchaser price, and a combination of CPI and (this) PPI in order to get a global PPI of the activity at basic price (to tell the truth, the taxes on products were not considered).
In SPPI, the movement is now to measure both BtoB (what we have always done) and BtoAll, consistently with CPI.
Hence, the idea of the new survey was to collect together prices for the product (BtoB, at purchaser price) and for the activity (private operators only, BtoAll, at basic price), simultaneously for water distribution and sewerage:

9 / 14
Table 4: (at least) 4 indices in one survey
Users
Composition of the bill
Final consumers = households
Final consumers <> households
Intermediate consumers = other water
services
Total
Private operator From CPI files From survey From survey BtoAll deflator
of the activity at basic price
Public authority From CPI files From survey
Taxes From CPI files From survey
Total
BtoC = CPI
(including BtoB for 15 %)
BtoB final consumer for contract escalation at purchaser price
BtoB price of intermediate consumption for the same activity
BtoB price of IC of other activities for NA
The price of water distributed to households or sewed for households is not observed from the PPI survey, but extracted from CPI files, hence consistent with CPI. Households represent indeed ~ 80 % of private operators turnover. Moreover, taxes on products weight in average for 18 % of purchaser price without VAT.
c. Sampling and weighting difficulties
A sample of municipalities, not a sample of companies
Due to the highly fragmented organization of markets for water and sanitation, at least in terms of levels of decision on tariffs and prices, and in spite of a highly concentrated level of firms, Insee continued its method of investigation on prices at a local level and not at the firm level, as it is generally the rule in SPPIs elsewhere.
This means that the first level of sampling is constituted by the municipalities and not by companies. The 20 biggest French municipalities have been of course selected in this sample (comprehensive stratum), 40 others have been sampled among municipalities of more than 3 000 inhabitants. When selected for a sampled municipality, a firm engaged in water services is observed for the whole relevant area (generally several municipalities are grouped in a local public authority).
This method has some advantages : the price level is actually set at very fragmented levels, at the level of municipalities or
cities which have established ad hoc organizing units (“EPCI”, 'sivu”, “SIVOM”). Prices practices rely heavily on regions (conditions of access to water, geography) and it is desirable to give priority to the major cities where the largest populations and major industrial centers are concentrated;
also, it is wished to observe price changes at the occasion of a new contract, between the same local public authority and a new private operator (not so easy, indeed).
It also has drawbacks: The re-weighting of the detailed results to compute results for "whole France" is not
easy: If we can know easily the weighting scheme concerning the inhabitants, it is more difficult to extrapolate parts of local turnovers to the global economy.
If the development process to the final consumer price is fairly well documented and known when it comes to households, this is less true for businesses, of which only a part has “domestic” rates (like households).

10 / 14
This method is not optimal in order to observe the intra-activity intermediate consumption (e.g. purchases of water treatment by a sanitation unit of a city, or purchases of wholesale water from partner companies).
d. Use of local bills
The following two pages provide a typical bill for a consumption of 2 500 m3.
This kind of files is also used for a consumption of 120 m3, the standard for CPI.
36 water price for a consumption of 2500 m3
FACTURE
TYPE
unit price volume Amount w/o taxes
total VAT ( 5,5%)
Amount including all taxes
VAT off
yearly subscrition
fixed subscription
meter to private operator 14,60 € 1 14,60 €
subscription to private operator 14,60 € 1 14,60 €
Total 29,21 € 1,606 €
Total VAT inc 30,811 €
Variable consumption
to private operator <120m3 0,93 € 120 111,60 €
to private operator 120m3-200m3 1,39 € 80 111,20 €
to private operator 200m3-6000m3 1,49 € 2 300 3 427,00 €
to local public operator 0,05 € 2 500 125,00 €
Total 3 774,80 € 207,61 €
Total VAT inc 3 982,41 €
taxes to W A water protection tax 0,05 € 2 500 127,50 €
pollution tax 0,29 € 2 500 725,00 €
Total 852,50 € 46,89 €
Total VAT inc 899,39 €
payed by consumer 4 912,61 €
To private operator VAT off
To Commune VAT off
To Water Agency VAT off
VAT to government

11 / 14
37 sewerage price for a consumption of 2500 m3
FACTURE
TYPE
unit price volume Amount w/o taxes
total VAT ( 5,5%)
Amount including all taxes
VAT off 0,06 €
Abonnent annuel
fixed subscription
private operator 14,60 € 1 14,60 € 0,80 €
commune
Total 14,60 € 0,80 €
Total VAT inc 15,41 €
Variable consumption
to private operator <120m3 1,09 € 120 130,80 € 7,19 €
to private operator 120m3-200m3 1,29 € 80 103,20 € 5,68 €
to private operator 200m3-6000m3 1,38 € 2 300 3 174,00 € 174,57 €
to local public operator 0,14 € 2 500 350,00 € 19,25 €
Total 3,90 € 3 758,00 € 206,69 €
Total VAT inc 3 964,69 €
taxes to W A network modernization tax 0,18 € 2 500 450,00 € 24,75 €
Total 0,18 € 450,00 € 24,75 €
Total VAT inc 474,75 €
payed by consumer 4 454,85 €
To private operator VAT off
To Commune VAT off
To Water Agency VAT off
VAT to government
12 / 14
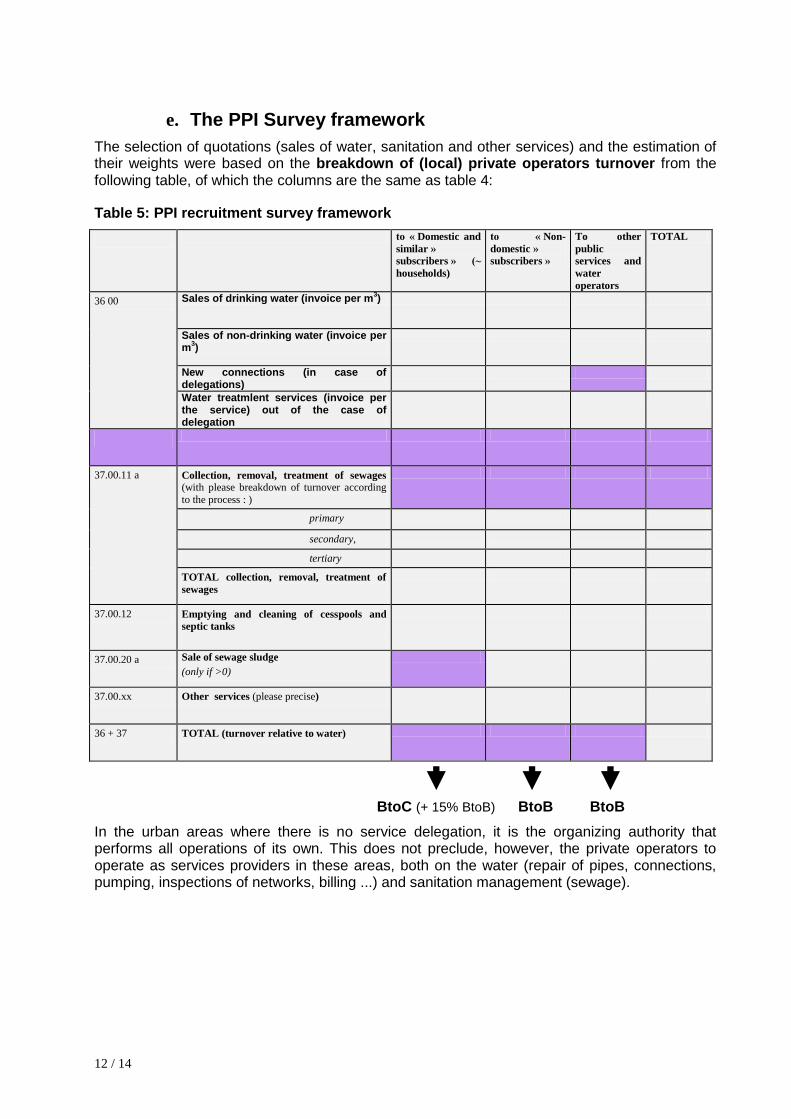
e. The PPI Survey framework
The selection of quotations (sales of water, sanitation and other services) and the estimation of their weights were based on the breakdown of (local) private operators turnover from the following table, of which the columns are the same as table 4:
Table 5: PPI recruitment survey framework
to « Domestic and
similar »
subscribers » (~
households)
to « Non-
domestic »
subscribers »
To other
public
services and
water
operators
TOTAL
36 00 Sales of drinking water (invoice per m3)
Sales of non-drinking water (invoice per m
3)
New connections (in case of delegations)
Water treatmlent services (invoice per the service) out of the case of delegation
37.00.11 a Collection, removal, treatment of sewages
(with please breakdown of turnover according
to the process : )
primary
secondary,
tertiary
TOTAL collection, removal, treatment of
sewages
37.00.12 Emptying and cleaning of cesspools and
septic tanks
37.00.20 a Sale of sewage sludge (only if >0)
37.00.xx Other services (please precise)
36 + 37 TOTAL (turnover relative to water)
BtoC (+ 15% BtoB) BtoB BtoB
In the urban areas where there is no service delegation, it is the organizing authority that performs all operations of its own. This does not preclude, however, the private operators to operate as services providers in these areas, both on the water (repair of pipes, connections, pumping, inspections of networks, billing ...) and sanitation management (sewage).

13 / 14
4 Quality adjustment issues
Do private operators provide water or water services?
The economic classification suggests that they provide mainly water in water distribution (36) and mainly services in sewerage (37). But some statisticians at Insee are not convinced, since according to the law, water is reputed “communis res” in France, hence we could conclude that it cannot be traded (although wholesale trade of water is used) but only distributed, i.e. water services would only invoice services.
This subtle distinction operates when we have to consider more and more polluted water (or more rare) treated by water services in order to provide distributed water of a constant quality. There should be no quality adjustment for the provision of a good (as it is of a constant quality), but there should be a positive one for the provision of a service.
French private operators are convinced to provide services of more and more quality, and regret it is not reflected in CPI for instance.
Quality adjustments are then envisaged in water services (but not yet implemented), as a lot of qualitative and quantitative indicators are being stored in a public organisation called ONEMA (~ Office for National Water and Aquatic Environments). These indicators are now mandatory (Decree No. 2007-675 of 2 May 2007), they are published annually by the local public authorities in their annual reporting.
17 indicators cover water distribution services and 19 sewerage. Among them, 3 indicators describe the water quality, 27 indicators the services quality, 6 the financial situation. For instance, indicator P101.1 is the “compliance rate of water with regard to microbiology”, indicator P102.1 the “Compliance rate of water with respect to the physico-chemical parameters”, indicator P107.2 the “Average renewal rate of drinking water networks”.
If it seems interesting to combine these indicators as quality indicators for price indices, it should be remembered that
a synthetic indicator is to build and validate with stakeholders;
all the territory should be covered by those indicators, at least those concerned with price indices calculated, which is not yet the case;
these indicators often relate to the final customer, and do not always relate to the production reported by the operators: when an operator works on behalf of a local public authority, it is quite always the local public authority, and then the responsibility for the quality of water should be divided (how?) between the private operator and the local public authority;
the indicators are very consensual, and either quite close to 0 % or 100 %, either quite imprecise.
In any case, in order to remain understandable, Insee should disseminate PPI without quality adjustment, and quality adjusted PPI as a variant.

14 / 14
Annex 1 indicateurs de performance ONEMA
industry theme item description
water Water quality P101.1 Compliance rate of water with regard to microbiology
water
Water quality P102.1 Compliance rate of water with respect to the physico-chemical parameters
water Networks P103.2
Knowledge and asset management index of drinking water networks
water Networks P104.3 Performance of the distribution network
water Networks P105.3 Linear index of volumes not counted
water Networks P106.3 Linear loss in network index
water Networks P107.2 Average renewal rate of drinking water networks
water Water quality P108.3 Index related to the protection of water resources progress
water Financial management P109.0 Amount of debt forgiveness or payments to a solidarity fund
water Subscribers P151.1 Rate of occurrence of unplanned outages
water Subscribers P152.1
Compliance rate of official deadline for opening connections for new subscribers
water Financial management P153.2 Time for extinguishment of the local public authority debt
water Financial management P154.0 Default rate on water bills of the previous year
water Subscribers P155.1 Claims rate
sewerage Subscribers P201.1 Service rate by networks of wastewater collection
sewerage Networks P202.2
Knowledge and asset management networks wastewater collection index
sewerage
Collection P203.3 Compliance of the effluent collection with the requirements defined under Decree 94 …
sewerage
Purification P204.3 Compliance of the cleaning equipments with the requirements specified under Decree 94…
sewerage
Purification P205.3 Compliance of the performance of the cleaning equipments with the requirements defined under Decree 94
sewerage
Sludge P206.3 Rate of sludge from treatment plants, evacuated by chains consistent with the regulations
sewerage Financial management P207.0 Amount of debt forgiveness or payments to a solidarity fund
sewerage Subscribers P251.1 Effluent overflow rate into users premises
sewerage Networks
P252.2 Number of points in the collection system requiring frequent cleaning interventions per 100 km
sewerage Networks P253.2 Average renewal rate of wastewater collection networks
sewerage
Purification P254.3 Compliance of performance of cleaning equipments, according to the requirements of the water police
sewerage Collection P255.3
Index of knowledge of discharges to the natural environment by networks of wastewater collection
sewerage Financial management P256.2 Time for extinguishment of the community debt
sewerage Financial management P257.0 Default rate on water bills of the previous year
sewerage Subscribers P258.1 Claims rate