munich personal repec archive - uni-muenchen.de · munich personal repec archive ... few noteworthy...
TRANSCRIPT
MPRAMunich Personal RePEc Archive
Rationality of business operationalforecasts: evidence from Malaysiandistributive trade sector
Chin-Hong Puah and Shirly Siew-Ling Wong and Muzafar
Shah Habibullah
Department of Economics, Faculty of Economics and Business,Universiti Malaysia Sarawak, Department of Economics, Faculty ofEconomics and Management, Universiti Putra Malaysia
March 2012
Online at https://mpra.ub.uni-muenchen.de/37599/MPRA Paper No. 37599, posted 24 March 2012 07:22 UTC

1
Rationality of Business Operational Forecasts: Evidence from Malaysian Distributive Trade Sector
Chin-Hong Puah1, Shirly Siew-Ling Wong2 and Muzafar Shah Habibullah3
Abstract
The underlying nature of forecast optimization makes the rational expectations hypothesis (REH) a framework that is theoretically consistent with the expectations formation produced by economic agents under well-defined assumptions of unbiased forecasts and efficient utilization of available information. Most of the recent literature on REH testing has favored a direct procedure based on survey data to validate the theoretical soundness of REH. However, the ability of survey materials to reflect the economic agent’s true expectations remains unconvincing, as previous empirical studies on survey-based expectations have offered mixed evidence of forecast rationality. The present study involved an attempt to evaluate the forecast rationality of survey materials from the Malaysian perspective, as empirical evidence from the view of a developing nation is clearly limited. An expectational series on gross revenue and capital expenditure, spanning 1978 through 2007, was subjected to tests of unbiasedness, non-serial correlation, and efficiency to observe whether the business operational forecasts contributed by the distributive trade sector in Malaysia can be accepted as rational forecasts of the actual realized values. We found that both operational variables are being irrationally constructed, suggesting that forecasters in the distributive trade sector are not rational when they formulate business expectations. Thus, business firms in the examined sector are encouraged to incorporate more relevant information into their business operational forecasts to facilitate more accurate and realistic business forecasting.
JEL Classification Codes: C12, C22, C83, D84, L81 Keywords: Rational Expectations Hypothesis, Rationality tests, Survey Data, Distributive Trade
1 Corresponding author. Department of Economics, Faculty of Economics and Business, Universiti Malaysia Sarawak, 94300 Kota Samarahan, Sarawak, Malaysia. E-mail: [email protected] 2Department of Economics, Faculty of Economics and Business, Universiti Malaysia Sarawak, 94300 Kota Samarahan, Sarawak, Malaysia. 3Department of Economics, Faculty of Economics and Management, Universiti Putra Malaysia, 43400 UPM Serdang, Selangor, Malaysia.

2
Introduction
The impressiveness of expectational data in forecasting has been undeniable since Lui,
Mitchell,and Weale (2011) noted forecasters’ broad recognition of expectational series in
the forecasting process. Gertchew (2007) defined expectations as unnoticed opinions
about the future course of events that individuals form in their minds. A human’s
subjective sentiment toward any near-term economic or business affair, once dictated by
behavioral bases and mechanisms of expectation formation, are now considered an
anticipation of forthcoming economic scenarios and business climates. That is,
expectation is the prediction of the impact of future values of economic and business
variable conditions on the current stage of variables that are appropriate to the
contemporary internal and external environments. Business expectational statistics
constitute a primary and forward-looking channel through which to examine the changing
business and economic prospects foreseen by economic agents in the business
community. As economic risk and uncertainty dominate the contemporary economic
environment, a down-to-earth business setting with perfect foresight and economic
certainty is virtually impossible to achieve. Thus, a certain degree of divergence between
the anticipated series and its realized value is realistically accepted as forecast error.
Indeed, Muth (1961) argued that economists believe that economic forecasts are not
error-free and that errors have played a significant role in most of the rationalization
regarding changes in the stage of business activities.
In fact, the mechanism of expectations formation and its role in the business context are
not newly found in the economic literature, as Keynes (1936) emphasized expectations
formation in terms of business output and employment. In the microeconomics and
business context, Muth’s (1961) rational concept is theoretically more appealing than
other theories of expectations formation. The notion of rationality constitutes an
expectation formation mechanism that is assumed to guide economic agents in their
decision making. The rational expectations hypothesis (REH) assumes that people in
general do not waste information, as rational behavior would eventually drive them to use
3
all publicly available and cost-free information in an efficient manner. The assumption is
that in the long run, through successive learning, people will no longer consistently make
mistakes while dealing with future forecasts and systematic forecast errors will be ruled
out. Thus, forecast error is in fact unbiased and efficient in statistical explanations if
rationality in Muth’s sense applies. Business people typically attempt to optimize scarce
resources and various opportunity costs to account for all available information in their
cost-benefit analyses and future forecasts so as to engage efficiently and profitably in
their economic self-interest. Thus, microeconomics and business assumptions of profit
and utility-maximizing behaviors are apparently consistent with the basic principles of
rational conduct.
For decades, numerous empirical works have been devoted to assessing the consistency
of REH in real-world setting. Nevertheless, mixed empirical evidence on REH validity
does not provide solid support for the rational assumption in real economic settings even
though the theoretical firmness of REH has long been established. Because Muth’s
indirect testing procedure incorporates actual market outcomes, most of the earlier work
on REH testing employed indirect testing based on constructed measures of expectations
to evaluate the validity of REH. In contrast, Friedman (1980), Keane and Runkle (1990),
Beach et al. (1995), Osterberg (2000), Forsells and Kenny (2002), Mitchell and Pearce
(2005), Gao et al. (2008), and other proponents of survey-based studies have used survey
data in REH testing. The rationale was that Muth’s indirect testing procedure always
jointly tests the REH with the underlying model specification, while survey data serve as
a direct measure of market expectations, and problems caused by joint testing can be
avoided. This is because survey data are collected directly from individual responses and
empirical support can be drawn independently from any conjoining economic theory.
Even so, future studies must puzzle out whether direct testing based on survey data
(Aggarwal & Mohanty, 2000) or the indirect testing proposed by Muth (1961) provides
convincing evidence of REH validity, as empirical support contributed by previous
studies has been decidedly mixed.
4
Hitherto, the ability of survey materials to reflect the economic agent’s true expectations
was in doubt as there exists no conclusive argument from past studies that can
convincingly verify the REH proposition. As a result, the consistency of REH in real-
world settings is ambiguous and this undoubtedly will encourage further study in this
area. Furthermore, it is essential to note that most of the literature on REH testing has
involved developed economies. For instance, Madsen (1993) studied forecast rationality
in Denmark, Finland, France, Germany, Japan, the Netherlands, Norway, Sweden, and
the UK, while Lovell (1986), Easley and O′Hara (1991), Richardson and Smith (1991),
Takagi (1991), and Baghestani and Kianian (1993) tested the empirical relevance of REH
in various economic sectors of the US economy. Kim (1997) contributed a study on REH
testing in Austria, Aggarwal and Mohanty (2000) offered a study of Japan, whereas and
Nielsen (2003) and Dais et al. (2008) studied the REH proposition in the European Union
and European countries, respectively. To the best of our knowledge, few researchers have
empirically tested REH in developing countries. In this regard, Marais and Conradie
(1997) performed micro-level tests for rational expectations in South Africa, while the
few noteworthy works on REH testing from the Malaysian business perspective came
from Habibullah (1994a, 1994b, 1997, 2001, 2003, 2005). In addition, few works by
Puah et al. (2011), Wong et al. (2011), Chong et al. (2012), and Puah et al. (2012) further
illuminated the understanding of forecast rationality in the Malaysia business
environment.
Despite all this, each individual study that concentrated on a single-sector level in
Malaysia was deficient to create a summary or presumption whereby the REH concept
could be reconciled with reality in the way spelled out by Muth (1961). Thus, additional
work to fill the gap, especially in previously unexplored economic sectors, is certainly
welcomed, as predictive power and survey forecast materials are of significant economic
value in dynamic business environments. On the whole, the aim of this study was to
explore the relevancy of REH on value-related business operational forecasts compiled
by the Department of Statistics Malaysia (DOSM) in various issues of the “Business
Expectations Survey of Limited Companies” (BESLC). Distributive trade is one of the
5
most dominant and fast-growing subsectors in the service sector, and the prospect of this
subsector influencing consumer sentiment toward future spending and the country’s
services trade, domestically and globally, is sizable. Hence, publicly available surveys of
business forecasts play an important role in shaping the market’s perception of the
current status and future strength of an industry. Thus, the ability of survey materials to
demonstrate rational forecasts is vital to enhance their usefulness in reflecting perceptive
future outlooks. In this instance, we sought to shed light on forecast rationality within the
context of Malaysian services subsectors, specifically wholesale and retail trade that as a
whole represents the country’s distributive trade sector. The rest of the paper is organized
as follows. Section 2 contains a discussion of the theoretical basis of REH, while section
3 contains a brief discussion of the data description and methodological aspects of the
study. Section 4 consists of the presentation of empirical results and discussion, and
section5 provides study conclusions.
Theoretical Basis of Rational Expectations
Muth (1961) formulated the mechanism of rational forecasts under the assumptions of a
well-defined economic structure and a general tendency of economic agents to fully use
all publicly available and cost-free information when forming expectations. Muth’s
framework implicitly suggests that expectations conceived using rational conduct are
indeed informed predictions of future events that will not differ substantially from the
predictions of relevant economic theory (Muth, 1961). In other words, people’s
subjective expectations of an economic variable are, on average, identical to the true
values of the variable (Sheffrin, 1983). If we let Пt denote the realization of the target
variable at time t and *tΠ denote the forecast made for time t at time t-1, we can write the
mathematical expression of REH as:
( )1*
−ΙΠ=Π ttt E (1)
6
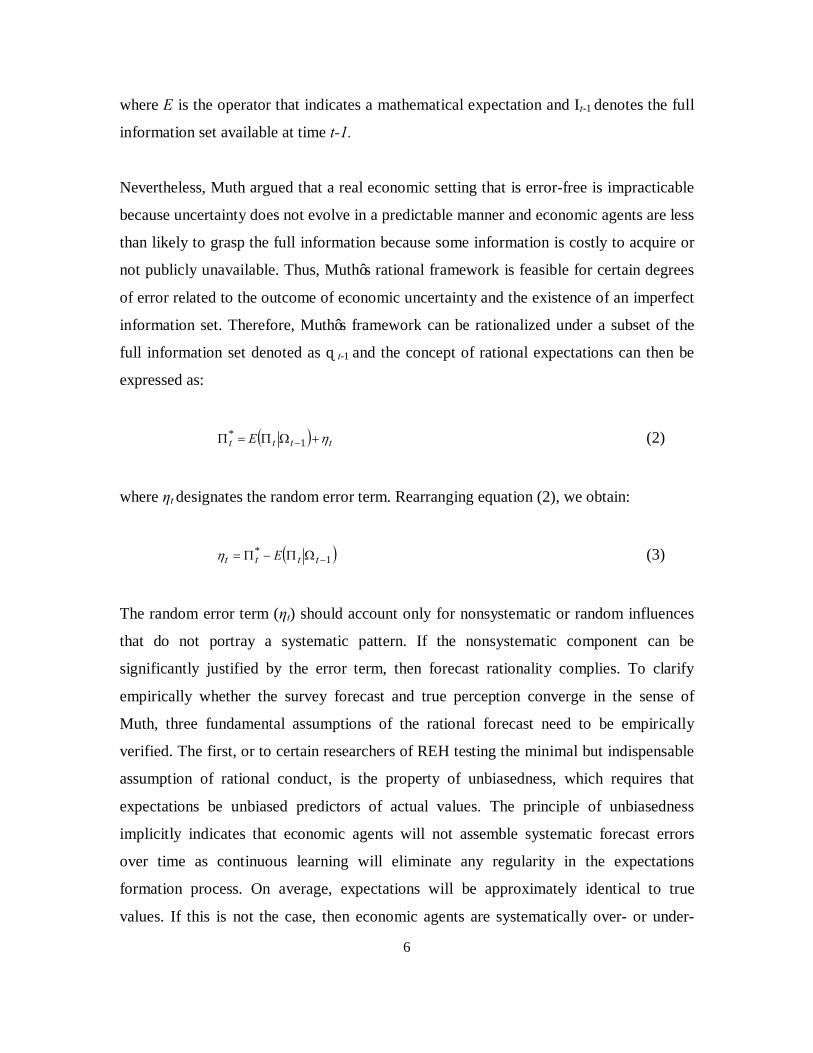
where E is the operator that indicates a mathematical expectation and It-1 denotes the full
information set available at time t-1.
Nevertheless, Muth argued that a real economic setting that is error-free is impracticable
because uncertainty does not evolve in a predictable manner and economic agents are less
than likely to grasp the full information because some information is costly to acquire or
not publicly unavailable. Thus, Muth’s rational framework is feasible for certain degrees
of error related to the outcome of economic uncertainty and the existence of an imperfect
information set. Therefore, Muth’s framework can be rationalized under a subset of the
full information set denoted as Ωt-1 and the concept of rational expectations can then be
expressed as:
( ) tttt E η+ΩΠ=Π −1* (2)
where ηt designates the random error term. Rearranging equation (2), we obtain:
( )1*
−ΩΠ−Π= tttt Eη (3)
The random error term (ηt) should account only for nonsystematic or random influences
that do not portray a systematic pattern. If the nonsystematic component can be
significantly justified by the error term, then forecast rationality complies. To clarify
empirically whether the survey forecast and true perception converge in the sense of
Muth, three fundamental assumptions of the rational forecast need to be empirically
verified. The first, or to certain researchers of REH testing the minimal but indispensable
assumption of rational conduct, is the property of unbiasedness, which requires that
expectations be unbiased predictors of actual values. The principle of unbiasedness
implicitly indicates that economic agents will not assemble systematic forecast errors
over time as continuous learning will eliminate any regularity in the expectations
formation process. On average, expectations will be approximately identical to true
values. If this is not the case, then economic agents are systematically over- or under-

7
estimating the realized value (Nielsen, 2003, p. 2). The unbiased nature of a survey
forecast can be depicted mathematically by the following formula:
( ) 0=tE η (4)
The formula implies that, over time, the random error term (ηt) has, on average, a zero
mean, thus, the subjective expectations coincide with the corresponding mathematical
expectations.
A survey forecast that satisfies the property of unbiasedness also needs to comply with
the property of lack of serial correlation. This property entails past forecast errors not
being serially correlated with current forecast errors. In other words, current forecast
errors and past forecast errors should be free of autocorrelation. Otherwise, there exists a
significant interdependent relationship between past and current forecast errors,
suggesting that economic agents have not sufficiently corrected based on past mistakes.
Furthermore, violating the property of lack of serial correlation also brings about the
rejection of unbiasedness, as serial correlation between the random error term (ηt) and the
expected value ( *tΠ ) again reinforces the existence of biased forecasts. The principle of
lack of serial correlation can be expressed as follows:
( ) 0,0 ≠∀=− iittE ηη (5)
Finally, the efficiency property requires that economic agents efficiently incorporate and
utilize all available information in the history when forming future expectations. The
principle of efficiency can be written as follows:
( ) 0,, 21 =ΠΠ −− KtttE η (6)
This mathematical representation indicates that the forecast error, conditional on the
current and past values of the predicted variable, has a mean of zero. All in all, Muth’s

8
rational argument calls for acceptance of forecast rationality if forecast errors are
minimized in a rational manner from which unbiasedness and efficiently emerge. Again,
to assess the usefulness of the survey data, or to clarify the extent to which survey
forecasts and true expectations converge, validating the properties of REH in Muth’s
sense is indeed a noteworthy approach (Egginton, 1999).
Data and Methodology
Data Description
The present study employed bi-annual survey data published by the DOSM covering
January 1978 until December 2007 to observe the rationality of business operational
forecasts in Malaysia. The time series of survey-based expectational data, with its
respective actual realized series on gross revenue and capital expenditure, was compiled
from various issues of the BESLC. As stated in the BESLC survey report, 270 survey
respondents, inclusive of both large public and private limited companies, were selected
based on a three-stage sampling design. During the initial stage, the respective sectors’
contribution to gross revenue, employment, and net value of the fixed assets in the overall
business segment was evaluated to allocate the 270 companies among the sectors. Next,
the representation of industry within each sector was derived from the industries’
contribution to gross revenue in the sector. Finally, the individual company’s contribution
to gross revenue was calculated and used to select the companies within each industry.
The BESLC survey data were the only readily and publicly available long-span survey
materials that allowed us to evaluate current performance as well as future economic
trends in the business domain. In addition, another basis for the use of BESLC survey
expectational data was that the data were reported on a quantitative time series basis,
which allowed us to test the REH properties directly without the need for any
quantification procedure. Breitung and Schmeling (2010) tested the quality of quantified
9
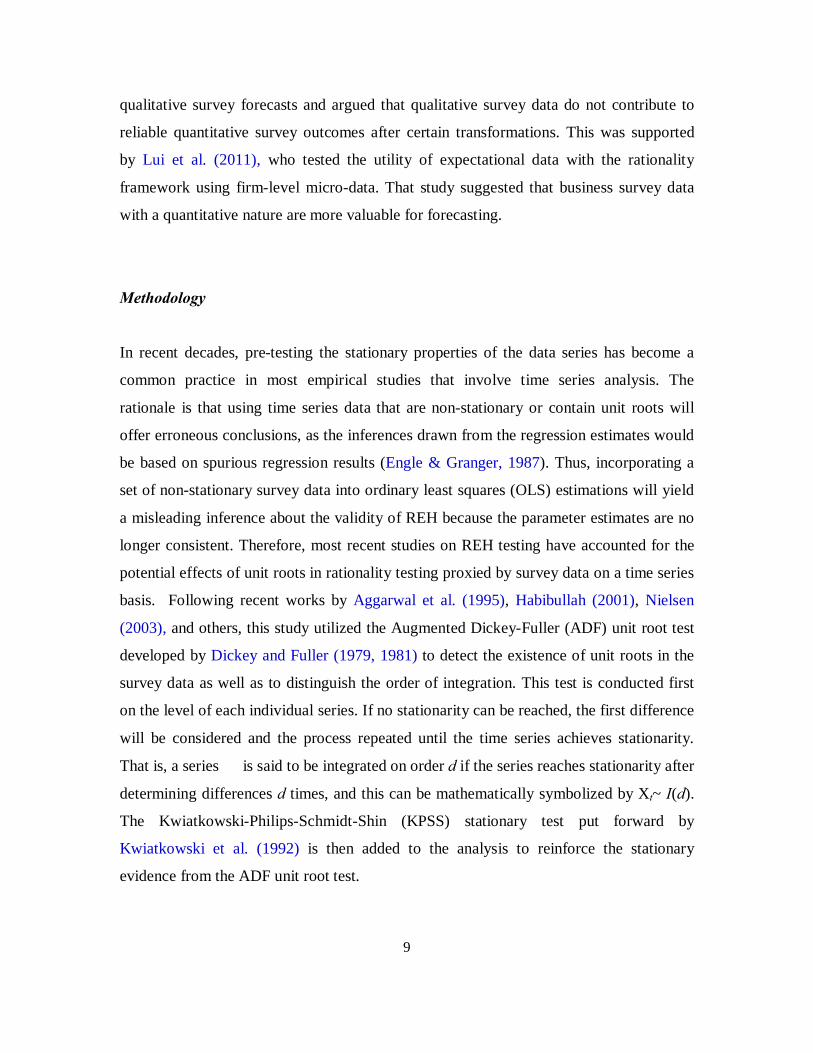
qualitative survey forecasts and argued that qualitative survey data do not contribute to
reliable quantitative survey outcomes after certain transformations. This was supported
by Lui et al. (2011), who tested the utility of expectational data with the rationality
framework using firm-level micro-data. That study suggested that business survey data
with a quantitative nature are more valuable for forecasting.
Methodology
In recent decades, pre-testing the stationary properties of the data series has become a
common practice in most empirical studies that involve time series analysis. The
rationale is that using time series data that are non-stationary or contain unit roots will
offer erroneous conclusions, as the inferences drawn from the regression estimates would
be based on spurious regression results (Engle & Granger, 1987). Thus, incorporating a
set of non-stationary survey data into ordinary least squares (OLS) estimations will yield
a misleading inference about the validity of REH because the parameter estimates are no
longer consistent. Therefore, most recent studies on REH testing have accounted for the
potential effects of unit roots in rationality testing proxied by survey data on a time series
basis. Following recent works by Aggarwal et al. (1995), Habibullah (2001), Nielsen
(2003), and others, this study utilized the Augmented Dickey-Fuller (ADF) unit root test
developed by Dickey and Fuller (1979, 1981) to detect the existence of unit roots in the
survey data as well as to distinguish the order of integration. This test is conducted first
on the level of each individual series. If no stationarity can be reached, the first difference
will be considered and the process repeated until the time series achieves stationarity.
That is, a series is said to be integrated on order d if the series reaches stationarity after
determining differences d times, and this can be mathematically symbolized by Xt~ I(d).
The Kwiatkowski-Philips-Schmidt-Shin (KPSS) stationary test put forward by
Kwiatkowski et al. (1992) is then added to the analysis to reinforce the stationary
evidence from the ADF unit root test.
10
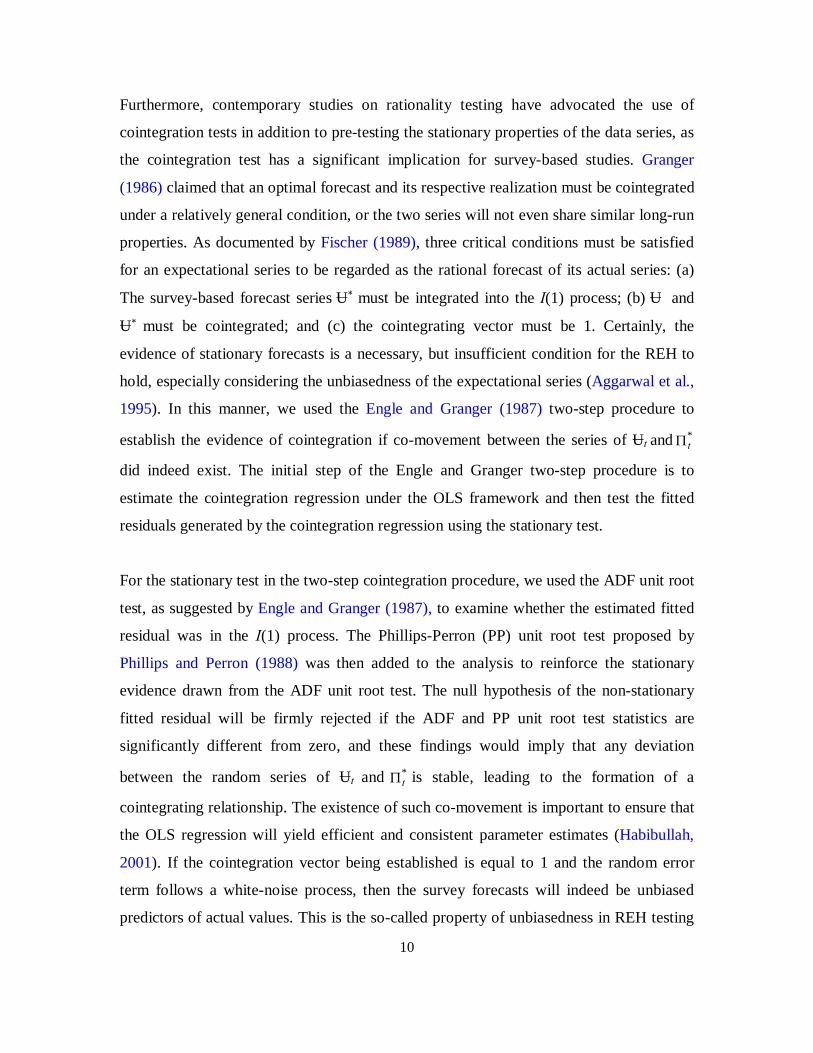
Furthermore, contemporary studies on rationality testing have advocated the use of
cointegration tests in addition to pre-testing the stationary properties of the data series, as
the cointegration test has a significant implication for survey-based studies. Granger
(1986) claimed that an optimal forecast and its respective realization must be cointegrated
under a relatively general condition, or the two series will not even share similar long-run
properties. As documented by Fischer (1989), three critical conditions must be satisfied
for an expectational series to be regarded as the rational forecast of its actual series: (a)
The survey-based forecast series Π∗ must be integrated into the I(1) process; (b) Π and
Π∗ must be cointegrated; and (c) the cointegrating vector must be 1. Certainly, the
evidence of stationary forecasts is a necessary, but insufficient condition for the REH to
hold, especially considering the unbiasedness of the expectational series (Aggarwal et al.,
1995). In this manner, we used the Engle and Granger (1987) two-step procedure to
establish the evidence of cointegration if co-movement between the series of Πt and *tΠ
did indeed exist. The initial step of the Engle and Granger two-step procedure is to
estimate the cointegration regression under the OLS framework and then test the fitted
residuals generated by the cointegration regression using the stationary test.
For the stationary test in the two-step cointegration procedure, we used the ADF unit root
test, as suggested by Engle and Granger (1987), to examine whether the estimated fitted
residual was in the I(1) process. The Phillips-Perron (PP) unit root test proposed by
Phillips and Perron (1988) was then added to the analysis to reinforce the stationary
evidence drawn from the ADF unit root test. The null hypothesis of the non-stationary
fitted residual will be firmly rejected if the ADF and PP unit root test statistics are
significantly different from zero, and these findings would imply that any deviation
between the random series of Πt and *tΠ is stable, leading to the formation of a
cointegrating relationship. The existence of such co-movement is important to ensure that
the OLS regression will yield efficient and consistent parameter estimates (Habibullah,
2001). If the cointegration vector being established is equal to 1 and the random error
term follows a white-noise process, then the survey forecasts will indeed be unbiased
predictors of actual values. This is the so-called property of unbiasedness in REH testing
11
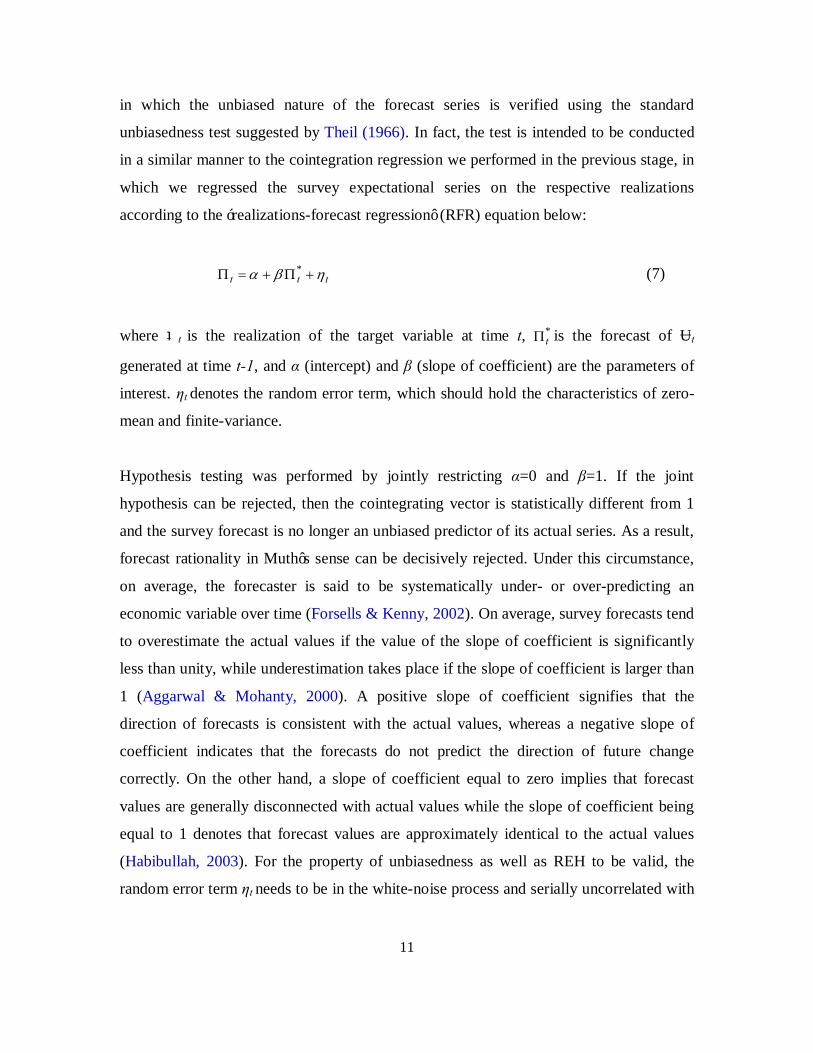
in which the unbiased nature of the forecast series is verified using the standard
unbiasedness test suggested by Theil (1966). In fact, the test is intended to be conducted
in a similar manner to the cointegration regression we performed in the previous stage, in
which we regressed the survey expectational series on the respective realizations
according to the ‘realizations-forecast regression’ (RFR) equation below:
ttt ηβα +Π+=Π * (7)
where Пt is the realization of the target variable at time t, *tΠ is the forecast of Πt
generated at time t-1, and α (intercept) and β (slope of coefficient) are the parameters of
interest. ηt denotes the random error term, which should hold the characteristics of zero-
mean and finite-variance.
Hypothesis testing was performed by jointly restricting α=0 and β=1. If the joint
hypothesis can be rejected, then the cointegrating vector is statistically different from 1
and the survey forecast is no longer an unbiased predictor of its actual series. As a result,
forecast rationality in Muth’s sense can be decisively rejected. Under this circumstance,
on average, the forecaster is said to be systematically under- or over-predicting an
economic variable over time (Forsells & Kenny, 2002). On average, survey forecasts tend
to overestimate the actual values if the value of the slope of coefficient is significantly
less than unity, while underestimation takes place if the slope of coefficient is larger than
1 (Aggarwal & Mohanty, 2000). A positive slope of coefficient signifies that the
direction of forecasts is consistent with the actual values, whereas a negative slope of
coefficient indicates that the forecasts do not predict the direction of future change
correctly. On the other hand, a slope of coefficient equal to zero implies that forecast
values are generally disconnected with actual values while the slope of coefficient being
equal to 1 denotes that forecast values are approximately identical to the actual values
(Habibullah, 2003). For the property of unbiasedness as well as REH to be valid, the
random error term ηt needs to be in the white-noise process and serially uncorrelated with
12
*tΠ . Therefore, the Breusch-Godfey autocorrelation Lagrange multiplier (LM) test served
as the diagnostic test to check whether the disturbance terms were white noise.
Next, the efficiency of survey forecasts in incorporating past information was examined
using a non-serial correlation test and a weak-form efficiency test. The former test aims
to detect the existence of series correlation between the current forecast error and the
series’ past forecast error. If the null hypothesis of serial correlation can be rejected, then
the survey forecast is said to be excused from the potential effect of unsystematic forecast
error, implying that forecasters learn from their past mistakes and efficiently use
information obtained from past mistakes to perform future forecasts. Following Evans
and Gulamani (1984), the existence of serial correlation of forecast errors can be detected
by estimating the regression as follows:
∑=
− ++=p
ititit
10 εηδδη (8)
where ηt is the forecast error and p is the lag length with ,,3,2,1 pi K∈ . The rejection of
the joint null hypothesis H0: (δ0δi)=0, ,,3,2,1 pi K∈ indicated that there is no serial
correlation between the forecast errors.
Ultimately, the latter test was used to examine the role of past actual information in
survey forecasts. In other words, we employed Mullineaux’s (1978) weak-form
efficiency test to investigate whether forecasters efficiently incorporate all past available
information into their forecasting process. Mullineaux’s (1978) framework can be
employed by estimating the following equation:
tt
N
iit ωθθη +Π+= −
=∑ 1
10 (9)
13
where ηt is the forecast error and ωt is the random disturbance term. θ0 and θi are the
parameters to be estimated and restricted to zero in the joint hypothesis testing. That is,
we tested the null hypothesis H0: (θ0, θi) = 0, ,,3,2,1 Ni K∈ against its alternative and
rejected the evidence of forecast efficiency if the parameter estimates were statistically
different from zero. In this circumstance, the past values of the target variable were not
fully incorporated in explaining the error between the realized values and the expected
values. Thus, the survey expectational data were inconsistent with the REH in Muth’s
sense.
Empirical Results and Discussion
In time series analysis, the presence of unit roots indicates the existence of the random
walk effect, yielding non-stationary time series data. Thus, a series is said to be stationary
and integrated in the respective order if the result of unit root testing calls for a rejection
of the null hypothesis of unit root. The results of ADF and KPSS unit root tests for both
actual and expected values of gross revenue and capital expenditure are tabulated in
Table 1. The findings conclusively suggest that all the actual and expected series of gross
revenue and capital expenditure are unable to achieve stationary at level because the null
hypothesis of the unit root cannot be rejected since the absolute values of the computed t-
statistic are smaller than the critical values as proposed by MacKinnon (1996). However,
they are stationary at the significant level of 1% after differencing once. Therefore, all the
involved series are stationary at their first difference and integrated to the order of 1, or
possess the I(1) stochastic process.
[Insert Table 1 here]
After identifying the time-series properties of the data, we proceeded to cointegration and
unbiasedness testing. To detect evidence of cointegration, we performed the two-step
Engle and Granger (1987) cointegration test to test the null hypothesis of non-
14
cointegration. Conversely, the unbiased nature of the forecast series was examined based
on the RFR unbiasedness test proposed by Theil (1966). The findings of the cointegration
and unbiasedness tests are collectively presented in Table 2. The ADF and PP test
statistics reported in Table 2 are statistically significant at the 1% level, suggesting that
the null hypothesis of non-cointegration can be firmly rejected. Under this circumstance,
the actual series and its respective forecast series are said to be sharing a common
stochastic trend and able to converge to a similar equilibrium path in the long run. Hence,
the existence of such co-movement would ensure that, at least in the long term, any
modestly acceptable forecast series would not deviate far from the actual realized series.
The result of unbiasedness testing based on OLS estimation indicated that the slope
coefficient is significantly positive at the 1% level in all cases, implying that, on average,
firms in the Malaysian distributive trade sector are able to predict correctly the direction
of future changes in their operational variables.
Furthermore, the joint hypothesis of α=1 and β =1 was firmly rejected at the 10% and 1%
levels for prediction of gross revenue and capital expenditure, respectively. This finding
suggests that business firms in the distributive trade sector tend to be biased in predicting
their business operational variables. Moreover, the estimated slopes coefficients
empirically signaled that the forecasters in the investigated sector tend to under predict
the true values of gross revenue, but are likely to over predict the realized values of
capital expenditure. In any case, the unbiasedness properties of REH are evidently
violated due to the failure to pass the RFR unbiasedness test. By and large, the results of
diagnostic testing reported in Table 2 confirm that the estimated residual of the RFR
equation is consistent with the requirements of forecast rationality, as the findings from
the LM tests showed no evidence of serial correlation in any of the cases, indicating that
the disturbance terms or error terms in all the series under study were white noise
(Habibullah, 2001).
[Insert Table 2 here]

15
In the subsequent rationality test, we examined whether the survey data incorporated past
information. The results of non-serial correction testing and weak-form efficiency testing
drawn under the basis of the F-statistic are depicted collectively in Table 3. To maintain
the degree of freedom, we provide the findings up to the lagged four forecast error values
only. In all cases, the results of non-serial correlation testing suggested that the null
hypothesis of H0: (δ0δi) = 0, 4,,3,2,1 K∈i can be firmly rejected at the 1% level, implying
that the present forecast errors are serially correlated with the past forecast errors up to
the lagged four forecast error values. Hence, the firms in the investigated sector are not
accounting sufficiently for past forecast errors as part of the available information set
when forming their expectations on capital expenditure and gross revenue.
[Insert Table 3 here]
It is important to note that the properties of uncorrelated forecast errors as well as
forecast unbiasedness are indeed a minimal yet necessary condition for REH, but they
may not be sufficient to justify REH, as Muth’s REH proposition requires that the
forecasters efficiently use all available information when forming expectations. The
available information set in this context refers to the past actual values or past history of
the investigated variable. Similar to the test of lack of serial correlation, the results of
weak-form efficiency testing were drawn on the basis of an F-statistic up to four lagged
past actual values, and this is reported in Table 3 as well. Clearly, the results of weak-
form efficiency testing reinforced the findings on non-serial correlation testing. Therefore,
we can conclude that firms in the investigated sector tend to be inefficient in predicting
gross revenue and capital expenditure.
Conclusion
The widespread use of REH in economic contexts has provided a means for further
expansion in rationality testing, as the validity of REH in real-world settings is crucial in
16
that the implication of REH on economic analysis is substantial and reaches far beyond
academic interests. Hence, attempts to verify the consistency of REH via empirical
testing certainly become imperative, as policy designs that are sensitive to the hypothesis
of expectations formation or motivated by the assumptions of REH may not be
effectively established without sufficient understanding of the way in which expectations
are formed. In Malaysia, the availability of survey expectational data, as documented in
the BESLC published by the Malaysian Department of Statistics, enabled us to provide
empirical support for REH validity through direct tests based on survey data. Therefore,
following the limited literature contributed by Habibullah (1994a, 1994b, 1997, 2001,
2003, 2005), the present study adds to the empirical support for REH in Malaysia through
the rationality testing of operational variables forecasts performed by firms from the
distributive trade sector. In short, this study may serve to reinforce or supplement the
findings from previous studies and may provide additional insight into the understanding
of REH in Malaysia’s business forecasts.
In this study, two operational variables, gross revenue and capital expenditure, were
subjected to three prominent rationality tests: the unbiasedness, non-serial correlation,
and efficiency tests. The empirical evidence put forward in the present study firmly
suggests that business operational forecasts performed by firms in the distributive trade
sector in Malaysia are inconsistent with the framework of REH, as expectations regarding
both gross revenue and capital expenditure were found to be biased and inefficiently
constructed by those firms’ business decision makers. In this manner, the rejection of the
unbiased nature of survey forecasts may well imply that the investigated survey materials
are less likely to be accepted as unbiased predictors of actual values, signifying that the
observed survey materials are less responsive in reflecting the real business setting in the
Malaysian economy. Furthermore, past mistakes are serially correlated with the current
information set, leading to the emergence of inefficiency in the forecasting process.
Meanwhile, failure to incorporate past trends sufficiently into the information set when
forming future forecasts also contributes to the phenomenon of inefficiency in business
17
expectations formation. In a nutshell, the notion of forecast rationality in Muth’s (1961)
sense cannot be assumed to be compelling in the Malaysian distributive trade sector.
One justification for the existence of irrational behavior in gross revenue predictions is
that business revenue is intrinsically difficult to forecast as it is closely related to price
and market demand, which is subject to a high degree of uncertainty. Furthermore,
dynamic changes in consumers’ consumption patterns and structural changes in the
distributive trade sector over the investigated period partially contributed to the existence
of irrational forecasts as fluctuations in sales turnover may have interrupted the rational
forecasts of prices and market demand. In addition, being overly optimistic or pessimistic
toward future development in the economy may result in over- or under-predictions in
business forecasting. Thus, proper assimilation of information by business forecasters is
vital because information is a necessary ingredient for the generation of rational forecasts.
Also, it is less surprising to see irrational business expectations in value-related variables
because certain firms may be too optimistic in revealing information on value-related
variables to make the business outlook more attractive to potential investors and to boost
business confidence throughout their business unit. This is particularly true in the case of
capital expenditure expectations, which could serve as a reflection of the firm’s future
investment capacity, financial health, and liquidity.
In general, it would be advisable for the business firms in the distributive trade sector in
Malaysia to incorporate more relevant information into their business operational
forecasts so as to provide more accurate and realistic business forecasting. To contribute
more reliable and truthful future forecasts that can reflect the real business outlook in the
economy, it is essential for decision makers to survey institutions that offer survey
materials to public and private users. Regardless of whether they are associated with
households, business entities, or public policymaking, most decision makers rely either
heavily or occasionally on surveys of economic forecasts constructed by experts or
market participants when they confront future planning or policy establishment.
Therefore, publicly available survey materials should be of high quality and should hold

18
significant predictive power to aid decision makers in implementing effective and
responsive future planning and policy instruments. This is particularly important for the
Malaysian service sector, which is undergoing rapid liberalization and has been targeted
as a new engine of growth in the economy. Being among the dominant and fast-growing
service subsectors, wholesale and retail traders, which make up the distributive trade in
Malaysia, must become a significant force in solidifying the domestic service market and
in exploiting the international market for greater opportunity. Needless to say, well-
informed businesses are better at assessing risk and coming to sensible decisions. Hence,
having access to useful information on the future business outlook makes a great deal of
sense for all decision makers in this sector and those in closely related economic sectors,
provided the information rationally reflects realistic prospects for the near future.

19
References
Aggarwal, R., & Mohanty, S. (2000). Rationality of Japanese macroeconomic survey
forecasts: Empirical evidence and comparisons with the US. Japan and the World
Economy, 12(1), 21-31.
Baghestani, H., & Kainian, A.M. (1993). On the rationality of U.S. macroeconomics
forecasts: Evidence from a panel of professional forecasters. Applied Economics,
25(7), 869-878.
Beach, E.D., Fernandez-Cornejo, J., & Uri, N.D. (1995). Testing the rational expectations
hypothesis using survey data from vegetable growers in the USA. Journal of
Economic Studies, 22(6), 46-59.
Chong, L.L.Y, Puah, C.H., & Md Isa, A.H. (2012). Theory of rational expectations
hypothesis: Banks and other financial institutions in Malaysia. MPRA Paper No.
36657.
Department of Statistics Malaysia. Business Expectations Survey of Limited Company,
various issues. Putrajaya: Department of Statistics Malaysia.
Dias, F., Duarte, C., & Rua, A. (2008). Inflation expectations in the euro area: Are
consumer rational? Banco de Portugal, Working Paper 23-2008.
Dickey, D., & Fuller, W. (1979). Distribution of the estimators for autoregressive times
series with a unit root. Journal of the American Statistical Association, 74(366),
427-431.
Dickey, D., & Fuller, W. (1981). Likelihood ratio statistic for autoregressive times series
with a unit root. Econometrica, 49(4), 1057-1072.
20
Easley, D., & O′Hara, M. (1991). Order form and information in securities markets.
Journal of Finance, 46(4), 905-927.
Egginton, D.M. (1999). Testing the efficiency and reliability of city forecasts.
International Journal of Forecasting, 15(1), 57-66.
Engle, R.F., & Granger, C.W.J. (1987). Cointegration and error correction, estimation
and testing. Econometrica, 55(2), 251-276.
Evans, G., & Gulamani, R. (1984). Tests for rationality for the Carlson-Parkin inflation
expectation data. Oxford Bulletin of Economics and Statistics, 46(1), 1-19.
Fischer, A.M. (1989). Unit roots and survey data. Oxford Bulletin of Economics and
Statistics, 51(4), 451-463.
Forsells, M., & Kenny, G. (2002). The rationality of consumers’ inflation expectations:
Survey-based evidence for the euro area. European Central Bank, Working Paper,
No. 163.
Friedman, D. (1980). Survey evidence on the rationality of interest rate expectations.
Journal of Monetary Economics, 6(4), 453-465.
Gao, F., Song, F.M., & Wang, J. (2008). Rational or irrational expectations? Evidence
from China’s stock market. Journal of Risk Finance, 9(5), 432-448.
Gertchev, N. (2007). A critique of adaptive and rational expectations. Quarterly Journal
Austrian Economics, 10(4), 313-329.
21
Granger, C.W.J. (1986). Developments in the study of cointegrated economic variables.
Oxford Bulletin of Economics and Statistics, 48(3), 213-228.
Habibullah, M.S. (1994a). Do Business firm in developing economy make rational
economic forecast? The evidence from Malaysia business expectations survey of
limited companies. Asian Economies, 23(4), 73-92.
Habibullah, M.S. (1994b). Are rubber firm’s gross revenue, capital expenditure and
employment forecasts rational?-An empirical evidence. Journal of Natural
Rubber Research, 9(1), 56-64.
Habibullah, M.S. (1997). Forecasting economic variables in the agricultural sector:
Testing rational expectations hypothesis on survey data. Pakistan Journal of
Applied Economics, 12(2), 171-184.
Habibullah, M.S. (2001). Rationality of insurance firms’ forecasts: Results of
unbiasedness and efficiency tests. Malaysia Management Journal, 5(1&2), 107-
117.
Habibullah, M.S. (2003). The Rationality of Economic Forecasts: The cases of rubber oil
palm, forestry and mining sector. Agro Ekonomi, X(1), 67-79.
Habibullah, M.S. (2005). Do bankers make rational economic forecasts? The IUP
Journal of Bank Management, IV(4), 7-15.
Keane, M.P., & Runkle D.E. (1990). Are economic forecasts rational? Federal Reserve
Bank of Minneapolis Quarterly Review, 13(2), Spring, 26-33.
Keynes, J.M. (1936). The General Theory of Employment, Interest and Money. London:
Macmillan.
22
Kim, S.J. (1997). Testing the rationality of exchange rate and interest rate expectations:
An empirical study of Australian survey-based expectations. Applied Economics,
29(8), 1011-1022.
Kwiatkowski, D., Philips, P., Schmidt, P., & Shin, Y. (1992). Testing the null hypothesis
stationarity against the alternative of a unit root: How sure are we that economic
time series have a unit root? Journal of Econometrics, 54(1-3), 159-178.
Lovell, M. (1986). Tests of the rational expectations hypothesis. American Economic
Review, 76(1), 110-124.
Lui, S. Mitchell, J., & Weale, M. (2011). The utility of expectational data: Firm-level
evidence using matched qualitative-quantitative UK surveys. International
Journal of Forecasting, 27(4), 1128-1146.
Mackinnon, J. G. (1996). Numerical distribution functions for unit root and cointegration
tests. Journal of Applied Econometrics, 11(6), 601-618.
Madsen, J.B. (1993). The formation of production expectations in manufacturing industry
for nine industrialized countries. Empirical Economic, 18(3), 501-521.
Marais, D.J., Smit, E.V.D.M., & Conradie, W.J. (1997). Micro-level tests for rationale
expectations in South Africa. South Africa Journal of Business Management, 8(1),
15-27.
Mitchell, K., & Pearce, D.K. (2005). Professional forecasts of interest rates and
exchange rates: Evidence from the Wall Street Journal’s panel of economists.
Department of Economics, North Carolina State University, Working Paper, No.
004.

23
Mullineaux, D.J. (1978). On testing for rationality: Another look at the Livingston price
expectations data. The Journal of Political Economy, 86(2), 329-336.
Muth, J.F. (1961). Rational expectations and the theory of price movements.
Econometrica, 29(3), 315-335.
Nielsen, H. (2003). Inflation expectations in the EU-rational? Paper presented at the
Eighth Spring Meeting of Young Economists, Catholic University of Leuven,
Belgium.
Osterberg, W.P. (2000). New results on the rationality of survey measures of exchange-
rate expectations. Federal Reserve Bank of Cleveland Economic Review, 36(1),
14-21.
Philips, P.C.B., & Perron, P. (1988). Testing for a unit root in time series regression.
Biometrika, 75(2), 335-346.
Puah, C.H., Chong, L.L.Y., and Jais, M. (2011). Testing the rational expectation
hypothesis on the retail trade sector using survey data from Malaysia. Journal of
International Business and Economics, 11(4), 214-218.
Puah, C.H, Wong, S.S.L., & Liew, V.K.S. (2012). Testing rational expectations
hypothesis in the manufacturing sector in Malaysia. Journal of Business
Economics and Management (forthcoming).
Richardson, M., & Smith, T. (1991). Tests of models in the presence of overlapping
observations. Review of Financial Studies, 4(2), 227-254.
Sheffrin, S.M. (1983). Rational Expectations. Cambridge: Cambridge University Press.

24
Takagi, S. (1991). Exchange rate expectations: A survey of survey studies. International
Monetary Fund Staff Papers, 38(1), 156-183.
Theil, H. (1966). Applied Economic Forecasting. North-Holland: Amsterdam.
Wong, S.S.L., Puah, C.H., and Abu Mansor, S. (2011). Survey Evidence on the
rationality of business expectations: Implication from the Malaysian agricultural
sector. Journal of Economic Computation and Economic Cybernetics Studies and
Research, 45(4), 169-180.

25
Table 1: Results of ADF and KPSS Unit Root Tests
Variables ADF KPSS Constant Constant & Trend Constant Constant & Trend
Level LAGR -0.258 -3.140 0.959*** 0.119* LEGR -0.573 -2.728 0.953*** 0.120* LACE -1.691 -2.732 0.890*** 0.165** LECE -1.781 -3.011 0.843*** 0.213** First Difference ∆LAGR -9.983*** -9.894*** 0.108 0.105 ∆LEGR -8.727*** -8.649*** 0.067 0.066 ∆LACE -6.247*** -6.268*** 0.171 0.119 ∆LECE -10.418*** -10.410*** 0.123 0.078 Notes: Asterisks (***), (**) and (*) indicate the rejection of the null hypothesis at 1%, 5%, and 10% levels. Lag length for ADF and bandwidth for KPSS tests have been chosen on the basis of Schwarz’s information criteria (SIC) and Newey-West using Bartlett kernel, respectively. LAGR and LACE denote natural logarithms of actual gross revenue and capital expenditure, while LEGR and LECE represent natural logarithms of expected gross revenue and capital expenditure, respectively.
Table 2: Results of Engle-Granger Cointegration and Unbiasedness Tests
Gross Revenue Capital Expenditure Constant (α) -0.090 0.009 Slope of Coefficient (β) 1.025*** 0.952*** R-squared 0.985 0.868
Cointegration Test ADF(1) -5.393*** -3.383*** PP(1) -9.847*** -5.734***
Hypothesis Testing F-statistic(α=0, β=1) 3.062 (0.055)* 9.629 (0.000)*** LM χ2 (1) 1.659 (0.203) 0.172 (0.680) LM χ2 (2) 1.819 (0.172) 0.920 (0.404) Notes: Figures in square brackets are t-statistics and figures in parentheses are p-values. Asterisks (***) and (*) denote statistically significance at 1% and 10% levels, respectively.
Table 3: Results of Non-Serial Correlation and Weak-Form Efficiency Tests
Lag Length Non-Serial Correlation Test Weak-Form Efficiency Test Gross Revenue Capital Expenditure Gross Revenue Capital Expenditure
F-statistic with respect to lag length:
1 8.125*** 8.420*** 8.581*** 8.864*** 2 6.642*** 5.833*** 6.579*** 9.869*** 3 5.250*** 5.276*** 5.684*** 7.878*** 4 4.815*** 4.368*** 4.590*** 6.152***
Notes: Figures in square brackets are t-statistics and figures in parentheses are p-values. Asterisks (***)denote statistically significance at the 1% level. h