pembrokeshire business survey
DESCRIPTION
The Pembrokeshire Business Survey was commissioned by Pembrokeshire County Council to measure the attitudes and opinions of small and medium sized businesses in the county to current economic and business conditions.TRANSCRIPT
Pembrokeshire Business Survey 2012
A report by Wavehill
May 2012
©Copyright Wavehill Ltd 2012 Page | 1
Contents 1. Introduction ................................................................................................................... 2
2. Method .......................................................................................................................... 6
3. About your Business ...................................................................................................... 9
4. Business Confidence .................................................................................................... 15
5. Business Support .......................................................................................................... 22
6. Business Premises ........................................................................................................ 26
7. Information Technology ............................................................................................... 27
8. Marketing and Advertising ........................................................................................... 29
9. Business Values ............................................................................................................ 33
10. Workforce .................................................................................................................... 35
11. Local Supply Chain ....................................................................................................... 40
12. Cost Management ........................................................................................................ 43
13. Infrastructure ............................................................................................................... 45
14. Innovation.................................................................................................................... 47
15. Business Legislation ..................................................................................................... 48
Annex 1 – Post Survey Weighting ........................................................................................ 52
Pembrokeshire Business Survey 2012
©Copyright Wavehill Ltd 2012 Page | 2
1. Executive Summary The Pembrokeshire Business Survey was commissioned by Pembrokeshire County Council to measure
the attitudes and opinions of small and medium sized businesses in the county to current economic and
business conditions.
The survey was undertaken using telephone interviews during March – May 2012. In total 731
businesses responded. Eighty-five per cent of survey respondents were either business directors,
partners or owners meaning the views and opinions are from business leaders.
In terms of the wider economy the survey was undertaken as the UK economy dipped into recession,
recording negative growth or contraction of -0.2% of Gross Domestic Product (Office of National
Statistics (ONS); Q1; 2012), this has continued with -0.3 recorded in Q2; 2012 and -0.5 in Q3; 2012.
There are some relatively weak indicators and findings within the survey and newer or younger
businesses with fewer revenues appear to be affected more by the recession than larger and longer
established businesses.
The following bullet points are summaries of notable elements and findings from the survey report;
• De-registered businesses have exceeded newly registered businesses since 2009 in Pembrokeshire.
The business attrition rate was -230 across the county.
• There has been a decline in new or young businesses. In 2012 businesses less than 3 years old were
proportionally 5% of the survey, in 2006 and 2003 the proportion was 10% and 13%. There has
been a significant reduction in new younger businesses.
• Longer established businesses and businesses with greater revenues were more optimistic or
confident about the future than smaller businesses that had been trading for less time.
• According to ONS data the Retail Price Index (RPI) has risen 30% from 2003 to today in 2012. The
RPI consists of many elements however a major factor or cost driver is the price of oil as a
commodity for energy and transport. The price of Brent Crude has risen from around $20 (2003) a
barrel to around $115 today.
• Whilst 30% of businesses in the Pembrokeshire survey thought their turnover would increase over
the next 12 months, 39% of businesses in the South Wales Chamber Quarterly Economic Survey
believed this would be the case. The proportions who believed their turnover would decrease over
the next 12 months was consistent across both surveys (26%).
• Fewer Pembrokeshire businesses aim to grow their business over the next two to three years, 58%
compared to 74% from the BIS Small Business Survey 2010.1 Businesses in the Pembrokeshire survey
were also less optimistic about planning for growth than those in the South West Wales survey.
1 http://www.bis.gov.uk/assets/biscore/enterprise/docs/b/11-p74-bis-small-business-survey-2010
Pembrokeshire Business Survey 2012
©Copyright Wavehill Ltd 2012 Page | 3
• Businesses scored Business Support services with a 6/10, however there was a wide range of
opinion. This may be explained because businesses that make successful applications for grant
support or business funding support are often satisfied with business support and those that have
applications rejected are dissatisfied.
• When asked to think about using mobile technology and IT in general, 30% of businesses stated
they did not think anything needed to be improved in their business in the next 12 months
(217/713), 20% said they would like better mobile phone coverage and signal (144/713) and 20%
said they would prefer faster broadband (19%; 133/713).
• Forty-six per cent of businesses spent between £1,000 and £5,000, 28% of businesses spent under
£999, and 5% spent more than £23,001 with the largest budgets from hotels and restaurants and
construction. Fifty-nine per cent spent between 81% and 100% of their budget within
Pembrokeshire and only 6% of respondents did not spend any of their budgets within the county.
• Businesses rated quality of service then price as their two most important business values.
• Most businesses (81%) do not have a formal training or development plan, 17% have both a formal
training and a development plan and 3% plan to introduce one in the next 12 months (17/520).
Those businesses that have both a formal training plan and a development plan are mainly from
businesses with a larger average annual turnover; for example 26% of businesses with a turnover of
more than £1 million and 18% of businesses with a turnover of between £501,000 and £1,000,000
had both a formal training and a development plan.
• Businesses said that 60% of revenues or turnover come from Pembrokeshire, 19% come from Wales
(not including Pembrokeshire) 18% come from the UK (not including Wales) and 3% worldwide.
• Businesses said that fuel and energy costs (28%), staff costs (28%) and rent and rates (22%) are the
most significant costs affecting their businesses.
• Twenty-three per cent of businesses said that the transport infrastructure in Pembrokeshire does
affect the competitiveness of their business.
• Thirty-two per cent of businesses said that they had introduced new or significantly improved
products or services in the last 12 months.
• Businesses felt that health and safety (68%), environmental (54%) and employment (50%) legislation
was a challenge or restriction to their business.
We would like to thank all of the businesses in Pembrokeshire who gave their time freely to help make
this survey so detailed and interesting.
Pembrokeshire Business Survey 2012
©Copyright Wavehill Ltd 2012 Page | 4
2. Introduction The Pembrokeshire Business Survey was first commissioned in 2003 by Pembrokeshire County Council
to measure the attitudes and opinions of small and medium sized businesses in the county to current
economic and business conditions. It was undertaken again by Wavehill in 2006 and now repeated in
2012. The findings are used to inform policy decisions within the council and to better understand the
requirements of businesses across the county.
2.1. Background
The exact content of the survey has changed from year to year, but the overarching aim has remained
the same: to collect the views of SMEs on various business factors. The current survey (2012) covers the
following key themes:
• About your business
• Business Confidence
• Business Support
• Business Premises
• Information Technology
• Marketing & Advertising
• Workforce
• Local Supply Chain
• Cost Management
• Infrastructure
• Innovation
The views of businesses will often be a reflection of the economic climate in which they are operating.
The economy has changed significantly since 2008 and there are still significant downward pressures on
business and business growth.
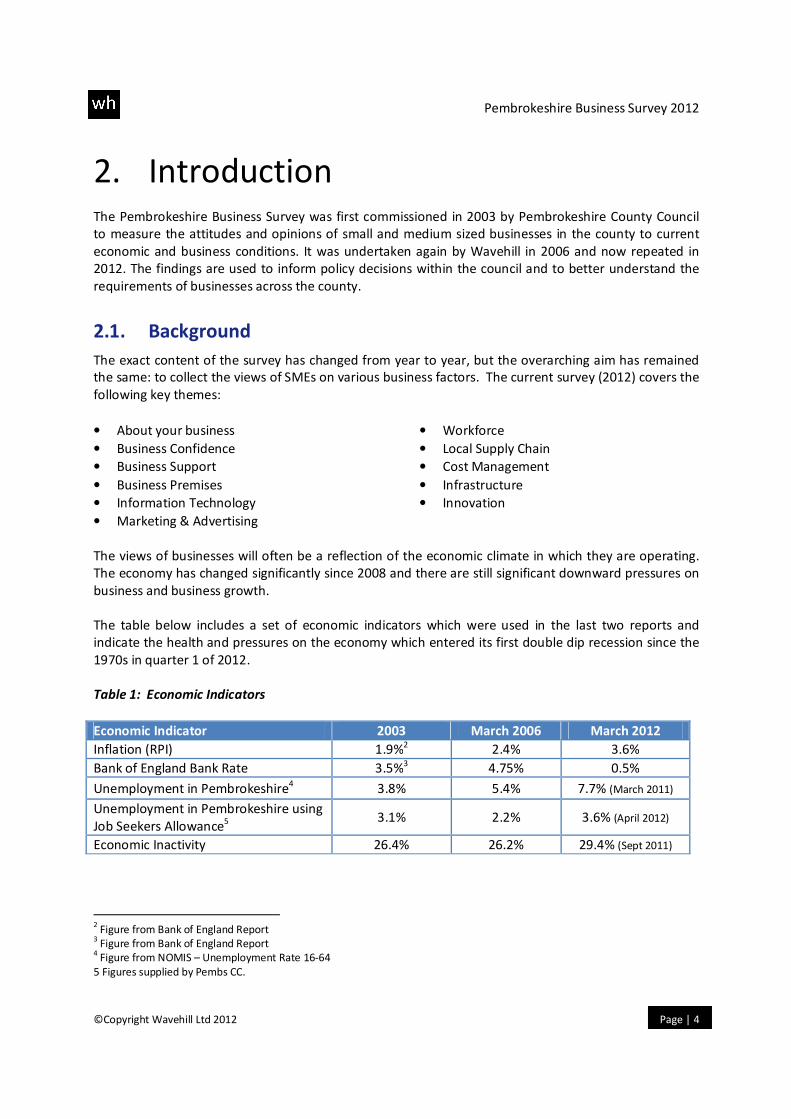
The table below includes a set of economic indicators which were used in the last two reports and
indicate the health and pressures on the economy which entered its first double dip recession since the
1970s in quarter 1 of 2012.
Table 1: Economic Indicators
Economic Indicator 2003 March 2006 March 2012
Inflation (RPI) 1.9%2 2.4% 3.6%
Bank of England Bank Rate 3.5%3 4.75% 0.5%
Unemployment in Pembrokeshire4 3.8% 5.4% 7.7% (March 2011)
Unemployment in Pembrokeshire using
Job Seekers Allowance5
3.1% 2.2% 3.6% (April 2012)
Economic Inactivity 26.4% 26.2% 29.4% (Sept 2011)
2 Figure from Bank of England Report
3 Figure from Bank of England Report
4 Figure from NOMIS – Unemployment Rate 16-64
5 Figures supplied by Pembs CC.
Pembrokeshire Business Survey 2012
©Copyright Wavehill Ltd 2012 Page | 5
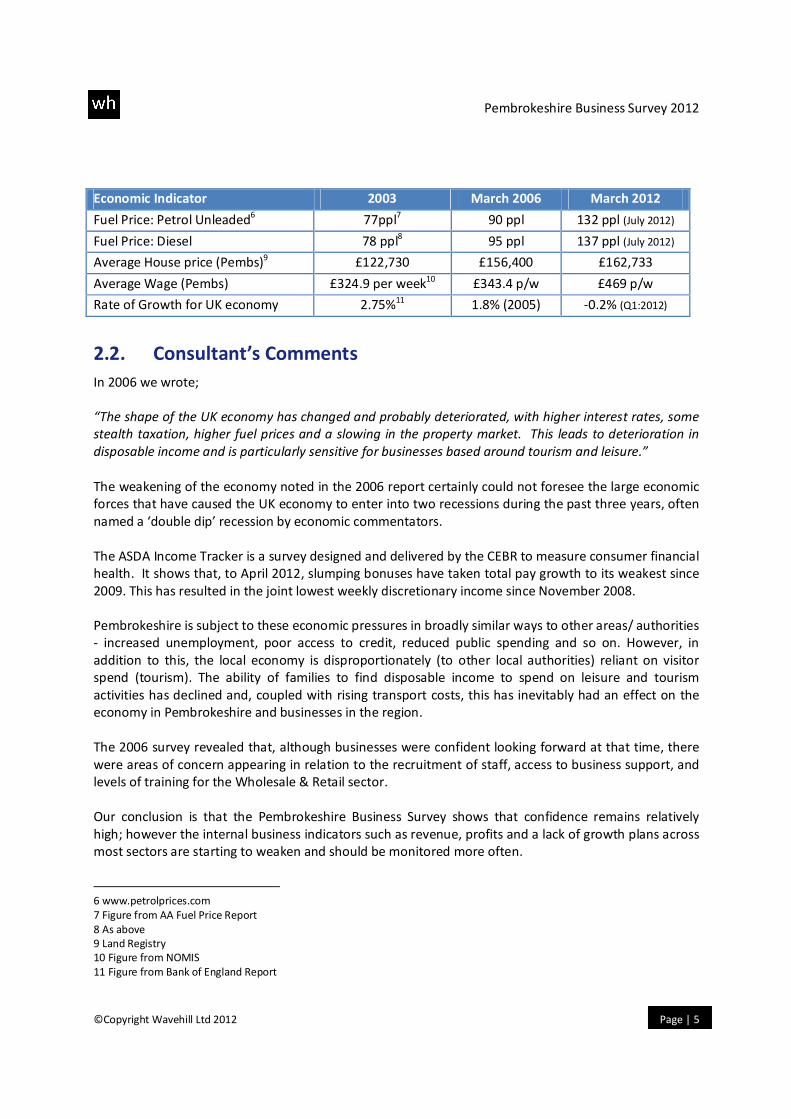
Economic Indicator 2003 March 2006 March 2012
Fuel Price: Petrol Unleaded6 77ppl
7 90 ppl 132 ppl (July 2012)
Fuel Price: Diesel 78 ppl8 95 ppl 137 ppl (July 2012)
Average House price (Pembs)9 £122,730 £156,400 £162,733
Average Wage (Pembs) £324.9 per week10 £343.4 p/w £469 p/w
Rate of Growth for UK economy 2.75%11 1.8% (2005) -0.2% (Q1:2012)
2.2. Consultant’s Comments
In 2006 we wrote;
“The shape of the UK economy has changed and probably deteriorated, with higher interest rates, some
stealth taxation, higher fuel prices and a slowing in the property market. This leads to deterioration in
disposable income and is particularly sensitive for businesses based around tourism and leisure.”
The weakening of the economy noted in the 2006 report certainly could not foresee the large economic
forces that have caused the UK economy to enter into two recessions during the past three years, often
named a ‘double dip’ recession by economic commentators.
The ASDA Income Tracker is a survey designed and delivered by the CEBR to measure consumer financial
health. It shows that, to April 2012, slumping bonuses have taken total pay growth to its weakest since
2009. This has resulted in the joint lowest weekly discretionary income since November 2008.
Pembrokeshire is subject to these economic pressures in broadly similar ways to other areas/ authorities
- increased unemployment, poor access to credit, reduced public spending and so on. However, in
addition to this, the local economy is disproportionately (to other local authorities) reliant on visitor
spend (tourism). The ability of families to find disposable income to spend on leisure and tourism
activities has declined and, coupled with rising transport costs, this has inevitably had an effect on the
economy in Pembrokeshire and businesses in the region.
The 2006 survey revealed that, although businesses were confident looking forward at that time, there
were areas of concern appearing in relation to the recruitment of staff, access to business support, and
levels of training for the Wholesale & Retail sector.
Our conclusion is that the Pembrokeshire Business Survey shows that confidence remains relatively
high; however the internal business indicators such as revenue, profits and a lack of growth plans across
most sectors are starting to weaken and should be monitored more often.
6 www.petrolprices.com
7 Figure from AA Fuel Price Report
8 As above
9 Land Registry
10 Figure from NOMIS
11 Figure from Bank of England Report
Pembrokeshire Business Survey 2012
©Copyright Wavehill Ltd 2012 Page | 6
3. Methodology The 2012 Pembrokeshire Business Survey is based somewhat on the previous surveys (2003, 2006),
although elements have changed meaning the 2012 survey it is not directly comparable with previous
years.
The survey itself was designed over several versions or iterations and the survey design team discussed
the inclusion of certain questions and themes carefully. One new aspect to the 2012 survey was the
inclusion of validation questions. These are questions that are found in other surveys, and allow us to
‘test’ whether the Pembrokeshire survey respondents differ from the views of other businesses in other
surveys. This is known as ‘survey validation’ within the technical and academic literature.
In our survey we have used the same wording and response categories to enable a direct comparison to
be made. The surveys that we extracted questions to harmonise from were:
• Pembrokeshire Business Survey (2006) Wavehill
• South Wales Chamber Survey (2011)
• CBI Economic Challenges Facing UK Businesses Survey (2011)
• Small Business Survey (2010)
• The Welsh Rural Observatory Business Survey (2008)
We then tested the questionnaire amongst staff and measured the timings on the survey. The survey
was reduced in length as it was thought to be too long for many businesses, the target time to
completion being 20 minutes.
The sample for the survey was taken from the Dunn & Bradstreet Business Database for Pembrokeshire.
This provides business data classified using the Standard Industry Classification (SIC 2003). Some
classifications for public services such as employment and social care were excluded from the list. We
then subdivided the list of 1,855 businesses into their business classes and selected a proportional
sample randomly. Selecting a sample randomly allows our statistical analysis to infer from the results of
our sample what the whole business population may think. The accuracy within our estimate is referred
to as the statistical confidence level.
The confidence level varies from question to question depending on the responses, but as an overall
indication of the accuracy of our survey we completed 811 interviews from a population of 1,855
businesses to give a margin of error of +/- 2.6% with a confidence level of 95%. This means that for any
question we can calculate that 95% of business respondents will fall within the answer margins, and one
in twenty (5%) will be outside. This error of margin is generally accepted by social and economic
researchers.
Pembrokeshire Business Survey 2012
©Copyright Wavehill Ltd 2012 Page | 7
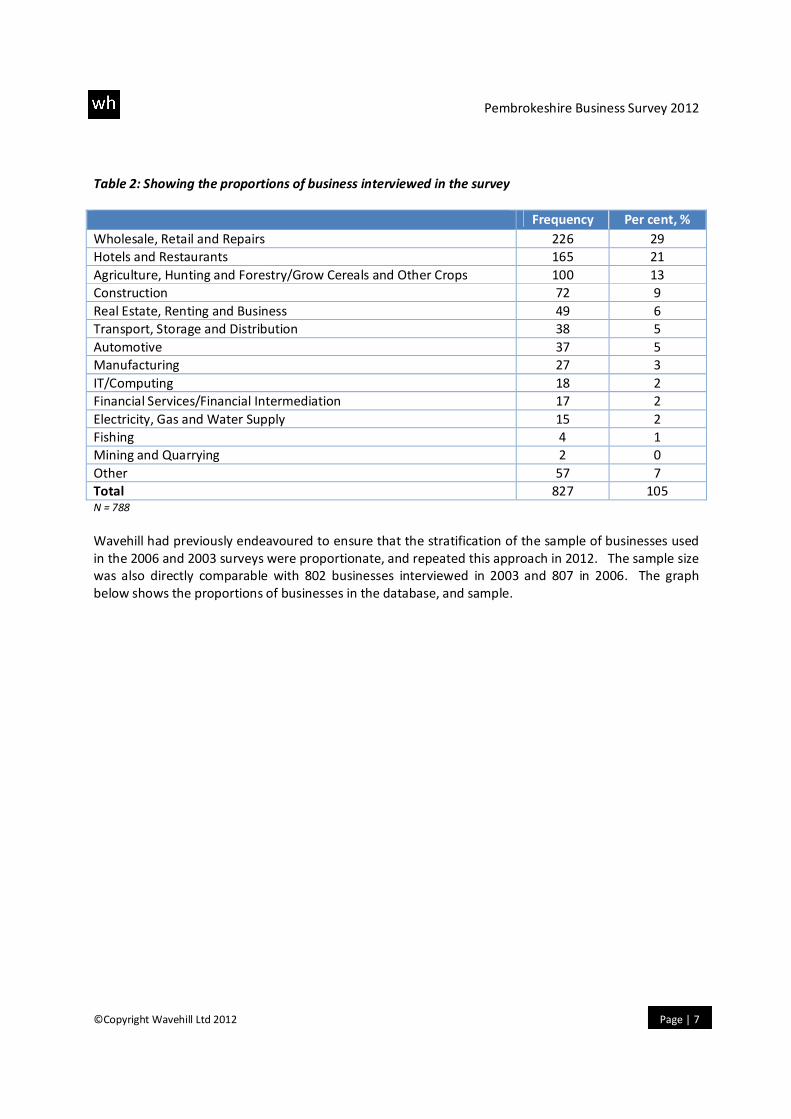
Table 2: Showing the proportions of business interviewed in the survey
Frequency Per cent, %
Wholesale, Retail and Repairs 226 29
Hotels and Restaurants 165 21
Agriculture, Hunting and Forestry/Grow Cereals and Other Crops 100 13
Construction 72 9
Real Estate, Renting and Business 49 6
Transport, Storage and Distribution 38 5
Automotive 37 5
Manufacturing 27 3
IT/Computing 18 2
Financial Services/Financial Intermediation 17 2
Electricity, Gas and Water Supply 15 2
Fishing 4 1
Mining and Quarrying 2 0
Other 57 7
Total 827 105 N = 788
Wavehill had previously endeavoured to ensure that the stratification of the sample of businesses used
in the 2006 and 2003 surveys were proportionate, and repeated this approach in 2012. The sample size
was also directly comparable with 802 businesses interviewed in 2003 and 807 in 2006. The graph
below shows the proportions of businesses in the database, and sample.
Pembrokeshire Business Survey 2012
©Copyright Wavehill Ltd 2012 Page | 8
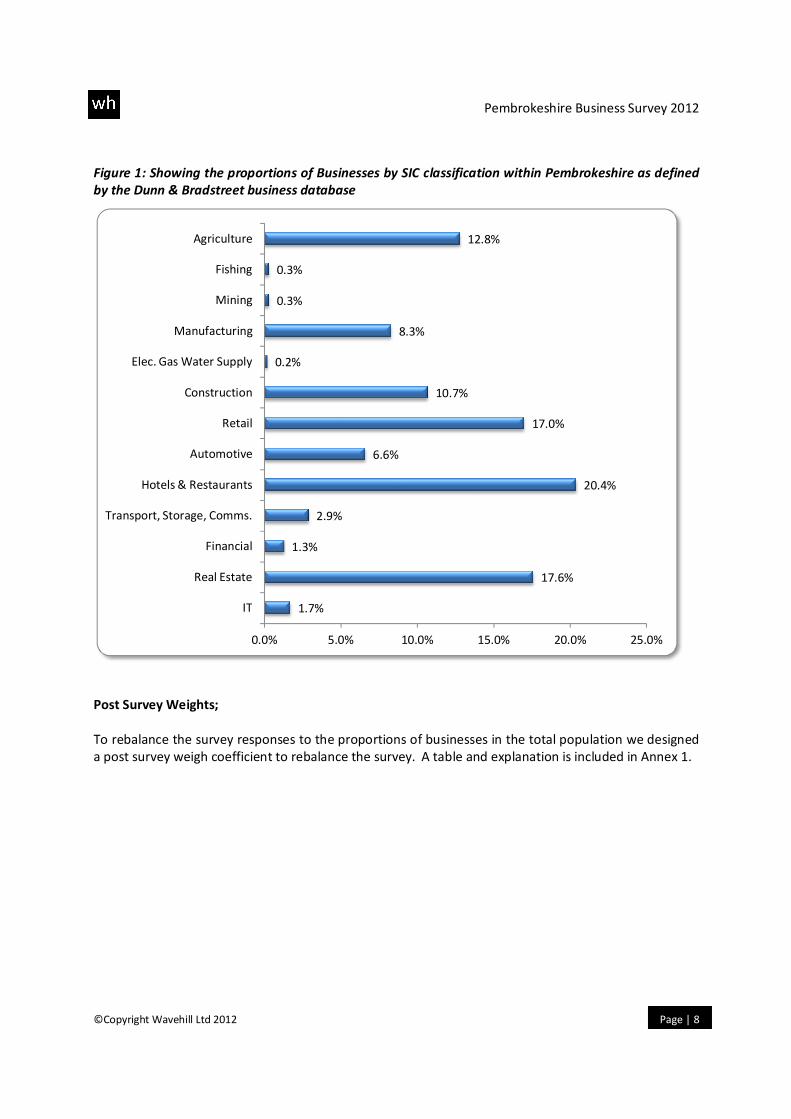
Figure 1: Showing the proportions of Businesses by SIC classification within Pembrokeshire as defined
by the Dunn & Bradstreet business database
Post Survey Weights;
To rebalance the survey responses to the proportions of businesses in the total population we designed
a post survey weigh coefficient to rebalance the survey. A table and explanation is included in Annex 1.
1.7%
17.6%
1.3%
2.9%
20.4%
6.6%
17.0%
10.7%
0.2%
8.3%
0.3%
0.3%
12.8%
0.0% 5.0% 10.0% 15.0% 20.0% 25.0%
IT
Real Estate
Financial
Transport, Storage, Comms.
Hotels & Restaurants
Automotive
Retail
Construction
Elec. Gas Water Supply
Manufacturing
Mining
Fishing
Agriculture
Pembrokeshire Business Survey 2012
©Copyright Wavehill Ltd 2012 Page | 9
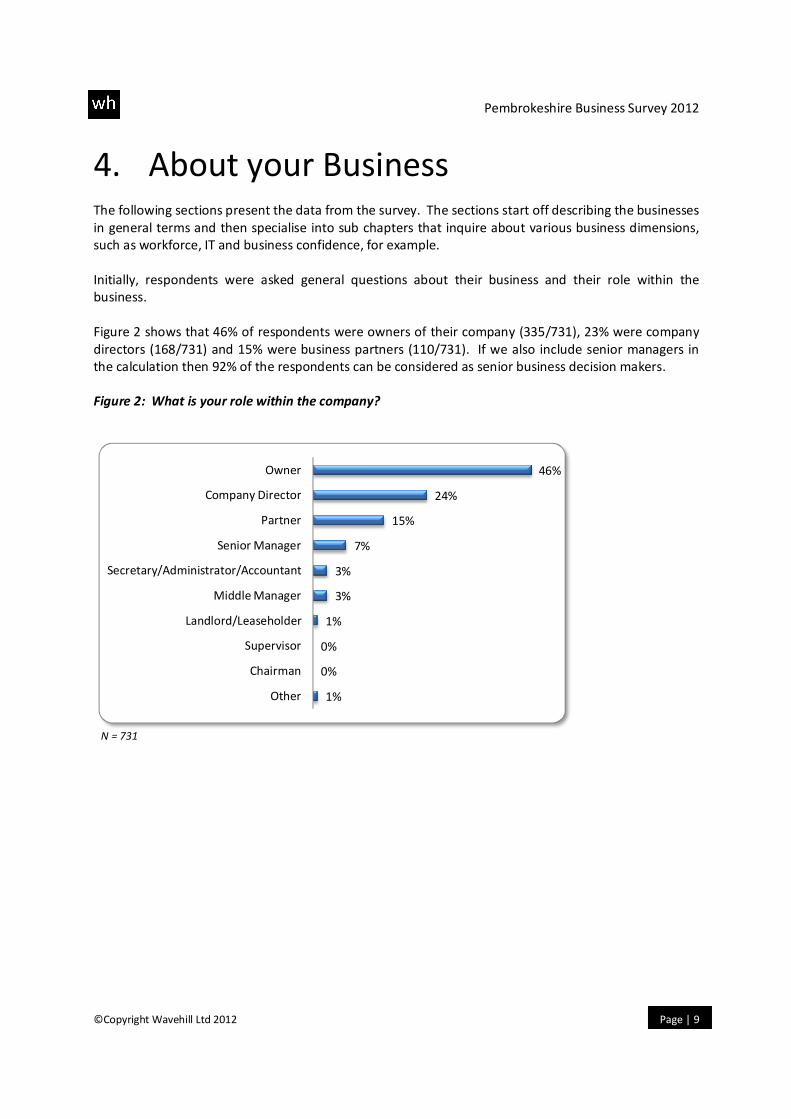
4. About your Business The following sections present the data from the survey. The sections start off describing the businesses
in general terms and then specialise into sub chapters that inquire about various business dimensions,
such as workforce, IT and business confidence, for example.
Initially, respondents were asked general questions about their business and their role within the
business.
Figure 2 shows that 46% of respondents were owners of their company (335/731), 23% were company
directors (168/731) and 15% were business partners (110/731). If we also include senior managers in
the calculation then 92% of the respondents can be considered as senior business decision makers.
Figure 2: What is your role within the company?
N = 731
1%
0%
0%
1%
3%
3%
7%
15%
24%
46%
Other
Chairman
Supervisor
Landlord/Leaseholder
Middle Manager
Secretary/Administrator/Accountant
Senior Manager
Partner
Company Director
Owner
Pembrokeshire Business Survey 2012
©Copyright Wavehill Ltd 2012 Page | 10
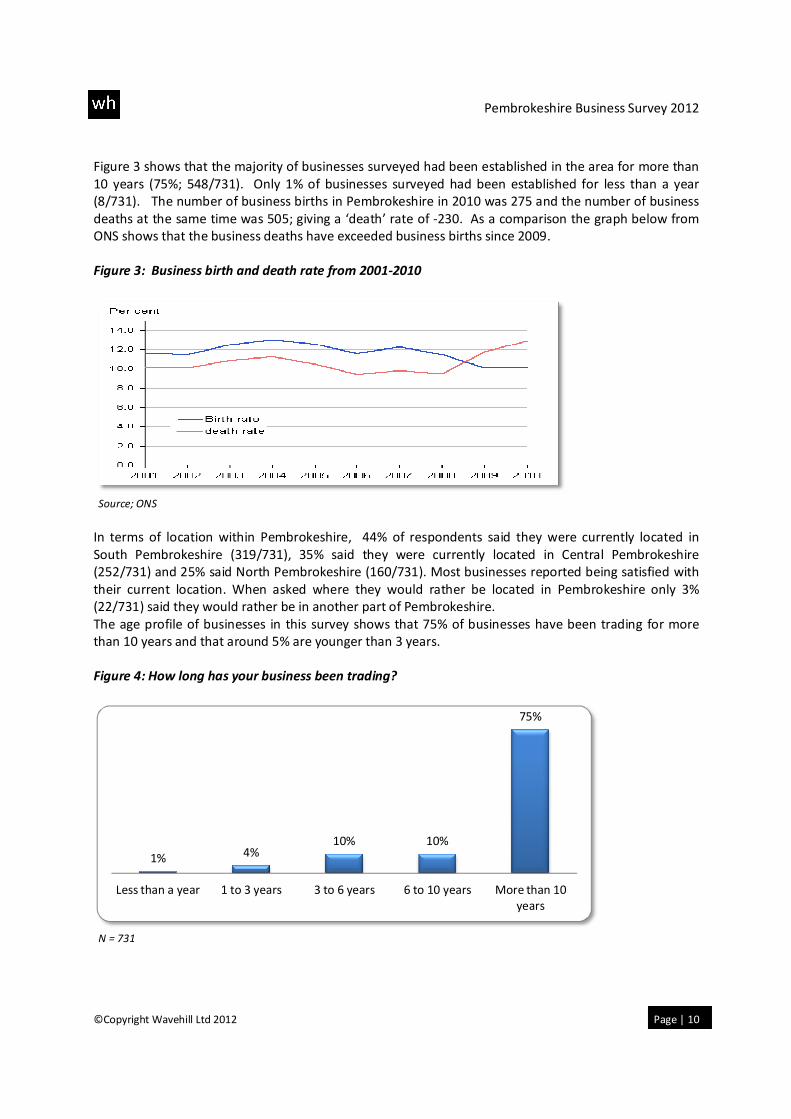
Figure 3 shows that the majority of businesses surveyed had been established in the area for more than
10 years (75%; 548/731). Only 1% of businesses surveyed had been established for less than a year
(8/731). The number of business births in Pembrokeshire in 2010 was 275 and the number of business
deaths at the same time was 505; giving a ‘death’ rate of -230. As a comparison the graph below from
ONS shows that the business deaths have exceeded business births since 2009.
Figure 3: Business birth and death rate from 2001-2010
Source; ONS
In terms of location within Pembrokeshire, 44% of respondents said they were currently located in
South Pembrokeshire (319/731), 35% said they were currently located in Central Pembrokeshire
(252/731) and 25% said North Pembrokeshire (160/731). Most businesses reported being satisfied with
their current location. When asked where they would rather be located in Pembrokeshire only 3%
(22/731) said they would rather be in another part of Pembrokeshire.
The age profile of businesses in this survey shows that 75% of businesses have been trading for more
than 10 years and that around 5% are younger than 3 years.
Figure 4: How long has your business been trading?
N = 731
1% 4%10% 10%
75%
Less than a year 1 to 3 years 3 to 6 years 6 to 10 years More than 10
years
Pembrokeshire Business Survey 2012
©Copyright Wavehill Ltd 2012 Page | 11
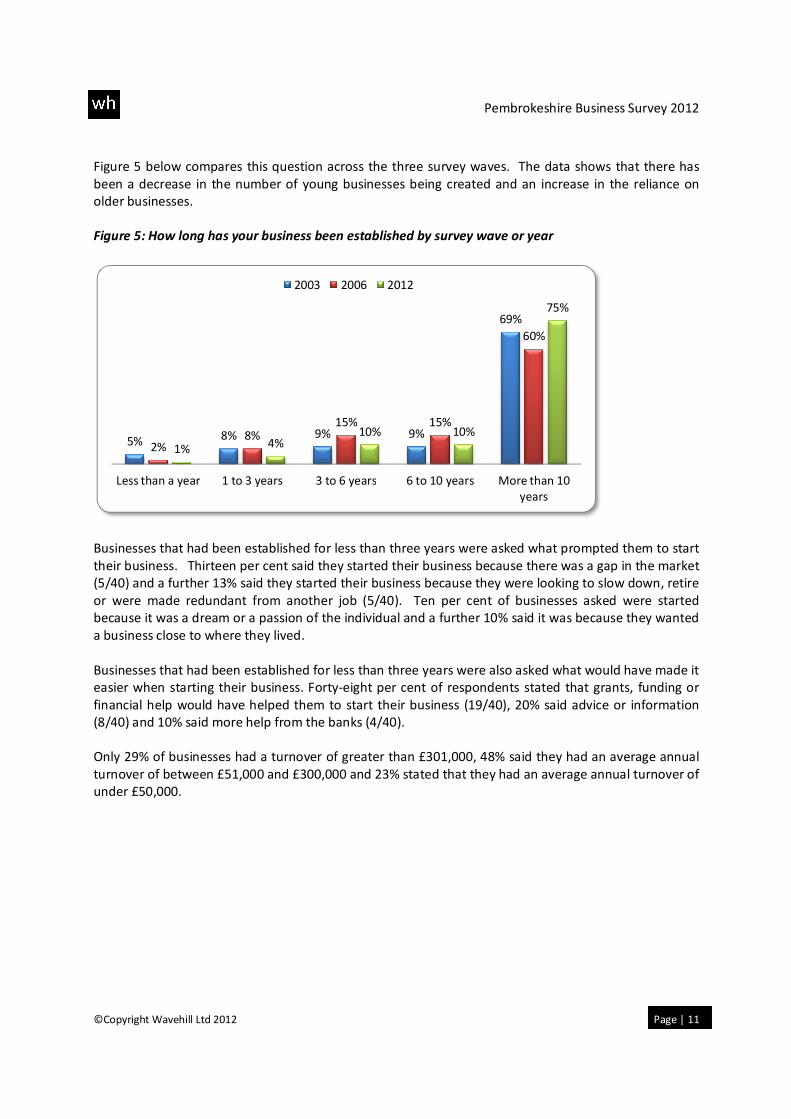
Figure 5 below compares this question across the three survey waves. The data shows that there has
been a decrease in the number of young businesses being created and an increase in the reliance on
older businesses.
Figure 5: How long has your business been established by survey wave or year
Businesses that had been established for less than three years were asked what prompted them to start
their business. Thirteen per cent said they started their business because there was a gap in the market
(5/40) and a further 13% said they started their business because they were looking to slow down, retire
or were made redundant from another job (5/40). Ten per cent of businesses asked were started
because it was a dream or a passion of the individual and a further 10% said it was because they wanted
a business close to where they lived.
Businesses that had been established for less than three years were also asked what would have made it
easier when starting their business. Forty-eight per cent of respondents stated that grants, funding or
financial help would have helped them to start their business (19/40), 20% said advice or information
(8/40) and 10% said more help from the banks (4/40).
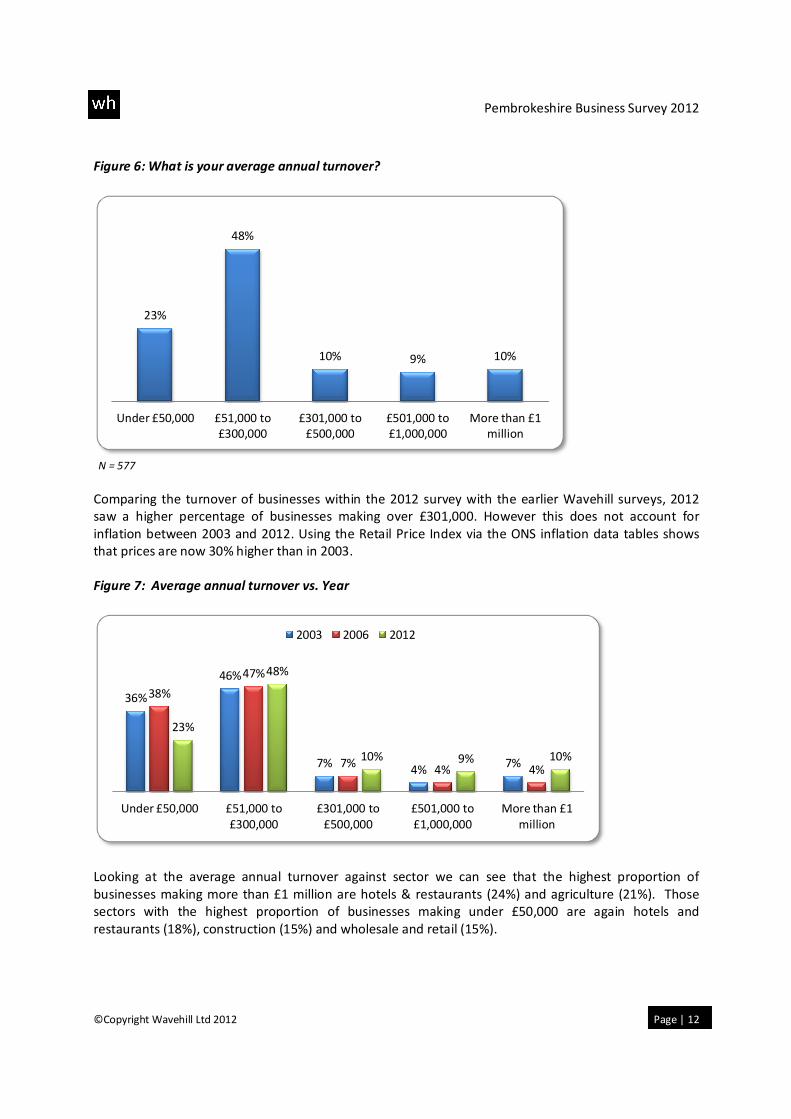
Only 29% of businesses had a turnover of greater than £301,000, 48% said they had an average annual
turnover of between £51,000 and £300,000 and 23% stated that they had an average annual turnover of
under £50,000.
5% 8% 9% 9%
69%
2%8%
15% 15%
60%
1% 4%10% 10%
75%
Less than a year 1 to 3 years 3 to 6 years 6 to 10 years More than 10
years
2003 2006 2012
Pembrokeshire Business Survey 2012
©Copyright Wavehill Ltd 2012 Page | 12
Figure 6: What is your average annual turnover?
N = 577
Comparing the turnover of businesses within the 2012 survey with the earlier Wavehill surveys, 2012
saw a higher percentage of businesses making over £301,000. However this does not account for
inflation between 2003 and 2012. Using the Retail Price Index via the ONS inflation data tables shows
that prices are now 30% higher than in 2003.
Figure 7: Average annual turnover vs. Year
Looking at the average annual turnover against sector we can see that the highest proportion of
businesses making more than £1 million are hotels & restaurants (24%) and agriculture (21%). Those
sectors with the highest proportion of businesses making under £50,000 are again hotels and
restaurants (18%), construction (15%) and wholesale and retail (15%).
23%
48%
10% 9% 10%
Under £50,000 £51,000 to
£300,000
£301,000 to
£500,000
£501,000 to
£1,000,000
More than £1
million
36%
46%
7%4%
7%
38%
47%
7%4% 4%
23%
48%
10% 9% 10%
Under £50,000 £51,000 to
£300,000
£301,000 to
£500,000
£501,000 to
£1,000,000
More than £1
million
2003 2006 2012
Pembrokeshire Business Survey 2012
©Copyright Wavehill Ltd 2012 Page | 13
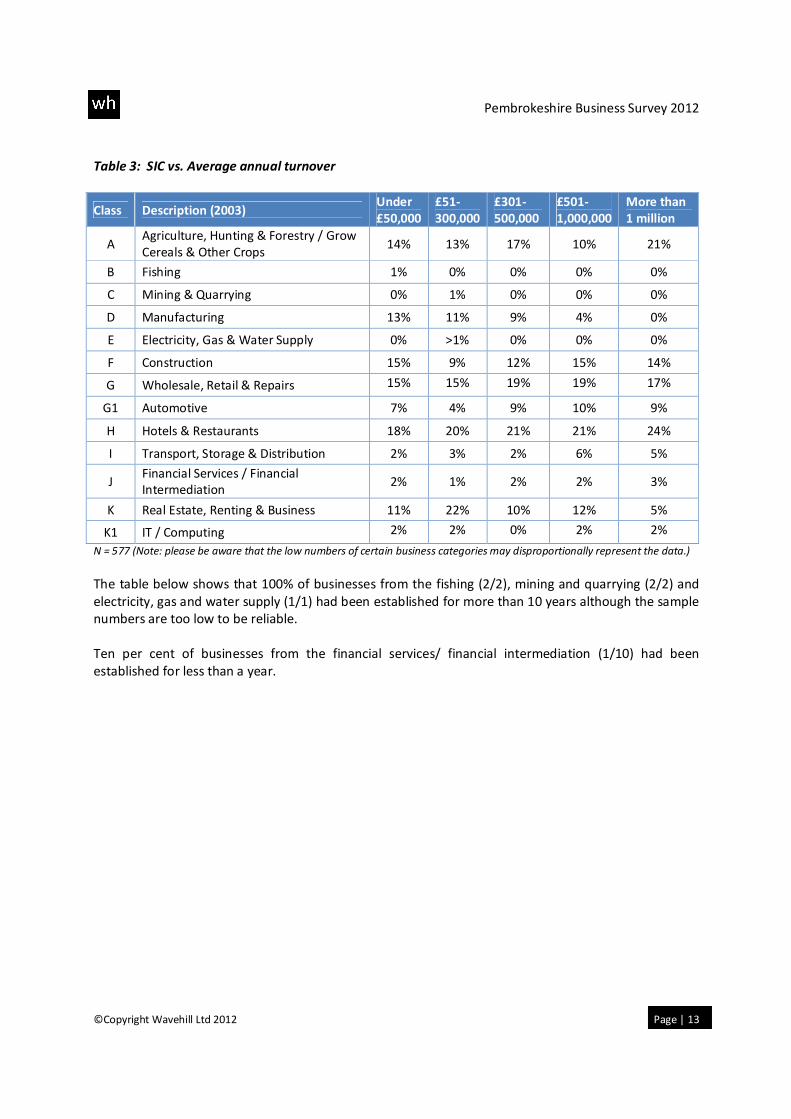
Table 3: SIC vs. Average annual turnover
Class Description (2003) Under
£50,000
£51-
300,000
£301-
500,000
£501-
1,000,000
More than
1 million
A Agriculture, Hunting & Forestry / Grow
Cereals & Other Crops 14% 13% 17% 10% 21%
B Fishing 1% 0% 0% 0% 0%
C Mining & Quarrying 0% 1% 0% 0% 0%
D Manufacturing 13% 11% 9% 4% 0%
E Electricity, Gas & Water Supply 0% >1% 0% 0% 0%
F Construction 15% 9% 12% 15% 14%
G Wholesale, Retail & Repairs 15% 15% 19% 19% 17%
G1 Automotive 7% 4% 9% 10% 9%
H Hotels & Restaurants 18% 20% 21% 21% 24%
I Transport, Storage & Distribution 2% 3% 2% 6% 5%
J Financial Services / Financial
Intermediation 2% 1% 2% 2% 3%
K Real Estate, Renting & Business 11% 22% 10% 12% 5%
K1 IT / Computing 2% 2% 0% 2% 2%
N = 577 (Note: please be aware that the low numbers of certain business categories may disproportionally represent the data.)
The table below shows that 100% of businesses from the fishing (2/2), mining and quarrying (2/2) and
electricity, gas and water supply (1/1) had been established for more than 10 years although the sample
numbers are too low to be reliable.
Ten per cent of businesses from the financial services/ financial intermediation (1/10) had been
established for less than a year.
Pembrokeshire Business Survey 2012
©Copyright Wavehill Ltd 2012 Page | 14
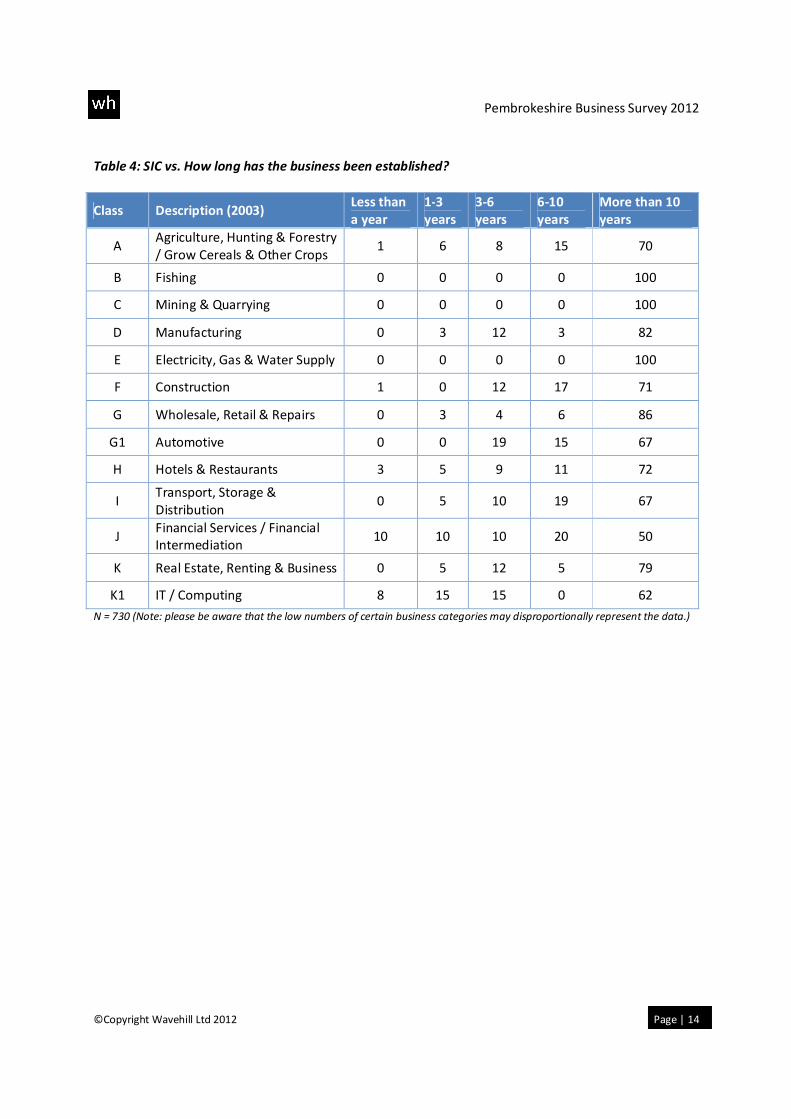
Table 4: SIC vs. How long has the business been established?
Class Description (2003) Less than
a year
1-3
years
3-6
years
6-10
years
More than 10
years
A Agriculture, Hunting & Forestry
/ Grow Cereals & Other Crops 1 6 8 15 70
B Fishing 0 0 0 0 100
C Mining & Quarrying 0 0 0 0 100
D Manufacturing 0 3 12 3 82
E Electricity, Gas & Water Supply 0 0 0 0 100
F Construction 1 0 12 17 71
G Wholesale, Retail & Repairs 0 3 4 6 86
G1 Automotive 0 0 19 15 67
H Hotels & Restaurants 3 5 9 11 72
I Transport, Storage &
Distribution 0 5 10 19 67
J Financial Services / Financial
Intermediation 10 10 10 20 50
K Real Estate, Renting & Business 0 5 12 5 79
K1 IT / Computing 8 15 15 0 62
N = 730 (Note: please be aware that the low numbers of certain business categories may disproportionally represent the data.)
Pembrokeshire Business Survey 2012
©Copyright Wavehill Ltd 2012 Page | 15
5. Business Confidence Business confidence is a widely used concept in measuring potential future economic performance, for
this reason it is referred to as a ‘leading indicator’ or a ‘coincident indicator’ (one which leads or is
concurrent with economic conditions). Confident businesses may invest capital, employ more staff or
expand their range of goods, services or geographic market.
When asked to rate Pembrokeshire on a scale of 1 to 10 (1 poor and 10 excellent) as a place to run their
business, the mean score given was 6.6 and the standard deviation of the mean was 2.4. The mode or
most frequently cited score was 8.
There were 34 respondents who rated Pembrokeshire with the lowest score of 1; of these, 35% were
from the real estate, renting and business sector (12/34) and 18% were from hotels and restaurants
(6/34). Explanations for the low score concentrated on business rates and the seasonality of trade:
• “Diabolical, what should happen in seaside resorts is that we should pay rates for 6 months. We are in
the National Park on the development side of the business and we're suffering there too as they are
putting 60% on low cost housing.”
• “It’s just there are fewer businesses here so at the moment it is stagnant.”
• “It is very bad, business rates are too high, the council think we make a lot of money in the summer
but actually we don't as there is only 6 weeks when we're busy the other 9 months we are struggling.”
Eighty-four respondents rated Pembrokeshire with the highest score of 10; of these 84, 24% were from
the hotels and restaurants sector (20/84) and 18% were from real estate, renting and business (15/84).
When asked to explain their answer, example responses were:
• “I find that it seems more or less recession proof here, there are a lot of retirees here who are quite
comfortably off.”
• “The business is tourist driven and Pembrokeshire is a jewel in the choice of British destinations
especially the coast line.”
• “Love it here, everyone is helpful and there are a lot of markets for selling my poultry.”
The mean score for ‘a place to run a business’ was divided by how long business had been established in
the area. Figure 7 shows that the longer the business has been established in the area, the higher the
score for Pembrokeshire as a place to run a business is recorded. With the exception of 6-10 years
group where the mean drops to 6.
Pembrokeshire Business Survey 2012
©Copyright Wavehill Ltd 2012 Page | 16
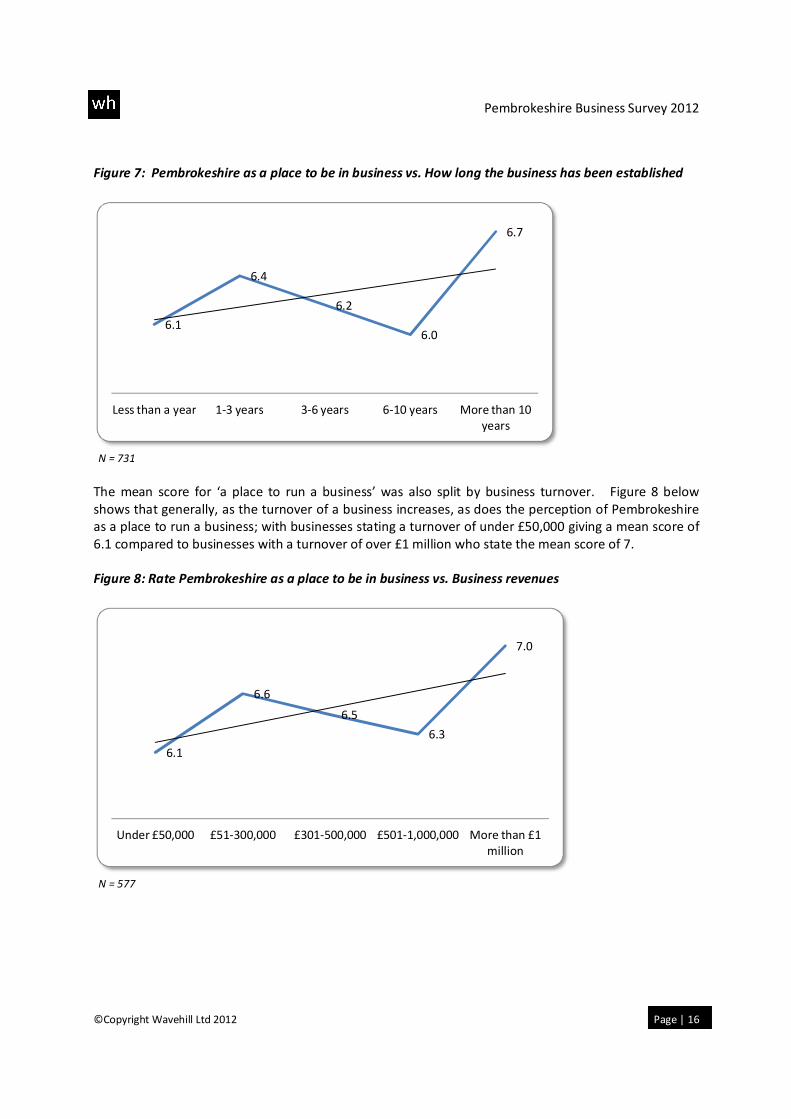
Figure 7: Pembrokeshire as a place to be in business vs. How long the business has been established
N = 731
The mean score for ‘a place to run a business’ was also split by business turnover. Figure 8 below
shows that generally, as the turnover of a business increases, as does the perception of Pembrokeshire
as a place to run a business; with businesses stating a turnover of under £50,000 giving a mean score of
6.1 compared to businesses with a turnover of over £1 million who state the mean score of 7.
Figure 8: Rate Pembrokeshire as a place to be in business vs. Business revenues
N = 577
6.1
6.4
6.2
6.0
6.7
Less than a year 1-3 years 3-6 years 6-10 years More than 10
years
6.1
6.6
6.5
6.3
7.0
Under £50,000 £51-300,000 £301-500,000 £501-1,000,000 More than £1
million
Pembrokeshire Business Survey 2012
©Copyright Wavehill Ltd 2012 Page | 17
Businesses predictions about how turnover will change over the next year can be compared between
this survey and the South Wales Chamber of Commerce Quarterly Economic Survey, published in
January 201212
. Whilst 30% of businesses in the Pembrokeshire survey thought their turnover would
increase over the next 12 months, 39% of businesses in the Quarterly Economic Survey believed this
would be the case. The proportions who believed their turnover would decrease over the next 12
months was consistent across both surveys (26%).
Businesses in the Pembrokeshire 2012 survey were less optimistic than those in the chamber’s survey.
However our business confidence had a standard deviation ‘range’ of 2.4 so confidence was between
4.2 and 9.0 for 68% of our survey. The range is wide so there is probably little statistical difference
between the two surveys’ findings and the reader should not over emphasise the difference between
the two surveys.
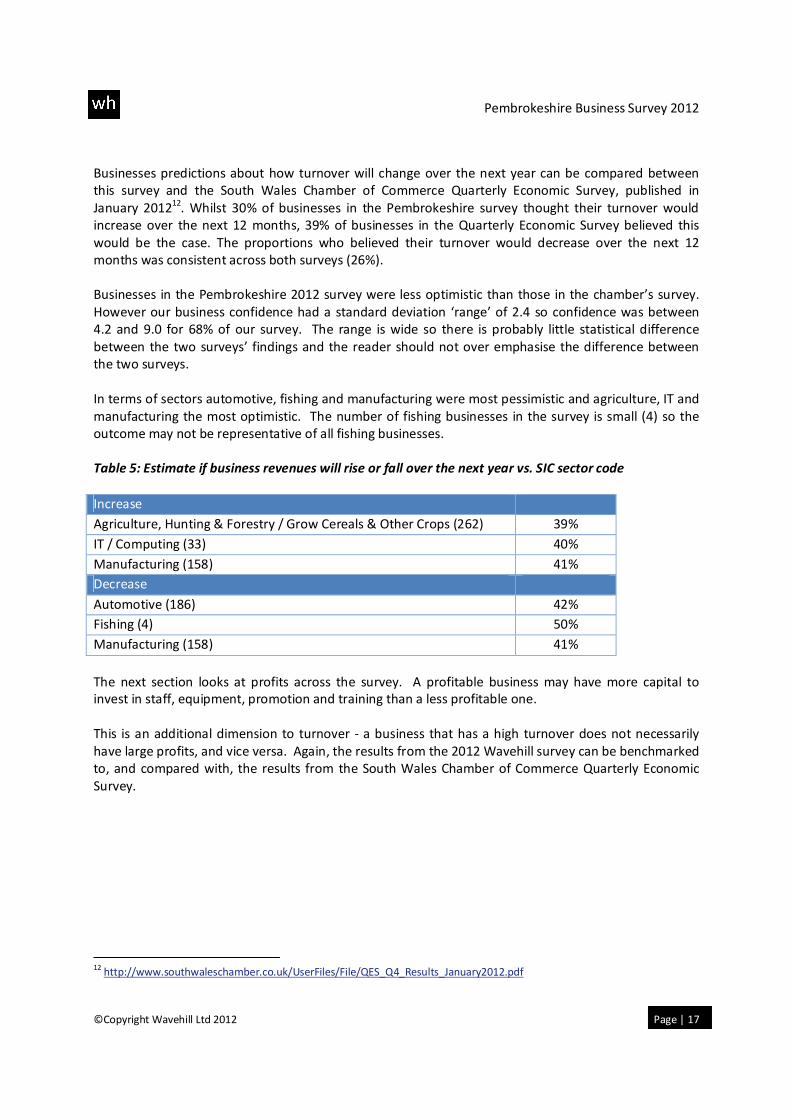
In terms of sectors automotive, fishing and manufacturing were most pessimistic and agriculture, IT and
manufacturing the most optimistic. The number of fishing businesses in the survey is small (4) so the
outcome may not be representative of all fishing businesses.
Table 5: Estimate if business revenues will rise or fall over the next year vs. SIC sector code
Increase
Agriculture, Hunting & Forestry / Grow Cereals & Other Crops (262) 39%
IT / Computing (33) 40%
Manufacturing (158) 41%
Decrease
Automotive (186) 42%
Fishing (4) 50%
Manufacturing (158) 41%
The next section looks at profits across the survey. A profitable business may have more capital to
invest in staff, equipment, promotion and training than a less profitable one.
This is an additional dimension to turnover - a business that has a high turnover does not necessarily
have large profits, and vice versa. Again, the results from the 2012 Wavehill survey can be benchmarked
to, and compared with, the results from the South Wales Chamber of Commerce Quarterly Economic
Survey.
12
http://www.southwaleschamber.co.uk/UserFiles/File/QES_Q4_Results_January2012.pdf
Pembrokeshire Business Survey 2012
©Copyright Wavehill Ltd 2012 Page | 18
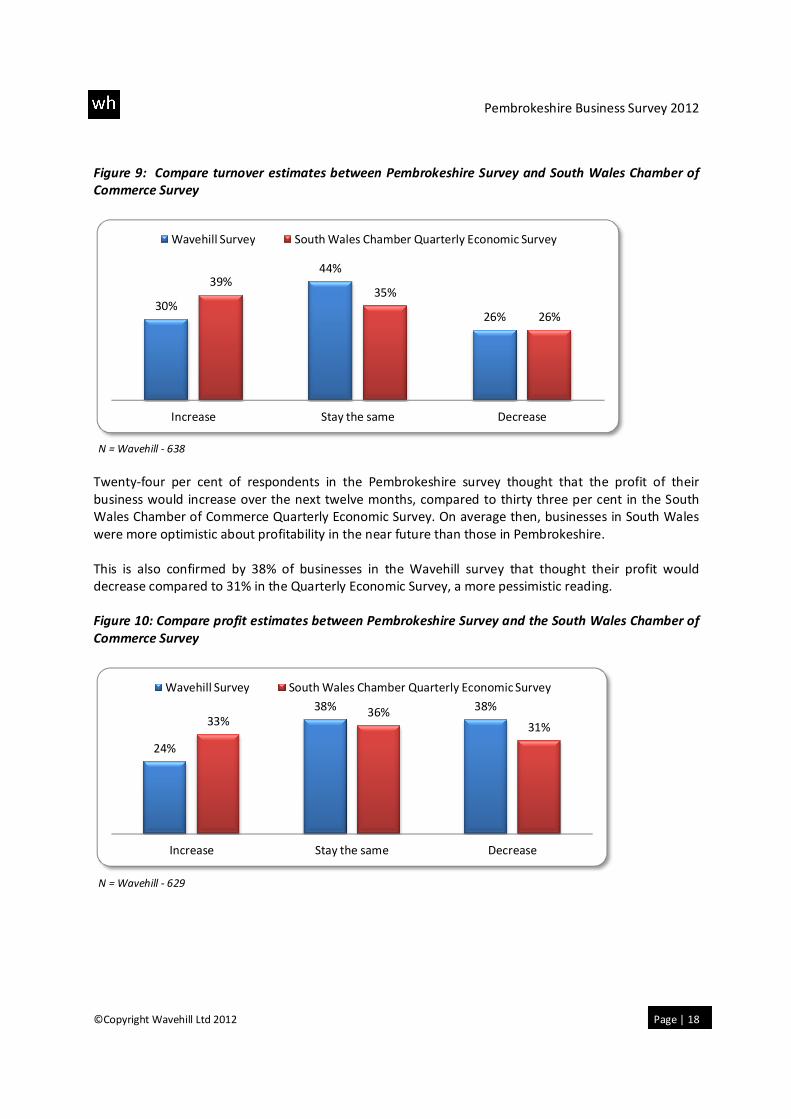
Figure 9: Compare turnover estimates between Pembrokeshire Survey and South Wales Chamber of
Commerce Survey
N = Wavehill - 638
Twenty-four per cent of respondents in the Pembrokeshire survey thought that the profit of their
business would increase over the next twelve months, compared to thirty three per cent in the South
Wales Chamber of Commerce Quarterly Economic Survey. On average then, businesses in South Wales
were more optimistic about profitability in the near future than those in Pembrokeshire.
This is also confirmed by 38% of businesses in the Wavehill survey that thought their profit would
decrease compared to 31% in the Quarterly Economic Survey, a more pessimistic reading.
Figure 10: Compare profit estimates between Pembrokeshire Survey and the South Wales Chamber of
Commerce Survey
N = Wavehill - 629
30%
44%
26%
39%35%
26%
Increase Stay the same Decrease
Wavehill Survey South Wales Chamber Quarterly Economic Survey
24%
38% 38%33%
36%31%
Increase Stay the same Decrease
Wavehill Survey South Wales Chamber Quarterly Economic Survey
Pembrokeshire Business Survey 2012
©Copyright Wavehill Ltd 2012 Page | 19
The table below shows that when considered by sector, the IT sector, financial services and agriculture
are the most optimistic about profits. The automotive sector is relatively pessimistic, with 75% of
respondents predicting falling profits.
Table 6: The three most optimistic and pessimistic SIC sectors regarding profit
Increase
IT / Computing (33) 40%
Financial Services / Financial Intermediation (22) 33%
Agriculture, Hunting & Forestry / Grow Cereals & Other Crops (262) 32%
Decrease
Automotive (186) 61%
Fishing (4) 75%
Manufacturing (158) 55%
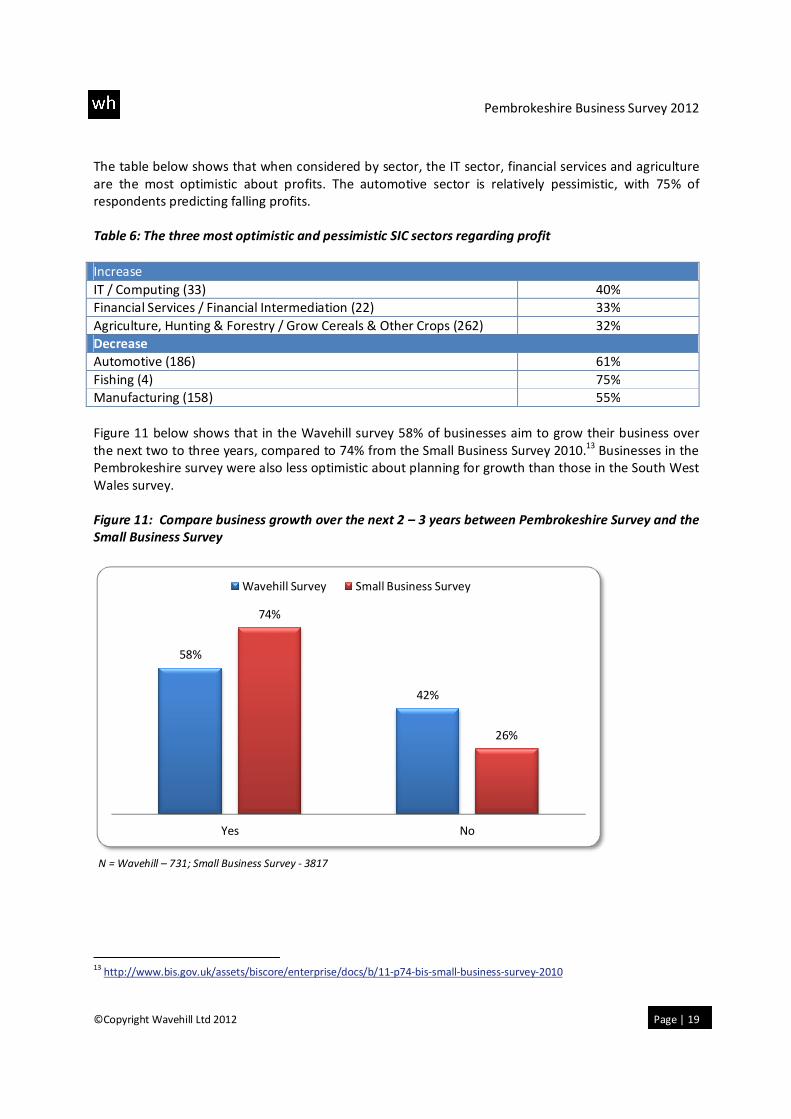
Figure 11 below shows that in the Wavehill survey 58% of businesses aim to grow their business over
the next two to three years, compared to 74% from the Small Business Survey 2010.13
Businesses in the
Pembrokeshire survey were also less optimistic about planning for growth than those in the South West
Wales survey.
Figure 11: Compare business growth over the next 2 – 3 years between Pembrokeshire Survey and the
Small Business Survey
N = Wavehill – 731; Small Business Survey - 3817
13
http://www.bis.gov.uk/assets/biscore/enterprise/docs/b/11-p74-bis-small-business-survey-2010
58%
42%
74%
26%
Yes No
Wavehill Survey Small Business Survey
Pembrokeshire Business Survey 2012
©Copyright Wavehill Ltd 2012 Page | 20
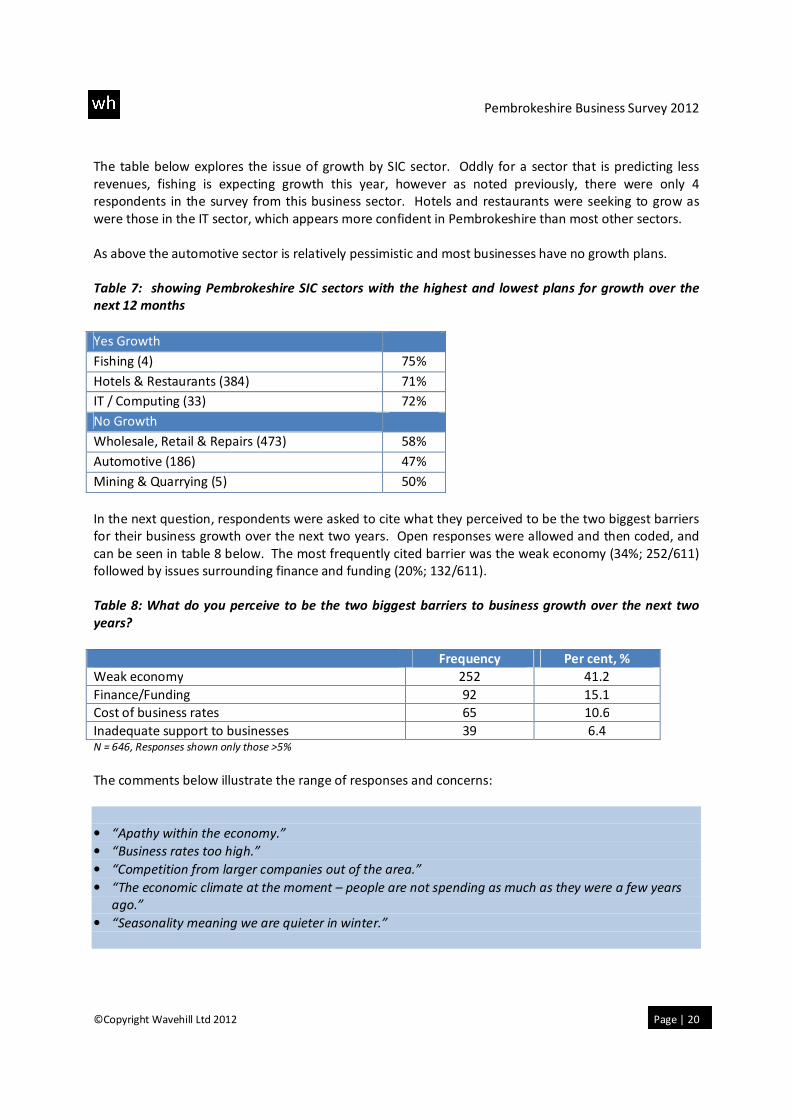
The table below explores the issue of growth by SIC sector. Oddly for a sector that is predicting less
revenues, fishing is expecting growth this year, however as noted previously, there were only 4
respondents in the survey from this business sector. Hotels and restaurants were seeking to grow as
were those in the IT sector, which appears more confident in Pembrokeshire than most other sectors.
As above the automotive sector is relatively pessimistic and most businesses have no growth plans.
Table 7: showing Pembrokeshire SIC sectors with the highest and lowest plans for growth over the
next 12 months
Yes Growth
Fishing (4) 75%
Hotels & Restaurants (384) 71%
IT / Computing (33) 72%
No Growth
Wholesale, Retail & Repairs (473) 58%
Automotive (186) 47%
Mining & Quarrying (5) 50%
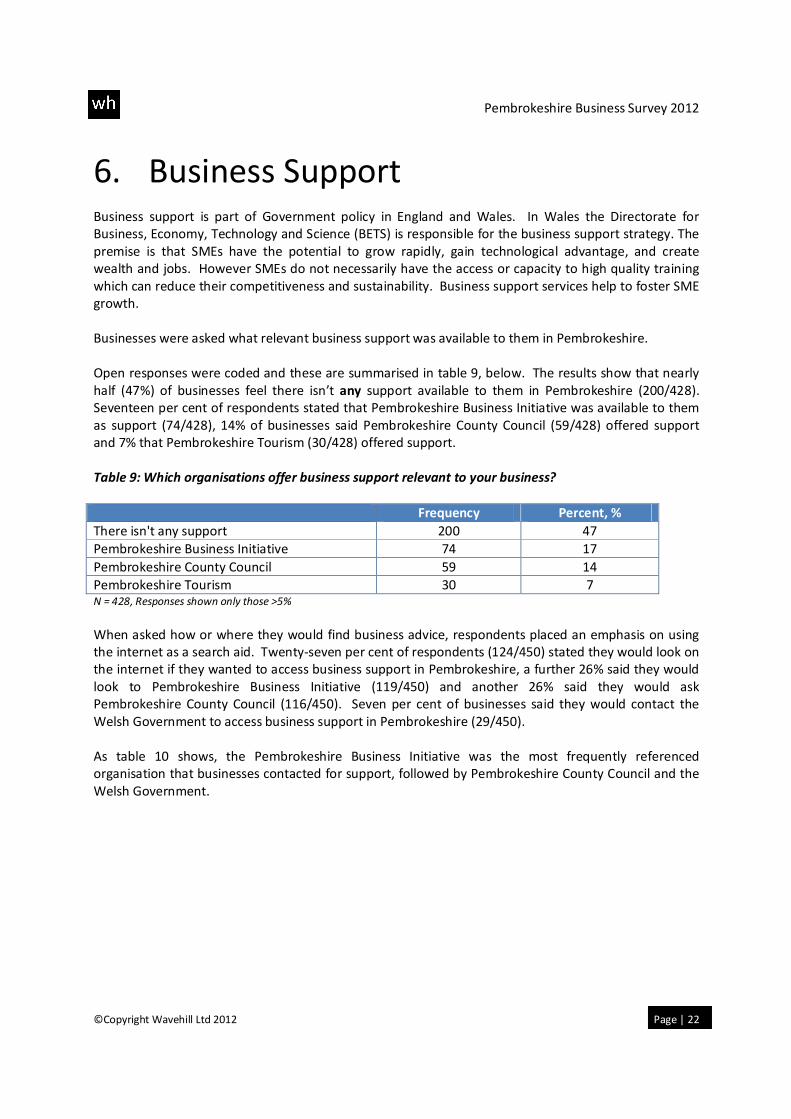
In the next question, respondents were asked to cite what they perceived to be the two biggest barriers
for their business growth over the next two years. Open responses were allowed and then coded, and
can be seen in table 8 below. The most frequently cited barrier was the weak economy (34%; 252/611)
followed by issues surrounding finance and funding (20%; 132/611).
Table 8: What do you perceive to be the two biggest barriers to business growth over the next two
years?
Frequency Per cent, %
Weak economy 252 41.2
Finance/Funding 92 15.1
Cost of business rates 65 10.6
Inadequate support to businesses 39 6.4 N = 646, Responses shown only those >5%
The comments below illustrate the range of responses and concerns:
• “Apathy within the economy.”
• “Business rates too high.”
• “Competition from larger companies out of the area.”
• “The economic climate at the moment – people are not spending as much as they were a few years
ago.”
• “Seasonality meaning we are quieter in winter.”

Pembrokeshire Business Survey 2012
©Copyright Wavehill Ltd 2012 Page | 21
There were 605 respondents who gave a valid answer when asked whether they thought general
economic conditions in Pembrokeshire would improve, stay the same or get worse over the next 12
months. In the Pembrokeshire 2012 survey, 15% thought the general economic condition would
improve (92/605), 43% thought it would stay the same (258/605) and 42% thought it would get worse
(255/605).
When we validate this with the CBI Economic Challenges Facing UK Businesses Survey 2011 we can see
that 16% of businesses thought the general economic condition of the country would increase
(160/1002), 25% thought that conditions would stay the same (251/1002) and 57% thought the general
economic conditions would get worse (571/1002).
The Pembrokeshire survey appears more optimistic than the CBI UK Business survey.
Pembrokeshire Business Survey 2012
©Copyright Wavehill Ltd 2012 Page | 22
6. Business Support Business support is part of Government policy in England and Wales. In Wales the Directorate for
Business, Economy, Technology and Science (BETS) is responsible for the business support strategy. The
premise is that SMEs have the potential to grow rapidly, gain technological advantage, and create
wealth and jobs. However SMEs do not necessarily have the access or capacity to high quality training
which can reduce their competitiveness and sustainability. Business support services help to foster SME
growth.
Businesses were asked what relevant business support was available to them in Pembrokeshire.
Open responses were coded and these are summarised in table 9, below. The results show that nearly
half (47%) of businesses feel there isn’t any support available to them in Pembrokeshire (200/428).
Seventeen per cent of respondents stated that Pembrokeshire Business Initiative was available to them
as support (74/428), 14% of businesses said Pembrokeshire County Council (59/428) offered support
and 7% that Pembrokeshire Tourism (30/428) offered support.
Table 9: Which organisations offer business support relevant to your business?
Frequency Percent, %
There isn't any support 200 47
Pembrokeshire Business Initiative 74 17
Pembrokeshire County Council 59 14
Pembrokeshire Tourism 30 7 N = 428, Responses shown only those >5%
When asked how or where they would find business advice, respondents placed an emphasis on using
the internet as a search aid. Twenty-seven per cent of respondents (124/450) stated they would look on
the internet if they wanted to access business support in Pembrokeshire, a further 26% said they would
look to Pembrokeshire Business Initiative (119/450) and another 26% said they would ask
Pembrokeshire County Council (116/450). Seven per cent of businesses said they would contact the
Welsh Government to access business support in Pembrokeshire (29/450).
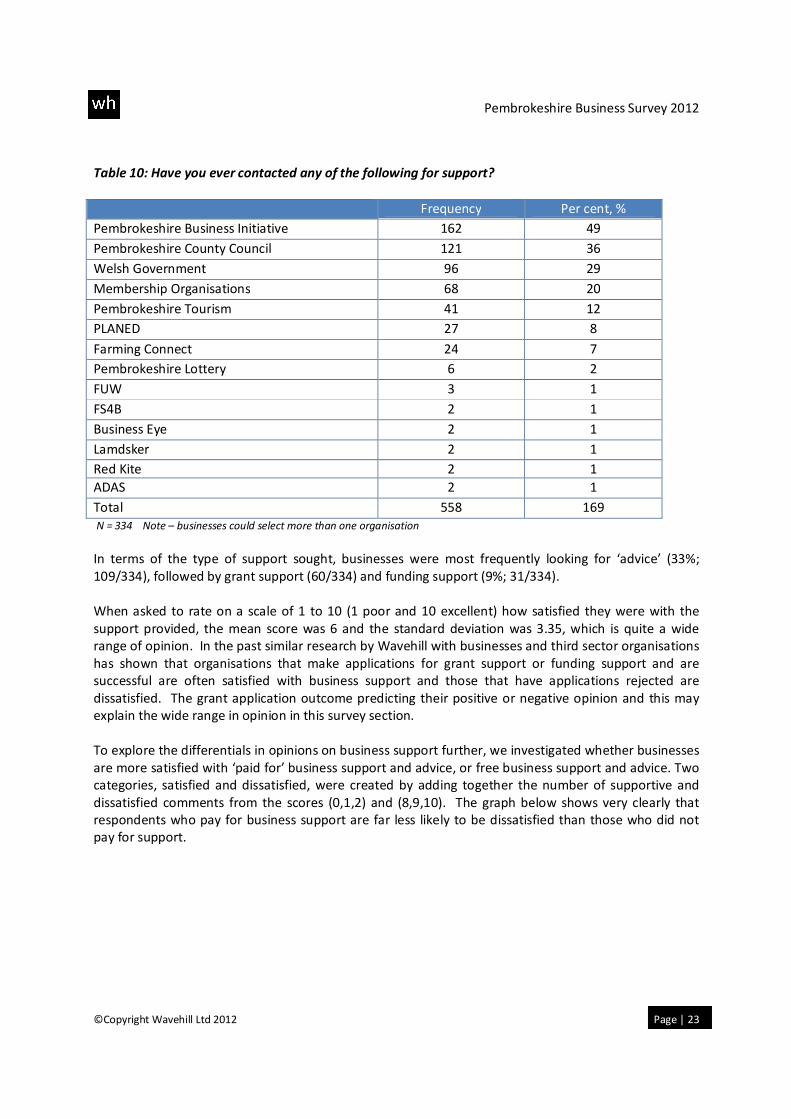
As table 10 shows, the Pembrokeshire Business Initiative was the most frequently referenced
organisation that businesses contacted for support, followed by Pembrokeshire County Council and the
Welsh Government.
Pembrokeshire Business Survey 2012
©Copyright Wavehill Ltd 2012 Page | 23
Table 10: Have you ever contacted any of the following for support?
Frequency Per cent, %
Pembrokeshire Business Initiative 162 49
Pembrokeshire County Council 121 36
Welsh Government 96 29
Membership Organisations 68 20
Pembrokeshire Tourism 41 12
PLANED 27 8
Farming Connect 24 7
Pembrokeshire Lottery 6 2
FUW 3 1
FS4B 2 1
Business Eye 2 1
Lamdsker 2 1
Red Kite 2 1
ADAS 2 1
Total 558 169
N = 334 Note – businesses could select more than one organisation
In terms of the type of support sought, businesses were most frequently looking for ‘advice’ (33%;
109/334), followed by grant support (60/334) and funding support (9%; 31/334).
When asked to rate on a scale of 1 to 10 (1 poor and 10 excellent) how satisfied they were with the
support provided, the mean score was 6 and the standard deviation was 3.35, which is quite a wide
range of opinion. In the past similar research by Wavehill with businesses and third sector organisations
has shown that organisations that make applications for grant support or funding support and are
successful are often satisfied with business support and those that have applications rejected are
dissatisfied. The grant application outcome predicting their positive or negative opinion and this may
explain the wide range in opinion in this survey section.
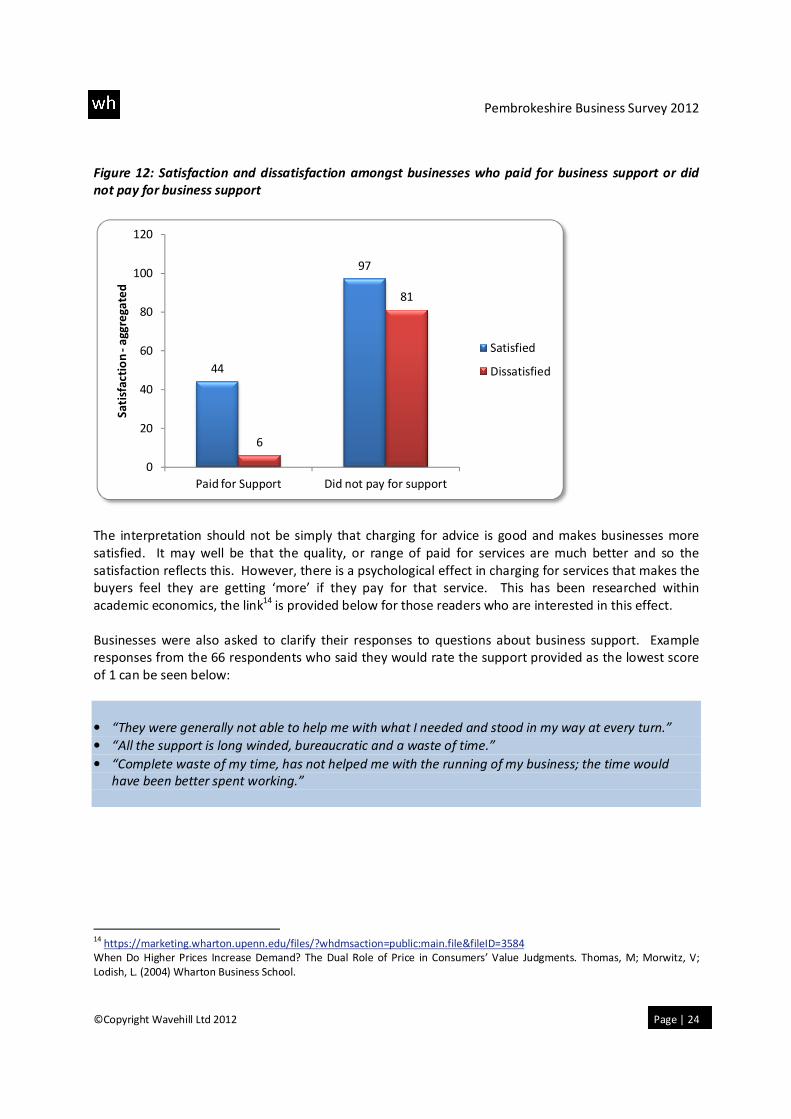
To explore the differentials in opinions on business support further, we investigated whether businesses
are more satisfied with ‘paid for’ business support and advice, or free business support and advice. Two
categories, satisfied and dissatisfied, were created by adding together the number of supportive and
dissatisfied comments from the scores (0,1,2) and (8,9,10). The graph below shows very clearly that
respondents who pay for business support are far less likely to be dissatisfied than those who did not
pay for support.
Pembrokeshire Business Survey 2012
©Copyright Wavehill Ltd 2012 Page | 24
Figure 12: Satisfaction and dissatisfaction amongst businesses who paid for business support or did
not pay for business support
The interpretation should not be simply that charging for advice is good and makes businesses more
satisfied. It may well be that the quality, or range of paid for services are much better and so the
satisfaction reflects this. However, there is a psychological effect in charging for services that makes the
buyers feel they are getting ‘more’ if they pay for that service. This has been researched within
academic economics, the link14
is provided below for those readers who are interested in this effect.
Businesses were also asked to clarify their responses to questions about business support. Example
responses from the 66 respondents who said they would rate the support provided as the lowest score
of 1 can be seen below:
• “They were generally not able to help me with what I needed and stood in my way at every turn.”
• “All the support is long winded, bureaucratic and a waste of time.”
• “Complete waste of my time, has not helped me with the running of my business; the time would
have been better spent working.”
14
https://marketing.wharton.upenn.edu/files/?whdmsaction=public:main.file&fileID=3584
When Do Higher Prices Increase Demand? The Dual Role of Price in Consumers’ Value Judgments. Thomas, M; Morwitz, V;
Lodish, L. (2004) Wharton Business School.
44
97
6
81
0
20
40
60
80
100
120
Paid for Support Did not pay for support
Sa
tisf
acti
on
-a
gg
reg
ate
d
Satisfied
Dissatisfied
Pembrokeshire Business Survey 2012
©Copyright Wavehill Ltd 2012 Page | 25
Conversely example responses from the 59 respondents who said they would rate the support as the
highest score of 10 can be seen below:
• “They are both very efficient and did what they said they would.”
• “We got really good advice and information on sourcing other companies, finding good suppliers,
having open days and events.”
• “Support was good and local advice was tailored to us.”
Businesses were asked to describe the most important type of support that the public sector currently
provides to small and medium sized businesses. Grants, tax reductions and funding were the most
frequently noted assistance, accounting for 59% of responses. Only 12% of business responses
identified business advice as the most important form of support. The proportion focusing on grant
support was very high and may reflect the availability of grants in the Wales objective one convergence
region. It may be suggestive of an emergent business culture that expects business grants over business
advice.
• Reduced business rates 36%
• Business grants 13%
• Business advice 12%
• Business funding 10%
Pembrokeshire Business Survey 2012
©Copyright Wavehill Ltd 2012 Page | 26
7. Business Premises The requirement for larger business premises can indicate that a business is growing, investing capital
and possibly expanding its workforce requirement. Businesses that need larger premises could be
targeted with business support.
Seven per cent of respondents stated they would need a larger business premises in the future (49/731).
When this group was asked what type of premises they required, 41% said an industrial unit (20/49),
39% a shop (19/49), 22% an office (11/49) and 26% stated other (16/49) Other responses included
agricultural land, workshops and larger garages.
When split by sector we can see that of the 49 respondents who stated they would need larger premises
in the future, 24% came from the sector of wholesale, retail and repairs (11/49), 21% came from hotels
and restaurants and 21% came from construction (10/49).
Pembrokeshire Business Survey 2012
©Copyright Wavehill Ltd 2012 Page | 27
8. Information Technology The use of information technology, accessing cloud services and being able to have local broadband
networks to connect to the internet is important for many businesses if they wish to remain
competitive.
Seventy-five per cent of respondents (546/731) use broadband in the course of their normal business;
this is much higher than was identified in the 2006 Wavehill Pembrokeshire Business Survey, where only
30% of businesses surveyed stated that they used broadband as part of their business. Of the 75% of
the respondents in this survey who use broadband in the course of their normal business, 68% believe
that the service they currently receive is adequate for their business (373/546), but 32% do not
(173/546). Splitting this by sector it is possible to see that 29% of businesses from the hotel and
restaurant sector (50/172) do not feel that the broadband service is good enough for their business.
This may be because they often share the broadband connection internally across many rooms or
several WiFi points, requiring much higher bandwidth allocations and connection speeds than a business
where internet access is primarily used by employees. Those respondents who stated the service is not
good enough for their business explain that the service is too slow 70%; (149/213), unreliable or
intermittent 20%; (41/213). Other responses (7) included that the cost was too expensive, and a limited
choice when choosing internet providers.
Although 48% of respondents stated that they have no further broadband requirements at the moment
(265/546); 50% state they would like a faster speed (274/546), 8% said improved reliability (43/546), 7%
said competitive prices (37/546) and 5% said better coverage (25/546). BETS has stated that ‘… all
businesses in Wales will have access to Next Generation Broadband by 2015, with the ambition that 50%
or more have access to 100Mbps.’ (BETS, 2011).
Ninety-four per cent of respondents stated that they did not access WiFi using public networks, for
example in libraries and internet cafés. Those 6% who do access WiFi using public networks were asked
why they did so, some example responses can be seen below:
• “I'm out of the office quite a lot, pick up emails.”
• “This is done whilst visiting customers.”
• “Usually when we're out and about meeting clients, it means we can take the office with us.”
When asked whether they had a website for their business, 52% of respondents said yes (376/731). It is
interesting to compare this figure to the Wavehill Pembrokeshire Business Survey from 2006 where only
28% of businesses had a website.
Pembrokeshire Business Survey 2012
©Copyright Wavehill Ltd 2012 Page | 28
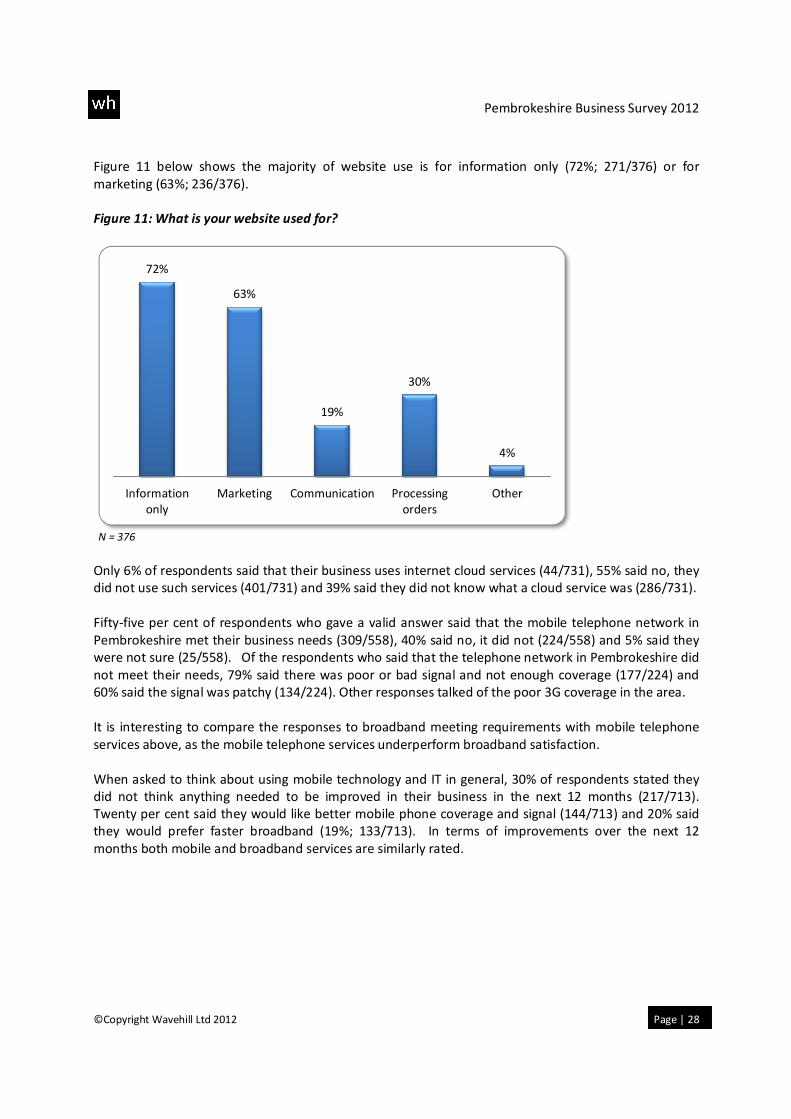
Figure 11 below shows the majority of website use is for information only (72%; 271/376) or for
marketing (63%; 236/376).
Figure 11: What is your website used for?
N = 376
Only 6% of respondents said that their business uses internet cloud services (44/731), 55% said no, they
did not use such services (401/731) and 39% said they did not know what a cloud service was (286/731).
Fifty-five per cent of respondents who gave a valid answer said that the mobile telephone network in
Pembrokeshire met their business needs (309/558), 40% said no, it did not (224/558) and 5% said they
were not sure (25/558). Of the respondents who said that the telephone network in Pembrokeshire did
not meet their needs, 79% said there was poor or bad signal and not enough coverage (177/224) and
60% said the signal was patchy (134/224). Other responses talked of the poor 3G coverage in the area.
It is interesting to compare the responses to broadband meeting requirements with mobile telephone
services above, as the mobile telephone services underperform broadband satisfaction.
When asked to think about using mobile technology and IT in general, 30% of respondents stated they
did not think anything needed to be improved in their business in the next 12 months (217/713).
Twenty per cent said they would like better mobile phone coverage and signal (144/713) and 20% said
they would prefer faster broadband (19%; 133/713). In terms of improvements over the next 12
months both mobile and broadband services are similarly rated.
72%
63%
19%
30%
4%
Information
only
Marketing Communication Processing
orders
Other
Pembrokeshire Business Survey 2012
©Copyright Wavehill Ltd 2012 Page | 29
9. Marketing and Advertising Marketing, promotion and advertising are essential for many businesses if they wish to maintain market
share, grow their market share, or introduce new products and services or provide products and services
to new locations and sectors. However, marketing and advertising budgets are one of the first business
expenditures to be reduced during times of business contraction.
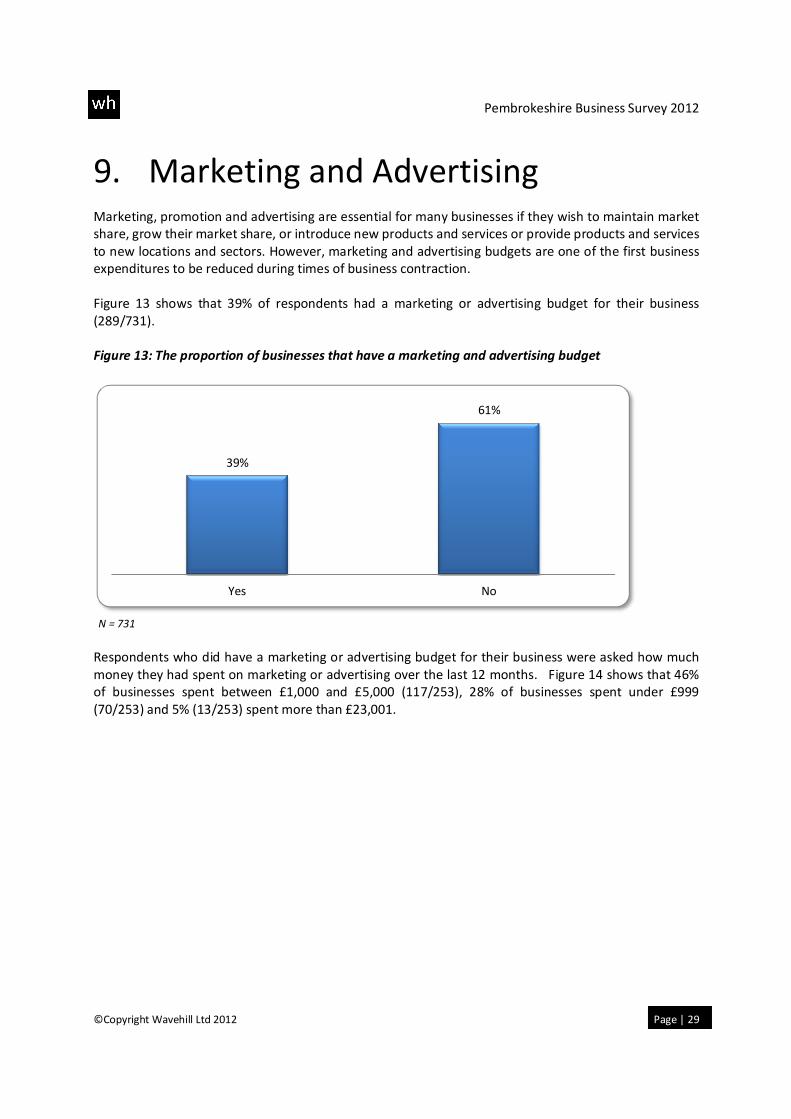
Figure 13 shows that 39% of respondents had a marketing or advertising budget for their business
(289/731).
Figure 13: The proportion of businesses that have a marketing and advertising budget
N = 731
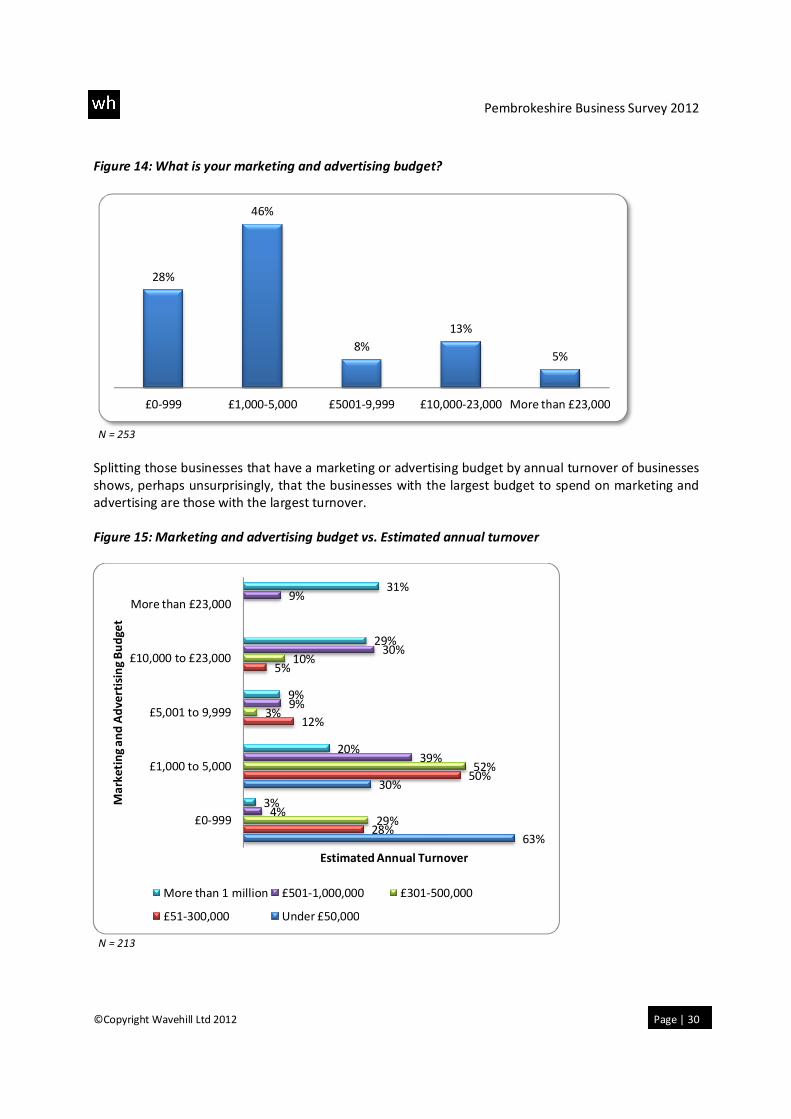
Respondents who did have a marketing or advertising budget for their business were asked how much
money they had spent on marketing or advertising over the last 12 months. Figure 14 shows that 46%
of businesses spent between £1,000 and £5,000 (117/253), 28% of businesses spent under £999
(70/253) and 5% (13/253) spent more than £23,001.
39%
61%
Yes No
Pembrokeshire Business Survey 2012
©Copyright Wavehill Ltd 2012 Page | 30
Figure 14: What is your marketing and advertising budget?
N = 253
Splitting those businesses that have a marketing or advertising budget by annual turnover of businesses
shows, perhaps unsurprisingly, that the businesses with the largest budget to spend on marketing and
advertising are those with the largest turnover.
Figure 15: Marketing and advertising budget vs. Estimated annual turnover
N = 213
28%
46%
8%
13%
5%
£0-999 £1,000-5,000 £5001-9,999 £10,000-23,000 More than £23,000
63%
30%
28%
50%
12%
5%
29%
52%
3%
10%
4%
39%
9%
30%
9%
3%
20%
9%
29%
31%
£0-999
£1,000 to 5,000
£5,001 to 9,999
£10,000 to £23,000
More than £23,000
Estimated Annual Turnover
Ma
rke
tin
g a
nd
Ad
ve
rtis
ing
Bu
dg
et
More than 1 million £501-1,000,000 £301-500,000
£51-300,000 Under £50,000
Pembrokeshire Business Survey 2012
©Copyright Wavehill Ltd 2012 Page | 31
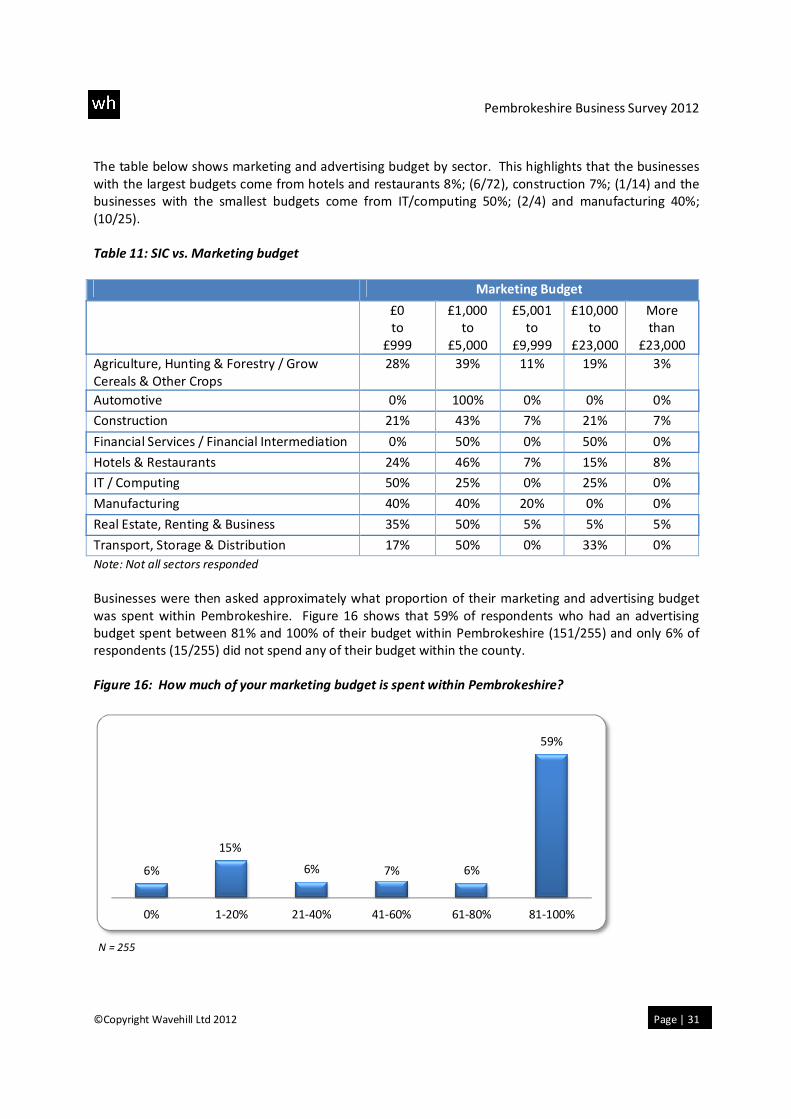
The table below shows marketing and advertising budget by sector. This highlights that the businesses
with the largest budgets come from hotels and restaurants 8%; (6/72), construction 7%; (1/14) and the
businesses with the smallest budgets come from IT/computing 50%; (2/4) and manufacturing 40%;
(10/25).
Table 11: SIC vs. Marketing budget
Marketing Budget
£0
to
£999
£1,000
to
£5,000
£5,001
to
£9,999
£10,000
to
£23,000
More
than
£23,000
Agriculture, Hunting & Forestry / Grow
Cereals & Other Crops
28% 39% 11% 19% 3%
Automotive 0% 100% 0% 0% 0%
Construction 21% 43% 7% 21% 7%
Financial Services / Financial Intermediation 0% 50% 0% 50% 0%
Hotels & Restaurants 24% 46% 7% 15% 8%
IT / Computing 50% 25% 0% 25% 0%
Manufacturing 40% 40% 20% 0% 0%
Real Estate, Renting & Business 35% 50% 5% 5% 5%
Transport, Storage & Distribution 17% 50% 0% 33% 0%
Note: Not all sectors responded
Businesses were then asked approximately what proportion of their marketing and advertising budget
was spent within Pembrokeshire. Figure 16 shows that 59% of respondents who had an advertising
budget spent between 81% and 100% of their budget within Pembrokeshire (151/255) and only 6% of
respondents (15/255) did not spend any of their budget within the county.
Figure 16: How much of your marketing budget is spent within Pembrokeshire?
N = 255
6%
15%
6% 7% 6%
59%
0% 1-20% 21-40% 41-60% 61-80% 81-100%
Pembrokeshire Business Survey 2012
©Copyright Wavehill Ltd 2012 Page | 32
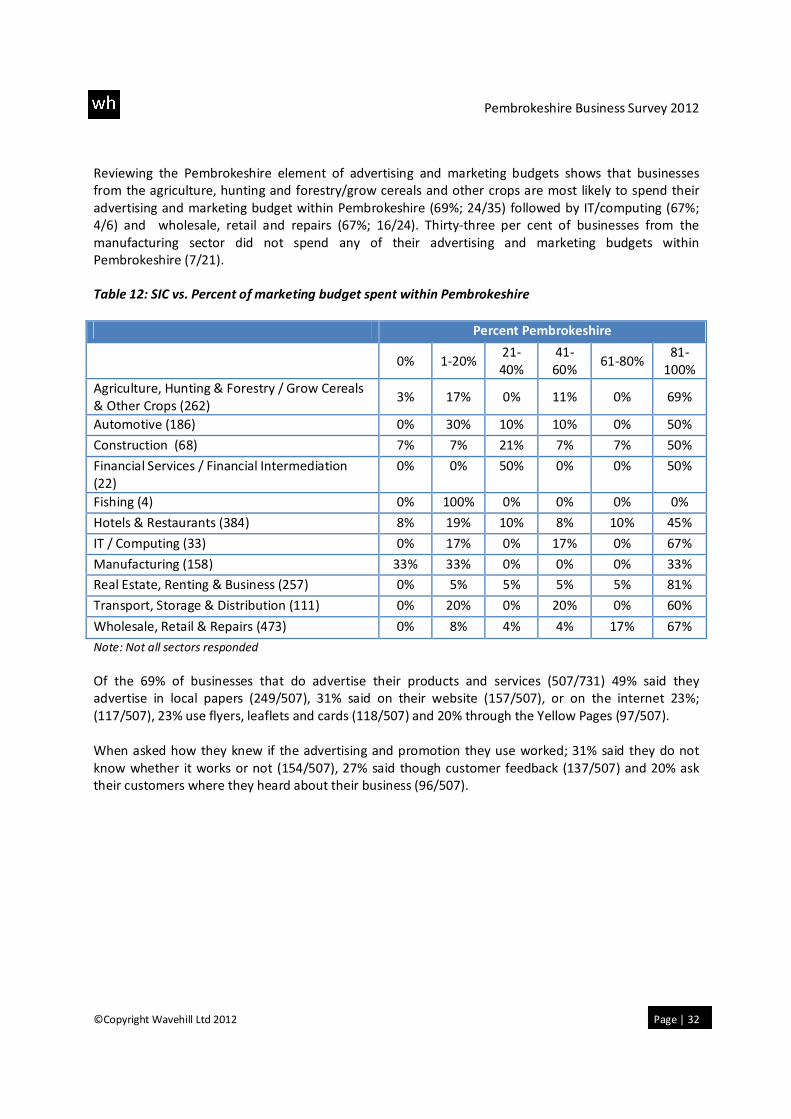
Reviewing the Pembrokeshire element of advertising and marketing budgets shows that businesses
from the agriculture, hunting and forestry/grow cereals and other crops are most likely to spend their
advertising and marketing budget within Pembrokeshire (69%; 24/35) followed by IT/computing (67%;
4/6) and wholesale, retail and repairs (67%; 16/24). Thirty-three per cent of businesses from the
manufacturing sector did not spend any of their advertising and marketing budgets within
Pembrokeshire (7/21).
Table 12: SIC vs. Percent of marketing budget spent within Pembrokeshire
Percent Pembrokeshire
0% 1-20%
21-
40%
41-
60% 61-80%
81-
100%
Agriculture, Hunting & Forestry / Grow Cereals
& Other Crops (262) 3% 17% 0% 11% 0% 69%
Automotive (186) 0% 30% 10% 10% 0% 50%
Construction (68) 7% 7% 21% 7% 7% 50%
Financial Services / Financial Intermediation
(22)
0% 0% 50% 0% 0% 50%
Fishing (4) 0% 100% 0% 0% 0% 0%
Hotels & Restaurants (384) 8% 19% 10% 8% 10% 45%
IT / Computing (33) 0% 17% 0% 17% 0% 67%
Manufacturing (158) 33% 33% 0% 0% 0% 33%
Real Estate, Renting & Business (257) 0% 5% 5% 5% 5% 81%
Transport, Storage & Distribution (111) 0% 20% 0% 20% 0% 60%
Wholesale, Retail & Repairs (473) 0% 8% 4% 4% 17% 67%
Note: Not all sectors responded
Of the 69% of businesses that do advertise their products and services (507/731) 49% said they
advertise in local papers (249/507), 31% said on their website (157/507), or on the internet 23%;
(117/507), 23% use flyers, leaflets and cards (118/507) and 20% through the Yellow Pages (97/507).
When asked how they knew if the advertising and promotion they use worked; 31% said they do not
know whether it works or not (154/507), 27% said though customer feedback (137/507) and 20% ask
their customers where they heard about their business (96/507).
Pembrokeshire Business Survey 2012
©Copyright Wavehill Ltd 2012 Page | 33
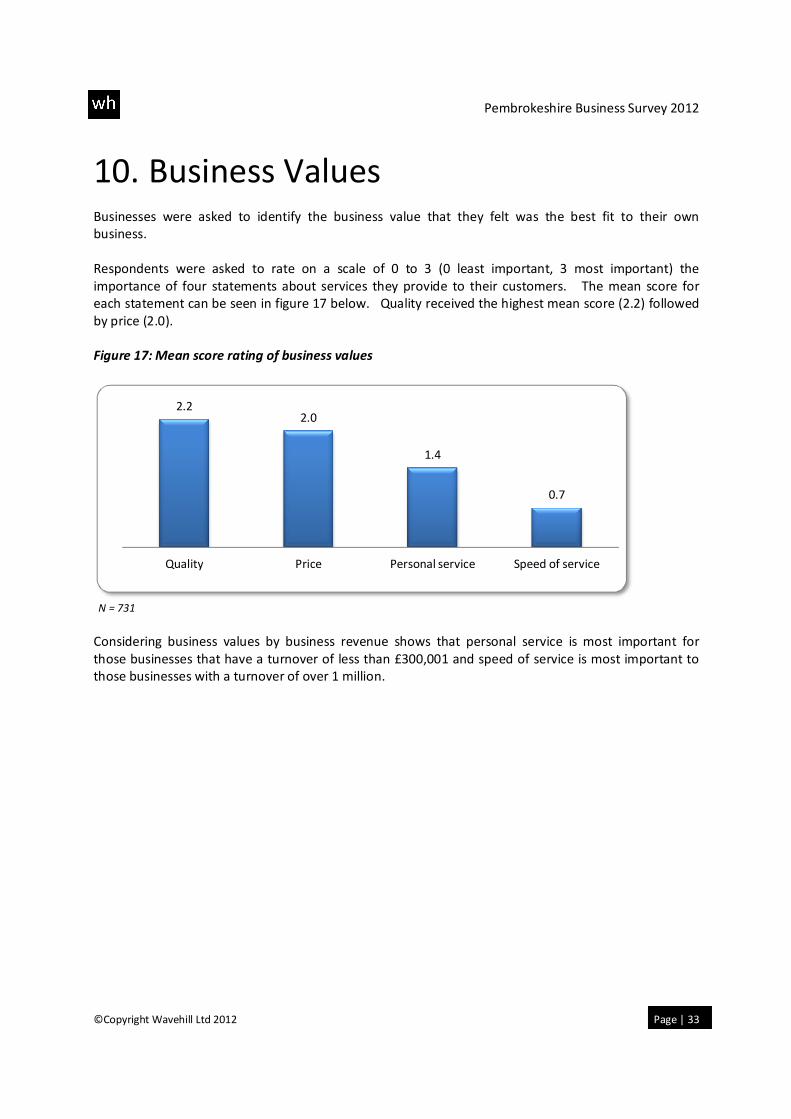
10. Business Values Businesses were asked to identify the business value that they felt was the best fit to their own
business.
Respondents were asked to rate on a scale of 0 to 3 (0 least important, 3 most important) the
importance of four statements about services they provide to their customers. The mean score for
each statement can be seen in figure 17 below. Quality received the highest mean score (2.2) followed
by price (2.0).
Figure 17: Mean score rating of business values
N = 731
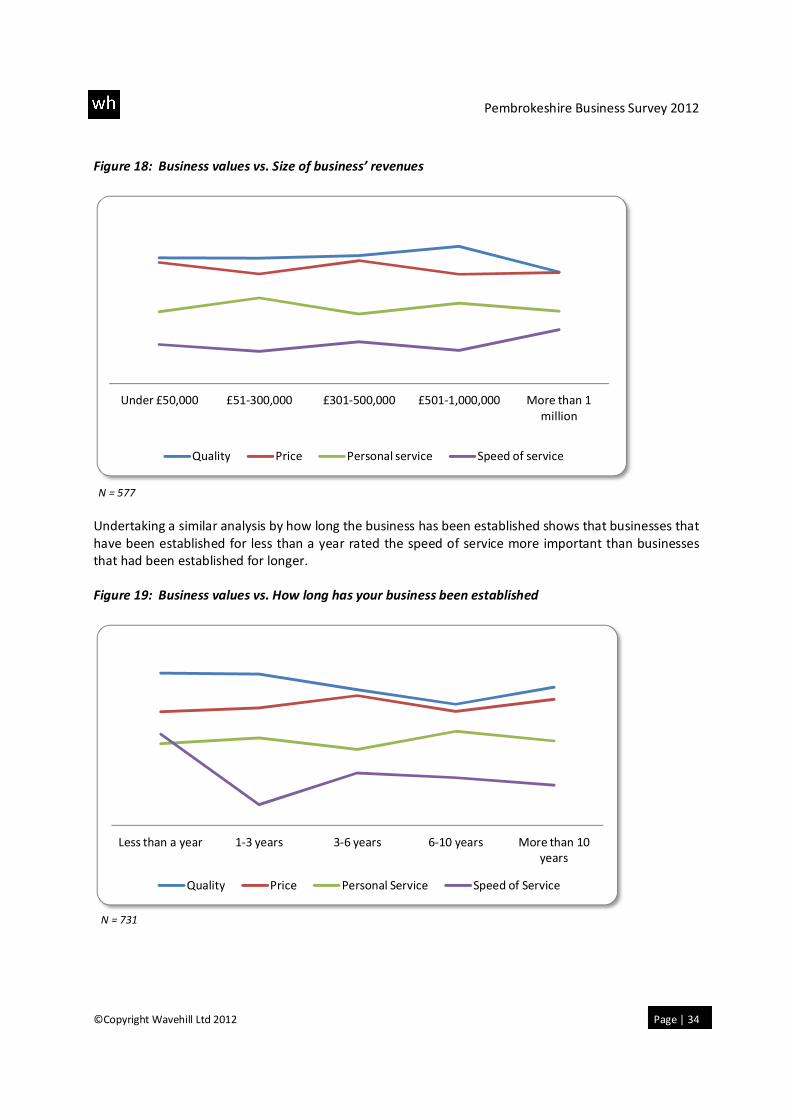
Considering business values by business revenue shows that personal service is most important for
those businesses that have a turnover of less than £300,001 and speed of service is most important to
those businesses with a turnover of over 1 million.
2.22.0
1.4
0.7
Quality Price Personal service Speed of service
Pembrokeshire Business Survey 2012
©Copyright Wavehill Ltd 2012 Page | 34
Figure 18: Business values vs. Size of business’ revenues
N = 577
Undertaking a similar analysis by how long the business has been established shows that businesses that
have been established for less than a year rated the speed of service more important than businesses
that had been established for longer.
Figure 19: Business values vs. How long has your business been established
N = 731
Under £50,000 £51-300,000 £301-500,000 £501-1,000,000 More than 1
million
Quality Price Personal service Speed of service
Less than a year 1-3 years 3-6 years 6-10 years More than 10
years
Quality Price Personal Service Speed of Service
Pembrokeshire Business Survey 2012
©Copyright Wavehill Ltd 2012 Page | 35
11. Workforce The workforce in a business is perhaps its most crucial element. Businesses need a flexible and skilled
labour force to produce goods and services efficiently and to meet the labour demands of businesses in
a timely way. A stronger economy tends to increase demand for workers and unemployment falls, a
weak economy tends to reverse this effect.
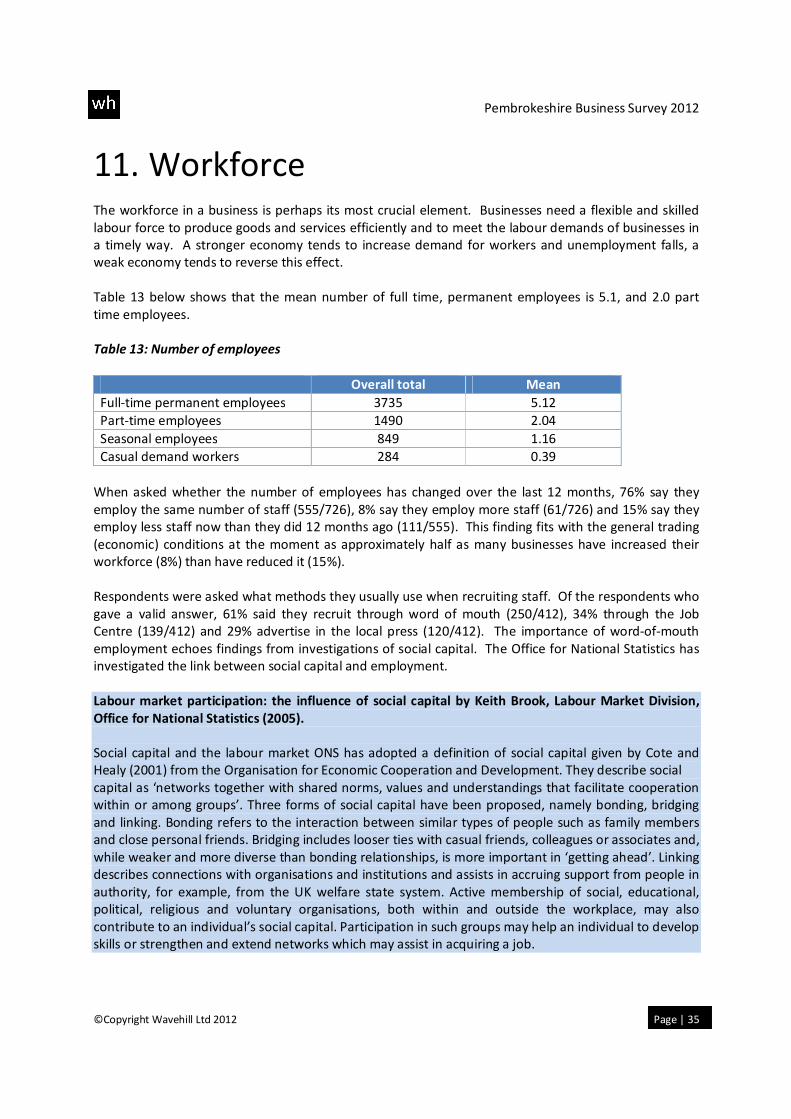
Table 13 below shows that the mean number of full time, permanent employees is 5.1, and 2.0 part
time employees.
Table 13: Number of employees
Overall total Mean
Full-time permanent employees 3735 5.12
Part-time employees 1490 2.04
Seasonal employees 849 1.16
Casual demand workers 284 0.39
When asked whether the number of employees has changed over the last 12 months, 76% say they
employ the same number of staff (555/726), 8% say they employ more staff (61/726) and 15% say they
employ less staff now than they did 12 months ago (111/555). This finding fits with the general trading
(economic) conditions at the moment as approximately half as many businesses have increased their
workforce (8%) than have reduced it (15%).
Respondents were asked what methods they usually use when recruiting staff. Of the respondents who
gave a valid answer, 61% said they recruit through word of mouth (250/412), 34% through the Job
Centre (139/412) and 29% advertise in the local press (120/412). The importance of word-of-mouth
employment echoes findings from investigations of social capital. The Office for National Statistics has
investigated the link between social capital and employment.
Labour market participation: the influence of social capital by Keith Brook, Labour Market Division,
Office for National Statistics (2005).
Social capital and the labour market ONS has adopted a definition of social capital given by Cote and
Healy (2001) from the Organisation for Economic Cooperation and Development. They describe social
capital as ‘networks together with shared norms, values and understandings that facilitate cooperation
within or among groups’. Three forms of social capital have been proposed, namely bonding, bridging
and linking. Bonding refers to the interaction between similar types of people such as family members
and close personal friends. Bridging includes looser ties with casual friends, colleagues or associates and,
while weaker and more diverse than bonding relationships, is more important in ‘getting ahead’. Linking
describes connections with organisations and institutions and assists in accruing support from people in
authority, for example, from the UK welfare state system. Active membership of social, educational,
political, religious and voluntary organisations, both within and outside the workplace, may also
contribute to an individual’s social capital. Participation in such groups may help an individual to develop
skills or strengthen and extend networks which may assist in acquiring a job.
Pembrokeshire Business Survey 2012
©Copyright Wavehill Ltd 2012 Page | 36
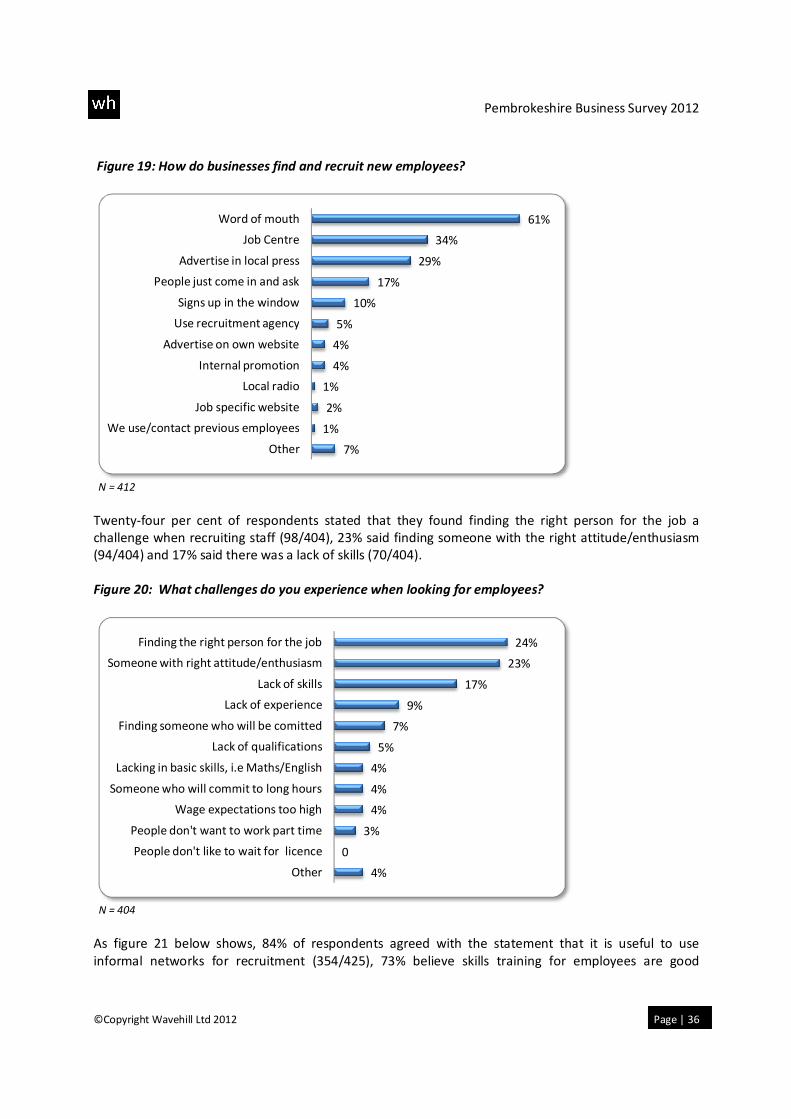
Figure 19: How do businesses find and recruit new employees?
N = 412
Twenty-four per cent of respondents stated that they found finding the right person for the job a
challenge when recruiting staff (98/404), 23% said finding someone with the right attitude/enthusiasm
(94/404) and 17% said there was a lack of skills (70/404).
Figure 20: What challenges do you experience when looking for employees?
N = 404
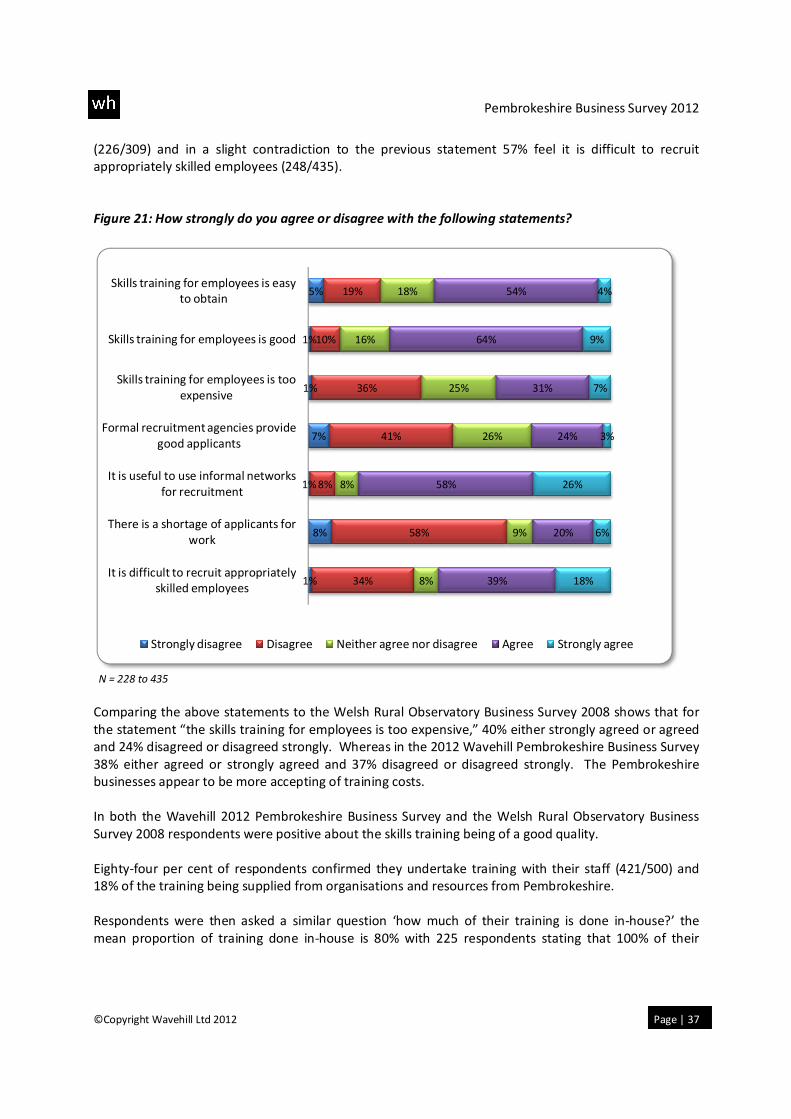
As figure 21 below shows, 84% of respondents agreed with the statement that it is useful to use
informal networks for recruitment (354/425), 73% believe skills training for employees are good
7%
1%
2%
1%
4%
4%
5%
10%
17%
29%
34%
61%
Other
We use/contact previous employees
Job specific website
Local radio
Internal promotion
Advertise on own website
Use recruitment agency
Signs up in the window
People just come in and ask
Advertise in local press
Job Centre
Word of mouth
4%
0
3%
4%
4%
4%
5%
7%
9%
17%
23%
24%
Other
People don't like to wait for licence
People don't want to work part time
Wage expectations too high
Someone who will commit to long hours
Lacking in basic skills, i.e Maths/English
Lack of qualifications
Finding someone who will be comitted
Lack of experience
Lack of skills
Someone with right attitude/enthusiasm
Finding the right person for the job
Pembrokeshire Business Survey 2012
©Copyright Wavehill Ltd 2012 Page | 37
(226/309) and in a slight contradiction to the previous statement 57% feel it is difficult to recruit
appropriately skilled employees (248/435).
Figure 21: How strongly do you agree or disagree with the following statements?
N = 228 to 435
Comparing the above statements to the Welsh Rural Observatory Business Survey 2008 shows that for
the statement “the skills training for employees is too expensive,” 40% either strongly agreed or agreed
and 24% disagreed or disagreed strongly. Whereas in the 2012 Wavehill Pembrokeshire Business Survey
38% either agreed or strongly agreed and 37% disagreed or disagreed strongly. The Pembrokeshire
businesses appear to be more accepting of training costs.
In both the Wavehill 2012 Pembrokeshire Business Survey and the Welsh Rural Observatory Business
Survey 2008 respondents were positive about the skills training being of a good quality.
Eighty-four per cent of respondents confirmed they undertake training with their staff (421/500) and
18% of the training being supplied from organisations and resources from Pembrokeshire.
Respondents were then asked a similar question ‘how much of their training is done in-house?’ the
mean proportion of training done in-house is 80% with 225 respondents stating that 100% of their
1%
8%
1%
7%
1%
1%
5%
34%
58%
8%
41%
36%
10%
19%
8%
9%
8%
26%
25%
16%
18%
39%
20%
58%
24%
31%
64%
54%
18%
6%
26%
3%
7%
9%
4%
It is difficult to recruit appropriately
skilled employees
There is a shortage of applicants for
work
It is useful to use informal networks
for recruitment
Formal recruitment agencies provide
good applicants
Skills training for employees is too
expensive
Skills training for employees is good
Skills training for employees is easy
to obtain
Strongly disagree Disagree Neither agree nor disagree Agree Strongly agree
Pembrokeshire Business Survey 2012
©Copyright Wavehill Ltd 2012 Page | 38
needs were met in-house. A mean proportion of 5% was the amount of training delivered through
distance learning and a mean of 93% was delivered face to face.
Three per cent of respondents (19/731) had an International Organisation for Standardisation (ISO)
certificate which is about half the rate (6%) that the BSI estimates across businesses in the UK. When
divided by business turnover 58% of businesses with an estimated annual turnover of £1million
compared to none with a turnover of under £50,000 had an ISO certificate in the Pembrokeshire survey.
The investment in ISO accreditation may be too much for smaller businesses, but necessary for larger
ones.
In a study to examine the effects of ISO 9001 on employee outcomes such as employment, earnings, and
health and safety, David I. Levine of the University of California at Berkeley and Michael W. Toffel of the
Harvard Business School analyzed a matched sample of nearly 1,000 companies in California. ISO
adopters realized higher rates of growth of sales, employment, payroll, and average annual earnings.
Injury rates also declined slightly at ISO 9001 adopters, although total injury costs did not.
Source: Quality Management and Job Quality: How the ISO9001 Standard for Quality management Systems Affects Employees
and Employers
When viewed by sector, the highest per cent of businesses with ISO’s came from hotels and restaurants
53%; (10/19) and wholesale, retail and repairs 21%; (4/19). Wholesale, retail and repair sector may have
to use an ISO as part of their supply chain requirements, leading to these results.
Two per cent of respondents (16/731) had Investors in People (IIP). Businesses with the larger turnover
were most likely to have Investors in People status; for example no businesses with an estimated annual
turnover of under £50,000 had an IIP, compared to 13% of business with a turnover of over 1 million.
Splitting this by sector we can see that those sectors which have the greatest percentage of businesses
with an IPP are transport, storage and distribution 5%; (1/20), agriculture, hunting and forestry/grow
cereals and other crops (4%; 4/89) and hotels and restaurants 4%; (6/144), although all are relatively
low.
Five per cent of respondents have other training systems and awards such as Federation of Small
Businesses, MCS, CHAS and International Safety Management.
Pembrokeshire Business Survey 2012
©Copyright Wavehill Ltd 2012 Page | 39
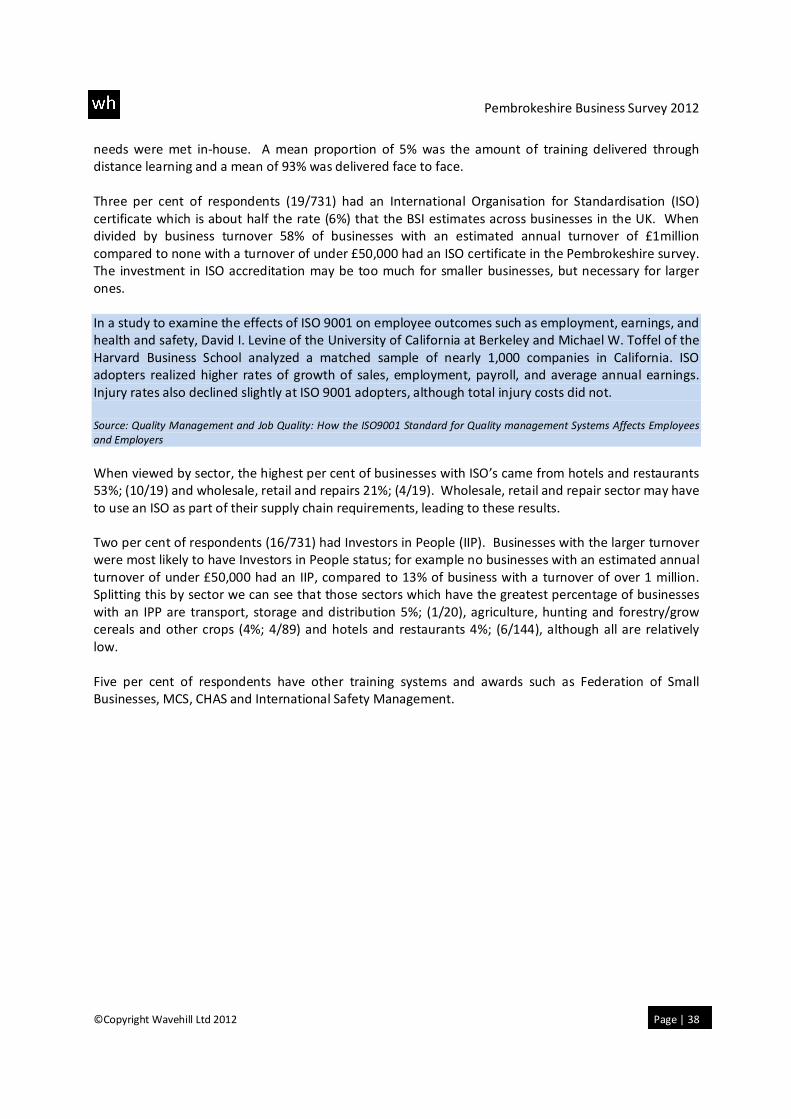
Figure 22: Does your business have a formal training or development plan?
N = 461
As it is possible to see from figure 22, 81% of respondents do not have either a formal training or
development plan (349/520), 17% have both a formal training and a development plan (77/508) and 3%
plan to introduce one in the next 12 months (17/520).
Reviewing the data by turnover we can see that those businesses that have both a formal training plan
and a development plan are mainly from businesses with a larger average annual turnover; for example
26% of businesses with a turnover of more than £1 million (20/77) and 18% of businesses with a
turnover of between £501,000 and £1,000,000 (14/54) had both a formal training and a development
plan.
An important question that arises from this analysis is about causation. Do larger (more successful)
businesses have training and development plans because they are large, or because these tools help to
bring the success? Formalised management planning is clearly important and may help to cause success
rather than follow on after it.
3%
3%
8%
19%
67%
Development plan
I plan to introduce one in the next 12
months
Formal training plan
Both formal training development plan
None
Pembrokeshire Business Survey 2012
©Copyright Wavehill Ltd 2012 Page | 40
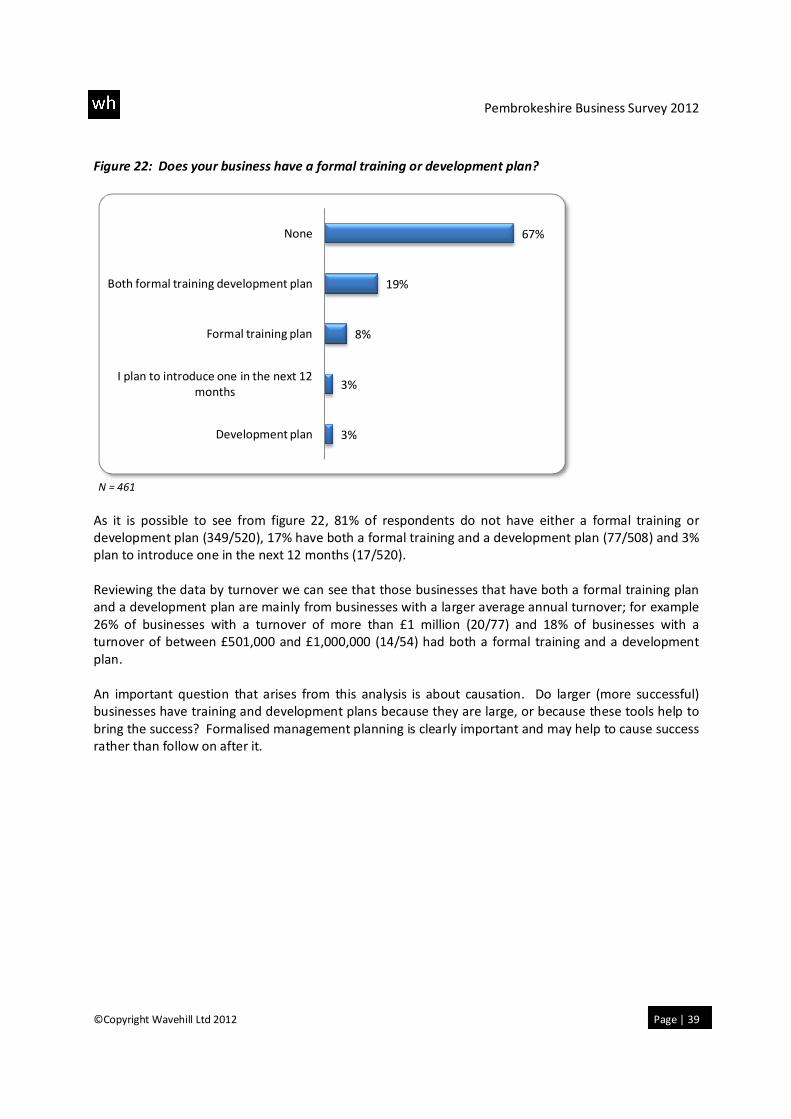
12. Local Supply Chain Local supply chains are important to a local economy because they keep money, employment, skills and
business networks within the local economy. The concept of LM3 has been developed by the New
Economics Foundation to look at how effectively local economies maintain and circulate the same
money within local areas. For example, £1,000 that circulates three times within a local economy is
worth £2,000 more than if it had only circulated once and then ‘leaked out’ to another area.
Figure 23 shows that a mean of 60% of revenues or turnover come from Pembrokeshire, 19% come
from Wales (not including Pembrokeshire) 18% come from the UK (not including Wales) and 3% come
from worldwide.
Figure 23: Mean percent of location of sales
N = 726
Dividing the mean proportion of supply chain sales by annual turnover shows that the businesses with a
turnover of less than 1 million have largely the same pattern of sales coming from businesses in
Pembrokeshire, of between 55 and 60%; but as the graph below shows those businesses that have a
turnover of more than £1 million tended to have more sales from worldwide, UK and Welsh based
markets.
3%
18% 19%
60%
Worldwide UK (Not including
Wales)
Wales (Not including
Pembrokeshire)
Pembrokeshire
Pembrokeshire Business Survey 2012
©Copyright Wavehill Ltd 2012 Page | 41
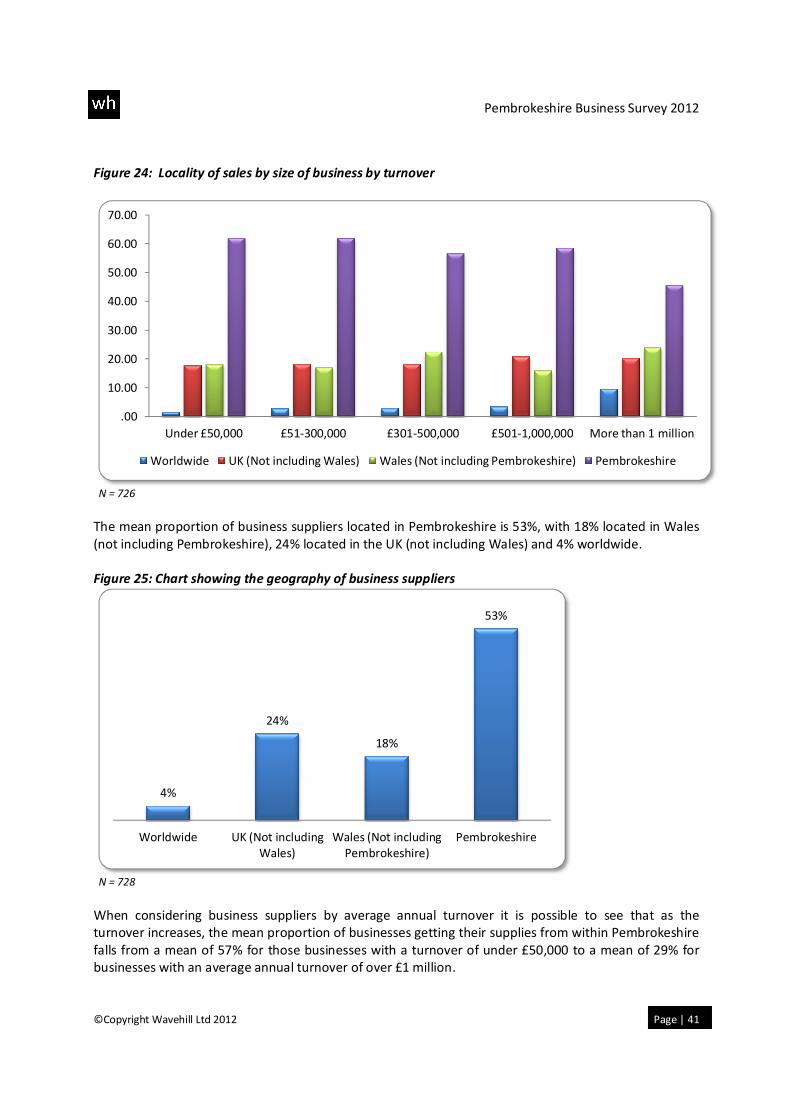
Figure 24: Locality of sales by size of business by turnover
N = 726
The mean proportion of business suppliers located in Pembrokeshire is 53%, with 18% located in Wales
(not including Pembrokeshire), 24% located in the UK (not including Wales) and 4% worldwide.
Figure 25: Chart showing the geography of business suppliers
N = 728
When considering business suppliers by average annual turnover it is possible to see that as the
turnover increases, the mean proportion of businesses getting their supplies from within Pembrokeshire
falls from a mean of 57% for those businesses with a turnover of under £50,000 to a mean of 29% for
businesses with an average annual turnover of over £1 million.
.00
10.00
20.00
30.00
40.00
50.00
60.00
70.00
Under £50,000 £51-300,000 £301-500,000 £501-1,000,000 More than 1 million
Worldwide UK (Not including Wales) Wales (Not including Pembrokeshire) Pembrokeshire
4%
24%
18%
53%
Worldwide UK (Not including
Wales)
Wales (Not including
Pembrokeshire)
Pembrokeshire
Pembrokeshire Business Survey 2012
©Copyright Wavehill Ltd 2012 Page | 42
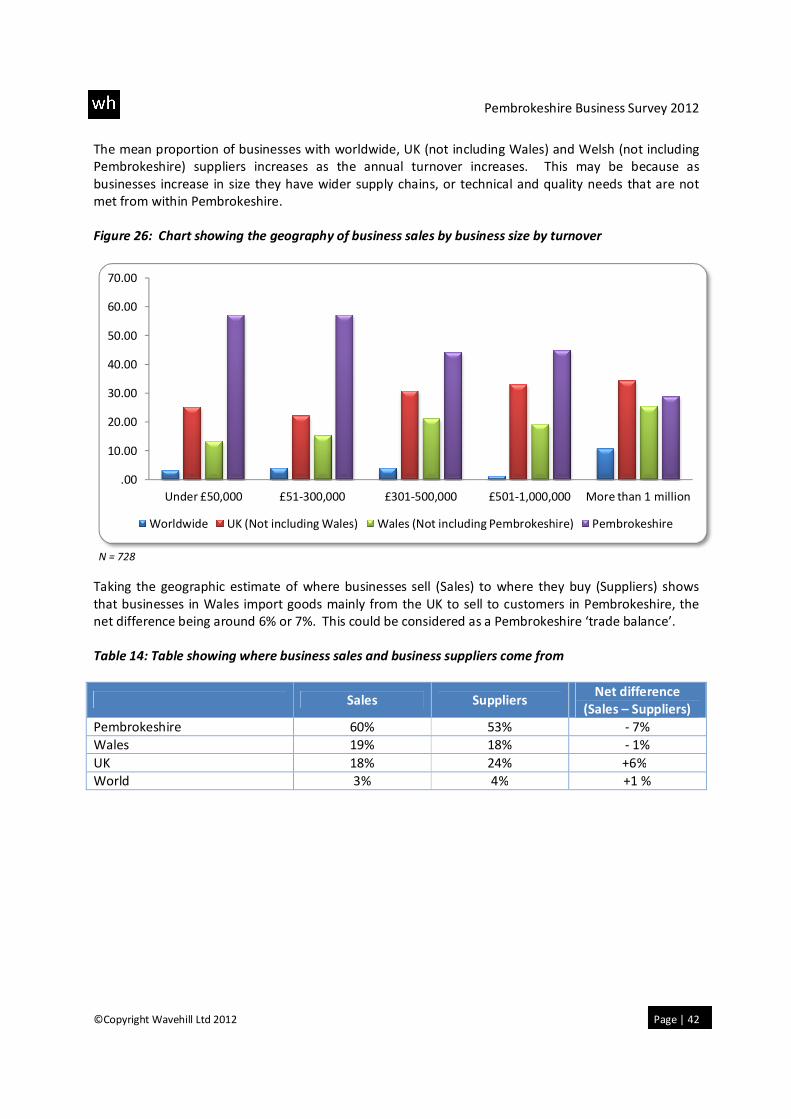
The mean proportion of businesses with worldwide, UK (not including Wales) and Welsh (not including
Pembrokeshire) suppliers increases as the annual turnover increases. This may be because as
businesses increase in size they have wider supply chains, or technical and quality needs that are not
met from within Pembrokeshire.
Figure 26: Chart showing the geography of business sales by business size by turnover
N = 728
Taking the geographic estimate of where businesses sell (Sales) to where they buy (Suppliers) shows
that businesses in Wales import goods mainly from the UK to sell to customers in Pembrokeshire, the
net difference being around 6% or 7%. This could be considered as a Pembrokeshire ‘trade balance’.
Table 14: Table showing where business sales and business suppliers come from
Sales Suppliers Net difference
(Sales – Suppliers)
Pembrokeshire 60% 53% - 7%
Wales 19% 18% - 1%
UK 18% 24% +6%
World 3% 4% +1 %
.00
10.00
20.00
30.00
40.00
50.00
60.00
70.00
Under £50,000 £51-300,000 £301-500,000 £501-1,000,000 More than 1 million
Worldwide UK (Not including Wales) Wales (Not including Pembrokeshire) Pembrokeshire
Pembrokeshire Business Survey 2012
©Copyright Wavehill Ltd 2012 Page | 43
13. Cost Management Business profits may fall due to increased costs. An increase in costs reduces the amount of profits
available to fund capital spending and pay dividends within businesses. During periods of economic
contraction business margins often fall due to a combination or reduced revenues or turnover and
increased costs. This can lead to business managers making cost savings by cutting investment and
reducing staff costs which can increase unemployment.
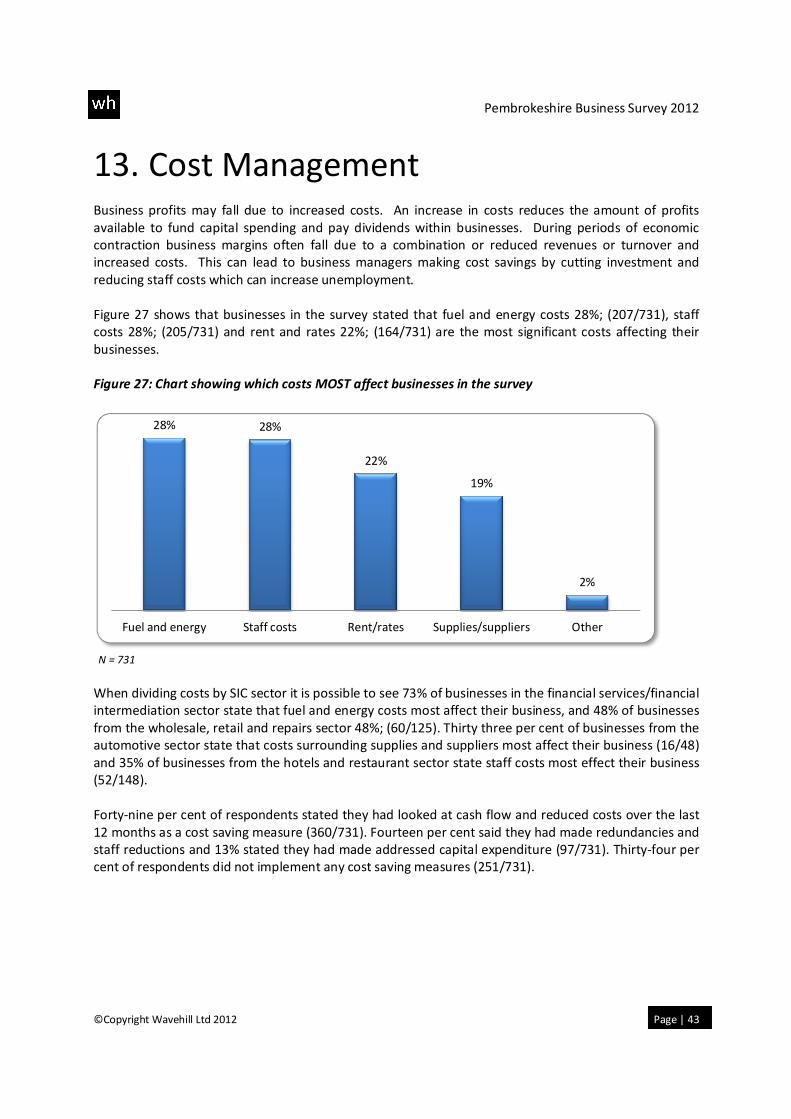
Figure 27 shows that businesses in the survey stated that fuel and energy costs 28%; (207/731), staff
costs 28%; (205/731) and rent and rates 22%; (164/731) are the most significant costs affecting their
businesses.
Figure 27: Chart showing which costs MOST affect businesses in the survey
N = 731
When dividing costs by SIC sector it is possible to see 73% of businesses in the financial services/financial
intermediation sector state that fuel and energy costs most affect their business, and 48% of businesses
from the wholesale, retail and repairs sector 48%; (60/125). Thirty three per cent of businesses from the
automotive sector state that costs surrounding supplies and suppliers most affect their business (16/48)
and 35% of businesses from the hotels and restaurant sector state staff costs most effect their business
(52/148).
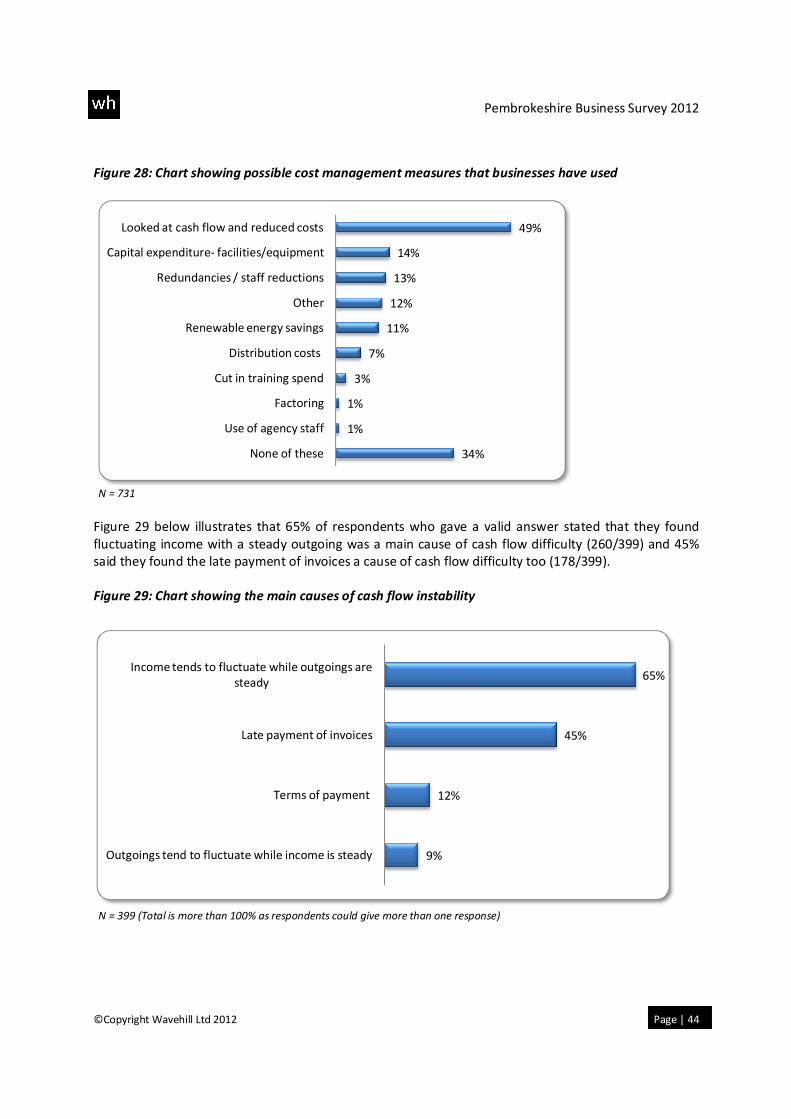
Forty-nine per cent of respondents stated they had looked at cash flow and reduced costs over the last
12 months as a cost saving measure (360/731). Fourteen per cent said they had made redundancies and
staff reductions and 13% stated they had made addressed capital expenditure (97/731). Thirty-four per
cent of respondents did not implement any cost saving measures (251/731).
28% 28%
22%
19%
2%
Fuel and energy Staff costs Rent/rates Supplies/suppliers Other
Pembrokeshire Business Survey 2012
©Copyright Wavehill Ltd 2012 Page | 44
Figure 28: Chart showing possible cost management measures that businesses have used
N = 731
Figure 29 below illustrates that 65% of respondents who gave a valid answer stated that they found
fluctuating income with a steady outgoing was a main cause of cash flow difficulty (260/399) and 45%
said they found the late payment of invoices a cause of cash flow difficulty too (178/399).
Figure 29: Chart showing the main causes of cash flow instability
N = 399 (Total is more than 100% as respondents could give more than one response)
34%
1%
1%
3%
7%
11%
12%
13%
14%
49%
None of these
Use of agency staff
Factoring
Cut in training spend
Distribution costs
Renewable energy savings
Other
Redundancies / staff reductions
Capital expenditure- facilities/equipment
Looked at cash flow and reduced costs
9%
12%
45%
65%
Outgoings tend to fluctuate while income is steady
Terms of payment
Late payment of invoices
Income tends to fluctuate while outgoings are
steady
Pembrokeshire Business Survey 2012
©Copyright Wavehill Ltd 2012 Page | 45
Dividing cash flow difficulties by income it is possible to see that smaller businesses, i.e. those with an
average annual turnover of under £50,000, are more likely to state ‘income tends to fluctuate while
outgoings are steady’ as a reason for cash flow difficulty. This compares to the larger businesses, i.e.
those businesses with an average annual turnover of more than £501,000 who are more likely to cite
terms of payment and late payment of invoices as key influences on cash flow.
Terms of payment is stated as a difficulty of cash flow from 21% of automotive businesses (7/33) and
13% from businesses from the wholesale, retail and repairs sector (14/112). Late payment of invoices is
cited as a problem by 44% of businesses in construction (21/48), 58% of businesses in the transport,
storage and distribution sector (8/15).
Dividing the ‘income tends to fluctuate while outgoings are steady’ comments by how long the business
has been established shows that the longer the business has been in existence, the less likely they are to
cite fluctuating income with steady outgoings as a form of cash flow difficulty. This suggests that
younger businesses find cash flow more unstable.
Pembrokeshire Business Survey 2012
©Copyright Wavehill Ltd 2012 Page | 46
14. Infrastructure Being able to connect efficiently to both suppliers and customers is important for businesses, especially
as stock holding has reduced and logistic supply chains become faster. Also consumers are increasingly
expecting goods to be delivered within 48 hours from supply portals such as Amazon. Businesses that
cannot access efficient supply chains may find their competitiveness decreases.
Twenty-three per cent of respondents stated that the transport infrastructure in Pembrokeshire does
affect the competitiveness of their business (173/725). When asked to explain their answer, the
responses indicate it affected the businesses in both positive and negative ways:
• “Travel time is long and this affects my business as it takes so long to get to meetings etc.”
• “It costs more for our supplies to get here.”
• “The fact that the roads are bad means it keeps our competitors out.”
• “We have to add travel expenses to our invoices & this is quite high when travelling from
Pembrokeshire.”
• “It does because we are always looking for new and cheaper ways to package our products and when
we find a better product its far away we are forced to buy in bulk because of the extra distribution
costs.”
Eleven per cent of respondents stated that public transport in Pembrokeshire does affect their business
(82/730). All of the responses indicated this was a negative impact. Example responses can be seen
below:
• “It’s terrible and therefore impossible to use for the business side.”
• “Trains and buses not running regularly affects us a lot as if we can't get the customers without a car
to us then we lose their trade.”
• “It's too expensive and not reliable enough.”
• “We work with rural communities and people cannot always get to events.”
• “It is not easy to get people to us when the public transport leaves them with hour waits between
trains and buses.”
Respondents stated that the main benefit of locating their business in Pembrokeshire was that it is
where they live 31%; (224/731), that it is a tourist area 16%; (115/731), that there is a good quality of
life 15%; (112/731) and because it is a nice place to live 13%; (92/731).
Although 26% of respondents state that there are not any challenges for locating their business in
Pembrokeshire (188/731), 9% state that the main challenge is the remote or rural location (63/731) 10%
state the lack of population is a main challenge (74/731) and 10% state that the biggest problem of
locating their business in Pembrokeshire is that it is a seasonal / tourist area (70/731).
Pembrokeshire Business Survey 2012
©Copyright Wavehill Ltd 2012 Page | 47
15. Innovation Being innovative can increase competitiveness, reduce costs, make unit costs lower and increase profits.
In turn this can increase market share, release capital for investment purposes and reduce cash flow
restraints. For example computerisation has reduced the need for a low skilled workforce, reduced
management layers, and provided the network for the global economy.
Thirty-two per cent of respondents agreed that they had introduced new or significantly improved
products or services in the last 12 months. The range of new products and services are exampled below,
many of them relate to technological improvements:
• “We have introduced WiFi to the café for our customers to use.”
• “We are doing meals and promotions to bring people in and providing entertainment.”
• “Online booking systems.”
• “Free drinks from vending machine, cash vending machine, daily animal feeding round, indoor
playroom.”
• “Improved our website, got a new brochure and opened a Facebook page.”
Further to this, 12% of businesses diversified in the last 12 months (89/725). Examples of how
businesses diversified can be seen below:
• “We introduced a take away service.”
• “More into online marketing than originally planned.”
• “We have changed our clientele from coaching holidays to more upmarket customers.”
• “We have now added accommodation to the business.”
• “We're doing more evenings - open more evenings.”
Eleven per cent of respondents state that over the next two to three years they have plans to diversify
their business (81/727) and twenty per cent of respondents state they will look into introducing new or
significantly improved services (149/727).
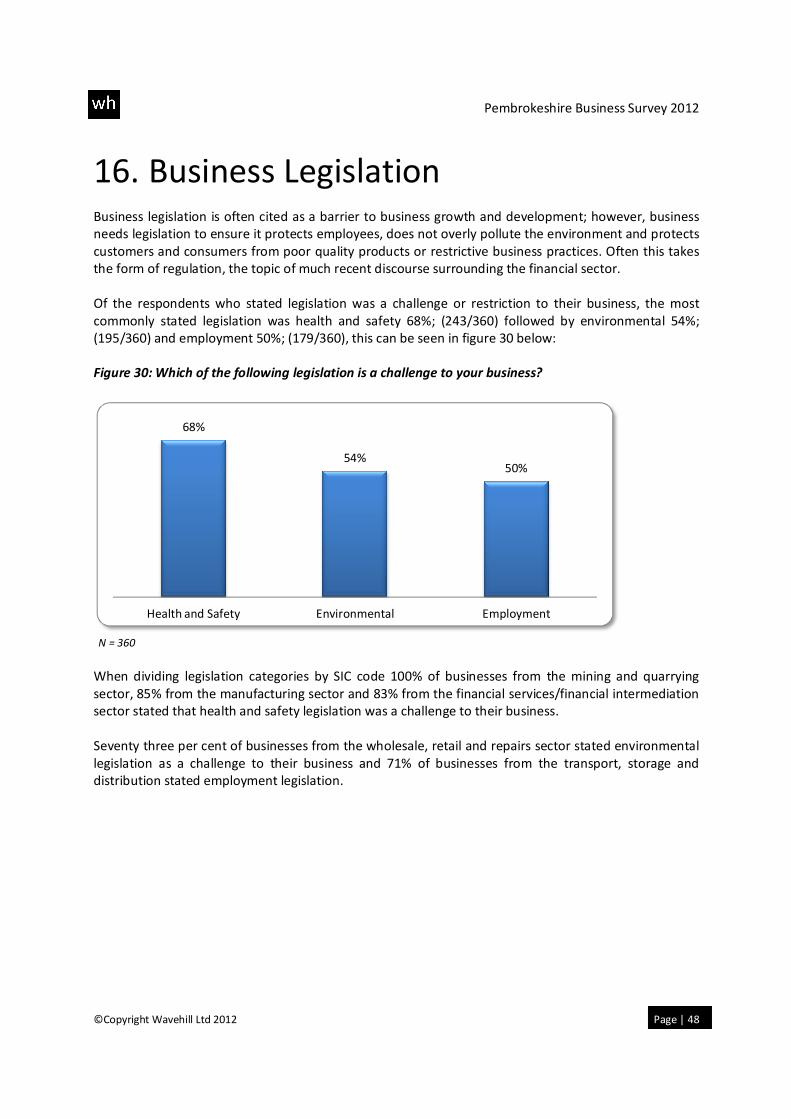
Pembrokeshire Business Survey 2012
©Copyright Wavehill Ltd 2012 Page | 48
16. Business Legislation Business legislation is often cited as a barrier to business growth and development; however, business
needs legislation to ensure it protects employees, does not overly pollute the environment and protects
customers and consumers from poor quality products or restrictive business practices. Often this takes
the form of regulation, the topic of much recent discourse surrounding the financial sector.
Of the respondents who stated legislation was a challenge or restriction to their business, the most
commonly stated legislation was health and safety 68%; (243/360) followed by environmental 54%;
(195/360) and employment 50%; (179/360), this can be seen in figure 30 below:
Figure 30: Which of the following legislation is a challenge to your business?
N = 360
When dividing legislation categories by SIC code 100% of businesses from the mining and quarrying
sector, 85% from the manufacturing sector and 83% from the financial services/financial intermediation
sector stated that health and safety legislation was a challenge to their business.
Seventy three per cent of businesses from the wholesale, retail and repairs sector stated environmental
legislation as a challenge to their business and 71% of businesses from the transport, storage and
distribution stated employment legislation.
68%
54%50%
Health and Safety Environmental Employment
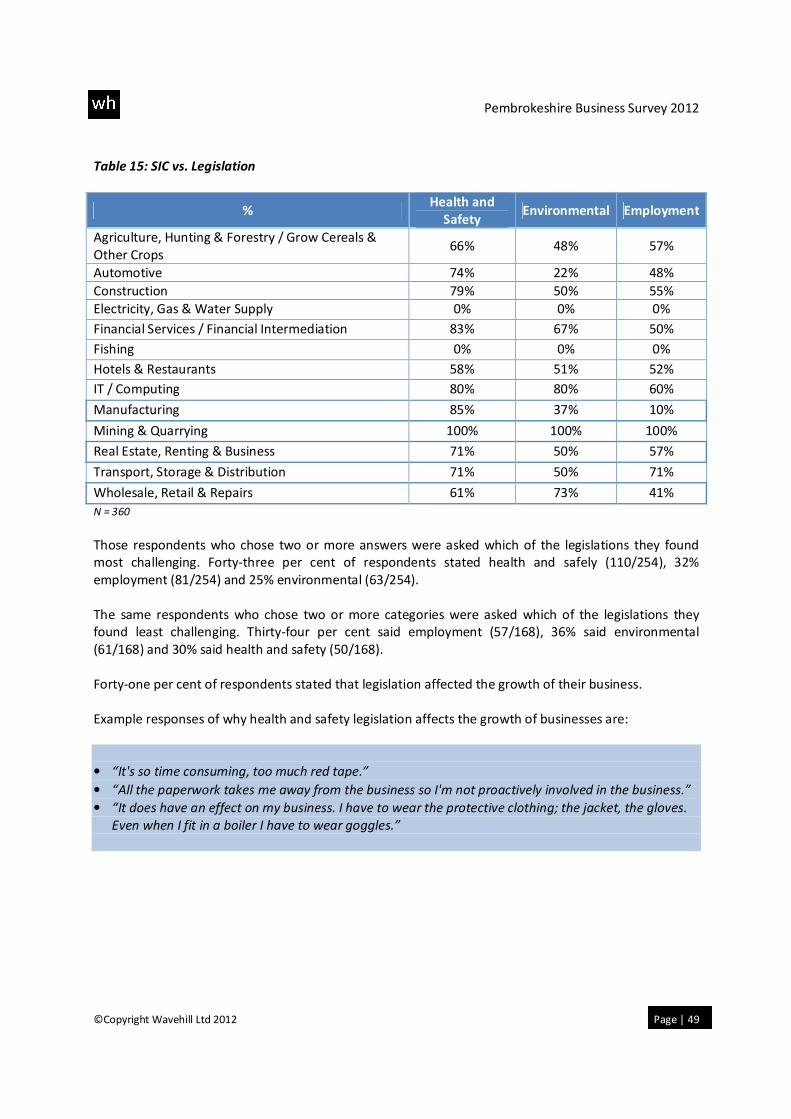
Pembrokeshire Business Survey 2012
©Copyright Wavehill Ltd 2012 Page | 49
Table 15: SIC vs. Legislation
% Health and
Safety Environmental Employment
Agriculture, Hunting & Forestry / Grow Cereals &
Other Crops 66% 48% 57%
Automotive 74% 22% 48%
Construction 79% 50% 55%
Electricity, Gas & Water Supply 0% 0% 0%
Financial Services / Financial Intermediation 83% 67% 50%
Fishing 0% 0% 0%
Hotels & Restaurants 58% 51% 52%
IT / Computing 80% 80% 60%
Manufacturing 85% 37% 10%
Mining & Quarrying 100% 100% 100%
Real Estate, Renting & Business 71% 50% 57%
Transport, Storage & Distribution 71% 50% 71%
Wholesale, Retail & Repairs 61% 73% 41%
N = 360
Those respondents who chose two or more answers were asked which of the legislations they found
most challenging. Forty-three per cent of respondents stated health and safely (110/254), 32%
employment (81/254) and 25% environmental (63/254).
The same respondents who chose two or more categories were asked which of the legislations they
found least challenging. Thirty-four per cent said employment (57/168), 36% said environmental
(61/168) and 30% said health and safety (50/168).
Forty-one per cent of respondents stated that legislation affected the growth of their business.
Example responses of why health and safety legislation affects the growth of businesses are:
• “It's so time consuming, too much red tape.”
• “All the paperwork takes me away from the business so I'm not proactively involved in the business.”
• “It does have an effect on my business. I have to wear the protective clothing; the jacket, the gloves.
Even when I fit in a boiler I have to wear goggles.”
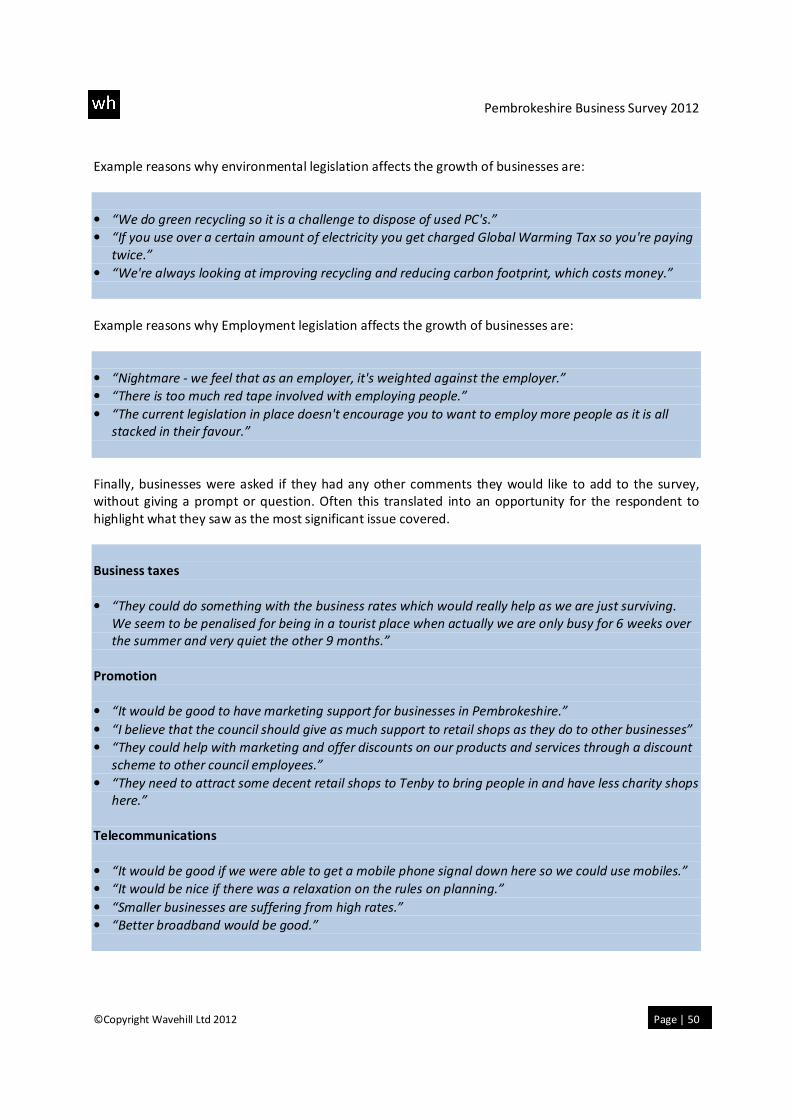
Pembrokeshire Business Survey 2012
©Copyright Wavehill Ltd 2012 Page | 50
Example reasons why environmental legislation affects the growth of businesses are:
• “We do green recycling so it is a challenge to dispose of used PC's.”
• “If you use over a certain amount of electricity you get charged Global Warming Tax so you're paying
twice.”
• “We're always looking at improving recycling and reducing carbon footprint, which costs money.”
Example reasons why Employment legislation affects the growth of businesses are:
• “Nightmare - we feel that as an employer, it's weighted against the employer.”
• “There is too much red tape involved with employing people.”
• “The current legislation in place doesn't encourage you to want to employ more people as it is all
stacked in their favour.”
Finally, businesses were asked if they had any other comments they would like to add to the survey,
without giving a prompt or question. Often this translated into an opportunity for the respondent to
highlight what they saw as the most significant issue covered.
Business taxes
• “They could do something with the business rates which would really help as we are just surviving.
We seem to be penalised for being in a tourist place when actually we are only busy for 6 weeks over
the summer and very quiet the other 9 months.”
Promotion
• “It would be good to have marketing support for businesses in Pembrokeshire.”
• “I believe that the council should give as much support to retail shops as they do to other businesses”
• “They could help with marketing and offer discounts on our products and services through a discount
scheme to other council employees.”
• “They need to attract some decent retail shops to Tenby to bring people in and have less charity shops
here.”
Telecommunications
• “It would be good if we were able to get a mobile phone signal down here so we could use mobiles.”
• “It would be nice if there was a relaxation on the rules on planning.”
• “Smaller businesses are suffering from high rates.”
• “Better broadband would be good.”
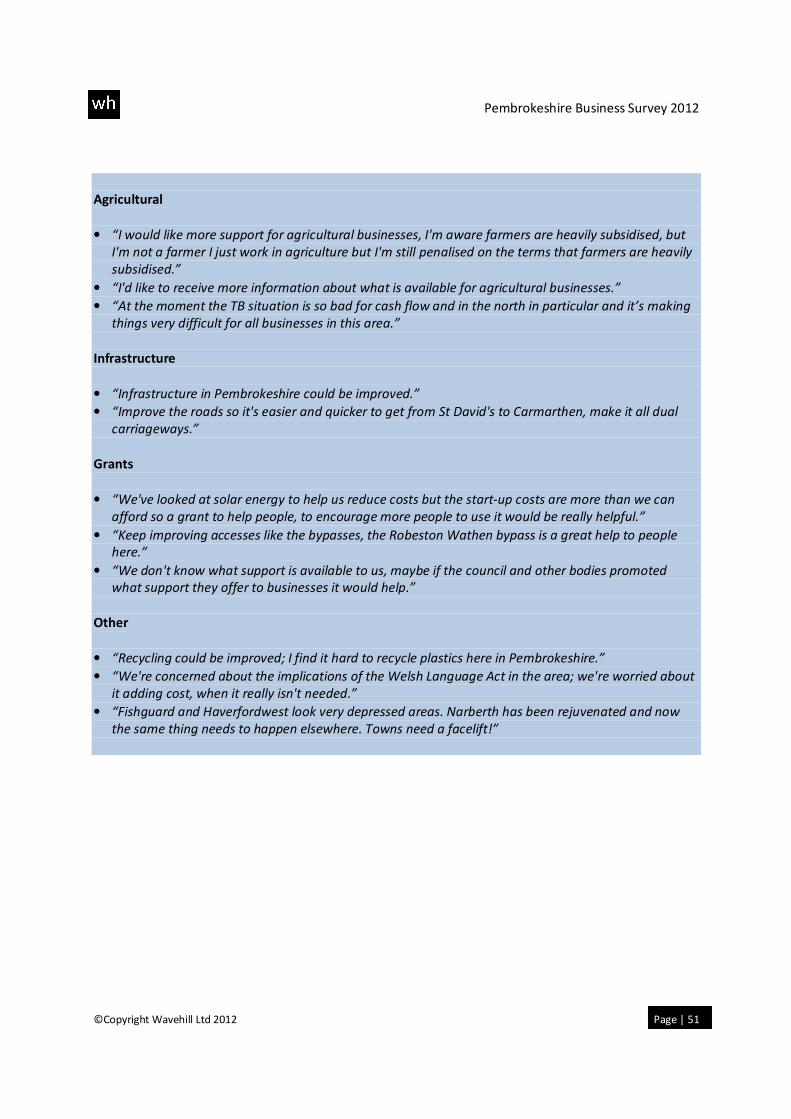
Pembrokeshire Business Survey 2012
©Copyright Wavehill Ltd 2012 Page | 51
Agricultural
• “I would like more support for agricultural businesses, I'm aware farmers are heavily subsidised, but
I'm not a farmer I just work in agriculture but I'm still penalised on the terms that farmers are heavily
subsidised.”
• “I'd like to receive more information about what is available for agricultural businesses.”
• “At the moment the TB situation is so bad for cash flow and in the north in particular and it’s making
things very difficult for all businesses in this area.”
Infrastructure
• “Infrastructure in Pembrokeshire could be improved.”
• “Improve the roads so it's easier and quicker to get from St David's to Carmarthen, make it all dual
carriageways.”
Grants
• “We've looked at solar energy to help us reduce costs but the start-up costs are more than we can
afford so a grant to help people, to encourage more people to use it would be really helpful.”
• “Keep improving accesses like the bypasses, the Robeston Wathen bypass is a great help to people
here.”
• “We don't know what support is available to us, maybe if the council and other bodies promoted
what support they offer to businesses it would help.”
Other
• “Recycling could be improved; I find it hard to recycle plastics here in Pembrokeshire.”
• “We're concerned about the implications of the Welsh Language Act in the area; we're worried about
it adding cost, when it really isn't needed.”
• “Fishguard and Haverfordwest look very depressed areas. Narberth has been rejuvenated and now
the same thing needs to happen elsewhere. Towns need a facelift!”
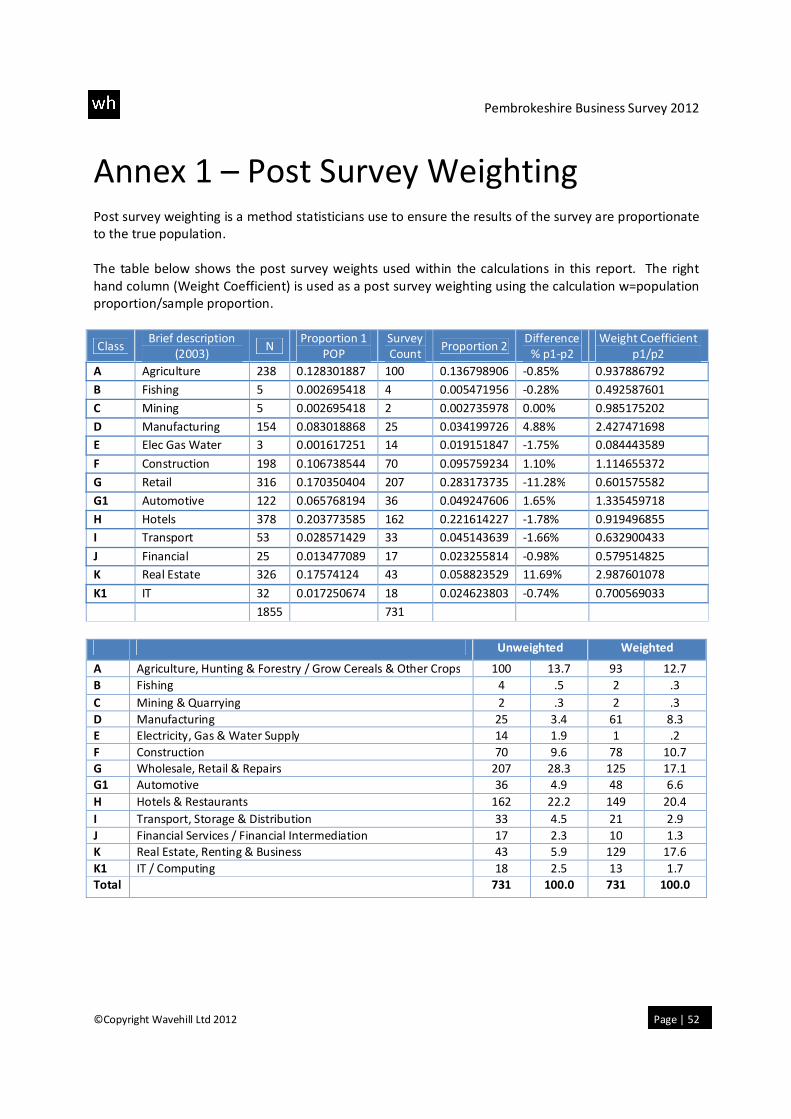
Pembrokeshire Business Survey 2012
©Copyright Wavehill Ltd 2012 Page | 52
Annex 1 – Post Survey Weighting Post survey weighting is a method statisticians use to ensure the results of the survey are proportionate
to the true population.
The table below shows the post survey weights used within the calculations in this report. The right
hand column (Weight Coefficient) is used as a post survey weighting using the calculation w=population
proportion/sample proportion.
Class Brief description
(2003) N
Proportion 1
POP
Survey
Count Proportion 2
Difference
% p1-p2
Weight Coefficient
p1/p2
A Agriculture 238 0.128301887 100 0.136798906 -0.85% 0.937886792
B Fishing 5 0.002695418 4 0.005471956 -0.28% 0.492587601
C Mining 5 0.002695418 2 0.002735978 0.00% 0.985175202
D Manufacturing 154 0.083018868 25 0.034199726 4.88% 2.427471698
E Elec Gas Water 3 0.001617251 14 0.019151847 -1.75% 0.084443589
F Construction 198 0.106738544 70 0.095759234 1.10% 1.114655372
G Retail 316 0.170350404 207 0.283173735 -11.28% 0.601575582
G1 Automotive 122 0.065768194 36 0.049247606 1.65% 1.335459718
H Hotels 378 0.203773585 162 0.221614227 -1.78% 0.919496855
I Transport 53 0.028571429 33 0.045143639 -1.66% 0.632900433
J Financial 25 0.013477089 17 0.023255814 -0.98% 0.579514825
K Real Estate 326 0.17574124 43 0.058823529 11.69% 2.987601078
K1 IT 32 0.017250674 18 0.024623803 -0.74% 0.700569033
1855 731
Unweighted Weighted
A Agriculture, Hunting & Forestry / Grow Cereals & Other Crops 100 13.7 93 12.7
B Fishing 4 .5 2 .3
C Mining & Quarrying 2 .3 2 .3
D Manufacturing 25 3.4 61 8.3
E Electricity, Gas & Water Supply 14 1.9 1 .2
F Construction 70 9.6 78 10.7
G Wholesale, Retail & Repairs 207 28.3 125 17.1
G1 Automotive 36 4.9 48 6.6
H Hotels & Restaurants 162 22.2 149 20.4
I Transport, Storage & Distribution 33 4.5 21 2.9
J Financial Services / Financial Intermediation 17 2.3 10 1.3
K Real Estate, Renting & Business 43 5.9 129 17.6
K1 IT / Computing 18 2.5 13 1.7
Total 731 100.0 731 100.0