progress towards low vacuum critical dimension metrology
TRANSCRIPT
cnse.albany.edu
Progress towards Low Vacuum Critical Dimension Metrology
Brad Thiel & Vaso Tileli
College of Nanoscale Science & Engineering University at Albany
State University of New York
Frontiers of CharacterizationMay 14th, 2009 – Albany, NY
cnse.albany.edu
Acknowledgements
Thanks to:– Dr. Milos Toth, FEI Co.– Mr. W. Ralph Knowles, FEI Co.– Dr. András Vladár, NIST– Dr. Michael Postek, NIST
Funding from:
cnse.albany.edu
Outline
• Introduction– Critical Dimension Metrology (CD SEM)– Necessity for Modeling
• Low Vacuum CD Metrology Approach– Charge Control– Contamination Control
• Principles of Low Vacuum SEM
• Analytical Modeling of Amplification and Noise Characteristics– ESD (Environmental Secondary Electron Detector)– Helix (Magnetic Immersion Lens Detector)
• Summary & Pending Work
cnse.albany.edu
• Scanning electron microscope methods are some of the most prevalent technologies for critical dimension (CD) measurement.
– High resolution imaging (spatial res. ~1nm, measurement res. ~1nm)– Acceptable throughput and speed (typically 1 wafer per ~5min, 17 points on wafer)– Site specific measurements– Well-established procedures for interpreting the results
• CD’s are rapidly approaching the limitations of conventional CD-SEM imposed by:
– Charging– Contamination– Specimen interaction volume– Secondary electron mean-free-path
• Low Vacuum SEM technology can address charging and contaminationwithout sacrificing performance
Critical Dimension (CD) Metrology
cnse.albany.edu
CD-SEM Measurement Process
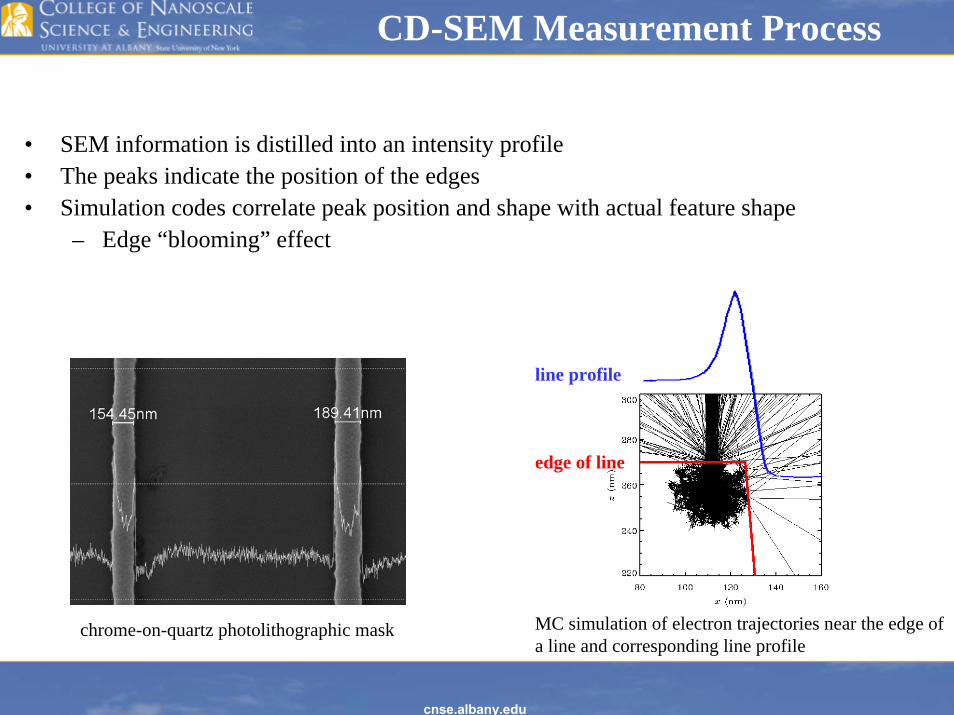
• SEM information is distilled into an intensity profile• The peaks indicate the position of the edges• Simulation codes correlate peak position and shape with actual feature shape
– Edge “blooming” effect
chrome-on-quartz photolithographic mask MC simulation of electron trajectories near the edge of a line and corresponding line profile
edge of line
line profile
cnse.albany.edu
Edge Assignment Problem
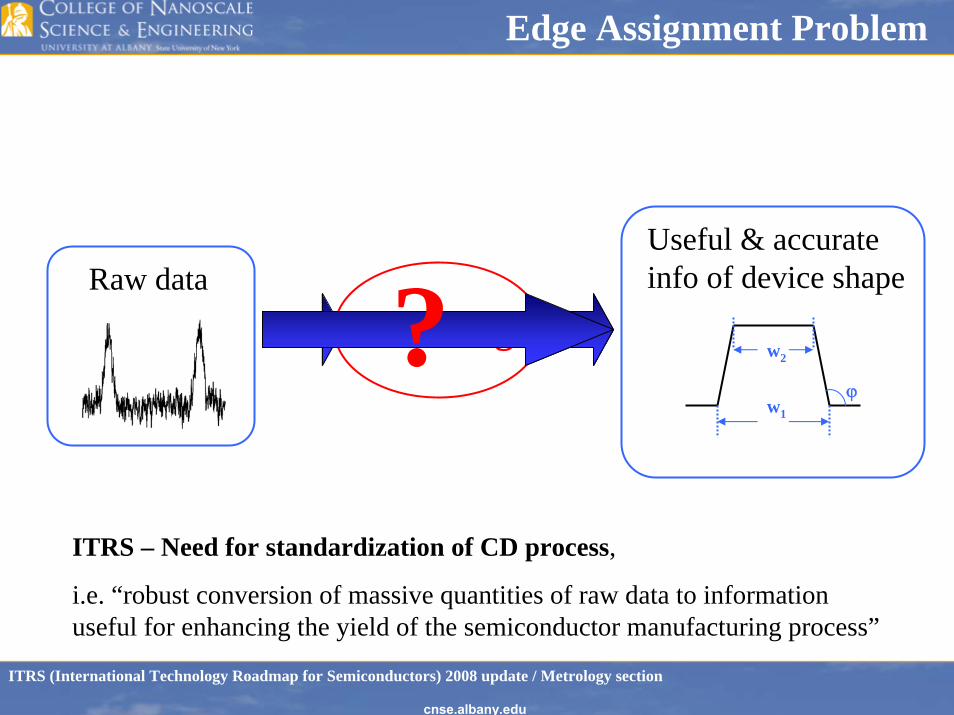
Raw dataUseful & accurate info of device shape
w1
w2
ϕ
Modeling?ITRS – Need for standardization of CD process,
i.e. “robust conversion of massive quantities of raw data to information useful for enhancing the yield of the semiconductor manufacturing process”
ITRS (International Technology Roadmap for Semiconductors) 2008 update / Metrology section
cnse.albany.edu
Fit to poly-Si
line
Modeling for Accuracy: MONSEL
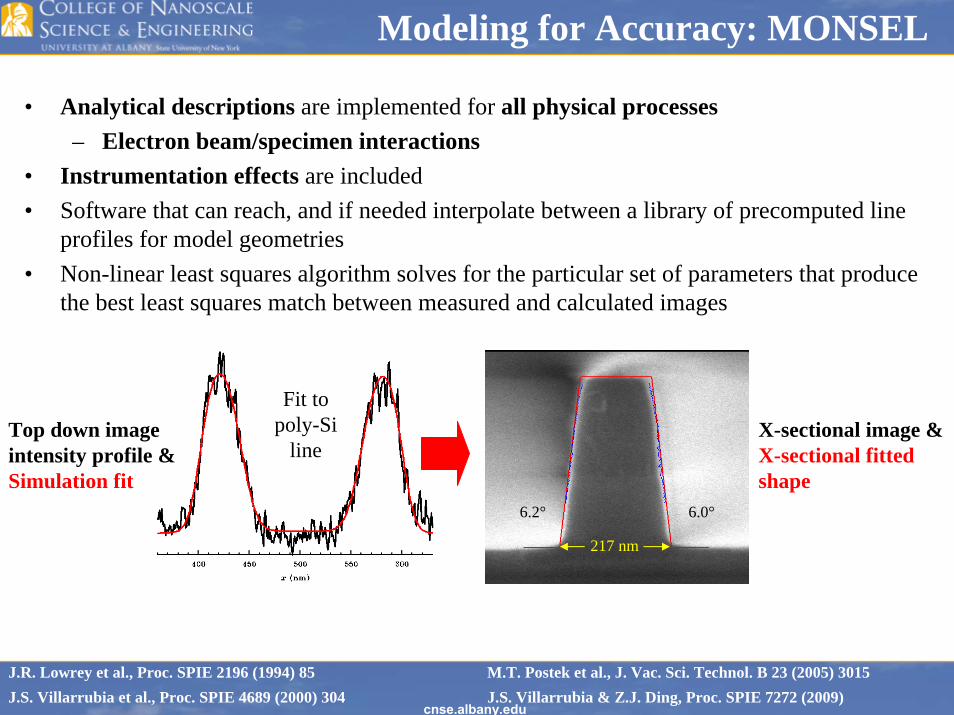
• Analytical descriptions are implemented for all physical processes– Electron beam/specimen interactions
• Instrumentation effects are included• Software that can reach, and if needed interpolate between a library of precomputed line
profiles for model geometries• Non-linear least squares algorithm solves for the particular set of parameters that produce
the best least squares match between measured and calculated images
217 nm
6.2° 6.0°
J.R. Lowrey et al., Proc. SPIE 2196 (1994) 85 M.T. Postek et al., J. Vac. Sci. Technol. B 23 (2005) 3015J.S. Villarrubia et al., Proc. SPIE 4689 (2000) 304 J.S. Villarrubia & Z.J. Ding, Proc. SPIE 7272 (2009)
Top down image intensity profile &Simulation fit
X-sectional image &X-sectional fittedshape
cnse.albany.edu
The Problem with Low Voltage CD SEM
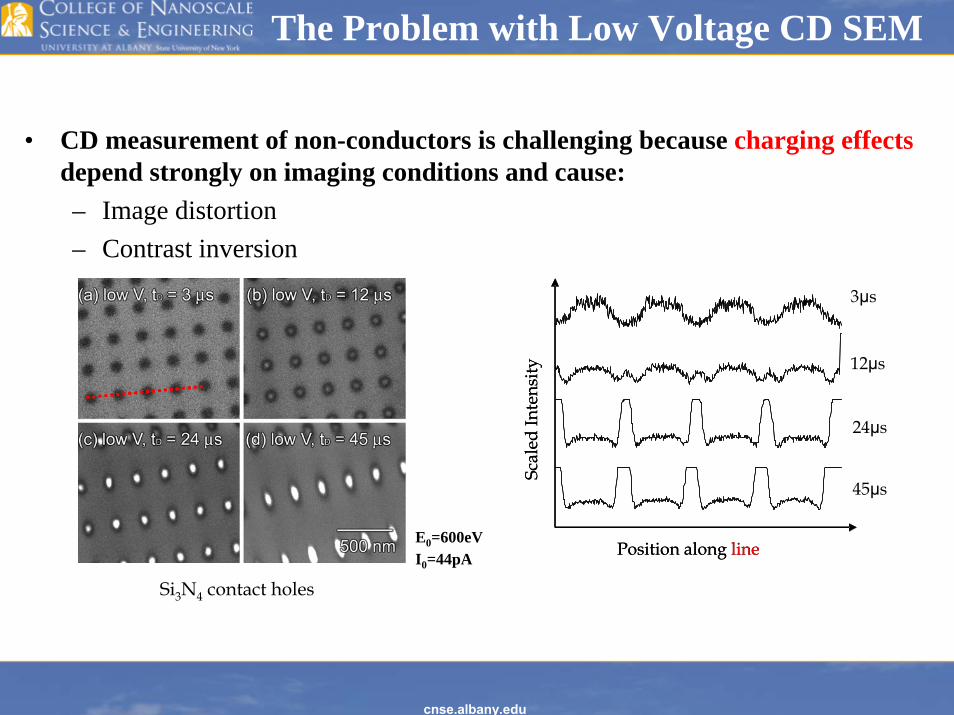
• CD measurement of non-conductors is challenging because charging effectsdepend strongly on imaging conditions and cause:– Image distortion– Contrast inversion
E0=600eVI0=44pA Position along line
Scal
ed In
tens
ity
3μs
45μs
Position along lineSc
aled
Inte
nsity 12μs
24μs
Si3N4 contact holes
cnse.albany.edu
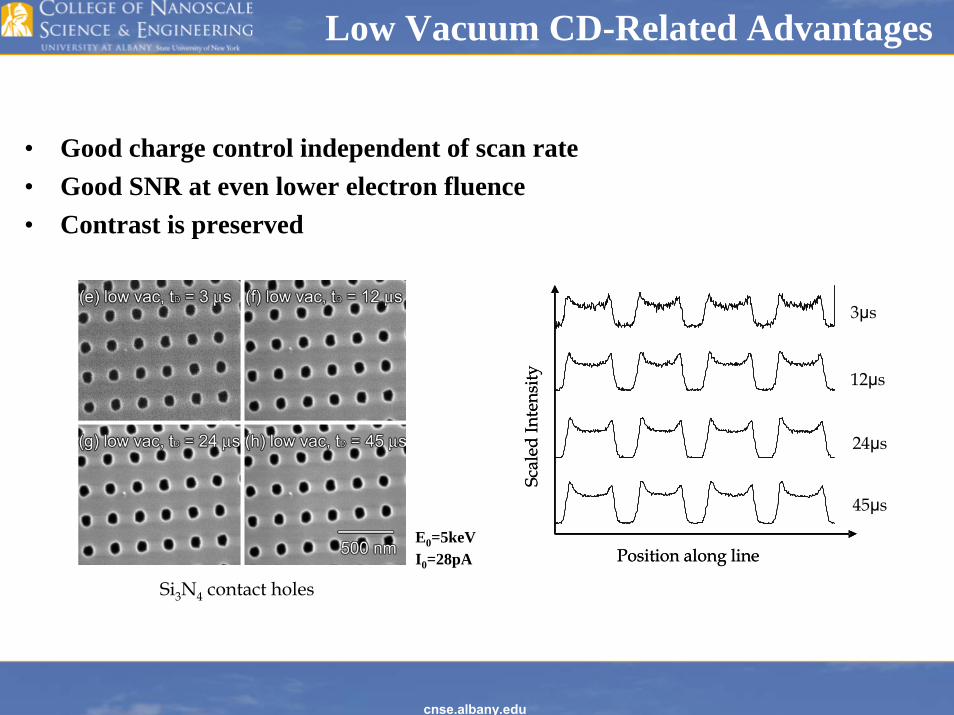
Low Vacuum CD-Related Advantages
• Good charge control independent of scan rate• Good SNR at even lower electron fluence• Contrast is preserved
E0=5keVI0=28pA
3μs
45μs
12μs
24μs
Position along lineSc
aled
Inte
nsity
Position along lineSc
aled
Inte
nsity
Si3N4 contact holes

cnse.albany.edu
• High resolution imaging with existing electron optics
M. Toth et al., Appl. Phys. Lett. 88 (2006) 023105
(a) & (b) chrome-on-quartz photolithographic mask(c) contact hole in Si3N4
(d) electrostatic discharge pit in SiO2
Low Vacuum CD-Related Advantages

cnse.albany.edu
• Hydrocarbon contamination is reduced
M.T. Postek et al., J. Microlith. Microfab. Microsyst. 3 (2004) 224
3min e-beam irradiation (a) no contamination square(b) shrinkage of the residue
500nm 500nm200nm
Low Vacuum CD-Related Advantages
cnse.albany.edu
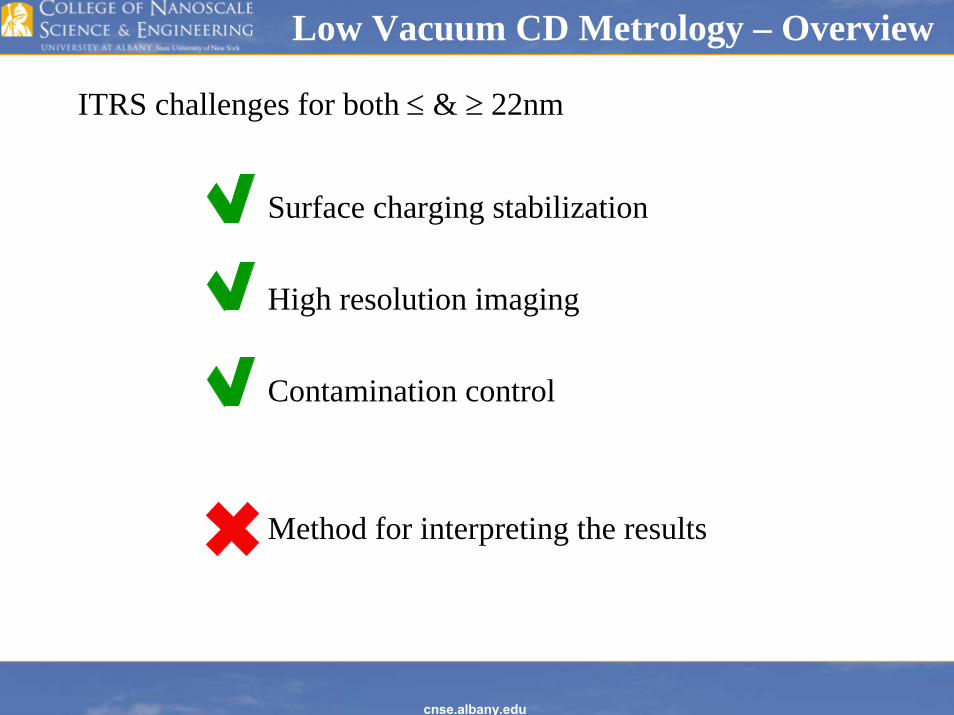
Low Vacuum CD Metrology – Overview
• Surface charging stabilization
• High resolution imaging
• Contamination control
• Method for interpreting the results
ITRS challenges for both ≤ & ≥ 22nm
cnse.albany.edu
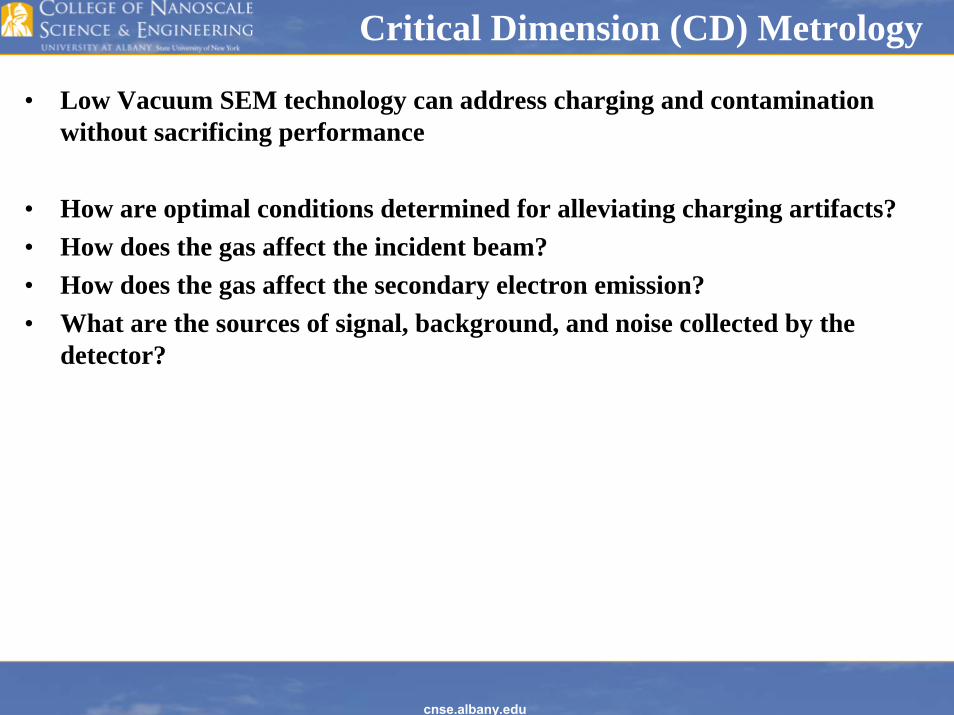
• Low Vacuum SEM technology can address charging and contaminationwithout sacrificing performance
• How are optimal conditions determined for alleviating charging artifacts?• How does the gas affect the incident beam?• How does the gas affect the secondary electron emission?• What are the sources of signal, background, and noise collected by the
detector?
Critical Dimension (CD) Metrology

cnse.albany.edu
Low Vacuum SEM
cnse.albany.edu
RP DP
IP
RP
RP DP
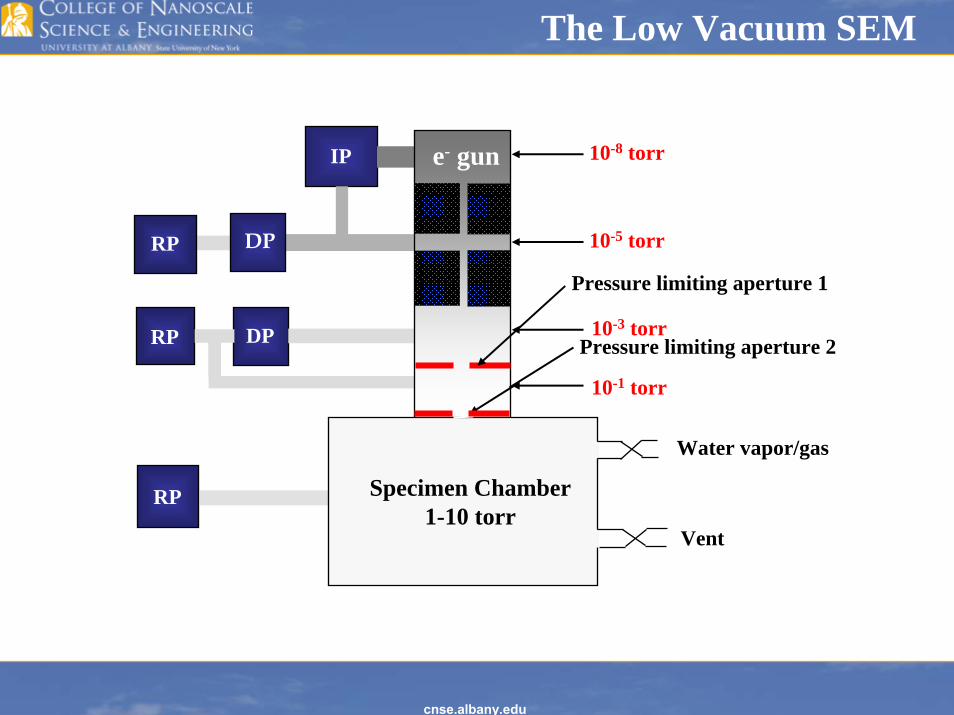
The Low Vacuum SEM
Specimen Chamber1-10 torr
e- gun
Pressure limiting aperture 1
Pressure limiting aperture 2
Water vapor/gas
Vent
10-8 torr
10-5 torr
10-1 torr
10-3 torr

cnse.albany.edu
Scattering of the Primary Beam
• Collisions of primary beam electrons with gas molecules result in a low current density “skirt” of scattered electrons surrounding the central beam
– It can extend over several hundred micrometers
– It does not degrade resolution– It contributes to the background
• The unscattered fraction of the beam is given by:
Q(E): total scattering cross-section, P : gas pressure, l : gas path length, R : gas constant, T : temperature
D.A. Moncrieff et al., J. Phys. D 12 (1979) 481 B.L. Thiel, Ultramicroscopy 99 (2004) 35
⎟⎠⎞
⎜⎝⎛−=
RTPlEQf )(exp
+ Va
low vacuumregion
high vacuumregion

cnse.albany.edu
Mean free path of Electrons in H2O Vapor
~2~2--5mm5mm
0
20
40
60
80
100
120
140
160
180
200
0 5 10 15 20 25 30Electron Energy (keV)
Mea
n-fr
ee-p
ath
(mm
)
10 Pa100 Pa1000 PaLikely Low Vac
CD-SEM range

cnse.albany.edu
Gas Cascade Amplification
– Signal • Normally amplified SEs (gain
~103)
– Noise• SEs amplification is a
stochastic process
– Background• Inevitable multiplication of
BSEs and PEs
• The amplification of the emitted secondary electron (SE) signal takes place inside the chamber by ionizing collisions of the SEs with gas molecules
• A variety of electrodes and pole-pieces integrated into the final lens are used to create the electromagnetic field which drives the amplification cascade.
+ Va
low vacuumregion
high vacuumregion

cnse.albany.edu
Role of Ions
++
++++++
++++++++++
++ ++++
++
++
• Collisions of all emissions with gas molecules create positive gaseous ions
• Ions flow to regions of the specimen surface with a negative potential
• Ions recombine at surface, removing excess electronic charge
+ Va
low vacuumregion
cnse.albany.edu
Low Vacuum SEM: Challenges
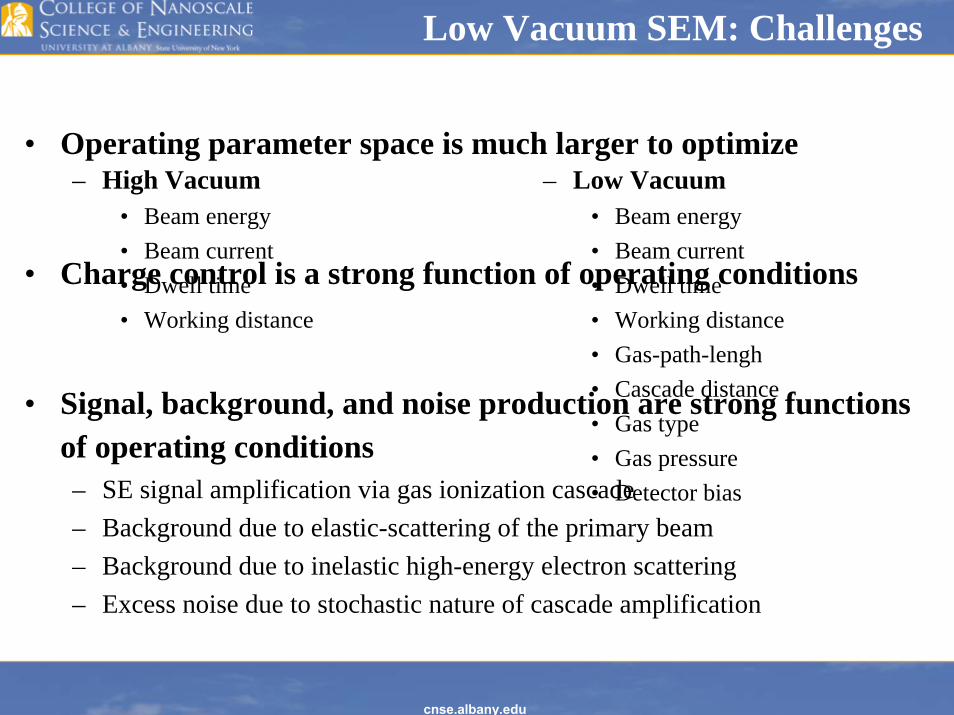
• Operating parameter space is much larger to optimize
• Charge control is a strong function of operating conditions
• Signal, background, and noise production are strong functions of operating conditions– SE signal amplification via gas ionization cascade– Background due to elastic-scattering of the primary beam– Background due to inelastic high-energy electron scattering– Excess noise due to stochastic nature of cascade amplification
– High Vacuum• Beam energy• Beam current• Dwell time• Working distance
– Low Vacuum• Beam energy• Beam current• Dwell time• Working distance• Gas-path-lengh• Cascade distance• Gas type• Gas pressure• Detector bias

cnse.albany.edu
Cascade Amplification in a Constant Field
cnse.albany.edu
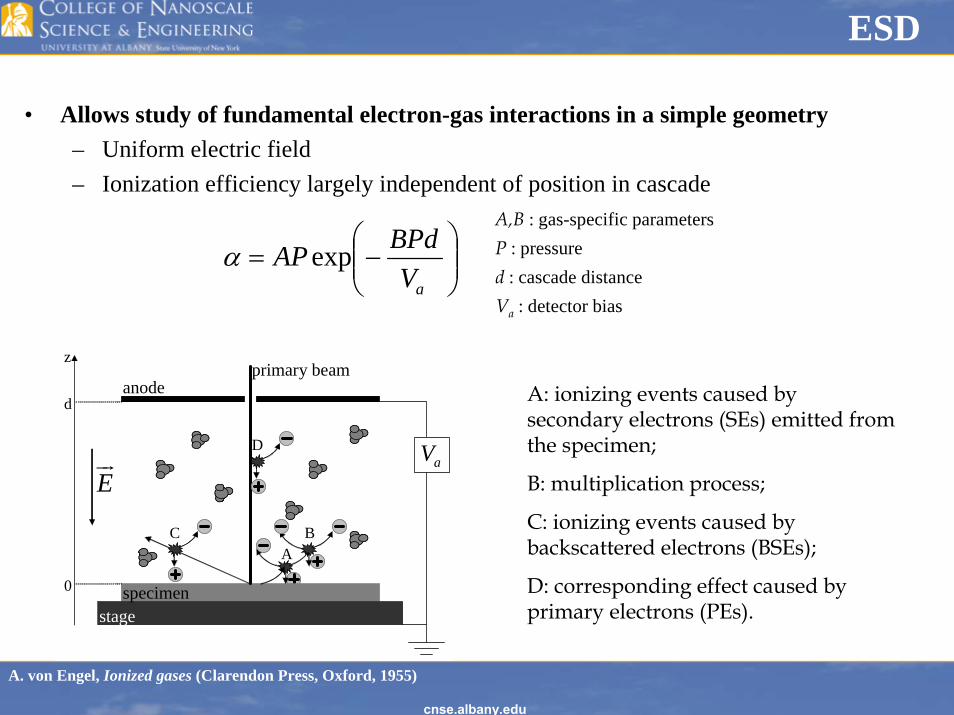
ESD
0
d
z
specimenstage
anode
Eur
primary beam
aV
ABC
D
0
d
z
specimenstage
anode
Eur
primary beam
aV
ABC
D
A: ionizing events caused by secondary electrons (SEs) emitted from the specimen;
B: multiplication process;
C: ionizing events caused by backscattered electrons (BSEs);
D: corresponding effect caused by primary electrons (PEs).
• Allows study of fundamental electron-gas interactions in a simple geometry– Uniform electric field– Ionization efficiency largely independent of position in cascade
⎟⎟⎠
⎞⎜⎜⎝
⎛−=
aVBPdAPexpα
A,B : gas-specific parametersP : pressured : cascade distanceVa : detector bias
A. von Engel, Ionized gases (Clarendon Press, Oxford, 1955)
cnse.albany.edu
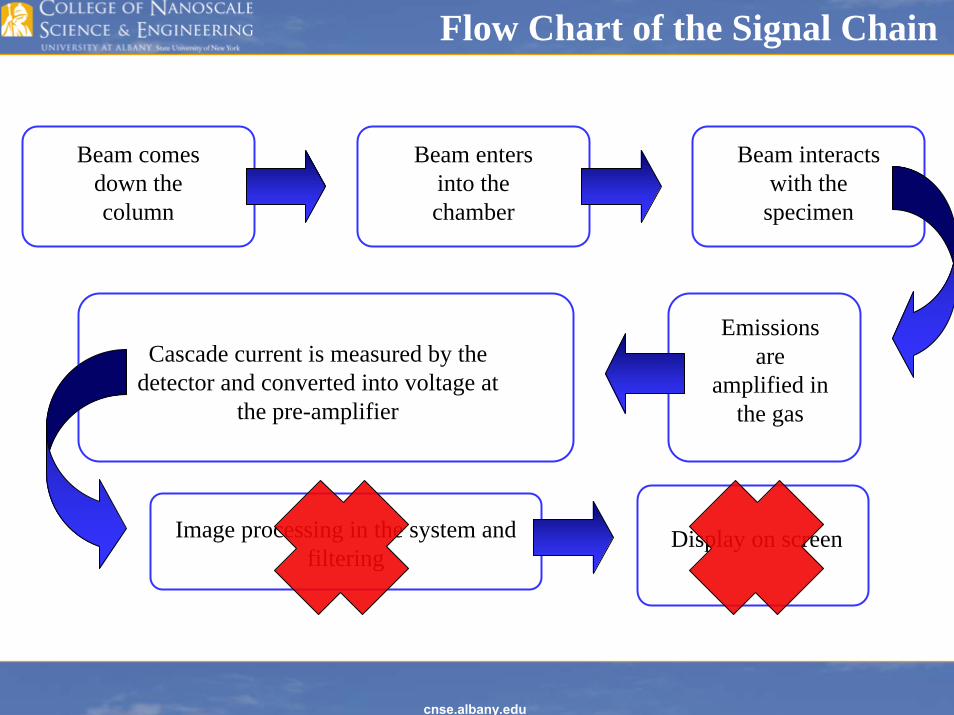
Flow Chart of the Signal Chain
Beam comes down the column
Beam enters into the chamber
Beam interacts with the
specimen
Emissions are
amplified in the gas
Cascade current is measured by the detector and converted into voltage at
the pre-amplifier
Image processing in the system and filtering
Display on screen
cnse.albany.edu
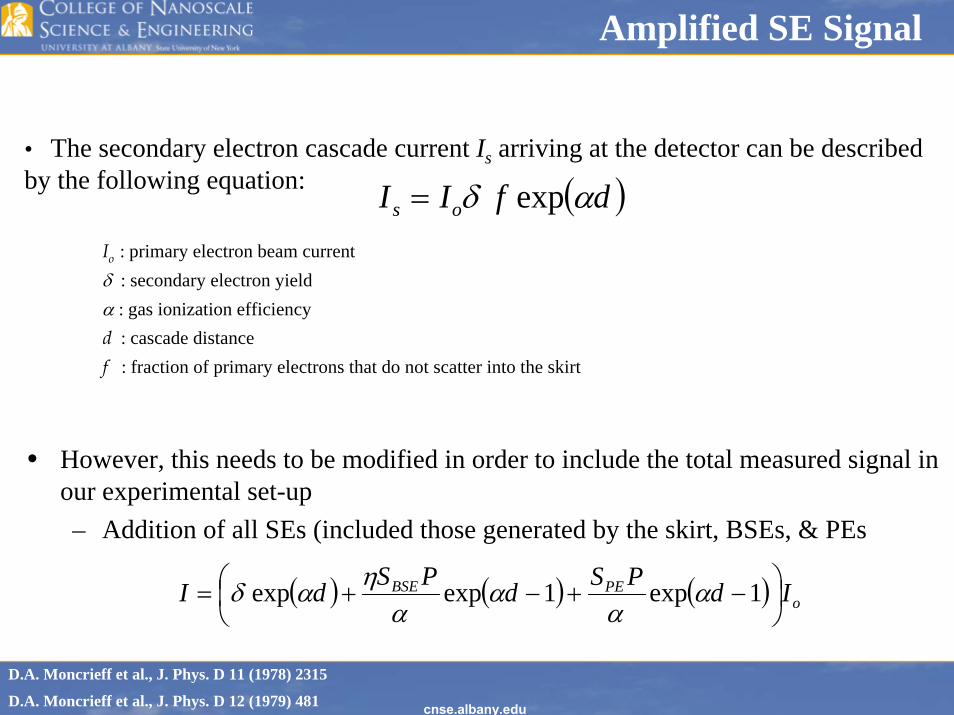
Amplified SE Signal
• The secondary electron cascade current Is arriving at the detector can be described by the following equation:
Io : primary electron beam currentδ : secondary electron yieldα : gas ionization efficiencyd : cascade distancef : fraction of primary electrons that do not scatter into the skirt
• However, this needs to be modified in order to include the total measured signal in our experimental set-up– Addition of all SEs (included those generated by the skirt, BSEs, & PEs
( )dfII os
D.A. Moncrieff et al., J. Phys. D 11 (1978) 2315
D.A. Moncrieff et al., J. Phys. D 12 (1979) 481
αδ exp =
( ) ( ) ( ) oPEBSE IdPSdPSdI ⎟
⎠⎞
⎜⎝⎛ −+−+= 1exp1expexp α
αα
αηαδ

cnse.albany.edu
Sources of Noise
• Beam or shot noise: Arising from Poisson distribution of emission of e-.
• Gas cascade noise:: Arising from the formation of plasma in the chamber.
– Contribution to noise from:• Secondary Electrons (SEs)• Primary Electrons (PEs)• Backscattered Electrons (BSEs)
• Amplifier or Johnson’s noise: Arising from thermal and electronic noise in the detection system.
beIN oBE 2=e : electron chargeIo: primary beam currentb : signal bandwidth
kTRbN AMP 4=k : Boltzmann’s constantT : temperatureR : resistor
W. Shockley and J. R. Pierce, Proc. IRE 26 (1938) 321 J. Johnson, Phys. Rev. 32 (1928) 97

cnse.albany.edu
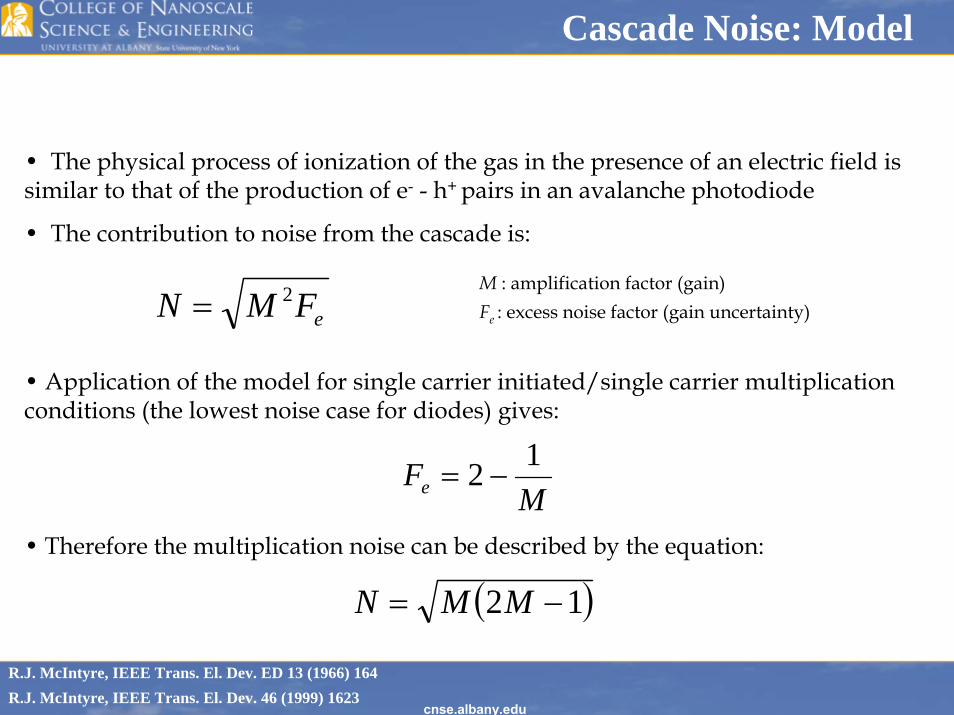
Cascade Noise: Model
eFMN 2=
• The physical process of ionization of the gas in the presence of an electric field is similar to that of the production of e- - h+ pairs in an avalanche photodiode
• The contribution to noise from the cascade is:
M : amplification factor (gain)Fe : excess noise factor (gain uncertainty)
R.J. McIntyre, IEEE Trans. El. Dev. ED 13 (1966) 164R.J. McIntyre, IEEE Trans. El. Dev. 46 (1999) 1623
0 500 1000 15000
100
200
300
3Torr
num
ber o
f ele
ctro
ns
gain0 500 1000 1500
0
100
200
300
num
ber o
f ele
ctro
ns
gain
3.5Torr
0 500 1000 15000
100
200
300
num
ber o
f ele
ctro
nsgain
4Torr
V. Tileli et al., “Excess noise factor of the gas ionization cascade calculated by statistical analysis of Monte Carlo gain distributions”, in preparationCascade Monte Carlo Software
cnse.albany.edu
Cascade Noise: Model
eFMN 2=
• The physical process of ionization of the gas in the presence of an electric field is similar to that of the production of e- - h+ pairs in an avalanche photodiode
• The contribution to noise from the cascade is:
M : amplification factor (gain)Fe : excess noise factor (gain uncertainty)
R.J. McIntyre, IEEE Trans. El. Dev. ED 13 (1966) 164R.J. McIntyre, IEEE Trans. El. Dev. 46 (1999) 1623
• Application of the model for single carrier initiated/single carrier multiplication conditions (the lowest noise case for diodes) gives:
MFe
12 −=
• Therefore the multiplication noise can be described by the equation:
( )12 −= MMN

cnse.albany.edu
Cascade Contributions to Noise
• Secondary electrons
• Primary electrons
• Backscattered electrons
Io : primary beam current SPE & SBSE: PEs & BSEs ionization efficiencye : electron charge P : pressureb : bandwidth l : gas path lengthα: gas ionization efficiency d : cascade distanceδ: SE yield η : BSE yield
( ) ( )exp 1 exp 12 2 1PE o PE
d dN eI bS Pl
d dα αα α
− −⎛ ⎞⎛ ⎞= −⎜ ⎟⎜ ⎟
⎝ ⎠⎝ ⎠
( ) ( )exp 1 exp 12 2 1BSE o BSE
d dN eI b S Pl
d dα α
ηα α
− −⎛ ⎞⎛ ⎞= −⎜ ⎟⎜ ⎟
⎝ ⎠ ⎝ ⎠
V. Tileli et al., “Noise characteristics of the gas ionization cascade used in low vacuum scanning electron microscopy”, submitted to J. App. Phys.
( )( ) ( ) ( )( )1exp2exp12 −+= ddbeIN oSE ααδδ

cnse.albany.edu
Signal and Noise Contributions
• Total signal driven by the SE contribution• Total noise dominated by:
– Amplifier noise at low pressures– SE cascade component at high pressures
0 1 2 3 4
100
101
102
0 1 2 3 4
10-5
10-4
10-3
10-2
PE
SE
Total
Sig
nal (
nA)
Pressure (Torr)
BSE
NT NSE
NBSE
NPE
NDE
Noi
se (n
A/√
Hz)
Pressure (Torr)
NB
operating conditions: Eo=15keV, Io=300pA, Va=400V, d=5mm

cnse.albany.edu
Experimental Set-up
…..……………..
354.4anode
specimenstage
pre-amplifier
LCD monitor
DVM
spectrum analyzer
aV
…..……………..
354.4anode
specimenstage
pre-amplifier
LCD monitor
DVM
spectrum analyzer
aV
• SEM data– FEI Nova NanoSEM
• Signal data– Digital volt meter (DVM)
connected to the output of the pre-amplifier
• Noise data– Agilent E4401B Spectrum
Analyzer connected to the output of the pre-amplifier
• Noise marker function

cnse.albany.edu
• Total signal increases as the primary beam energy is lowered
• The pressure at which maximum gain occurs is proportional to the electric field strength
• Maximum gain is an exponential function of the anode bias
• Total signal is proportional to the incident current
0 1 2 3 40
10
20
30
40
0 1 2 3 40
2
4
6
15keV
30keV
Pressure (Torr)
Tota
l Sig
nal (
nA)
Tota
l Noi
se (p
A/√
Hz)
15keV Model 30keV Model
Pressure (Torr)0 1 2 3 4
0
10
20
30
40
0 1 2 3 40
2
4
6
Pressure (Torr)To
tal S
igna
l (nA
)
7mm Model 5mm Model 3mm Model
Tot
al N
oise
(pA
/√H
z)
7mm5mm
Pressure (Torr)
3mm
anode/specimen separation dbeam energy Eo
0 1 2 3 40
20
40
60
80
Signal and Noise
0 1 2 3 40
2
4
6
8
10
12
Tota
l Sig
nal (
nA)
Pressure (Torr)
450V Model 400V Model 350V Model 300V Model
Tot
al N
oise
(pA
/√H
z)
400V
Pressure (Torr)
300V
350V
450V
0 1 2 3 40
20
40
60
80
100
120
140
0 1 2 3 40
2
4
6
8
10
12
Pressure (Torr)
Tota
l Sig
nal (
nA)
406pA Model 100pA Model 27pA Model
Tota
l Noi
se (p
A/√
Hz)
406pA
100pA
Pressure (Torr)
27pA
beam current Io
V. Tileli et al., “Noise characteristics of the gas ionization cascade used in low vacuum scanning electron microscopy”, submitted to J. App. Phys.
detector bias Va
cnse.albany.edu
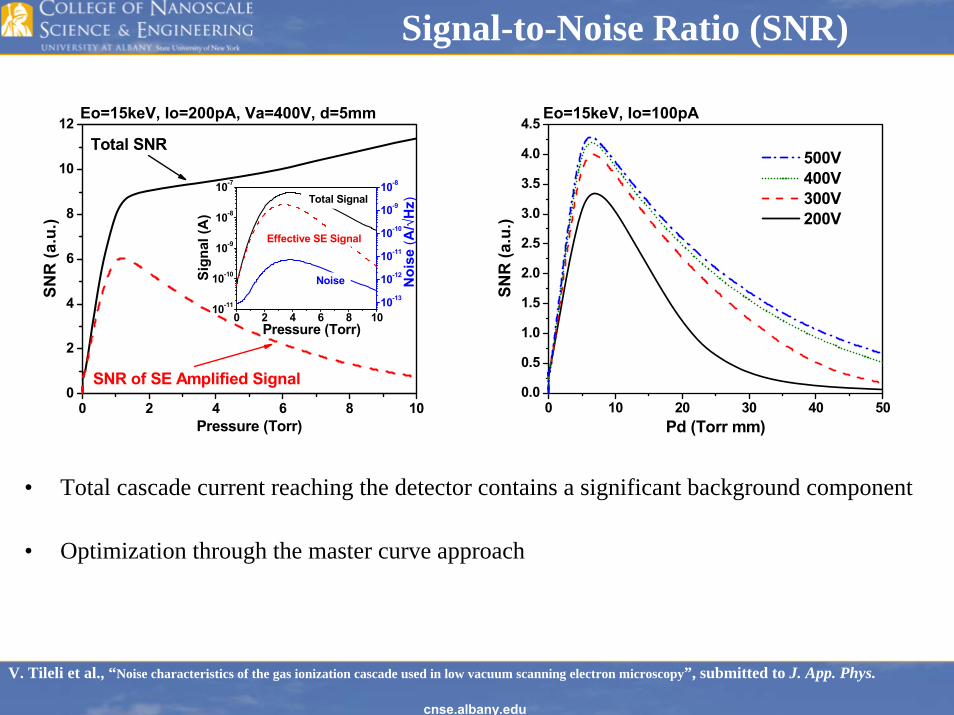
Signal-to-Noise Ratio (SNR)
• Total cascade current reaching the detector contains a significant background component
• Optimization through the master curve approach
0 2 4 6 8 100
2
4
6
8
10
12
0 2 4 6 8 1010-11
10-10
10-9
10-8
10-7
10-13
10-12
10-11
10-10
10-9
10-8
SNR of SE Amplified Signal
Total SNR
SNR
(a.u
.)
Pressure (Torr)
Sign
al (A
)
Pressure (Torr)
Noise
Effective SE Signal
Noi
se (A
/√H
z)
Total Signal
0 10 20 30 40 500.0
0.5
1.0
1.5
2.0
2.5
3.0
3.5
4.0
4.5
SNR
(a.u
.)
Pd (Torr mm)
500V 400V 300V 200V
Eo=15keV, Io=200pA, Va=400V, d=5mm Eo=15keV, Io=100pA
V. Tileli et al., “Noise characteristics of the gas ionization cascade used in low vacuum scanning electron microscopy”, submitted to J. App. Phys.

cnse.albany.edu
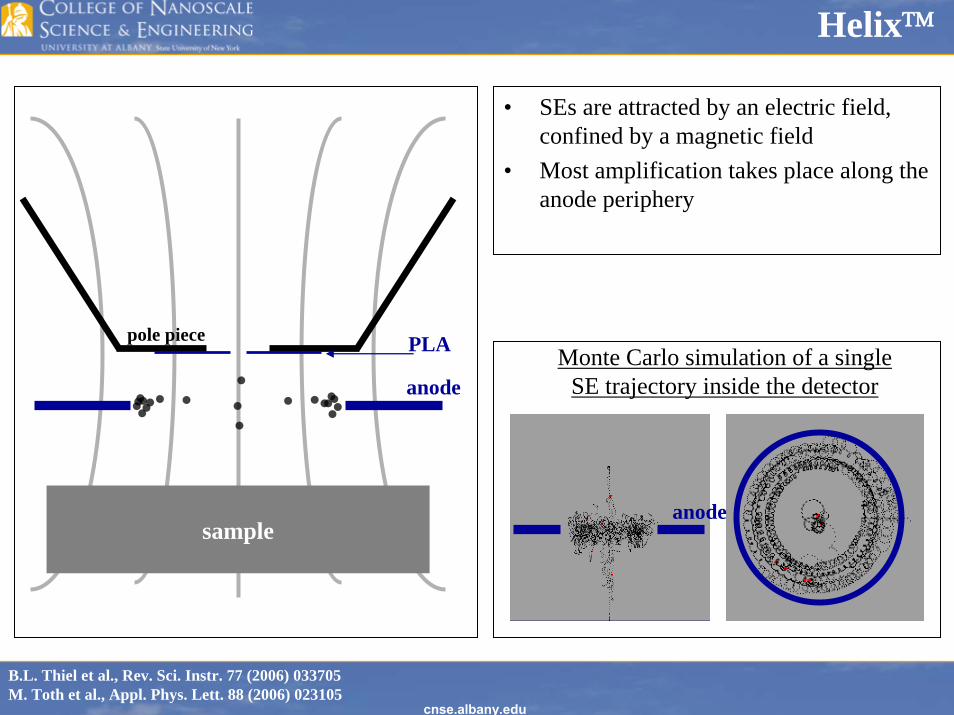
Low Vacuum Immersion Lens Detector – Helix™
cnse.albany.edu
Helix™
sample
pole piece PLA
anode
anode
Monte Carlo simulation of a single SE trajectory inside the detector
• SEs are attracted by an electric field, confined by a magnetic field
• Most amplification takes place along the anode periphery
B.L. Thiel et al., Rev. Sci. Instr. 77 (2006) 033705M. Toth et al., Appl. Phys. Lett. 88 (2006) 023105
cnse.albany.edu
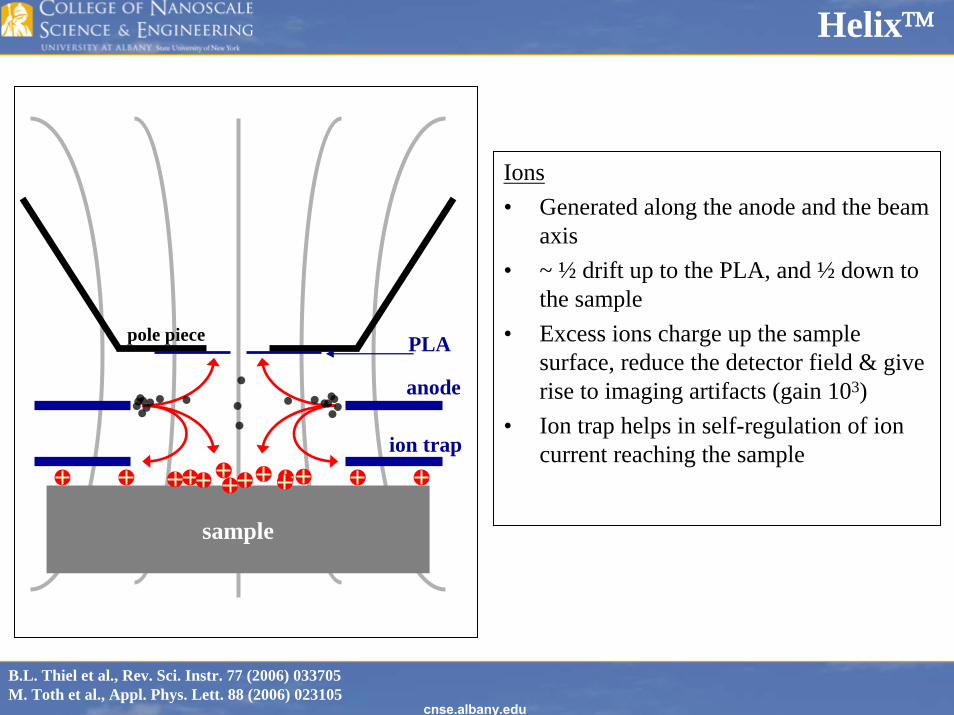
Helix™
Ions• Generated along the anode and the beam
axis• ~ ½ drift up to the PLA, and ½ down to
the sample• Excess ions charge up the sample
surface, reduce the detector field & give rise to imaging artifacts (gain 103)
• Ion trap helps in self-regulation of ion current reaching the sample
sample
pole piece PLA
anode
ion trap
B.L. Thiel et al., Rev. Sci. Instr. 77 (2006) 033705M. Toth et al., Appl. Phys. Lett. 88 (2006) 023105
cnse.albany.edu
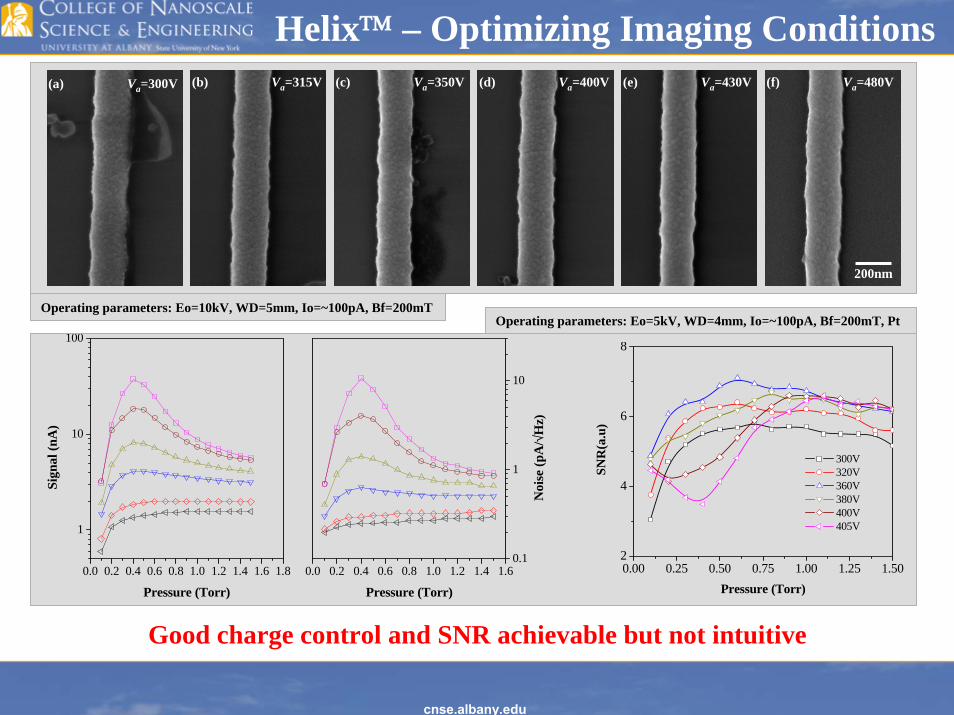
Operating parameters: Eo=10kV, WD=5mm, Io=~100pA, Bf=200mT
Helix™ – Optimizing Imaging Conditions
0.0 0.2 0.4 0.6 0.8 1.0 1.2 1.4 1.6 1.8
1
10
100
0.0 0.2 0.4 0.6 0.8 1.0 1.2 1.4 1.60.1
1
10
Sign
al (n
A)
Pressure (Torr)
405V 400V 380V 360V 319.9 299.9
Noi
se (p
A/√
Hz)
Pressure (Torr)
200nm
(f) Va=480V(b) Va=315V(a) Va=300V (d) Va=400V(c) Va=350V (e) Va=430V
0.00 0.25 0.50 0.75 1.00 1.25 1.502
4
6
8
SNR
(a.u
)Pressure (Torr)
300V 320V 360V 380V 400V 405V
Operating parameters: Eo=5kV, WD=4mm, Io=~100pA, Bf=200mT, Pt
Good charge control and SNR achievable but not intuitive
cnse.albany.edu
Summary & Pending Work
• Low Vacuum SEM can be a viable approach for high resolution CD Metrology if appropriate modeling of the instrumental effects is developed
• Charge control and contamination reduction have been demonstrated
• Analytical signal and noise performance for the constant field cascade were modeled successfully
cnse.albany.edu
Remaining Work
• Identification of the optimal gas composition for CD measurements
• Generalize analytical expressions for the gain and noise processes for complex detector configurations
• Develop analytical expressions for non-linear cascade processes – Breakdown (secondary ionization effects)– Scavenging (recombination of SE’s with ions)
• Establish the limits of charge control under low vacuum conditions
• Evaluate the model for incorporation in the CD simulation code MONSEL for the realization of Low Vacuum Critical Dimension Metrology
cnse.albany.edu
Back-up slides
cnse.albany.edu
Low Voltage vs. Low Vacuum
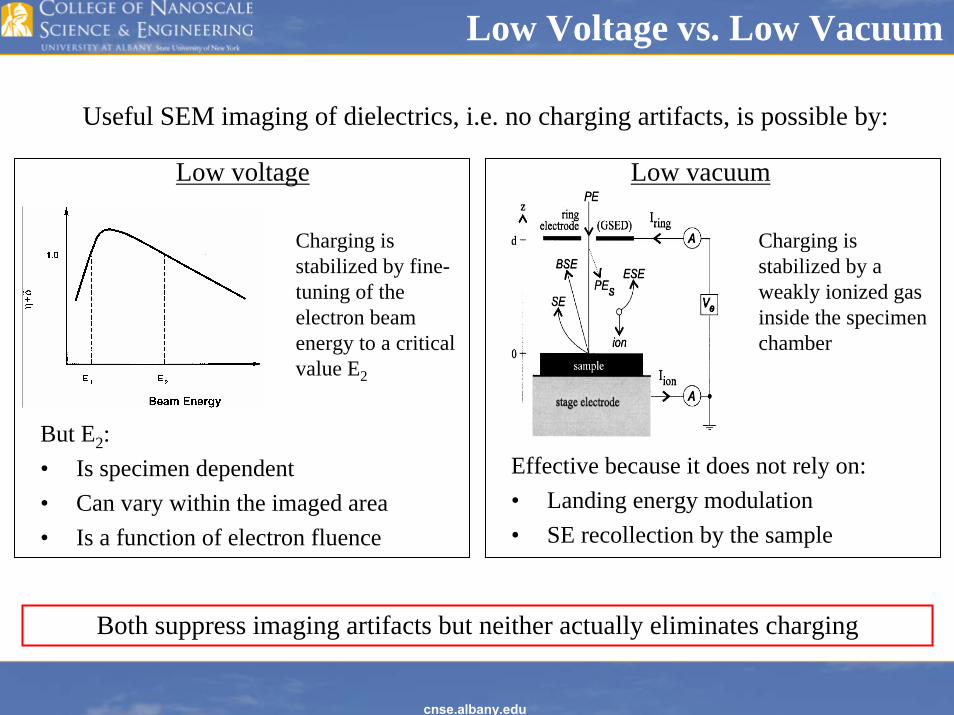
Useful SEM imaging of dielectrics, i.e. no charging artifacts, is possible by:
Low voltage Low vacuum
But E2:• Is specimen dependent • Can vary within the imaged area• Is a function of electron fluence
Charging is stabilized by fine-tuning of the electron beam energy to a critical value E2
Charging is stabilized by a weakly ionized gas inside the specimen chamber
Effective because it does not rely on:• Landing energy modulation• SE recollection by the sample
Both suppress imaging artifacts but neither actually eliminates charging
cnse.albany.edu
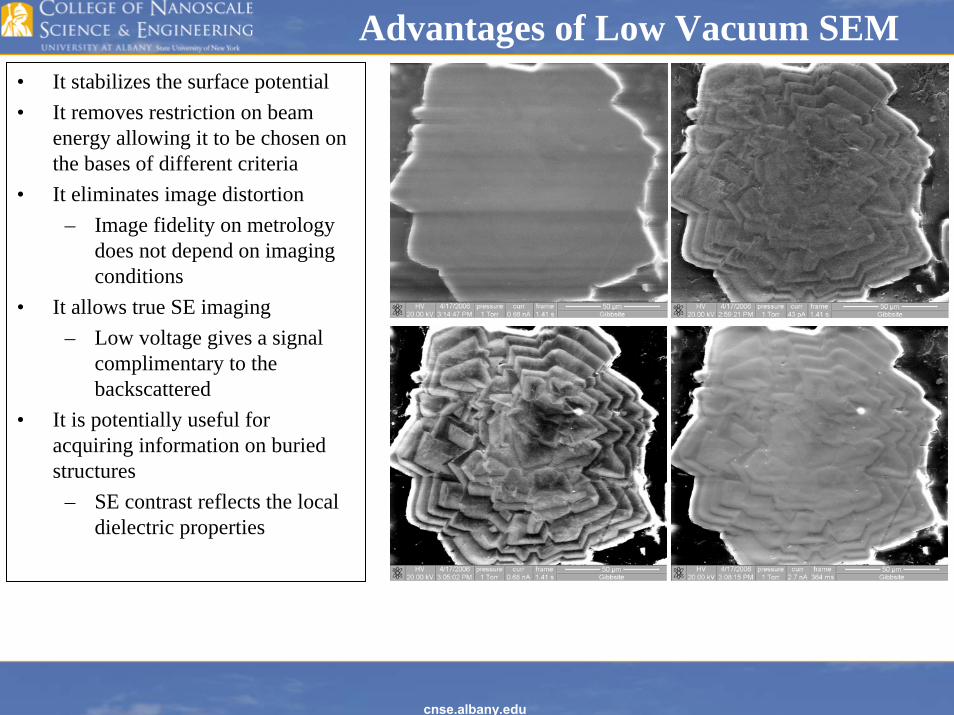
Advantages of Low Vacuum SEM• It stabilizes the surface potential• It removes restriction on beam
energy allowing it to be chosen on the bases of different criteria
• It eliminates image distortion– Image fidelity on metrology
does not depend on imaging conditions
• It allows true SE imaging– Low voltage gives a signal
complimentary to the backscattered
• It is potentially useful for acquiring information on buried structures
– SE contrast reflects the local dielectric properties
cnse.albany.edu
Summing the Noise
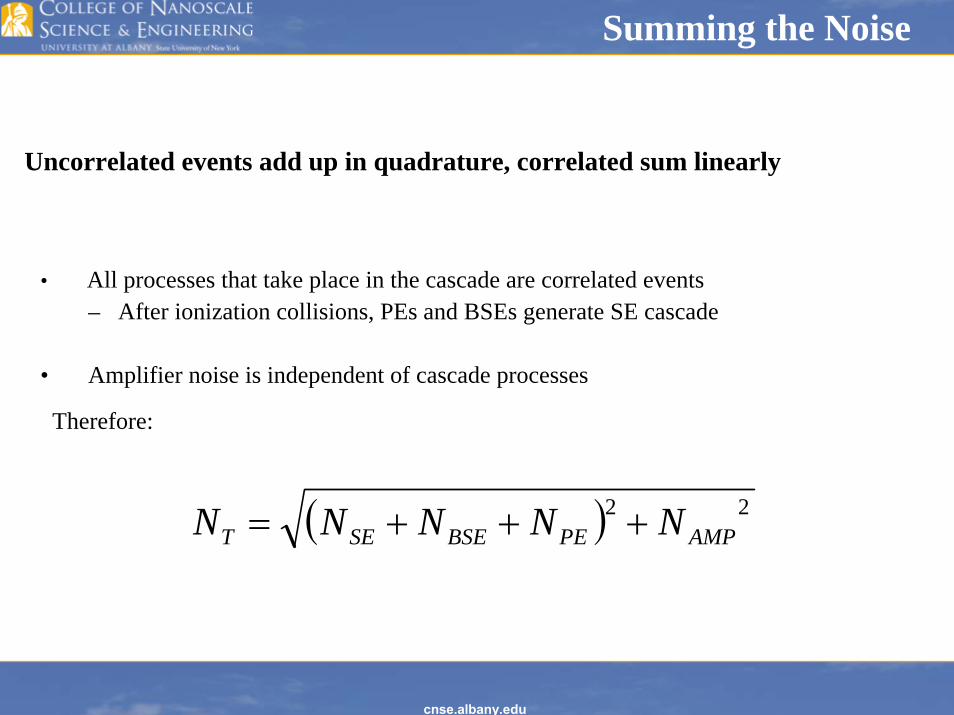
Uncorrelated events add up in quadrature, correlated sum linearly
• All processes that take place in the cascade are correlated events– After ionization collisions, PEs and BSEs generate SE cascade
• Amplifier noise is independent of cascade processes
Therefore:
( ) 22AMPPEBSESET NNNNN +++=
cnse.albany.edu
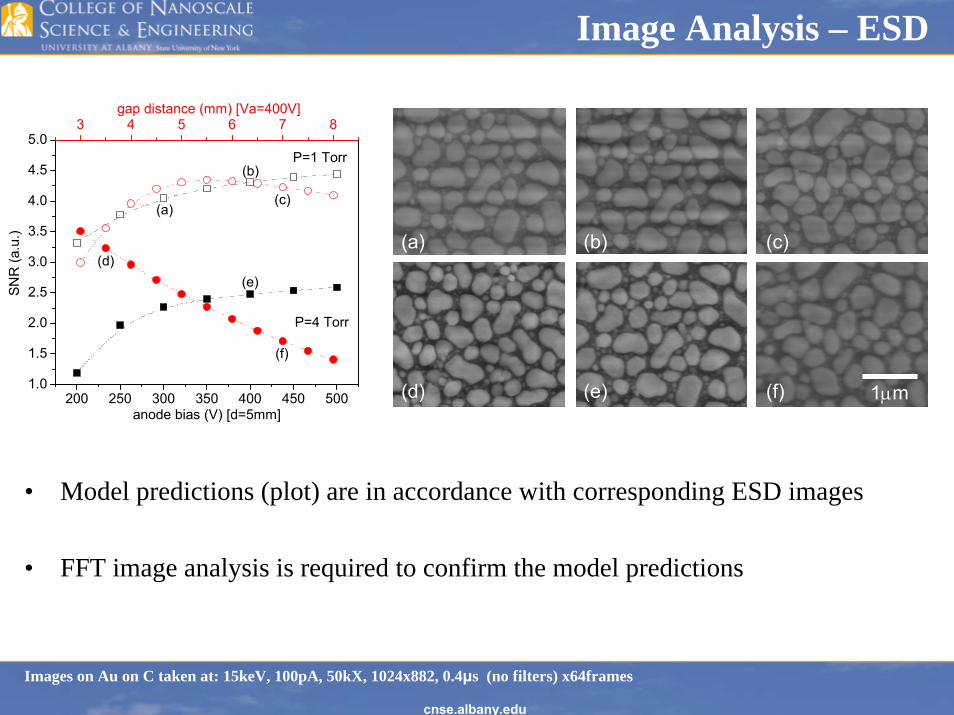
Image Analysis – ESD
• Model predictions (plot) are in accordance with corresponding ESD images
• FFT image analysis is required to confirm the model predictions
200 250 300 350 400 450 5001.0
1.5
2.0
2.5
3.0
3.5
4.0
4.5
5.03 4 5 6 7 8
(f)
(e)(d)
(c)
(b)
P=4 Torr
SNR
(a.u
.)
anode bias (V) [d=5mm]
P=1 Torr
(a)
gap distance (mm) [Va=400V]
1μm
(a) (b) (c)
(d) (e) (f) 1μm
(a) (b) (c)
(d) (e) (f)
Images on Au on C taken at: 15keV, 100pA, 50kX, 1024x882, 0.4μs (no filters) x64frames
cnse.albany.edu
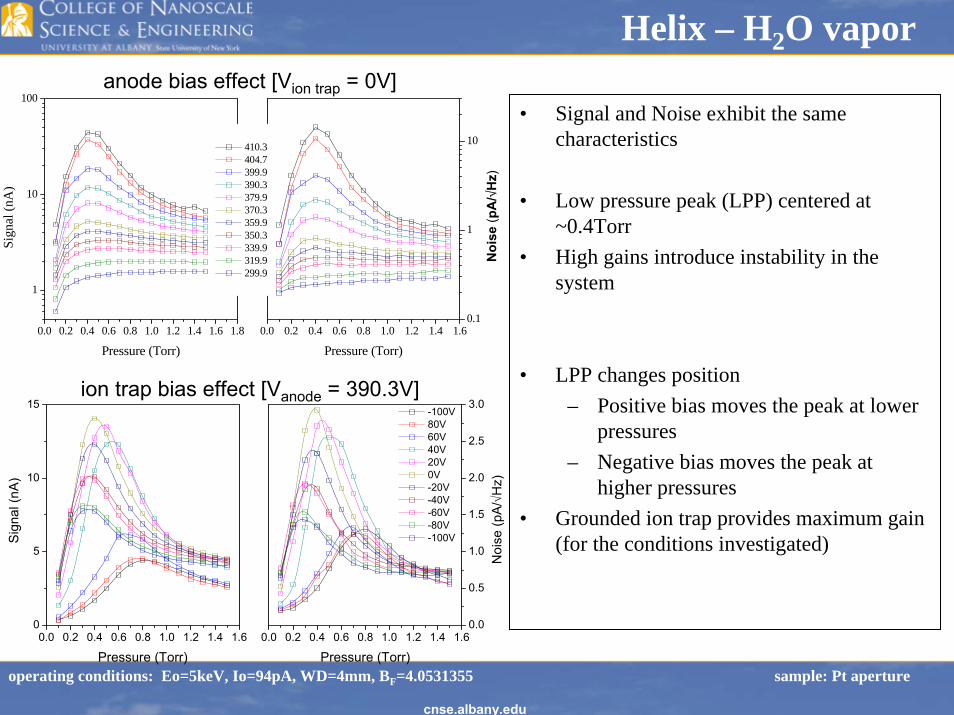
Helix – H2O vapor
• Signal and Noise exhibit the same characteristics
• Low pressure peak (LPP) centered at ~0.4Torr
• High gains introduce instability in the system
• LPP changes position– Positive bias moves the peak at lower
pressures– Negative bias moves the peak at
higher pressures • Grounded ion trap provides maximum gain
(for the conditions investigated)
0.0 0.2 0.4 0.6 0.8 1.0 1.2 1.4 1.6 1.8
1
10
100
0.0 0.2 0.4 0.6 0.8 1.0 1.2 1.4 1.60.1
1
10
Sign
al (n
A)
Pressure (Torr)
410.3 404.7 399.9 390.3 379.9 370.3 359.9 350.3 339.9 319.9 299.9
Noi
se (p
A/√
Hz)
Pressure (Torr)
0.0 0.2 0.4 0.6 0.8 1.0 1.2 1.4 1.60
5
10
15
0.0 0.2 0.4 0.6 0.8 1.0 1.2 1.4 1.60.0
0.5
1.0
1.5
2.0
2.5
3.0
Sig
nal (
nA)
Pressure (Torr)
-100V 80V 60V 40V 20V 0V -20V -40V -60V -80V -100V
Noi
se (p
A/√
Hz)
Pressure (Torr)
anode bias effect [Vion trap = 0V]
ion trap bias effect [Vanode = 390.3V]
operating conditions: Eo=5keV, Io=94pA, WD=4mm, BF=4.0531355 sample: Pt aperture
cnse.albany.edu
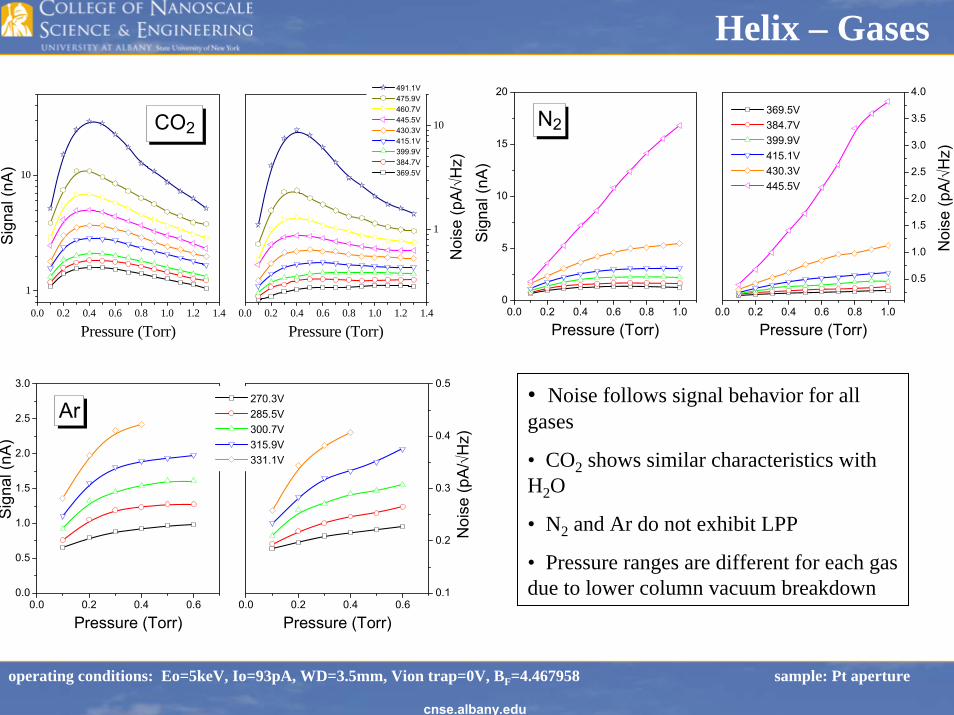
Helix – Gases
• Noise follows signal behavior for all gases
• CO2 shows similar characteristics with H2O
• N2 and Ar do not exhibit LPP
• Pressure ranges are different for each gas due to lower column vacuum breakdown
0.0 0.2 0.4 0.6 0.8 1.0 1.2 1.4
1
10
operating conditions: Eo=5keV, Io=93pA, WD=3.5mm, Vion trap=0V, BF=4.467958 sample: Pt aperture
0.0 0.2 0.4 0.6 0.8 1.0 1.2 1.4
1
10
Sig
nal (
nA)
Pressure (Torr)
491.1V 475.9V 460.7V 445.5V 430.3V 415.1V 399.9V 384.7V 369.5V
CO2
Noi
se (p
A/√
Hz)
Pressure (Torr)0.0 0.2 0.4 0.6 0.8 1.0
0
5
10
15
20
0.0 0.2 0.4 0.6 0.8 1.0
0.5
1.0
1.5
2.0
2.5
3.0
3.5
4.0
Sig
nal (
nA)
Pressure (Torr)
369.5V 384.7V 399.9V 415.1V 430.3V 445.5V
N2
Noi
se (p
A/√H
z)
Pressure (Torr)
0.0 0.2 0.4 0.60.0
0.5
1.0
1.5
2.0
2.5
3.0
0.0 0.2 0.4 0.60.1
0.2
0.3
0.4
0.5
Sig
nal (
nA)
Pressure (Torr)
270.3V 285.5V 300.7V 315.9V 331.1V
Ar
Noi
se (p
A/√
Hz)
Pressure (Torr)