reduction 2011-2014 deliverable 4.2 report on first pilot...
TRANSCRIPT

REDUCTION 2011-2014
Deliverable 4.2
Report on first pilot
(to be used for field study 1) 28 08 2014
2
D4.2 [Report on first pilot (to be used in field study 1)]
Public Document
3
D4.2 [Report on first pilot (to be used in field study 1)]
Project acronym: REDUCTION
Project full title: Reducing Environmental Footprint based on Multi-Modal Fleet management Systems for Eco-Routing and Driver Behaviour Adaptation
Work Package: 4
Document title: Report on first pilot (to be used in field study 1)
Document subtitle: Rapid prototype, software architecture in phase 1 of field trials
Version: 1.4
Official delivery date: April 30, 2013
Actual publication date: ________________
Type of document: Report
Nature: Public
Authors: Josif Grabocka, Kristian Torp, Athanasios Lois, Kyriakos Mouskos, Wilfred Pover, Marcel Valé, Lars Schmidt-Thieme, Dimitrios Katsaros, Leandros Maglaras, Marcel Morssink
Approved by: -
Version Date Sections Affected
1.0 15/04/2013 Included FlexDanmark and TRI architecture
1.1 23/04/2013 Included CTL and TRAINOSE architecture
1.2 30/04/2013 Integration by UHI completed
1.3 28/01/2014 Review comments processed
1.4 28/08/2014 Interim remote review processed

4
D4.2 [Report on first pilot (to be used in field study 1)]

5
D4.2 [Report on first pilot (to be used in field study 1)]
Table of Contents 1. Introduction ........................................................................................................................................................................ 11
1.1 Scope of Work Package 4 ....................................................................................................................................... 11
1.1.1 Overview of WP1, WP2, WP3 and their tasks ....................................................................................... 12
1.2 Scope of Deliverable D4.2 ...................................................................................................................................... 12
2. Targeted functionalities ................................................................................................................................................. 13
3. FlexDanmark Field Trial ................................................................................................................................................ 14
3.1 Eco-Routing Functionality ..................................................................................................................................... 14
3.2 Architecture ................................................................................................................................................................. 15
3.3 Functionality ............................................................................................................................................................... 19
3.4 Implementation.......................................................................................................................................................... 20
4. TRAINOSE Field Trial ...................................................................................................................................................... 24
4.1 Multimodal Web Site – Short Description ....................................................................................................... 24
4.2 Prototype ...................................................................................................................................................................... 26
4.3 Architectural Layers ................................................................................................................................................. 26
4.3.1 Upper Layer Architectural Components ................................................................................................. 27
4.3.2 Middle Level Architectural Components ................................................................................................. 28
4.3.3 Lower Level Architectural Components .................................................................................................. 28
4.4 Dependencies and Communication across Layers ...................................................................................... 28
4.4.1 Upper Level to Middle Level Interaction ................................................................................................. 29
4.4.2 Middle Layer Sub-Modules Dependencies ............................................................................................. 29
4.4.3 Middle Level to Lower Level Interaction ................................................................................................ 30
4.4.4 Description of the test site ............................................................................................................................ 31
4.4.5 Site Description. ................................................................................................................................................ 33
5. Nicosia Field Trial ............................................................................................................................................................. 37
6
D4.2 [Report on first pilot (to be used in field study 1)]
5.1 Pilot Software Architecture ................................................................................................................................... 38
5.2 Distributed Data Mining Aspect of Nicosia Field Trial ............................................................................... 41
5.2.1 Distributed Data Mining (DDM) .................................................................................................................. 41
5.2.2 Simulation Software for Distributed Data Mining (DDM) ................................................................ 42
5.2.3 Architectural Characteristics of P2P Data Mining ............................................................................... 43
5.2.4 P2P Network Topology for DDM ................................................................................................................ 44
5.2.5 Data Distribution ............................................................................................................................................... 46
5.2.6 Mapping P2P Data Mining Architecture to Nikosia Field Trial ...................................................... 47
5.2.7 P2P Data Mining Scenario for Nicosia Field Trial ................................................................................ 47
6. Trinité Field Trial .............................................................................................................................................................. 48
6.1 Field Trial Overview ................................................................................................................................................. 48
6.1.1 Field Trial Goals ................................................................................................................................................. 48
6.2 Overview of Trinité’s Application ....................................................................................................................... 48
6.3 Optimizing driving behaviour: Eco-driving .................................................................................................... 49
6.3.1 Eco-driving off-line .......................................................................................................................................... 49
6.3.1 Eco-driving on-line ........................................................................................................................................... 49
6.4 Personalized Eco-routing ....................................................................................................................................... 49
6.5 Design of REDUCTION App ................................................................................................................................... 50
6.5.1 Design criteria .................................................................................................................................................... 51
6.5.2 Use cases ............................................................................................................................................................... 52
6.5.3 Using the REDUCTION App ........................................................................................................................... 52
6.6 Trinité Field Test ....................................................................................................................................................... 54
6.6.1 Phase 1: Register and collect data in central database and CO2 emission calculation ........ 54
6.6.2 Phase 2: Calibrate the CO2 emission data with actual fuel consumption ................................. 55
6.6.3 Phase 3: Digital Road Guide to give route advise to users ............................................................... 56

7
D4.2 [Report on first pilot (to be used in field study 1)]
6.7 Trinité Future plans ................................................................................................................................................. 58
7. V2V and V2I communication........................................................................................................................................ 59
7.1 IEEE 802.11p architecture for running the CTL field trial ....................................................................... 59
7.1.1 The components of the developer’s software ....................................................................................... 59
7.1.2 The data flow across components of the developer’s software ..................................................... 59
7.1.3 The functionality flow ..................................................................................................................................... 60
7.1.4 The overall connection of the software to the use case (and the project) ................................ 61
7.1.5 Connection to other deliverables (past and future ones) ................................................................ 61
7.1.6 How does the architecture/functionalities match the Nicosia field study requirement .... 61
7.2 Architecture of components used in UTH’s simulated field trial........................................................... 62
7.2.1 The components of the developer’s software ....................................................................................... 62
7.2.2 The data flow across components of the developer’s software ..................................................... 62
7.2.3 The functionality flow ..................................................................................................................................... 62
7.2.4 The overall connection of the software to the use case (and the project) ................................ 63
7.2.5 Connection to other deliverables (past and future ones) ................................................................ 63
7.2.6 How does the architecture/functionalities match the Nicosia field study requirement .... 63
7.2.7 Use case descriptions ...................................................................................................................................... 63
8. Relationships and interoperability. ........................................................................................................................... 64
9. Risk Assessment ................................................................................................................................................................ 66
10. Conclusion ......................................................................................................................................................................... 66
Glossary ..................................................................................................................................................................................... 70
References ................................................................................................................................................................................ 71
List of tables
Table 1: Tasks academic partners .................................................................................................................................. 12
8
D4.2 [Report on first pilot (to be used in field study 1)]
Table 2: Summary table of deliverable 4.2 ................................................................................................................. 12
Table 3: Associations of technologies and partners versus field trials ........................................................... 13
Table 4: Details about the shortest, fastest, and most fuel-efficient routes .................................................. 14
Table 5 Application description Web TRAINOSE ..................................................................................................... 26
Table 6: Middle layer component dependencies ...................................................................................................... 30
Table 7: Interaction between middle and lower layers ......................................................................................... 31
Table 8: The real field of the TRAINOSE field trial .................................................................................................. 31
Table 9: Multimodal Trip schedule results table ...................................................................................................... 36
Table 10: Overview of different field trials ................................................................................................................. 65
Table 11 Interoperatibility ................................................................................................................................................ 65
List of figures
Figure 1: Shortest (blue), Fastest (red), and Most Fuel-efficient (green) Routes ....................................... 15
Figure 2: Overall Software Stack ..................................................................................................................................... 16
Figure 3: Overall ETL Process .......................................................................................................................................... 18
Figure 4: Screen dump of Speed-chart Web Service ............................................................................................... 20
Figure 5:Architecture overview of Implementation ............................................................................................... 21
Figure 6: XML format used for Speed Graphs ............................................................................................................ 22
Figure 7: Tables in the Data Warehouse Schema ..................................................................................................... 23
Figure 8: Field trial TRAINOSE ........................................................................................................................................ 26
Figure 9: Diagram architectural layers of TRAINOSE's pilot software ........................................................... 27
Figure 10: Input and output interfaces of upper layer .......................................................................................... 28
Figure 11: Dependencies between upper and middle levels ............................................................................... 29
Figure 12: Transportation Nodes in Greek Territory (city population > 10000 inhabitants) .............. 32
Figure 13: Transportation Links in Greek Territory (city population > 10000 inhabitants) ................ 33

9
D4.2 [Report on first pilot (to be used in field study 1)]
Figure 14: Multimodal Web Application entry page ............................................................................................... 34
Figure 15 Application menu .............................................................................................................................................. 34
Figure 16 Application search button ............................................................................................................................. 35
Figure 17 Web-API ................................................................................................................................................................ 36
Figure 18: Nicosia field trial architecturediagram .................................................................................................. 39
Figure 19: Conceptual architecture of centralized vs. distributed data mining .......................................... 42
Figure 20: Model propagation and merging ............................................................................................................... 43
Figure 21: BRITE universal topology generator (source: http://www.cs.bu.edu/brite) ........................ 45
Figure 22: Power-law topology model for P2P networks .................................................................................... 46
Figure 23: Distribution of degrees and data among peers in a P2P network ............................................... 46
Figure 24: Architecture diagram of the IPhone application ................................................................................ 50
Figure 25: Use cases of the IPhone application ......................................................................................................... 52
Figure 26: The iPhone App ................................................................................................................................................ 53
Figure 27: DSS data pool ..................................................................................................................................................... 56
Figure 28: DSRC standards and communication stack .......................................................................................... 60
Figure 29: ITS STA protocol architecture .................................................................................................................... 60
Figure 30: Implemented protocol architecture ........................................................................................................ 61
Figure 31: Functionality flow ........................................................................................................................................... 63
Figure 32: Architecture diagram of the different field trials ............................................................................... 64

D4.2 [Report on first pilot (to be used in field study 1)]
10
Executive Summary
The REDUCTION project follows a multidisciplinary approach to the challenge of reducing the CO2 emissions via intelligent transportation systems. The project is composed of several main pillars: eco-routing, multi-modal eco-routing, eco-driving and distributed data mining. Consortium partners (UHI, UTH, AU, AAU, DDE) offer methodological contributions in the Work Packages 1-3, while industrial partners (CTL, TRAINOSE, FlexDanmark) will test the developed methodologies in three concrete field trials, as described in Work Package 5.
The consortium is committed to accomplish four field studies. The FlexDanmark field trial (Task 5.2) will enable verifying the efficiency of the eco-routing algorithms developed in Work Package 3, while the test-bed will be the taxi routing platform of FlexDanmark. Similarly the TRAINOSE field trial (Task 5.3) is dedicated to elaborating multi-modal eco-routing techniques and applies them to a train-bus hybrid traffic topology. Finally the Nicosia field trial (Task 5.4) will enable the validation of the eco-driving and distributed data mining approaches of Work Package 2 and the communication device and protocols designed by Work Package 1. The study will analyse the data and vehicular communication of a public bus fleet in Nicosia. In addition to the three field trials covered by the tasks of Work Package 5, a new field trial will be organized by Trinité with a focus on eco-routing for individual users through a portable “iPhone” eco-routing application.
Work Package 4 is devoted to the development of several modules elaborated in the life span of the project and their integration. In this deliverable (D4.2) the primary focus will be on describing the software architecture of the software stacks, which will be utilised in the first phase of the aforementioned field trials.
The architectural description will follow a modular fashion. All field studies (FlexDanmark, TRAINOSE and Nicosia) utilise specialized software stacks, which implement the methodologies tailored for the focus of analysis. Naturally, the software stacks of each use case comply with the technical requirements imposed by the underlying infrastructure of the field trial companies and interact with the support systems of the respective provided services. The specific software architecture to be used in all the field trials (FlexDanmark, TRAINOSE, Nicosia and Trinité) is covered in depth throughout this deliverable. Inter-modular communication and interaction through modules is carried through web-service technologies and is described posterior to the individual pilot software architecture.

D4.2 [Report on first pilot (to be used in field study 1)]
11
1. Introduction The reduction of CO2 emissions is a great challenge for the transport sector nowadays. Despite recent progress in vehicle manufacturing and fuel technology, still a significant fraction of CO2 emissions in EU cities is resulting from road transport. Therefore, additional innovative technologies are needed to address the challenge of reducing emissions. The REDUCTION project focuses on advanced ICT solutions for managing multi-modal fleets and reducing their environmental footprint. REDUCTION collects historic and real-time data about driving behaviour, routing information, and emissions measurements that are processed by advanced predictive analytics to enable fleets enhance their current services as follows: 1) Optimising driving behaviour: supporting effective decision making for the enhancement of drivers education and the formation of effective policies about optimal traffic operations (speeding, braking, etc.), based on the analytical results of the data that associate driving-behaviour patterns with CO2 emissions; 2) Eco-routing: suggesting environmental-friendly routes and allowing multi-modal fleets to reduce their overall mileage automatically; and 3) Support for multi-modality: offering a transparent way to support multiple transport modes and enabling co-modality. REDUCTION follows an interdisciplinary approach and brings together expertise from several communities. Its innovative, decentralised architecture allows scalability to large fleets by combining both V2V and V2I approaches. Its planned commercial exploitation, based on its proposed cutting edge technology, aims at providing a major breakthrough in the fast growing market of services for "green" fleets in EU and worldwide, and present substantial impact to the challenging environmental goals of EU.
1.1 Scope of Work Package 4 The main objective of WP4 is to have a real-time publish-subscribe distributed middleware with generic functionalities. The functionalities from WP1, WP2 and WP3 will be integrated based on different interfaces.
Requirements on software level for the envisaged final software product are collected and the software architecture is defined. The software architecture will be based on the principles of i) publish-subscribe, and ii) distributed middleware. Such architecture provides higher levels of abstraction, hiding the complexity of dealing with a variety of platforms, networks and low-level process communications. Application developers may concentrate only on the current requirements of the software to be developed, and use lower-level services provided by the middleware when necessary.
The software development of the case studies in WP5 will use the system design and architecture in this work package as a framework to integrate different functionalities.

D4.2 [Report on first pilot (to be used in field study 1)]
12
1.1.1 Overview of WP1, WP2, WP3 and their tasks WP1, WP2, WP3 are mainly contributed by the academic partners. The academic partners and their tasks are shown in Table 1.
University Thessaly (WP1) Wireless communication including V2I and V2V
Duration from M1 to M30
University Hildesheim (WP2) A predictive model to educate drivers to improve driving
Duration from M1 to M36
University Aalborg and University Aarhus (WP3)
Eco-routing algorithm, based on fuel consumption and GHG emission models
Duration from M1 to M36
Table 1: Tasks academic partners
1.2 Scope of Deliverable D4.2 Deliverable 4.2 aims to describe the pilot software and the relevant functionalities that will be offered in the first phase of the field studies. Such deliverable will cover a detailed description of the software architecture of the various modules contained by the modules of each work package. The internal dependencies and interactions of functionalities inside the module of each field trial will be elaborated. In addition interfaces to connect between functionalities across field trials will be covered through inter-connecting web-services. The objectives of this deliverable are listed in Table 2.
Objective Result
To describe the functionalities for WP1, WP2 and WP3, to be used for phase 1 of the field trials.
The functionalities are described in chapter 3, 4, 5, 6 and 7.
To describe the software and system architecture that is needed for phase 1 of the field trials.
The architecture is described in chapter 3, 4, 5, 6 and 7.
To show the relationships and interoperability between the different field trials.
The relationships and interoperability is described in chapter 8.
Table 2: Summary table of deliverable 4.2

D4.2 [Report on first pilot (to be used in field study 1)]
13
2. Targeted functionalities Primarily the methodologies developed in the REDUCTION projects will be validated through the four designed field trials namely: FlexDanmark, TRAINOSE, Nicosia and Trinité. The technologies to be deployed together with the corresponding field trial where they will be tested are depicted in Table 3. A tick (+) denotes that the respective technology of the first column will be deployed on the field trial, whose column contains the tick.
Technology (Partner(s))
Work Packages
Field Trial FlexDanmark TRAINOSE Nicosia Trinité
Vehicular Communication (DDE) WP1 +
P2P Communication and Analytics (UTH,
UHI) WP1,WP2 +
Eco-Driving (UHI,TRI) WP2 + + Eco-Routing Taxi Fleet
(AU, AAU, FlexDanmark)
WP3 + Eco-Routing Individual
(TRI) WP4 + Multimodal Eco-Routing
(TRAINOSE) WP5 + Table 3: Associations of technologies and partners versus field trials
The reproducibility of the technologies across sites is not highly spread, as Table 3 shows. This however is not going to be a problem, since the technology of every work package will define standardized output on CO2 emission, fuel consumption and travel time, to be used as input definition of the integral software architecture of WP4. In other words, the technologies developed in the different field trials are loosely coupled to the integral software architecture of WP4.
The architecture of the software to be used in the first phase of the mentioned field trials is described in each of the following dedicated chapters:
Chapter 3 – FlexDanmark field trial, Pilot architecture description
Chapter 4 – TRAINOSE field trial, Pilot architecture description
Chapter 5 – Nicosia field trial, Pilot architecture description
Chapter 6 – Trinité field trial, Pilot architecture description

D4.2 [Report on first pilot (to be used in field study 1)]
14
In addition Chapter 7 is focused on the architecture of the V2V and V2I Communication functionalities provided in the scope of Work Package 1 by UTH.
3. FlexDanmark Field Trial
3.1 Eco-Routing Functionality The eco-routing functionality is used to find the most fuel-efficient routes between two points. There are multiple goals of using eco-routes including the following.
Estimate the fuel consumptions of the existing routes used.
Evaluate the potential for saving fuel if routes are optimized for minimal fuel consumption instead of fastest travel time.
Estimate the total fuel consumption for all trips made by a fleet of vehicles.
This section provides an overview of the software used to implement the eco-route functionality tested in the first field trial at FlexDanmark during M12-18. This field trial is reported in details in D5.2. In addition, information about the software can be found in D3.1, D3.2, and D.5.1.
The core functionality of the software developed for the first FlexDanmark field trial is illustrated in Figure 1. Here the shortest (blue), the fastest (red), and the most fuel-efficient (green) routes between two points in the Greater Copenhagen, Denmark area are shown. As can be seen there can be a significant difference between these routes.
If the ‘Show details’ button in Figure 1 is pressed Table 4 is shown.
Jagtvej to Smedeland Time Distance Fuel
Fuel-Efficient 0:22:33 13.90 km 1.48l
Fastest 0:18:05 22.41 km 2.41l
Shortest 0:20:54 13.33 km 1.50l
Table 4: Details about the shortest, fastest, and most fuel-efficient routes

D4.2 [Report on first pilot (to be used in field study 1)]
15
Figure 1: Shortest (blue), Fastest (red), and Most Fuel-efficient (green) Routes
3.2 Architecture The prototype can compute fastest, shortest, and most fuel-efficient route between any two points where GNSS data, CANBus data, and a digital map is available. The prototype stores all data in a star schema, which can be queried using a web-browser based interface as shown in Figure 1. In addition, advanced users can query the data using SQL.
The overall software stack is shown in Figure 2. (Description is based on (Andersen, Krogh, & Torp, An Open-source Based ITS Platform, 2013 (to appear))). The stack is layered, meaning that a software component is reliant on the software components below it. As an example, the component pygrametl depends on the component psycopg, which again depends on both PostgreSQL and Python, which again are dependent on the operating system. Software components marked with (*) are fairly easy to substitute, i.e., the platform is almost independent of the DBMS and totally independent of the operating system.

D4.2 [Report on first pilot (to be used in field study 1)]
16
Figure 2: Overall Software Stack
Please note that all components in the software stack below the project-specific code can be open-source, e.g., if Linux is used as the operating system. However, a proprietary operation system or DBMS can be used. In the following, the software stack will be described bottom-up.
The operating system is the basic software, which PostgreSQL, Python, and M-GEMMA use directly. The software components at the higher levels in the software stack are independent of the operating system. The operating system can easily be substituted by another. The requirements to the operating system are the following.
Capable of executing 64 bit applications.
Capable of compiling the M-GEMMA C++ code into a 64 bit component.
Run Python version 3.2 and dependent Python packages.
Run PostgreSQL/PostGIS version 9.2/2.0 or similar spatial-enabled DBMS.
The platform has been tested and verified working with the operating systems:
Windows Server 2008 SP2 Standard (64 bit)
Ubuntu Server 12.10 (64 bit)
PostgreSQL (The PostgreSQL Global Development Group) version 9.2 is the DBMS used along with the spatial extension PostGIS (Refractions Research). This combination makes it possible to store and query spatial data such as point, regions, and line strings. PostgreSQL can fairly easily be
Psycopg
64 bit Operating System (*)
PostgreSQL 9.2/ PostGIS 2.0 (*)
M-GEMMA
Python 3.2
Project-specific Code
NetworkX pygrametl Project-
generic Code

D4.2 [Report on first pilot (to be used in field study 1)]
17
replaced by any spatially enabled DBMS that is OGC compliant. This would require modifications to the project-specific code, e.g., the connection settings, the bulk load of data, and the creation and deletion of indices and tables.
Python 3.2 (Python Software Foundation) is used as the core programming language for the project-generic and project-specific code On Linux (Ubuntu Server) (ubuntu) Python is available through the package management system named APT. The dependent Python packages easily install through this package management system or is compiled and installed manually. On Windows the 64 bit version of Python is used.
M-GEMMA (Pereira, Costa, & Pereira, 2009) is a third-party tool, used to map-match a sequence of GNSS records to a road network, while at the same time grouping the records into trips. M-GEMMA is implemented in C++ and does not depend on any operating system specific libraries. The main memory usage of M-GEMMA depends on the size of the map used. M-GEMMA is compiled into a 64 bit component to ensure that very large main-memories can be used. A 32 bit version M-GEMMA cannot handle a map of Denmark (approximately 650,000 road segments) in the main-memory address space available.
M-GEMMA requires the input GNSS data to be in the NMEA format (National Marine Electronics Association) that is a proprietary. However, the format has been reverse-engineered (DePriest).
The source code of M-GEMMA is slightly modified, in order to add functionality for parallel processing, handling of maps, and additional input parameters. The details of these modifications can be found in (Andersen & Torp, An Open-Source ITS Platform, 2012).
Psycopg (Varrazzo) is a PostgreSQL database adapter for Python. The adapter can be exchanged with any other adapter if a different spatial-enabled DBMS is used. The project-specific ode and pygrametl both used Psycopg. pygrametl (Thomsen) is a tool that makes it easy to create ETL scripts in Python.
NetworkX (NetworkX Developers) is a Python package that provides the ability of working with graphs and shortest paths algorithms. The supplied algorithm used for shortest path is insufficient. Therefore an optimized shortest path algorithm has been developed for handling bulks of shortest-path computations. The details of these changes can be found in (Andersen & Torp, An Open-Source ITS Platform, 2012).
The project-generic code is a number of Python modules, e.g., for handling latitude and longitude coordinates. These modules have not been available for the relative new Python 3.x programming language.
On top of the software stack is the project-specific code that depends solely on the software in the layer directly below it. The project-specific code is written entirely in Python and is optimized for multiprocessing (multi CPU core support).

D4.2 [Report on first pilot (to be used in field study 1)]
18
Central to the platform is the ETL process for loading GNSS records into the data warehouse. The ETL process is executed nightly. The overall ETL process is fairly complicated due to many types of dirty data. Further, the ETL process is heavily parallelized to be efficient. The overall ETL process is shown in Figure 3.
Figure 3: Overall ETL Process
In Figure 3, solid arrows are dataflow, dashed arrows execution flow, and parallel lines indicate storage, files, or queues. The ovals are all processes with the black being main processes, the blue
D4.2 [Report on first pilot (to be used in field study 1)]
19
being background processes, and the red parallel processes. Seven main processes are executed one by one, and several of these have background workers, processing data in parallel. The ETL process can be divided into two main parts. First data is loaded into a temporary table then data is loaded from the temporary table, cleaned, and finally loaded into the data-warehouse tables.
3.3 Functionality
The functionality of the eco-route software naturally covers the computation of eco-routes between any two points in Denmark as illustrated in Figure 1. This section shortly describes the underlying functionality required to compute eco-routes. Details can be found in D3.1, D3.3, and partly D.5.1 and D5.3.
The functionality can be divided into to the following main area.
Loading of the core data foundation. This includes loading GNSS and CANBus data. Loading a digital map (OpenStreetMap is used).
Evaluate and annotate the map. This includes the ETL process shown in Figure 3 and annotating the OpenStreetMap digital map with information about travel-time, fuel consumption, number of observation, and other metadata. The overall result of these steps is that a new so-called eco-map is created. It is this eco-map that is queries as shown in Figure 1.
Querying the data can be done via the web interface as shown in Figure 1. This makes the eco-route information available to a broad audience and does not require any particular IT skills of the persons using it. It is also possible to access the data warehouse directly using the SQL query language. This latter type of access requires IT skills and due to the sensitive nature of the data this is only allowed for a small set of users. (it is possible to guess where person lives if you have direct access to the GNSS data).
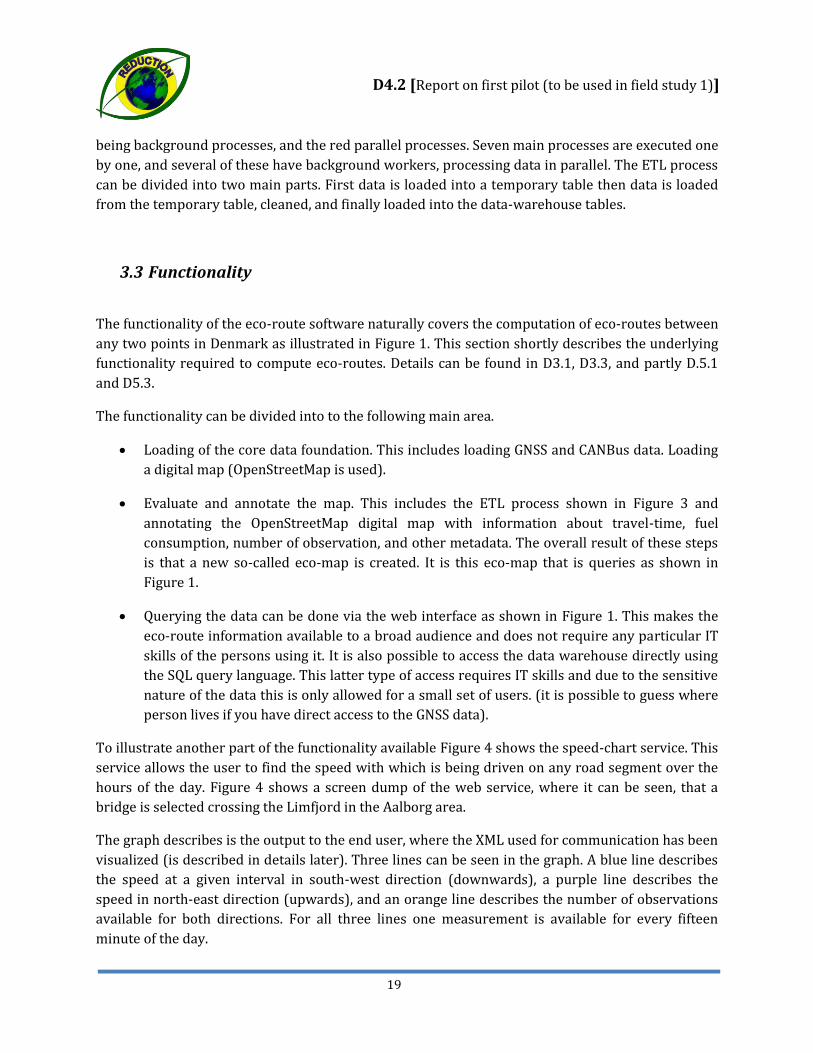
To illustrate another part of the functionality available Figure 4 shows the speed-chart service. This service allows the user to find the speed with which is being driven on any road segment over the hours of the day. Figure 4 shows a screen dump of the web service, where it can be seen, that a bridge is selected crossing the Limfjord in the Aalborg area.
The graph describes is the output to the end user, where the XML used for communication has been visualized (is described in details later). Three lines can be seen in the graph. A blue line describes the speed at a given interval in south-west direction (downwards), a purple line describes the speed in north-east direction (upwards), and an orange line describes the number of observations available for both directions. For all three lines one measurement is available for every fifteen minute of the day.
D4.2 [Report on first pilot (to be used in field study 1)]
20
In the first field trial at FlexDanmark the trial has been conducted using 1.3 billion GNSS records from approximately 13,000 vehicles. A digital map covering all of Denmark (~650,000 road segments) has been used. To compare the fastest routes to the most fuel-efficient routes approximately 53,000 trips from North Jutland have been used in the comparison. These are all the trips for the month of November 2012 in the region of Denmark where most GNSS and CANBus data is available.
Figure 4: Screen dump of Speed-chart Web Service
3.4 Implementation
This section describes implementation the details. The overall architecture of the implementation is shown in Figure 5. The architecture can be tested online at the http://daisy.aau.dk/its.

D4.2 [Report on first pilot (to be used in field study 1)]
21
Figure 5:Architecture overview of Implementation
There is a subsystem running of on the public Internet, marked by the green rectangle and labelled ‘Internet’. The client accesses the services provided by using a standard web browser such as Firefox, Internet Explorer, or Google Chrome. Each of the services are displayed as black boxes in Figure 5 and labelled ‘Webservice frontend’. These services are implemented using HTML, JavaScript, and CSS and runs on most browsers including the mobile browsers on the Android and Apple iOS platforms. In the Figure 5, each web-service front-end looks isolated. In the implementation there is a larger overlap in particular the JavaScript and CSS code used for these services.
The web-service front-ends communicate with a web server running Apache with the PHP programming language extension enabled. The PHP programming language is used to be able to forward HTTP request from the Internet to the internal service situated behind a firewall. The size of the PHP code is kept to a bare minimum and works only as a glue layer. PHP has been chosen due to it being a very popular scripting language that is available on most platforms.
The blue rectangle labelled ‘Intranet’ contains the software component that runs behind the firewall. Another Apache web server with WSGI functionality enabled acts as interface between the external Apache web server and the functionality implemented on top of the data warehouse.
D4.2 [Report on first pilot (to be used in field study 1)]
22
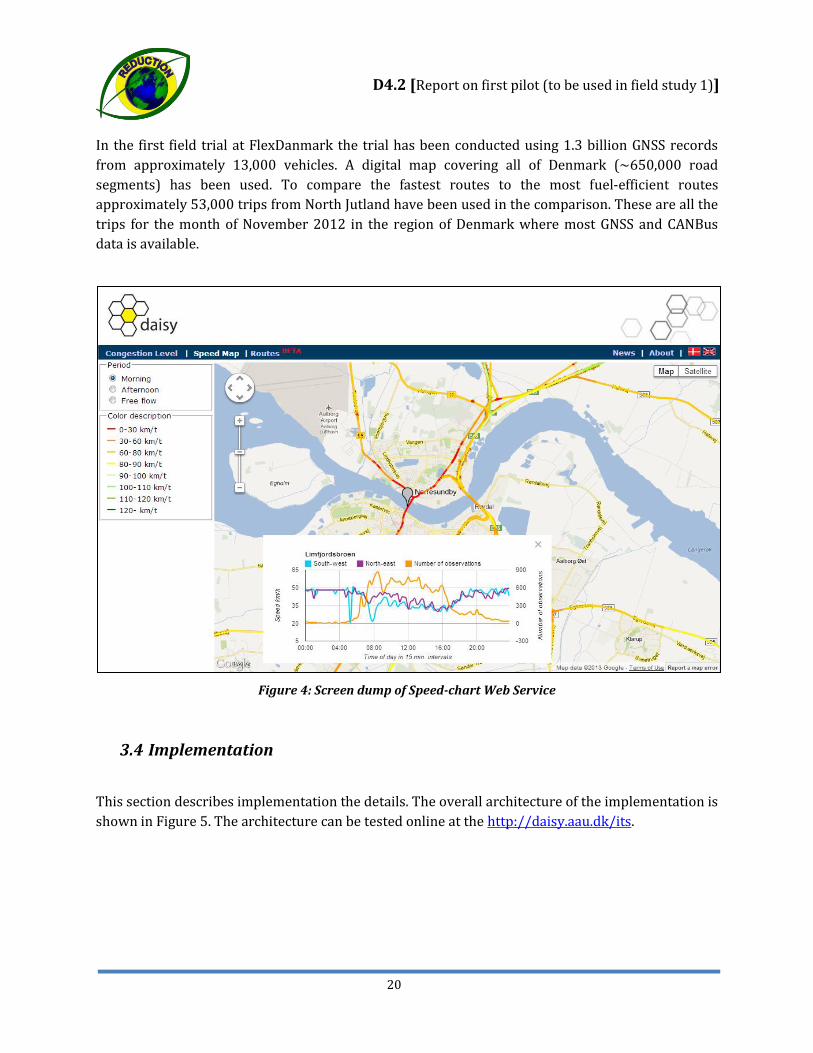
WSGI is used because it enables the execution of Python scripts. On the server-side all programs are implemented using the Python programming language and it therefore central to be able to execute these programs. In Figure 5 each Python program is shown as a green rectangle labelled ‘Python script’. There is very large degree of reuse between the Python programs that is not directly visible from Figure 5.
All communication between the web-service front-end and the internal webserver is done using XML. For the speed-graph example shown in Figure 4 the format of the XML document is the following (see Figure 6).
Figure 6: XML format used for Speed Graphs
The data warehouse is implemented using the PostgreSQL RDBMS version 9.2. The schema is designed using the star schema approach. An overview of the tables in data warehouse is shown in Figure 7. Details are provided both in previous deliverables D3.1 and D3.2.
The tables are grouped by colours, which determine their function and references between tables are show by lines.
Dimension tables (blue and grey): o All blue tables are dimensions. These tables contain dimensional data, which only
rarely or never changes. o Grey tables are maps, and they differ a bit from other dimensions in the way, that
the number of map dimensions is dynamically and new maps can occur suddenly. Only one map, Map, is shown as an example.
Fact table (green): o The green table stores all data returned from the ETL and cleaning process. Only
one table exists for keeping all input data, namely Positioning Data. Summary tables (yellow):
<?xml version="1.0" encoding="UTF-8"?> <chart> <MMCoordinate lng="9.91964546404451“ lat="57.0545824577259"/> <caption>Limfjordsbroen</caption> <graphtype>smooth</graphtype> <speed1Name>South-west</speed1Name> <speed2Name>North-east</speed2Name> <timeaxis title="Time of day in 15 min. intervals"/> <speedAxis title="Speed km/h"/> <noDataAxis title="Number of observations"/> <p speed2="48.1" speed1="49.4" noData="36" m="0" h="0"/> <p speed2="48.1" speed1="47.8" noData="21" m="15" h="0"/> … <p speed2="49.4" speed1="49.4" noData="32" m="30" h="23"/> <p speed2="50.3" speed1="43.3" noData="40" m="45" h="23"/> </chart>

D4.2 [Report on first pilot (to be used in field study 1)]
23
o The yellow tables store aggregated data, returned from map-matching algorithms. Two kinds of tables exist, namely Point Map-matched Data and Trip Map-matched Data. Several instances of these two tables might exist, while map-matched data for each Map will be stored in different summary tables.
Reporting tables (red): o Red tables contain output report from computed data from data warehouse. Two
kinds of reports exist, namely Speedmap and Matrix reports. Every time a new report is generated, a new table is created.
All the tables are connected by references. The references can be seen in Figure 7 as pointing lines. The references are coloured as their source tables, for easier overview.
Figure 7: Tables in the Data Warehouse Schema

D4.2 [Report on first pilot (to be used in field study 1)]
24
4. TRAINOSE Field Trial
The field trial to be conducted by TRAINOSE fulfils the Task 5.3 described in the context of Work Package 5, with respect to the Description of Work document. The trial aims at exploring functionalities related to the multimodal eco-routing aspect of the project. The test bed of the analysis will be the infrastructure of TRAINOSE’s bus and train fleets and the relevant topology described already in D 5.1.
4.1 Multimodal Web Site – Short Description The Web Multimodal Application is one of TRAINOSE’s contributions along with locomotive drivers driving behaviour models and TRAIN-TAXI Service. The application offers multimodal transportation information to TRAINOSE customers when they seek for travel information in Greek Territory. Application described shortly in the following table:
Application Purpose To offer multimodal transportation information to TRAINOSE customers in an ECO way.
Application User Interface User interface is quite simple, since it has to be “light” enough and not confusing for its purpose. There are two main webpages.
1. Input Web Page. This web page is devoted to users input. Page is divided to two areas. Right area is dedicated to users’ input information via the following UI elements. 1.1. “Travel Calculation”. Travel calculation is used for the
definition of how users choose to define Origin, Destination points. (it can be by address, by lat/lon pairs, by transportation Point)
1.2. “Travel Date”. This field describes the desired travel date. 1.3. “Way of travel”. Users can choose among ECO, Cheapest,
Fastest way of traveling. 1.4. Search Button. User clicks on this button in order to get trip
results. Right area contains graphical elements for better visualization of the Origin/Destination Points
2. Results Web page. This webpage contains trip results as the result of trip calculation in the Input Web Page. It is divided into three parts. 2.1. The Header part contains (Graphical / Text) information of

D4.2 [Report on first pilot (to be used in field study 1)]
25
how user can reach the nearest transportation station form his/her origin point.
2.2. The middle part contains detailed information related to multimodal trip, and transportation (Bus, Train, Ferry etc.) means that have been used for the trip.
2.3. The footer part contains information of how user can reach his/her destination address from the last trip leg station.
Functionalities Application functionalities divided to concealed and unconcealed functionalities.
Unconcealed functionalities are for application users, and they are related to trip calculations and trip information.
Concealed functionalities devoted to application administrators and their main purpose is the updating/deletion/insertion of : 1. Time tables for bus, trains, and ferries. 2. Schedules for bus, trains, and ferries. 3. Network Nodes. 4. Network Arcs. 5. Ticket prices for bus, trains, and ferries. 6. CO2 emissions.
Application Data Application data pool contains the following data.
1. Nodes (Bus/Train/Ferry Stations) 1. 105 Central Bus Stations 2. 365 Train Stations 3. 8 main Ports 4. 2 mains Airports
2. Links. 685 links each one with its own 1. Timetable 2. Ticket price 3. Travel time 4. Travel distance 5. CO2 emissions
Types of Trips Depending on user’s selection from the “way of traveling” UI element, application can produce the following trip results.
1. Minimum cost trips. Usually these trips are Train trips since trains are cheaper than busses in Greek territory.
2. Minimum time Trips. Usually these trips are bus trips since

D4.2 [Report on first pilot (to be used in field study 1)]
26
train trips suffering from low to medium transfer delays between different lines.
3. Minimum CO2. These trips always use trains when it is possible since the average CO2 per KM is significantly lower for trains than for busses.
Table 5 Application description Web TRAINOSE
4.2 Prototype
TRAINOSE field trial is based on a combination of web interfaces, data and algorithms. The web interface is the interface part of our field trial and it is designed to offer typical web interactions. On the other hand, data and specific transportation data need to be collected by our field trial (Arcs, vertexes, vehicles, time tables etc.). Finally, algorithms are implementations of the well know transportation algorithms (shortest paths, multi-modal shortest paths, time dependent shortest path algorithms). The upper layer of our prototype is the web interface and is the unique entry point for our users. Data and algorithms are never accessible in an explicit way to our users. Operation is quite simple for the user, no matter of the background implementations and data. The following Figure 8 presents the simplest operational form of our field trial.
Figure 8: Field trial TRAINOSE
4.3 Architectural Layers
Architecture for multimodal application should include various components that can support further evolution of the product. The structure of the architecture which supports the functionalities offered in the TRAINOSE field trial is a polylithic architecture. Three main layers encapsulate the services of the software stack as described below:
1. Upper Layer: The User Interface and the Administrator interface 2. Middle Layer: The backbone, data and Communication components
User provides input for: Origin Point, Destination Point, Travel Day.
User Receives: The full itinerary based on many transportation means

D4.2 [Report on first pilot (to be used in field study 1)]
27
3. Lower Layer: The implementation of multi-modal eco-routing algorithms
Figure 9 provides a pictorial description of the components and their main interaction.
Figure 9: Diagram architectural layers of TRAINOSE's pilot software
4.3.1 Upper Layer Architectural Components
This upper layer offers the medium where users interact within the application and the administrative tasks as well. In this layer the software stack that offers the user interfaces is present. User interaction should be kept at the minimum, while the minimum information that user is enforced to enter should be:
Trip Origin Address
Trip Destination Address
Date/Time
Mode of Transportation. (By Car, By Train, Eco Mode etc.)
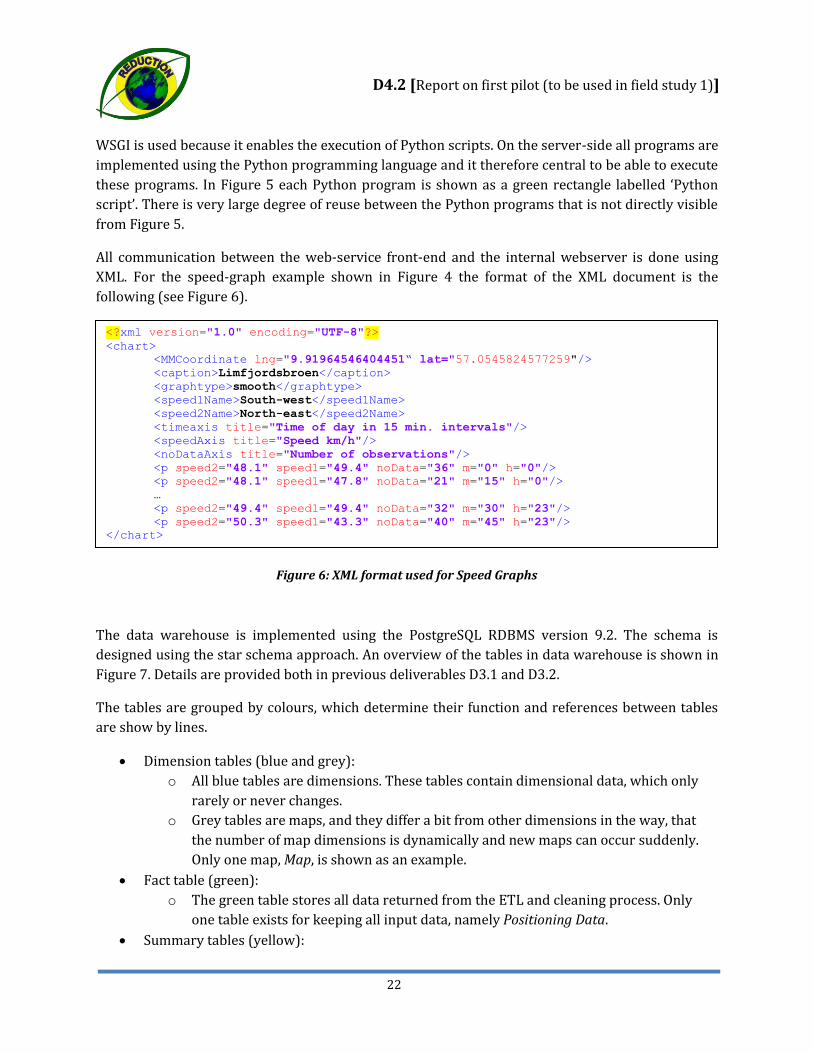
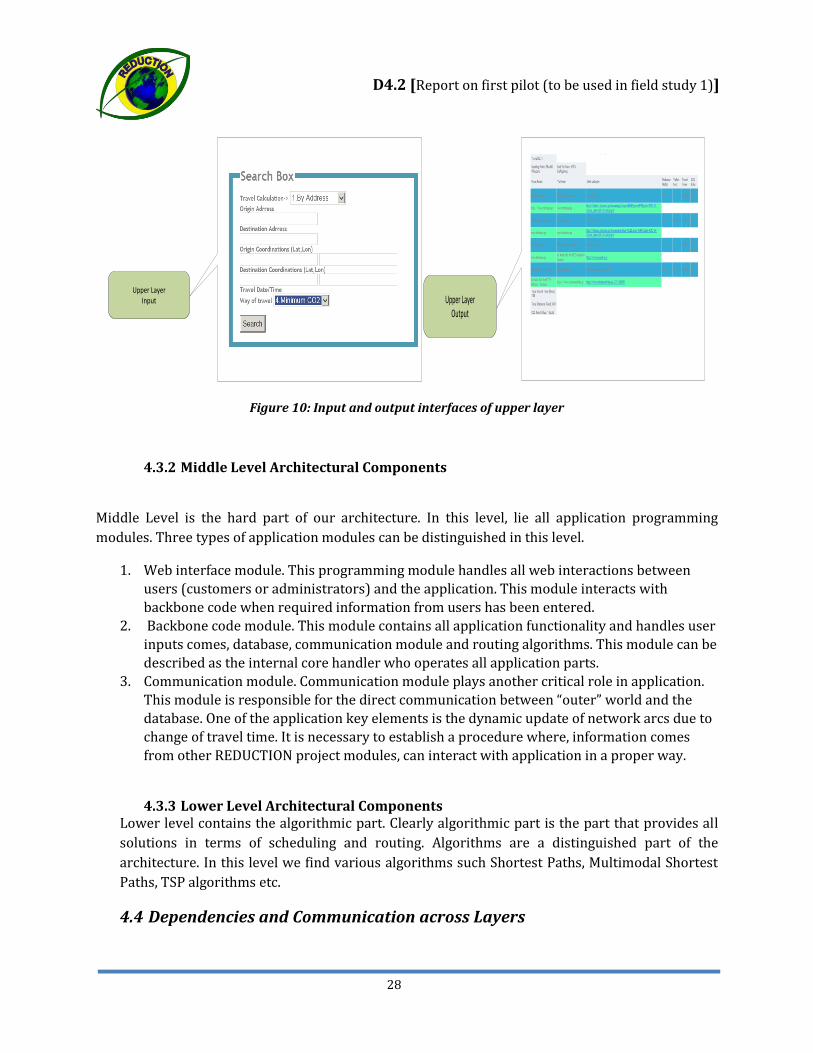
User doesn’t have (no need for this) previous knowledge of the underlying network, or the algorithms used for ECO routes calculation. However user should be able to choose between various ways of transportation. Figure 10 depicts the implemented input/output interfaces.
Upper Layer
Middle Layer Software Components and Database
Central D
atabase
Web InterfaceBackbone Code
Lower Layer Algorithms
Communication Model
Multimodal Algorithms
User Interface Admin Interface
D4.2 [Report on first pilot (to be used in field study 1)]
28
Upper LayerInput Upper Layer
Output
Figure 10: Input and output interfaces of upper layer
4.3.2 Middle Level Architectural Components
Middle Level is the hard part of our architecture. In this level, lie all application programming modules. Three types of application modules can be distinguished in this level.
1. Web interface module. This programming module handles all web interactions between users (customers or administrators) and the application. This module interacts with backbone code when required information from users has been entered.
2. Backbone code module. This module contains all application functionality and handles user inputs comes, database, communication module and routing algorithms. This module can be described as the internal core handler who operates all application parts.
3. Communication module. Communication module plays another critical role in application. This module is responsible for the direct communication between “outer” world and the database. One of the application key elements is the dynamic update of network arcs due to change of travel time. It is necessary to establish a procedure where, information comes from other REDUCTION project modules, can interact with application in a proper way.
4.3.3 Lower Level Architectural Components Lower level contains the algorithmic part. Clearly algorithmic part is the part that provides all solutions in terms of scheduling and routing. Algorithms are a distinguished part of the architecture. In this level we find various algorithms such Shortest Paths, Multimodal Shortest Paths, TSP algorithms etc.
4.4 Dependencies and Communication across Layers

D4.2 [Report on first pilot (to be used in field study 1)]
29
4.4.1 Upper Level to Middle Level Interaction Upper level feeds middle level with users input (see Figure 11). This is possible through Web Interface that is equipped with the necessary functionality. On the other hand web interface sends back to upper level all information regarding route and scheduling results.
Upper LayerInput
Middle LayerWeb Interface
Upper LayerOutPut
Get Input Send Results
Figure 11: Dependencies between upper and middle levels
4.4.2 Middle Layer Sub-Modules Dependencies
Middle level contains three sub-modules. Each one of these sub-modules communicates with each other in different ways. The following Table 6 describes the type of messages and information exchanged between these sub-modules.
Modules Communication Messages exchange
Backbone Code <->Web Interface
Backbone communicates with Web Interface on a demand driven way.
1. Web interface sends user requests to backbone module.
2. Back bone get results from algorithms, formats these results in a presentable way and sends them back to Web Interface
Backbone Code <-> Data Base Backbone communicates with Database on a demand driven way as well.
1. Get information about arcs, nodes, vehicles etc., when user
Web InterfaceBackbone Code

D4.2 [Report on first pilot (to be used in field study 1)]
30
request pops up. 2. Store route, schedule results (if
it is necessary) when results send back to the user.
3. Updates arc information (travel time, CO2 metrics etc.) as the result of communication module triggered event.
Backbone Code <->Communication
Backbone communicates with “Communication” module using polling techniques.
Backbone is getting information from various software daemons concerning Arcs info and updates continuously the database.
Communication<->Outer World (third party software daemons)
Communication module communicates with “outer” world software daemons belong to other project WPs, in order to get information about new arc features. This information exchange is crucial since the idea of eco routes based entirely on the dynamic updates of CO2 metrics.
Table 6: Middle layer component dependencies
4.4.3 Middle Level to Lower Level Interaction
Middle level communicates with lower level via the backbone sub-module. Each time user asks for a route from point A, to point B backbone sub-module in the middle level asks algorithms in lower level in order to produce the exact route and timetable. The exact messaging procedure between these levels and software sub-modules is described in the following Table 7.
Backbone Code
DataBase
Backbone Code Communication

D4.2 [Report on first pilot (to be used in field study 1)]
31
Level communication Messages exchange
Middle Level (Backbone Code) <->Lower Level(Algorithms)
User asks for a route:
1. Backbone sub module communicates with database and retrieves all arcs and nodes required to build the graph network G(V,A)
2. Graph network G(V,A) transmitted to lower level algorithms sub-module.
3. Algorithms sub-module finds the route and transmits it, to middle level backbone sub module.
Table 7: Interaction between middle and lower layers
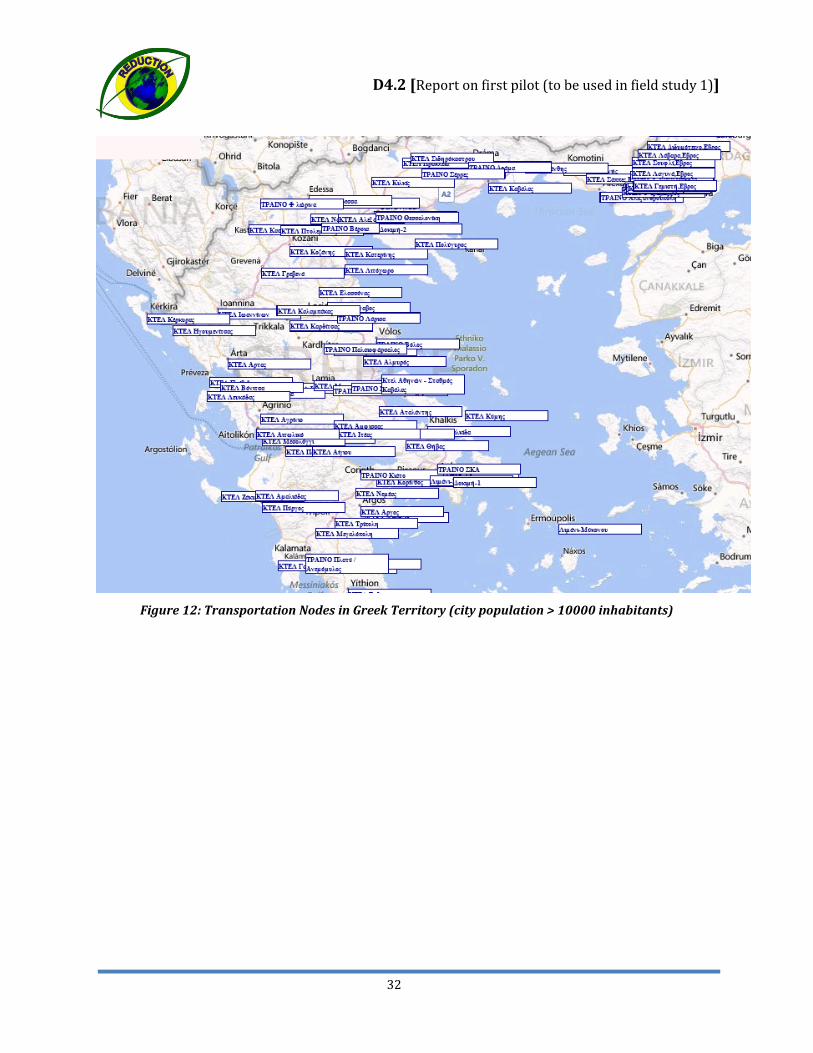
4.4.4 Description of the test site Our test site for the first field trial is the entire Greek Territory. Our transportation network consists of Trains and Intercity Buses. The main idea is to cover each Greek city with population above 10000 inhabitants. Urban buses and metro transportation will be included in the second phase. The following Table 8 describes the real field of our trial web-application.
Transportation Means 1. Trains, 2. Intercity Buses
Nodes 390 (69 intercity bus stations, 321 train stations)
Links 490 (each one with travel distance, time, ticket price)
Table 8: The real field of the TRAINOSE field trial
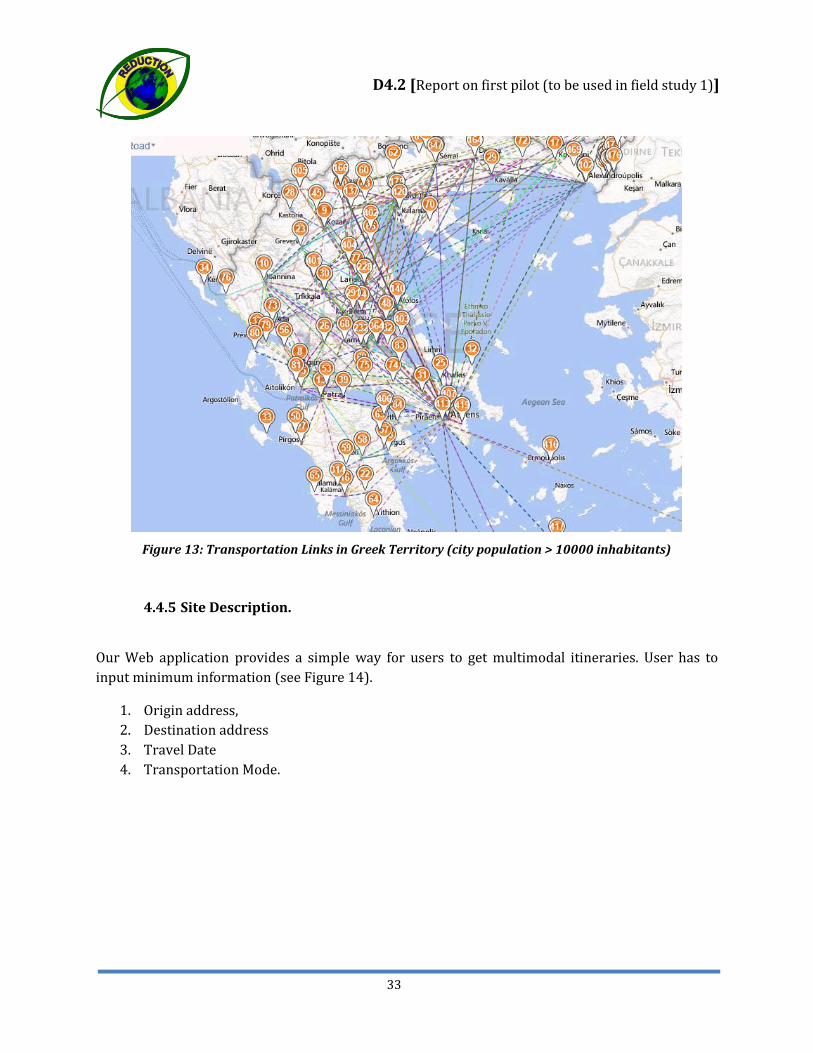
In Figure 12 the Nodes are shown and in Figure 13 Links related the number in Table 8.
Communication
D4.2 [Report on first pilot (to be used in field study 1)]
32
Figure 12: Transportation Nodes in Greek Territory (city population > 10000 inhabitants)
D4.2 [Report on first pilot (to be used in field study 1)]
33
Figure 13: Transportation Links in Greek Territory (city population > 10000 inhabitants)
4.4.5 Site Description.
Our Web application provides a simple way for users to get multimodal itineraries. User has to input minimum information (see Figure 14).
1. Origin address, 2. Destination address 3. Travel Date 4. Transportation Mode.

D4.2 [Report on first pilot (to be used in field study 1)]
34
Figure 14: Multimodal Web Application entry page
Origin address and Destination can be:
1. Ordinary address, where user writes some text for the address 2. Transportation Node (Train Station, or Bus station) 3. Pair of Lat, Lons.
Figure 15 Application menu
If user enters ordinary text address or pair of Lat/Lons, application try to reach the nearest transportation node in a radius of 10 KMs
D4.2 [Report on first pilot (to be used in field study 1)]
35
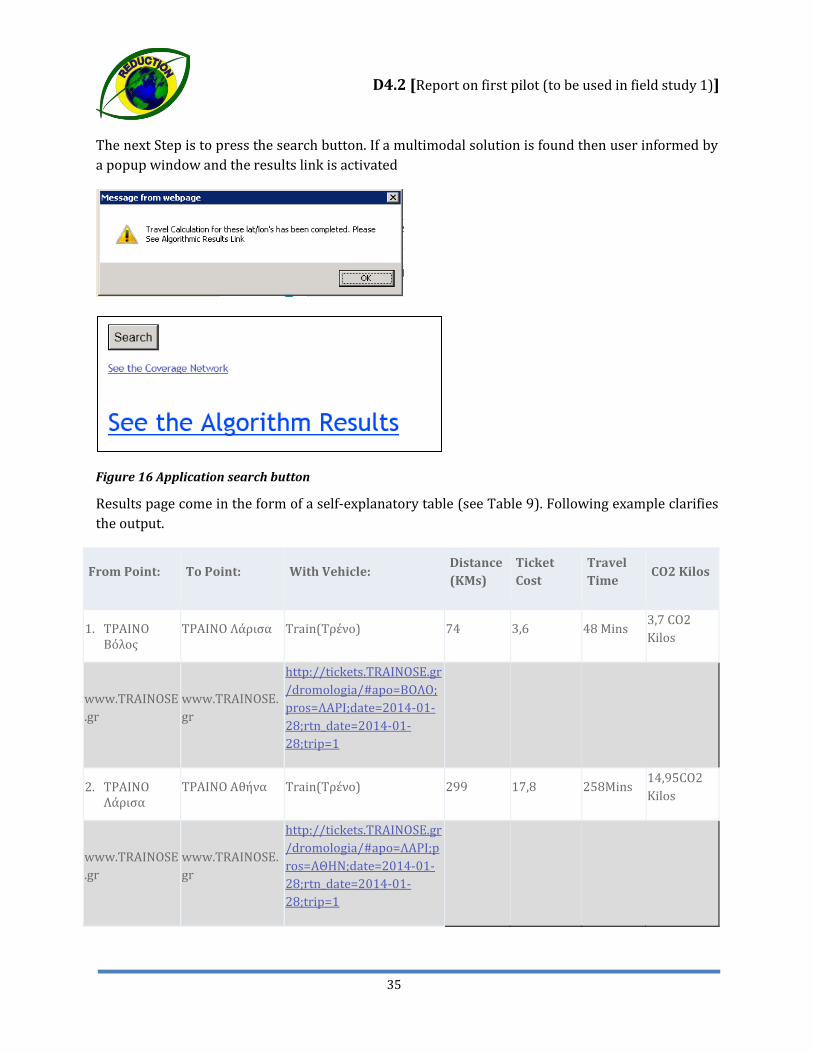
The next Step is to press the search button. If a multimodal solution is found then user informed by a popup window and the results link is activated
Figure 16 Application search button
Results page come in the form of a self-explanatory table (see Table 9). Following example clarifies the output.
From Point: To Point: With Vehicle: Distance(KMs)
Ticket Cost
Travel Time
CO2 Kilos
1. ΤΡΑΙΝΟ Βόλος
ΤΡΑΙΝΟ Λάρισα Train(Τρένο) 74 3,6 48 Mins 3,7 CO2 Kilos
www.TRAINOSE.gr
www.TRAINOSE.gr
http://tickets.TRAINOSE.gr/dromologia/#apo=ΒΟΛΟ;pros=ΛΑΡΙ;date=2014-01-28;rtn_date=2014-01-28;trip=1
2. ΤΡΑΙΝΟ Λάρισα
ΤΡΑΙΝΟ Αθήνα Train(Τρένο) 299 17,8 258Mins 14,95CO2 Kilos
www.TRAINOSE.gr
www.TRAINOSE.gr
http://tickets.TRAINOSE.gr/dromologia/#apo=ΛΑΡΙ;pros=ΑΘΗΝ;date=2014-01-28;rtn_date=2014-01-28;trip=1

D4.2 [Report on first pilot (to be used in field study 1)]
36
3. ΤΡΑΙΝΟ Αθήνα
ΚΤΕΛ Αθηνών - Λιοσίων
Μετρό - Metro 5 1 25 Mins 0,05CO2 Kilos
www.TRAINOSE.gr
No Avail Info for ΚΤΕΛ Αθηνών - Λιοσίων
http://www.ametro.gr
4. ΚΤΕΛ Αθηνών - Λιοσίων
ΚΤΕΛ Καλαμάτας KTEL-Bus(Λεωφορείο ΚΤΕΛ)
248 23 180Mins 124 CO2 Kilos
No Avail Info for ΚΤΕΛ Αθηνών - Λιοσίων
http://www.ktelmessinias.gr
http://www.ktelmessinias.gr, 2721022851
Table 9: Multimodal Trip schedule results table
Example explanation: 1. Customer first takes TRAIN from Volos to Larissa 2. Train from Larissa to Athens 3. Metro from Train station in Athens to Bus station. 4. Intercity bus from Athens to the city of Kalamata.
Web site provides some other hidden functionalities for operators. Each Operator has direct access to nodes/links/vehicles for edit, delete, and add.
Figure 17 Web-API
Web-API for dynamic update has been implemented as well in order to enhance capabilities for dynamic updating.
Operating Technicalities: Web application runs on a Windows 2008 Web Server, Data storage is Microsoft SQL Server, and the development tools are C#, AJAX, JSCRIPT, HTML5

D4.2 [Report on first pilot (to be used in field study 1)]
37
5. Nicosia Field Trial
The Nicosia field trial is focused on exploring aspects of Eco-Driving methodologies described in Work Package 2. In this field trial two fleets will be tested: 1) the first test bed will utilize the OSEL bus fleet (5 buses), 2) the second test bed will utilize the Costas Papaellinas Organization (CPO) delivery fleet (up to 68 vehicles). The CANbus (mainly GNSS and fuel consumption) data collected from the route attributes is intended to provide analytical means for eco-driving and peer-to-peer data mining. In essence the data collected and the analysis will be utilized to develop eco-friendly (fuel efficient) driving profiles for each of the OSEL and CPO drivers who will participate in the field trial. The OSEL and the CPO management will be provided with relevant eco-driving profiles that will aim in the reduction of fuel consumption for each respective company.
The field trial consists of equipping five (5) OSEL Mercedes-Benz CITARO buses with the DDE DELPHI OBU V2X/CCU (OBU On Board Unit), to monitor the impact of driving behaviour on fuel consumption and then propose fuel-efficient driving behaviour. The OBU will be connected to the CITARO CANbus via a custom made port via the CITARO’s Fleet Management System (FMS). The OBU devices will record the CANbus data locally at their own hard disk and in parallel sent them to a central server via a 3G network. The data will then be analysed (GNSS and fuel consumption) using data mining techniques to develop fuel-efficient driving profiles. Subsequently, these proposed driving profiles will be provided to the OSEL management to be presented to the bus drivers who will be requested to adhere to them as closely as possible for a time period of four weeks. The results of this before and after field study will then be summarized in a report to determine whether there were any significant changes in the driving behaviour of the drivers and whether any significant fuel consumption efficiency could be achieved through this methodology of REDUCTION.
Nicosia OSEL Bus Field Study Summary
REDUCTION contribution to OSEL field trial: This architecture is all new for OSEL.
Test Bed: Nicosia Greater Region Number of Buses: 5 Mercedes-Benz CITARO buses Number of Routes: 5 buses operating on the following potential routes with final destinations to the centre of the City at Solomou Square which is the main bus terminal: 116 (Syn. Strovolou), 158 (Pera Horio Nesou), 160 (Geri), 110 (Pano-Lakatameia), 112 (Tseri), 157 (Arediou) Operational times: ranging from 5:00 to 21:00 and frequencies of 15 to 30 minutes during weekdays and up to 90 minutes on the weekends Length of route: ranges from 4 to 20 Km as most of the routes cover communities outside the greater Nicosia region while all arriving at the centre of the City of Nicosia at the main bus terminal of Solomou Square. Clients: five (5) OBU devices; to be installed at each bus Servers: one server and one back-up server provided by Istognosis Ltd. Company Wireless communication: From/To OBU devices, To/From server via 3G MTN network
D4.2 [Report on first pilot (to be used in field study 1)]
38
Development of OSEL fuel-efficient driving profiles: REDUCTION contribution to OSEL.
Nicosia CPO Fleet Field Trial Summary
REDUCTION contribution to CPO field trial: The CPO already implemented a fleet management system. The main new aspect of the CPO field trial will be the development of fuel-efficient driving profiles that will be based on the methodologies that will be developed by the REDUCTION partners.
Test Bed: Nicosia Greater Region with potential of utilizing the entire Cyprus region Number of delivery vehicles: up to 68 Number of deliveries per day p Operational times: ranging from 7:00 to 18:00 Length of routes: ranges from 2 to110 Km; where the longer trips refer to deliveries from Nicosia to Paphos area and the shorter trips within the Nicosia region. Clients: up to 68 FMS devices; already installed by the system integrator Istognosis Ltd. Company (external to REDUCTION) Servers: one server and one back-up server provided by Istognosis Ltd. Company (external to REDUCTION) Wireless communication: From/To FMS devices, To/From server via 3G MTN network (external to REDUCTION) Development of CPO fuel-efficient driving profiles: Main REDUCTION contribution to CPO.
5.1 Pilot Software Architecture
The architecture of the OSEL Bus Field trial system will be based on the paradigm of client server realized in four layers, namely: data capture layer that will be realized by a number of clients, application layer, database layer and web interface as an additional layer. The same architecture applies to the CPO field trial. The main difference is the client, where under the OSEL field trial the client is the OBU (to be installed under REDUCTION) and under the CPO the client is the already installed FMS device. A detailed pictorial description of the architecture used to conduct the Nicosia field trial is shown in Figure 18.
System's clients will mainly concentrate on data capture activities through monitoring the on-board sensors via sniffing the transmission lines of the bus's local area network. Each client will be composed of a number of modules. Depending whether the transmission of the monitored data will be realized in real-time or batch mode the analogous data transmission modules will be activated on the clients. Specifically for real time transmission a 3G mobile network will be utilised. For batch processing the data will be stored on the clients' data store and uploaded on the data server using an ftp connection with the server-side, upon entering the Wi-Fi zone of the bus depot. Client sub-systems will be installed on five OSEL CITARO Mercedes-Benz buses. Clients will be equipped with the Delphi Delco Electronics GMBH (DDE) DDE DELPHI OBU V2X/CCU device (OBU).

D4.2 [Report on first pilot (to be used in field study 1)]
39
Data sniffing will be achieved through the OBU that reads data indirectly from the wiring of the buses LAN and via the Fleet Management wirings since the OBD port of the CANbus can only be hooked to a proprietary CITARO Mercedes-Benz device. The CANBus data that will be read by the OBU are: GNSS, fuel consumption and GHG emissions
Backup Database Server
Data Warehouse
Data Collector
Data Compressor
Data Recorder
Data Transmitter(3G)
Data Transformation and Cleansing
Sensors
Data Capture & Converter
Web Interface
Data Recorder
Data Replicator
Data Retriever
Data Analysis
Data Visualiser
Data Warehouse
Client Side -Data Monitor
Web Server
Database Server
Application Server
UI
1M
Real Time
Batch Processing
GIS
Local Datastore
1
M
Data Transmitter(Wifi)
Figure 18: Nicosia field trial architecturediagram
The server side of the architecture will mainly address the data warehousing functionality and will be composed of a web server for real time communication with the clients, an application server accountable for data analysis and visualization using an embedded GIS subsystem and UI functionalities. The back end of the architecture will mainly focus on data storage and retrieval functions along with data replication. Pre-processing of the raw data from the on-board sensors will be performed by the clients hence the data will be ready for storage upon arriving to the data

D4.2 [Report on first pilot (to be used in field study 1)]
40
server. Data transmitted to the server via 3G will be compared with batch-mode data, firstly for validation purposes, secondly to test the robustness of the communications network and thirdly to check the capabilities of OBU to operate in real-time environments. The populated data warehouse will be mined using relevance analysis and association rules techniques to identify possible links between driving behaviours and fuel/CO2 emission plus, the identification of driver profiles using cluster analysis.
Data Processing. The main data processing functions that will take place at the server-side include:
1. All GNSS, fuel consumption and GHG emissions data will be temporarily stored at the OBU SSD and if feasible will be sent in real-time using a 3G wireless service connection to the webserver
2. Data stored at the OBU SSD will be uploaded to the webserver periodically using an ftp connection on a daily basis (at a specific time at night).
3. All GNSS data will be map-matched to the Nicosia GIS (obtained from the Ministry of Communications and Works) and will be also superimposed on Google maps. The openGIS software will be used.
4. Evaluate the V2V/V2I capabilities of the OBU device and the wireless communication system based on the data quality, route black spots, data recording by the Webserver
a. V2I Communication: Data transmitted from the OBU to the Webserver
i. Identify “dead spots” of the GNSS and/or the wireless service,
ii. Report all communication “errors” as reported by the OBU
iii. Compare the data stored at the SSD with the data send in real-time to the web-server via 3G.
b. V2V Communication: Data from one My-FI installed in one bus to the OBU of other buses operating at the same time. It is emphasized that the V2V evaluation will be limited to data transmission as no V2V actions will be undertaken due to the limited budgetary constraints for this field trial.
i. Compare messages sent from one OBU and stored to another OBU.
5. Development of a set of driving profiles per driver using vehicle location, speed fuel consumption and GHG:
a. Vehicle Speed Profile (Distance vs. Vehicle Speed)
b. Vehicle/Driver Fuel Consumption (Distance vs. Fuel Consumption); aggregated at the link level
D4.2 [Report on first pilot (to be used in field study 1)]
41
c. Vehicle/Driver GHG Consumption (Distance vs. Fuel Consumption); aggregated at the link level
6. Identification of efficient and non-efficient driving patterns for specific roadway sections with respect to fuel consumption and GHG emissions.
5.2 Distributed Data Mining Aspect of Nicosia Field Trial
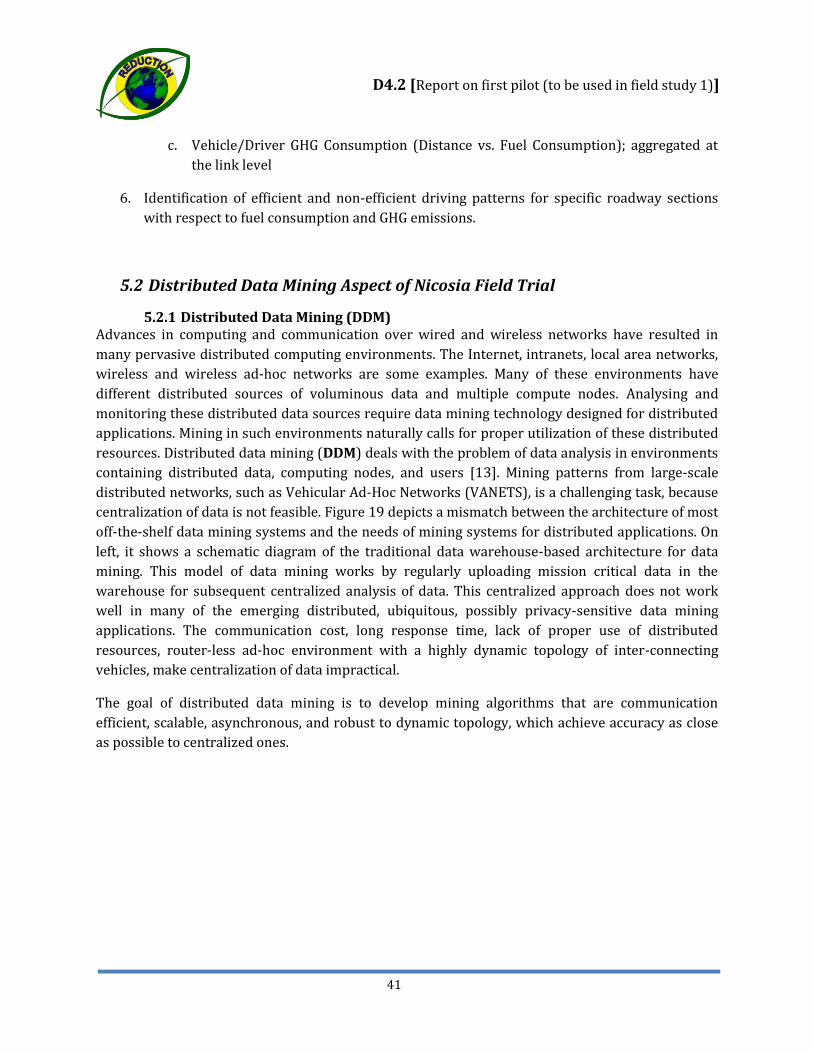
5.2.1 Distributed Data Mining (DDM) Advances in computing and communication over wired and wireless networks have resulted in many pervasive distributed computing environments. The Internet, intranets, local area networks, wireless and wireless ad-hoc networks are some examples. Many of these environments have different distributed sources of voluminous data and multiple compute nodes. Analysing and monitoring these distributed data sources require data mining technology designed for distributed applications. Mining in such environments naturally calls for proper utilization of these distributed resources. Distributed data mining (DDM) deals with the problem of data analysis in environments containing distributed data, computing nodes, and users [13]. Mining patterns from large-scale distributed networks, such as Vehicular Ad-Hoc Networks (VANETS), is a challenging task, because centralization of data is not feasible. Figure 19 depicts a mismatch between the architecture of most off-the-shelf data mining systems and the needs of mining systems for distributed applications. On left, it shows a schematic diagram of the traditional data warehouse-based architecture for data mining. This model of data mining works by regularly uploading mission critical data in the warehouse for subsequent centralized analysis of data. This centralized approach does not work well in many of the emerging distributed, ubiquitous, possibly privacy-sensitive data mining applications. The communication cost, long response time, lack of proper use of distributed resources, router-less ad-hoc environment with a highly dynamic topology of inter-connecting vehicles, make centralization of data impractical.
The goal of distributed data mining is to develop mining algorithms that are communication efficient, scalable, asynchronous, and robust to dynamic topology, which achieve accuracy as close as possible to centralized ones.
D4.2 [Report on first pilot (to be used in field study 1)]
42
Figure 19: Conceptual architecture of centralized vs. distributed data mining
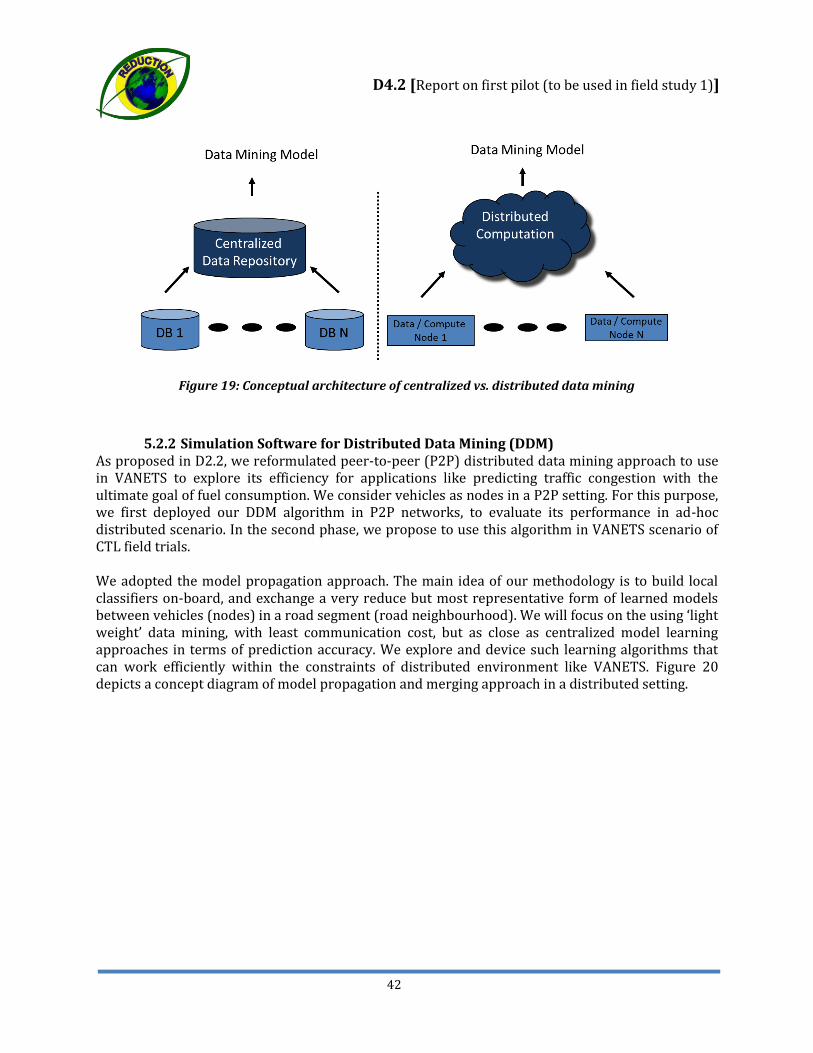
5.2.2 Simulation Software for Distributed Data Mining (DDM) As proposed in D2.2, we reformulated peer-to-peer (P2P) distributed data mining approach to use in VANETS to explore its efficiency for applications like predicting traffic congestion with the ultimate goal of fuel consumption. We consider vehicles as nodes in a P2P setting. For this purpose, we first deployed our DDM algorithm in P2P networks, to evaluate its performance in ad-hoc distributed scenario. In the second phase, we propose to use this algorithm in VANETS scenario of CTL field trials. We adopted the model propagation approach. The main idea of our methodology is to build local classifiers on-board, and exchange a very reduce but most representative form of learned models between vehicles (nodes) in a road segment (road neighbourhood). We will focus on the using ‘light weight’ data mining, with least communication cost, but as close as centralized model learning approaches in terms of prediction accuracy. We explore and device such learning algorithms that can work efficiently within the constraints of distributed environment like VANETS. Figure 20 depicts a concept diagram of model propagation and merging approach in a distributed setting.
D4.2 [Report on first pilot (to be used in field study 1)]
43
Figure 20: Model propagation and merging
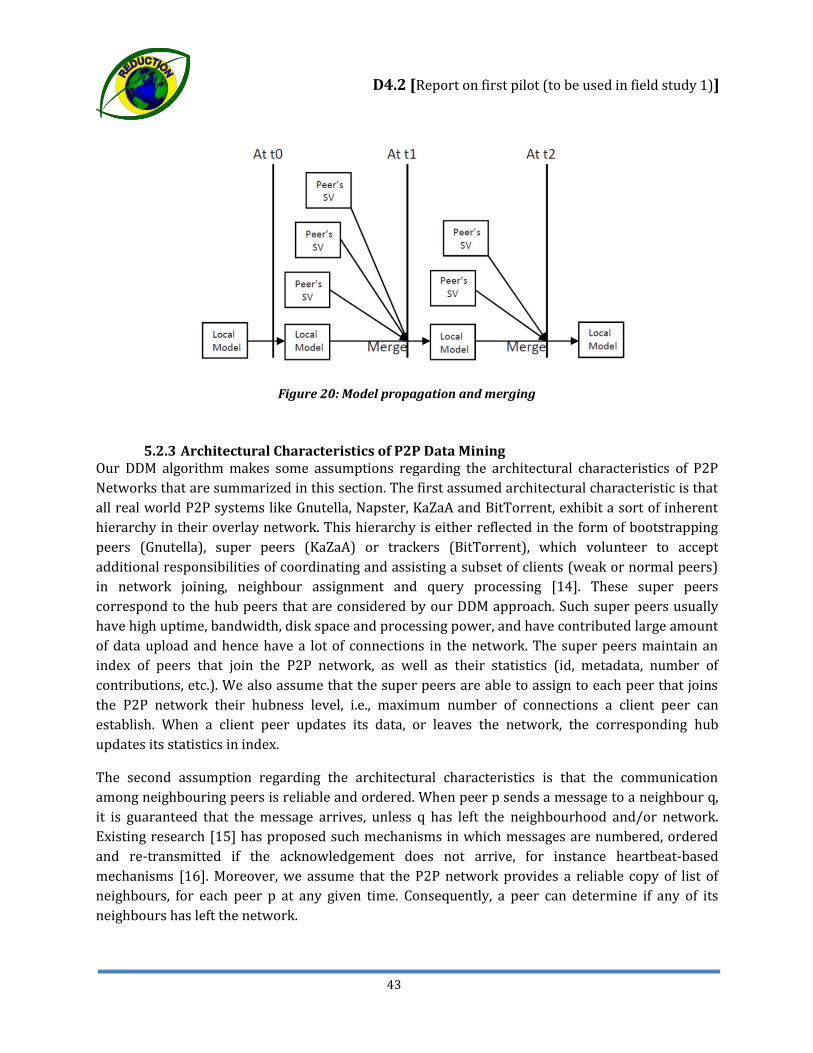
5.2.3 Architectural Characteristics of P2P Data Mining Our DDM algorithm makes some assumptions regarding the architectural characteristics of P2P Networks that are summarized in this section. The first assumed architectural characteristic is that all real world P2P systems like Gnutella, Napster, KaZaA and BitTorrent, exhibit a sort of inherent hierarchy in their overlay network. This hierarchy is either reflected in the form of bootstrapping peers (Gnutella), super peers (KaZaA) or trackers (BitTorrent), which volunteer to accept additional responsibilities of coordinating and assisting a subset of clients (weak or normal peers) in network joining, neighbour assignment and query processing [14]. These super peers correspond to the hub peers that are considered by our DDM approach. Such super peers usually have high uptime, bandwidth, disk space and processing power, and have contributed large amount of data upload and hence have a lot of connections in the network. The super peers maintain an index of peers that join the P2P network, as well as their statistics (id, metadata, number of contributions, etc.). We also assume that the super peers are able to assign to each peer that joins the P2P network their hubness level, i.e., maximum number of connections a client peer can establish. When a client peer updates its data, or leaves the network, the corresponding hub updates its statistics in index.
The second assumption regarding the architectural characteristics is that the communication among neighbouring peers is reliable and ordered. When peer p sends a message to a neighbour q, it is guaranteed that the message arrives, unless q has left the neighbourhood and/or network. Existing research [15] has proposed such mechanisms in which messages are numbered, ordered and re-transmitted if the acknowledgement does not arrive, for instance heartbeat-based mechanisms [16]. Moreover, we assume that the P2P network provides a reliable copy of list of neighbours, for each peer p at any given time. Consequently, a peer can determine if any of its neighbours has left the network.

D4.2 [Report on first pilot (to be used in field study 1)]
44
5.2.4 P2P Network Topology for DDM
Evaluating our proposed approach needs to determine the network topology with edge delays and local computations at each peer with message exchange. To generate a power law distribution of peers, we used Barabasi-Albert model [17]. This model suggests two possible causes for the emergence of a power law in the frequency of out degrees in network topologies: incremental growth and preferential connectivity. Incremental growth refers to growing networks that are formed by the continual addition of new nodes, and thus the gradual increase in the size of the network. Preferential connectivity refers to the tendency of a new node to connect to existing nodes that are highly connected or popular. Here a joining peer p connects to an existing peer q with a probability
where dq is degree of existing node q, V is the set of nodes that have already joined the network, and denominator is the sum of degrees of all nodes that previously joined the network.
For this purpose we used the BRITE software for generating topologies of P2P networks [18]. Other BRITE parameters we used are HS =1; 000, LS =100 (size of plane) and constant bandwidth distribution with MaxBW =1; 024 and MinBW =10 (please refer to BRITE documentation for more details: www.cs.bu.edu/brite). The result is a topology represented by a weighted graph with edge weights representing communication delays in milliseconds. We evaluated our experiments with varied number of peers ranging from 100 to 500. We did not experiment with more peers, since it would result in unrealistically small sizes of local data at peers and could adversely a affect the performance of P2P classification systems. For local computation at each peer and monitoring of message exchange, we have built our own simulator (using Java) that simulates distributed dynamic P2P overlay trees. We have used communication delays on BRITE network graph as measurement of time. Local computations and message exchange are regulated with change of network state, with respect to a common global clock of a simulator. Figure 21 reflects the BRITE interface for creating a customized network topology.

D4.2 [Report on first pilot (to be used in field study 1)]
45
Figure 21: BRITE universal topology generator (source: http://www.cs.bu.edu/brite)
For local computation at each peer and monitoring of message exchange, we have built our own simulator (using Java) that simulates distributed dynamic P2P overlay trees. We have used communication delays on BRITE network graph as measurement of time. Local computations and message exchange are regulated with change of network state, with respect to a common global clock of a simulator. Simulation is executed on a cluster of 41 machines, each with 10 Intel-Xeon 2.4GHz processors, 20GB of Ram, and connected by gigabit Ethernet. Figure 22 depicts the power-law topology in a P2P network.
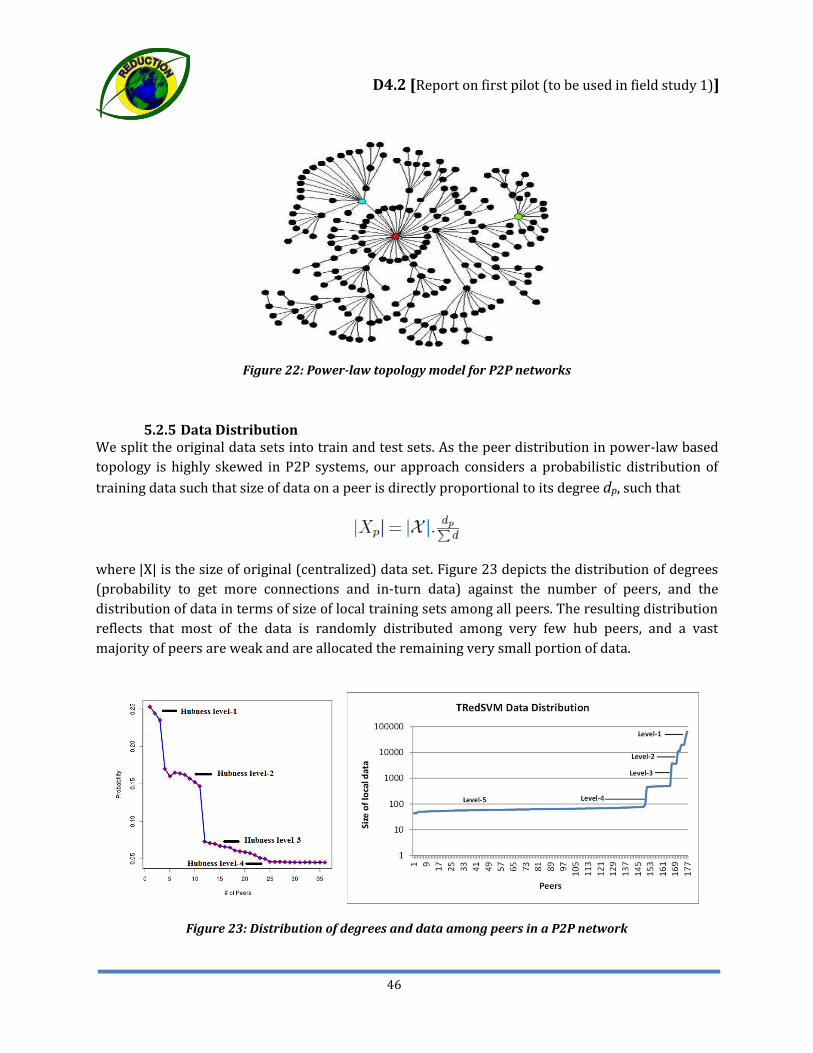
D4.2 [Report on first pilot (to be used in field study 1)]
46
Figure 22: Power-law topology model for P2P networks
5.2.5 Data Distribution We split the original data sets into train and test sets. As the peer distribution in power-law based topology is highly skewed in P2P systems, our approach considers a probabilistic distribution of training data such that size of data on a peer is directly proportional to its degree dp, such that
where | X| is the size of original (centralized) data set. Figure 23 depicts the distribution of degrees (probability to get more connections and in-turn data) against the number of peers, and the distribution of data in terms of size of local training sets among all peers. The resulting distribution reflects that most of the data is randomly distributed among very few hub peers, and a vast majority of peers are weak and are allocated the remaining very small portion of data.
Figure 23: Distribution of degrees and data among peers in a P2P network

D4.2 [Report on first pilot (to be used in field study 1)]
47
5.2.6 Mapping P2P Data Mining Architecture to Nikosia Field Trial Testing distributed predictive models in Nicosia field trials demands the following requirements specification:
An on-board computing device to execute the algorithm on each bus
Bus-to-bus reliable data packets exchange
Specification of communication range
Specification of vehicle neighbourhood i.e. buses in one road segment form a cluster and each bus communicates with another bus only in its own cluster or road segment.
5.2.7 P2P Data Mining Scenario for Nicosia Field Trial Assuming above mentioned requirements are fulfilled, a learning algorithm developed by UHI will be installed to on-board computing device in each bus. Algorithm will be trained on a local data set provided in each bus. The data set will be comprised of traffic situation and can be learned to predict congestion. The resulting local model will be used to classify current traffic condition of road segment into congestion or not congestion. Each bus shares its leaned model (knowledge) with its neighbouring vehicle. This transmission will be specified by communication requirements as mentioned above.
After receiving models from neighbouring vehicles, local algorithm on each bus, add this knowledge to its own model. The final classification will be made to test whether this communication and merging of locally learned models, has increased the global prediction accuracy of congestion in the buses in this road segment. After classifying the current traffic situation, on-board system will alarm the drivers whenever the congestion is notified. Drivers are required to take appropriate actions accordingly i.e. either to slow down before approaching a congestion or take an alternative route to save time and fuel.
D4.2 [Report on first pilot (to be used in field study 1)]
48
6. Trinité Field Trial
Trinité will offer a new field trial in the scope of REDUCTION aiming at eco-routing services for individual users. The final outcome of the field trial will be a functional iPhone application targeting individual users, which computes the best eco-route for travelling between two destinations.
A platform named “Digital Road Guide” will process the historic and real time information gathered by the App. This way even more information will be combined in order to give the best route advice. This advice can be delivered to the in-car app or to neighbouring networks.
6.1 Field Trial Overview In order to contribute on the goals of Optimizing driving behaviour, and Eco-routing the REDUCTION App is designed to stimulate users to reduce CO2 emission. The third option, supporting for multi-modality can be added in the future but is not implemented in the current version. This Deliverable will describe the technique and first field test using the REDUCTION App. The Field test will contain the following phases:
Phase 1: Register and collect data in central database using in the in-car App for CO2 calculation
Phase 2: Calibrate the CO2 emission data with actual fuel consumption. Phase 3: Using collected data, as input for the Digital Road Guide to give route advise to
users
6.1.1 Field Trial Goals The first field test should deliver insight to several points of interest, and specifically answer:
Is the collected data suitable for calculating the CO2 emission and advising specific eco-friendly routes?
Are the techniques used suitable for up scaling to use the REDUCTION App with large numbers of users?
6.2 Overview of Trinité’s Application
The REDUCTION app on IPhone main purpose is to reduce CO2 emission. This is done by two ways:
- Optimizing driving behaviour, Eco-driving
- Personalized Eco-routing
D4.2 [Report on first pilot (to be used in field study 1)]
49
6.3 Optimizing driving behaviour: Eco-driving
The Eco-driving can be divided into two cases: the off-line case and the on-line case, since there are two options to deliver the feedback to the vehicle. The categorization is done based on the relative delay of the response. On-line feedback reflects the instantaneous messaging of the feedback to the vehicle, reflecting his behaviour in short and recent data measurements. In typical applications the vehicle driver is able to adopt his behaviour almost immediately. On the other side, the off-line analysis refers to providing feedback as a result of an analysis of a longer period of behaviour data, typically days, weeks or months. In the end of the period, off-line analysis helps to detect trends, anomalies or regularities along the whole duration of analysis. The ultimate feedback is given periodically, so the driver can adopt the behaviour in longer future terms. More details of two cases can be seen from [21].
6.3.1 Eco-driving off-line The off-line case the vehicle related data including GPS and CO2 emission data are stored in database. The data could be accessed from a web interface. Then the data constituting the driving pattern over long-term distances will be collected and analysed. Such offline processing aims at detecting and identifying certain driving patterns of a driver in comparison to other driver’s behaviours under similar driving conditions. In the end of the analysis classification and cluster feedback will be provided to the drivers and the fleet managers. Then drivers can be educated to adapt their driving behaviour off-line.
6.3.1 Eco-driving on-line The on-line case the real-time vehicle related data are also available. The driving behaviour will be described via collected signals and IPhone sensor inputs, such as speed, accelerator. Best way to implement the Eco-driving algorithms is by connecting to the vehicle CANBus for receiving messages like speed, acceleration, gear-change, brakes and fuel consumption. Since this interface is not available for the field test, then a method called VT-Micro model [22] is used to estimate fuel consumption. Our prediction model will use the recent messages of a specified time window and build an advisory method which outputs certain feedback warning messages to the driver in case non Eco-friendly driving pattern was detected. In-car devices such as the app for IPhone can be used to display the warning message.
6.4 Personalized Eco-routing Personalized Eco-routing consists of a set of methods, which compute an estimated itinerary between requested endpoints, such that an overall fuel-efficient objective function is optimized [20]. Each of the driver’s driving history (including travelled road segments and used time to pass across the segments) is stored in database. This will be done automatically by recording GPS data that the vehicle transmits real time to the system. So the GPS data will be sent frequently, online from vehicle to the central system. Next in order to check for a route from A to B, the driver will send the query to central system. The system will compute a path using any path-finding algorithms on graph, where the predicted time of the travel will be estimated as described in [20], using his profile.

D4.2 [Report on first pilot (to be used in field study 1)]
50
Users are able to generate their own routes by logging in and starting the app. The app is able to distinguish four different types of routes: most economical route (cleanest), fastest route, shortest route and current path. Also, the app will show these four different routes bases on the users’ preferences. Users are able to enter an abstract destination name when they reach their destination. When a user logs in again, the destination will be in a destination picker view. During a ride the app sends out a signal to the database every ten seconds containing the cur- rent position of the user, from this data routes can be visualized. When a non-eco-friendly route is used a message is set to inform the user. When a user reaches his destination, the app will display results of the current ride and average results of ride with the same origin and destination. The following results will be shown: travel time, average travel time, difference; travelled distance, average travelled distance, difference; consumed fuel, average consumed fuel, difference; Emitted CO2, average emitted CO2, difference. By providing these results, the user will be more aware and be able to decide which route to take.
6.5 Design of REDUCTION App
The eco-routing application developed by Trinité for the iPhone mobile device is named “REDUCTION” and consists of four main parts (see Figure 24).
Figure 24: Architecture diagram of the IPhone application
1) Xcode project, iOS app: App designed to use in-car to collect data and inform the user.
2) REDUCTION database: Database to store all information. Used for analytics and route advice
3) PHP server: Data collecting point where all REDUCTION app information is gathered.
REDUCTION DB
PHP server
iOS app Digital Road Guide

D4.2 [Report on first pilot (to be used in field study 1)]
51
4) Digital Road Guide: All gathered information is send to the Digital Road Guide to calculate the route information.
6.5.1 Design criteria While designing the software for the iOS app the following directives are used to optimize the software, specifically the wireless data stream to the php server.
Objects communicate thru get and set methods Only specified objects can communicate to each other. If possible calculations done locally on the IPhone Returning only relevant data from the database by making the selects specific, reducing
the overhead. A request to the DB will be dropped if the request fails. Preventing sending same data
over and over again. Communication between server and IPhone is done in XML-messages to make in
uniform.
Using the directive the created app meets the following criteria:
1. Conserving iPhone memory usage
2. Conserving iPhone battery life 3. Conserving iPhone CPU usage
4. Conserving iPhone data usage 5. Conserving network load database
6. Conserving computing capabilities database
While trying to meet the criteria, the GPS functionality consumes a great deal of battery power. This is not a problem for the test because of the availability of a power point in the car.

D4.2 [Report on first pilot (to be used in field study 1)]
52
6.5.2 Use cases
Figure 25: Use cases of the IPhone application
In order to start developing the App the following use cases are defined and elaborated (as seen in Figure 25).
1. Create account: Initializes a user profile for authentication 2. Ride: Request an itinerary path for the desired route
3. Change settings IPhone App: Update the profile settings of the app
4. Existing destination: Utilise a cache of frequently iterated paths 5. New destination: Allows user to request new routes
6. Set destination: Finalize the selection of a destination 7. Logging in: Authenticate and connect to the application service 8. Change settings App: Change the global settings of the application
6.5.3 Using the REDUCTION App

D4.2 [Report on first pilot (to be used in field study 1)]
53
The “REDUCTION” App delivers the following interface while driving as depicted in Figure 26.
The Digital Road Guide calculates the real-time route information and while driving towards a destination four different routes are visualized, depending on user preferences.
- Green line: cleanest route or economical route;
- Purple line: current route;
- Blue line: fastest route;
- Red line: shortest route.
While driving the following data is shown:
- Fuel consumption (L/100Km)
- CO2 emission (g/m)
- Speed (Km/h)
Figure 26: The iPhone App
If a non-Eco-friendly driving pattern is detected a user will receive a warning message.
When a user arrives at his destination, the result screen will pop up. In this view the user can see the following results:
travel time results;
fuel consumption results;
CO2 emission results;
travelled distance results.
For each of these results there will be data about the current results, averages and the difference between the averages and current results.

D4.2 [Report on first pilot (to be used in field study 1)]
54
6.6 Trinité Field Test
The field test consists of the following three phases:
Phase 1: register and collect data in central database using in the in-car App for CO2 calculation
Phase 2: calibrate the CO2 emission data with actual fuel consumption.
Phase 3: Using collected data, as input for the Digital Road Guide to give route advice to users
6.6.1 Phase 1: Register and collect data in central database and CO2 emission calculation
In order to collect data to a field test will be conducted. In order to create a test panel with app users, a company specialized in leasing company cars has been contacted. In this first field test a select number of 30 people driving a company car will use the app four weeks. This time is used to examine the following points:
- Connection problems between IPhone and PHP-server
- Connection problems between PHP-server and database
- Data usage app
- Load of PHP-server
- Calculation of CO2 emission
- Calculation of estimated fuel consumption
Users of the app will have to follow the following rules:
- Using the app every time they make a trip.
- Note when refuelling, and note the mileage/ amount of fuel / time and date.

D4.2 [Report on first pilot (to be used in field study 1)]
55
With the collected data the CO2 emission will be calculated. The methods for estimating fuel consumption and GHG emission are the result of several years of development. In the context of road transportation, Fuel consumption and GHG emission models are classified into macroscopic and microscopic models in [21]. In this paper, the VT-Micro model [22] is used to estimate fuel consumption and GHG emission. The VT-Micro model is as follows:
(1)
Where MOEe: fuel consumption or emission rate (gal/h or mg/s); k: model regression coefficients; v: speed (ft/s); a: acceleration (ft/s2). The model regression coefficient k can be found in [22]. To calculate the CO2 emission and fuel consumption by using the VT-Micro model, the application only need to know the current speed and acceleration. The acceleration can be calculated by speeds difference of two points dividing by the time difference. For example, a car drives with 19m/s at t=0s and 22m/s at t=1s. Speeds difference of two points is 3m/s and the time difference is 1s, so the acceleration is 3m/s. We need to pay attention to units in model 1. We can see that foot/sec and foot/sec2 are used for speed and acceleration. However, the application receives speed in km/h it. Therefore, the unit has to be converted to the same unit in the model. This is done by dividing the speed by the constant value 1.09728 and then the fuel consumption can be calculated in gal/h. The application shows the fuel consumption in l/100km, so we have to convert it from gal/h to l/100km which is done by multiply fuel by 3.78541178*fuel/speed*100.
The VT-micro model does not estimate CO2 emissions. But, since there is almost an affine relationship between fuel consumption and CO2 emissions [23], we can estimate CO2 emissions by the following model:
(2)
Where δ1 = 1.17 × 10⁻⁵ and δ2 = 2.65 for a diesel-fuel car. The model estimates the CO2 emissions in kg/m.
6.6.2 Phase 2: Calibrate the CO2 emission data with actual fuel consumption
Using the calculations for CO2 emission does not guarantee success. We have to create a second source in order to verify the calculated data. This is done by the computing the gas and mileage data noted by the drivers. Every time the car is refuelled this is noted. With this data we can calculate fuel consumption. These numbers will be matched with the calculated data from the app.

D4.2 [Report on first pilot (to be used in field study 1)]
56
6.6.3 Phase 3: Digital Road Guide to give route advise to users Phase three of the field test will include middleware services that will act as enablers of decentralized algorithms and applications faced with the difficult task of sharing real-time streams of UTF mission-critical critical data and information over intermittently connected vehicular networks. Following REDUCTION‘s decentralized computing approach, this middleware platform service components will be distributed on vehicles to tackle the real-time data movement needs of the overlayed analysis algorithms and applications. In addition, the platform will include a back-end server for the benefit of the UTF’s access to real-time fleet data as well as for longer-term data analysis and reporting.
The Digital Road Guide uses the real-time information to calculate the most economic and Eco-friendly route. Since the Digital Road Guide also communicates with neighbouring Digital Road Guide information about the route can be shared in order to optimize the network.
Figure 27: DSS data pool
D4.2 [Report on first pilot (to be used in field study 1)]
57
DSS datapool: Dynamic Subscribe System (DSS) datapool (see Figure 27) is a real-time publish-subscribe distributed middleware. It provides a level of abstraction, by hiding the complexity of a variety of platforms, networks and low-level process communication. Application developers may concentrate on the current requirements of the software to be developed, and use lower-level services provided by the middleware when necessary. Trinivision: A standard DSS user interface that is presenting DSS visual objects. It can be used in both personal computers and smart phones via a web application. MySQL-bridge: The interface between the DSS Datapool and database. DSS uses it to read/write data from/to database. MySql Database Bridge is used within the Trafficlink environment.
DVM-bridge: Universal interface between other active traffic management systems.
Besides the middleware functionality the DSS datapool also addresses the business logic. All above objects are implemented in the datapool. The objects within the DSS datapool are explained below.
Digital Road Guide: It gets real time information and with this information it calculates route information. All kind of data (historical / real time) can be used from different sensors (CO2, weather, travel time, speed etc.) The route information can be send to in-car equipment but also to neighbouring Digital Road Guides in order to optimize the network.
CarObject: It gets real-time data of vehicle related data through signal updates and stores the data in database. The prediction model in T2.2 will be applied in this object. Network: consists of a number of sub networks and calculates the performance of the combined sub networks with real-time data. Subnetwork: consists of a number of routes from the network, including the calculation of the performance of the combined routes with real time data. Route: It consists of a number of links. It manages the set of routes from one origin to one destination. It gets GPS data and CO2 emission data from CarObject or other sensors. It also gets real-time data of links through signal updates. The Eco-routing algorithms in T3.3 will be applied in this object.

D4.2 [Report on first pilot (to be used in field study 1)]
58
6.7 Trinité Future plans
In the future several points can be examined to improve and extend the system.
- Increase number of users
- Integrating with other systems (weather forecast, CO2 measurement etc. )
- Tuning app using historical data
- Multi model integration
- Extending the App with the functionality to enter mileage and refuel information
D4.2 [Report on first pilot (to be used in field study 1)]
59
7. V2V and V2I communication Next-generation telematics solutions are being driven by the maturation of recently deployed intelligent transportation systems, assisted by the integration of and rapid collaboration with information communication technology markets and the automotive industry. Inter-vehicle communication (IVC) has emerged as a promising field of research and development, where advances in wireless and mobile ad-hoc networks can be applied to real-life problems (traffic jams, fuel consumption, pollutant emissions, and road accidents) and lead to a great market potential. Already, several major automobile manufacturers and research centres are investigating the development of IVC protocols, systems (e.g., DSRC, 802.11p) and the use of inter-vehicle communication for the establishment of Vehicular Ad-hoc NETworks (VANETs).
Vehicular networks have the diverse range of applications that varies from safety applications to comfort applications. Safety applications enhances the driving conditions by reducing the chances of accidents by providing enough time to the driver and applying the brakes automatically (eco-driving). Intelligent transport applications aim at providing faster delivery of traffic information, and improving the efficiency and accuracy of traffic detection by allowing collaborative processing of information between vehicles. These applications focus on observing the traffic pattern and managing traffic accordingly (eco-routing). Comfort applications are the applications of VANET related to comfort level of the passenger moving in the vehicle.
REDUCTION follows an interdisciplinary approach and brings together expertise from several communities. Its innovative, decentralized architecture allows scalability to large fleets by combining both V2V and V2I approaches. Its planned commercial exploitation, based on its proposed cutting-edge technology, aims at providing a major breakthrough in the fast growing market of services for "green" fleets in EU and worldwide, and present substantial impact to the challenging environmental goals of EU.
7.1 IEEE 802.11p architecture for running the CTL field trial The next sections describe the communications and networking architecture used for running the CTL filed trial.
7.1.1 The components of the developer’s software The IEEE 802.11p standard is meant to:
Describe the functions and services required by WAVE-conformant stations to operate in a rapidly varying environment and exchange messages without having to join a Basic Service Set (BSS), as in the traditional IEEE 802.11 use case.
Define the WAVE signalling technique and interface functions that are controlled by the IEEE 802.11 MAC.
7.1.2 The data flow across components of the developer’s software As shown in Figure 28, IEEE 802.11p WAVE is only a part of a group of standards related to all layers of protocols for DSRC-based operations. The IEEE 802.11p standard is limited by the scope of

D4.2 [Report on first pilot (to be used in field study 1)]
60
IEEE 802.11, which is strictly a MAC and PHY level standard that is meant to work within a single logical channel. All knowledge and complexities related to the DSRC channel plan and operational concept are taken care of by the upper layer IEEE 1609 standards. In particular, the IEEE 1609.3 standard covers the WAVE connection setup and management. The IEEE 1609.4 standard sits right on top of the IEEE 802.11p and enables operation of upper layers across multiple channels, without requiring knowledge of PHY parameters.
Figure 28: DSRC standards and communication stack
7.1.3 The functionality flow The development effort consists of the implementation of the Network & Transport protocol entity of the ITS protocol stack, as it is demonstrated by Figure 29. The Network & Transport protocol entity consists of the implementation of the GeoNetworking protocol, based on the ETSI TS 102 636-4-1 standard, the Basic Transport Protocol, based on the ETSI TS 102 636-5-1.
Figure 29: ITS STA protocol architecture
The interface overview of the designed implementation is depicted in Figure 30. The implementation is based on a User Space daemon, which is communicating using UDP sockets with the upper facilities layers. Whenever the daemon receives a data request, from the upper facility layer, packs the payload to a GN packet, according to the request type, and sends the GN packet, according to the rules specified in the ETSI TS 102 636-4-1 standard. The protocol’s operation heavily depends on a structure called “Location Table (LocT)”. LocT holds information about all the ITS stations that operate in the same geographical region, and maintains addressing information

D4.2 [Report on first pilot (to be used in field study 1)]
61
about them, their visibility from the current station etc, and is updated whenever a transmission/reception of a packet occurs.
Figure 30: Implemented protocol architecture
The initialization of critical structures for the successful operation of the protocol is happening at the beginning of the execution, using an input file formatted using a common pattern that DELPHI and UTH have agreed. Once the protocol is initialized, it uses four different processes for the operations of beaconing, communication with the upper layer, reception of a network packet and communication with the management entity. Accessing of this user space protocol to the network is implemented using the well-known “pcap” library, used for creating raw Ethernet sockets.
The implementation so far has incorporated beaconing, and handling (transmission/reception) for all the different packets that the protocol supports (Single Hop Broadcast, Topologically Scoped Broadcast, GeoUnicast, GeoBroadcast, GeoAnycast) and is currently under testing. However, it lacks buffering and packet lifetime support, as well as the required handling of packets from the Management interface. The Facilities layer is currently working using the primitives from the lower layer.
7.1.4 The overall connection of the software to the use case (and the project) The communications stack is a necessary component of the CTL’s field trial aiming at investigating and measuring the impact of V2V communications in the total emissions of CO2, i.e., whether this mode of communication can indeed offer any advantages in reducing CO2.
7.1.5 Connection to other deliverables (past and future ones) The scenario is connected to deliverables 5.2 and 5.3 that present the field trials of REDUCTION and measure the effectiveness in terms of travel time (TT), fuel consumption (FC) etc.
7.1.6 How does the architecture/functionalities match the Nicosia field study requirement
The architecture designed and used is fully compliant with the international standards. It is typical for any V2V, V2I and I2V type of interaction and fully covers all the needs of the field trial.
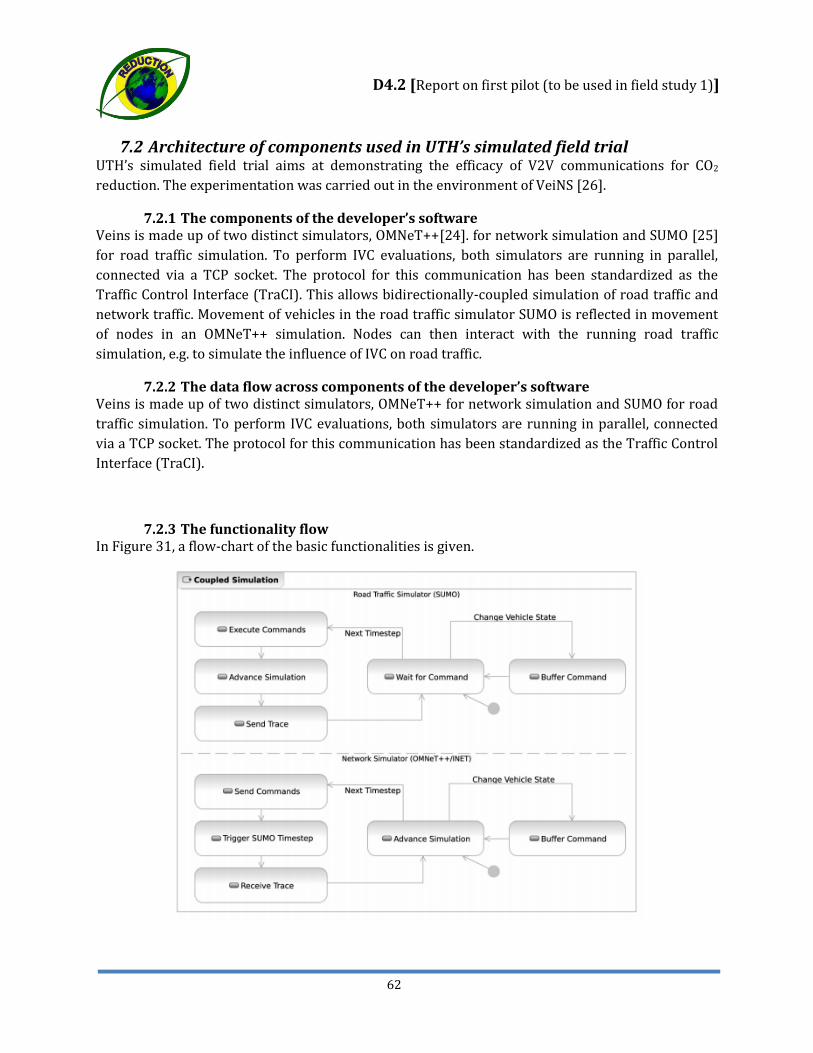
D4.2 [Report on first pilot (to be used in field study 1)]
62
7.2 Architecture of components used in UTH’s simulated field trial UTH’s simulated field trial aims at demonstrating the efficacy of V2V communications for CO2 reduction. The experimentation was carried out in the environment of VeiNS [26].
7.2.1 The components of the developer’s software Veins is made up of two distinct simulators, OMNeT++[24]. for network simulation and SUMO [25] for road traffic simulation. To perform IVC evaluations, both simulators are running in parallel, connected via a TCP socket. The protocol for this communication has been standardized as the Traffic Control Interface (TraCI). This allows bidirectionally-coupled simulation of road traffic and network traffic. Movement of vehicles in the road traffic simulator SUMO is reflected in movement of nodes in an OMNeT++ simulation. Nodes can then interact with the running road traffic simulation, e.g. to simulate the influence of IVC on road traffic.
7.2.2 The data flow across components of the developer’s software Veins is made up of two distinct simulators, OMNeT++ for network simulation and SUMO for road traffic simulation. To perform IVC evaluations, both simulators are running in parallel, connected via a TCP socket. The protocol for this communication has been standardized as the Traffic Control Interface (TraCI).
7.2.3 The functionality flow In Figure 31, a flow-chart of the basic functionalities is given.

D4.2 [Report on first pilot (to be used in field study 1)]
63
Figure 31: Functionality flow
7.2.4 The overall connection of the software to the use case (and the project) The simulated trial is an essential part of CTL’s field trial aiming at investigating and measuring the impact of V2V communications in the total emissions of CO2, i.e., whether this mode of communication can indeed offer any advantages in reducing CO2.
7.2.5 Connection to other deliverables (past and future ones) The scenario is connected to deliverables 5.2 and 5.3 that present the field trials of REDUCTION and Measure the Effectiveness in terms of travel time (TT), fuel consumption (FC) etc.
7.2.6 How does the architecture/functionalities match the Nicosia field study requirement
The simulations can be modified to any requirement of Nicosia field trial, such as vehicle characteristics (busses), map of field trial, and output of the simulation since our simulation framework produces data sources for a wide range of metrics, including travel time and emissions.
7.2.7 Use case descriptions In our first trial we have simulated an accident occurring in the city of Erlangen where the vehicles using IVC detour the congested area in order to decrease their travel time and their CO2 emissions / travelled Km.
In the feature we are going to simulate scenarios where vehicles communicate with RSU’s and with proceeding vehicles in order to optimize their route in terms of overall travel time and consumption.
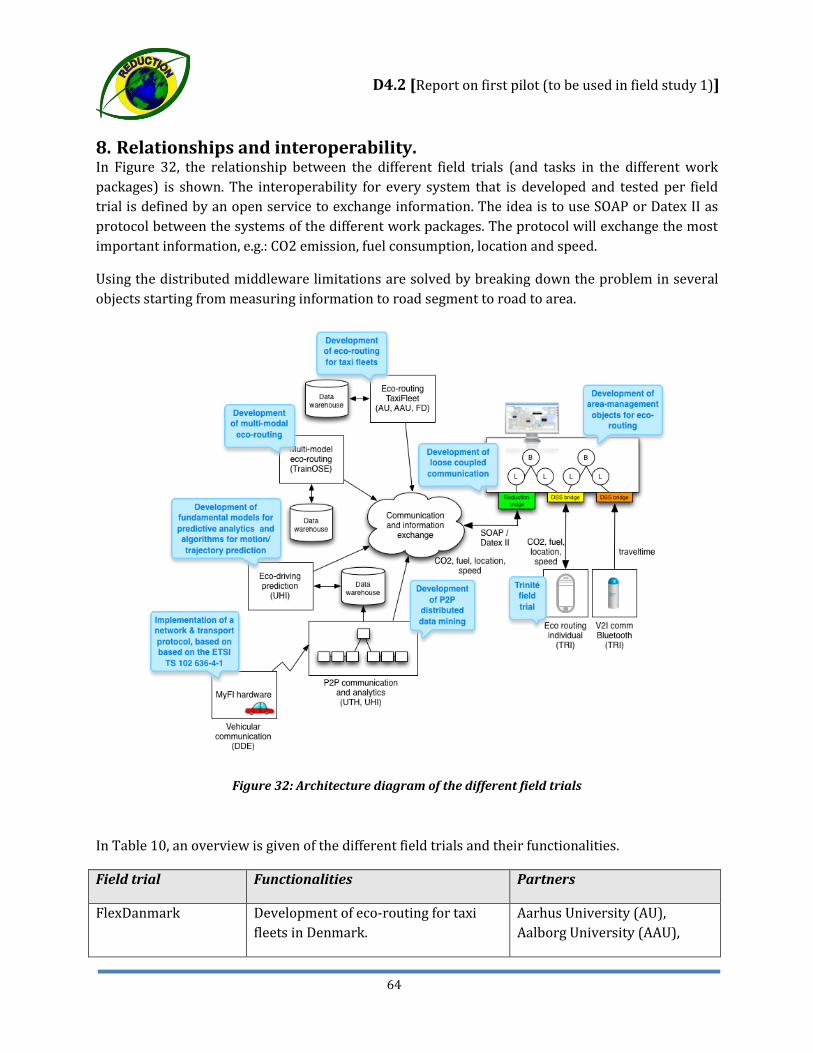
D4.2 [Report on first pilot (to be used in field study 1)]
64
8. Relationships and interoperability. In Figure 32, the relationship between the different field trials (and tasks in the different work packages) is shown. The interoperability for every system that is developed and tested per field trial is defined by an open service to exchange information. The idea is to use SOAP or Datex II as protocol between the systems of the different work packages. The protocol will exchange the most important information, e.g.: CO2 emission, fuel consumption, location and speed.
Using the distributed middleware limitations are solved by breaking down the problem in several objects starting from measuring information to road segment to road to area.
Figure 32: Architecture diagram of the different field trials
In Table 10, an overview is given of the different field trials and their functionalities.
Field trial Functionalities Partners
FlexDanmark Development of eco-routing for taxi fleets in Denmark.
Aarhus University (AU), Aalborg University (AAU),
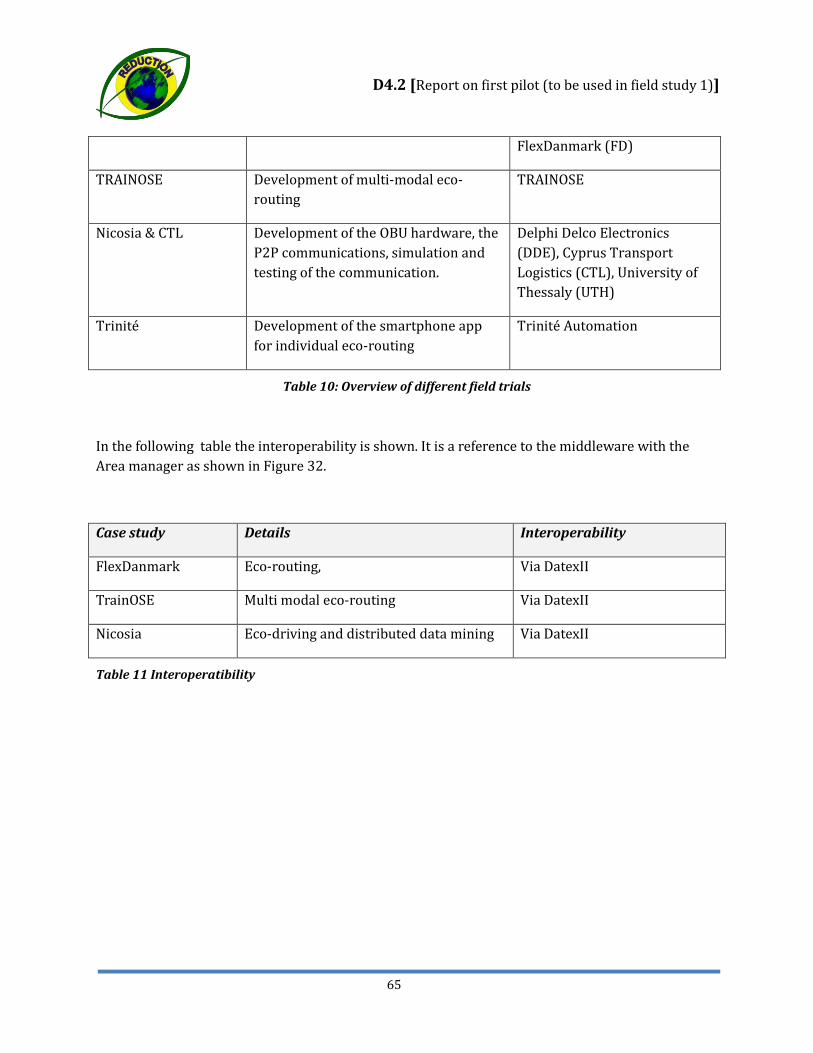
D4.2 [Report on first pilot (to be used in field study 1)]
65
FlexDanmark (FD)
TRAINOSE Development of multi-modal eco-routing
TRAINOSE
Nicosia & CTL Development of the OBU hardware, the P2P communications, simulation and testing of the communication.
Delphi Delco Electronics (DDE), Cyprus Transport Logistics (CTL), University of Thessaly (UTH)
Trinité Development of the smartphone app for individual eco-routing
Trinité Automation
Table 10: Overview of different field trials
In the following table the interoperability is shown. It is a reference to the middleware with the Area manager as shown in Figure 32.
Case study Details Interoperability
FlexDanmark Eco-routing, Via DatexII
TrainOSE Multi modal eco-routing Via DatexII
Nicosia Eco-driving and distributed data mining Via DatexII
Table 11 Interoperatibility

D4.2 [Report on first pilot (to be used in field study 1)]
66
9. Risk Assessment
The field trials involving FlexDanmark, Nicosia and TRAINOSE do not forecast deviations from the plan. The respective software stacks are close to being implemented, which mean that the functionality is present in accordance with the description of work. In addition the bus fleet contact involving Nicosia field trial and its trial routes are also completely defined.
Trinité field trial also doesn’t plan deviations to the plan except for the CANBus data availability. As already described in Section 7, such risk is already remedied by utilizing the VT-micro model [22] of fuel consumption estimation.
For the architecture of every field trial, open standards and software products are used. Therefor the possibility to integrate and connect the developed systems as part of the REDUCTION product is high. The software architecture used for the FlexDanmark field trial is based on open products on a Linux based system and uses web-services for interaction between the user and the system. The software architecture of the TRAINOSE field trial is also web based and an open web-service interface is defined to communicate with other systems. The software and system architecture of the vehicular devices is based on the IEEE802.11p and the data warehouse, in which all vehicular information is stored, is Postgres, accessible through SQL queries. The Trinité system with smartphone app stores its information in a MySQL database. Therefore no risk regarding integration and reusability has yet emerged.
10. Conclusion
The current deliverable 4.2 describes the architectural layers of the software stacks developed and/or used by the REDUCTION project in the first phase of the field trials. More concretely four field trials, scope of Work Package 5, will validate the studied methodologies of Work Packages 1-3. Chapter 3 describes a relation between the methodologies and the field trials where they are applied. The FlexDanmark field trial architecture, presented in Chapter 4, elaborates software that provides eco-routing functionalities for a taxi fleet. Similarly the TRAINOSE field trial (Chapter 5) describes the architecture of the pilot to compute multi-modal eco-routing in train and bus networks. In the Nicosia field trial of Chapter 6, the software that gathers data for eco-driving analysis and provides data mining functionality is explained. Consequently, the Trinité field trial (Chapter 7) describes the architecture of the pilot which offers and iPhone app providing eco- routing to individuals. Finally, Chapter 8 presents the architecture of the V2V/V2I communication capabilities.

D4.2 [Report on first pilot (to be used in field study 1)]
67
Conclusions to the system architecture of the FlexDanmark field trial.
A software stack is defined based on a number of generic components (PostgreSQL 9.2/PostGIS 2.0, Phyton 3.2, M-GEMMA), which allows the developed software to be easily ported to other operating systems. The input to the system requires GPS data to be in the NMEA format that is a proprietary. The format is reversed engineered and available on the Internet so the REDUCTION project is able to use it for research and development purposes. When using this format for commercial exploitation a licence (membership) has to be obtained from the NMEA. A web interface operates on top of the system, which allows users to query for eco-routing information and be displayed geographically showing the shortest, fastest and most eco-friendly routes. Users do not require any technical IT-skills to operate the system. User-friendly graphs showing speed and intensity on selected routes can be displayed easily.
All components of the system are open, are based on common standards and can therefore be easily integrated in other environments.
Future work:
- Set up framework such that in futer the GHG-emmissions can be reduced based on more efficient GHG-routes.
Conclusions to the system architecture of the TRAINOSE field trial.
The software architecture for multi-modal eco-routing offers a user-friendly web-interface that can be easily integrated in the system architecture of REDUCTION. The user-interface enables users to query for a source to destination route and the underlying system calculates the most eco-friendly route. An open communication service is developed to allow eco-data to be added to the systems database, to enable the system for dynamic CO2 updates on the multi-modal route.
Future work:
- Update the network
- Introduction of Demand-Responsive Transit Systems
Conclusions to the system architecture of the Nicosia field trial.
The software architecture that is proposed consists of clients that run on the OBU on-board systems of Delphi and will be tested on the OSEL busses in Nicosia. The data collected will be GNSS, fuel consumption and GHG emissions. The client software will do pre-processing of the raw data, so the data will be ready for storage in the data warehouse on the server system. At the application server openGIS software will be used to map-match the data for analysing and visualisation purposes. Data

D4.2 [Report on first pilot (to be used in field study 1)]
68
from V2I will be transported by 3G for real-time data and by Wi-Fi from Wi-Fi zones at bus depots for batch data.
Distributed Data Mining algorithms (DDM) are developed to gather data from the peer-to-peer (P2P) network that is created by the OBU on-board systems of Delphi. The DDM algorithms take care of the data routing from the vehicles to the server. The DDM algorithm is based on the concept of peers and super-peers, where super-peers keep track of peers leaving and joining the P2P network.
Future work:
- Demonstrate (V2V/V2I) device capabilities
- Demonstrate fuel efficiency and/or emissions reduction
Conclusions to the system architecture of the CTL field trial.
The communication stack on the OBU on-board systems of Delphi is based on the IEEE802.11p standard. So far has been implemented the beaconing and handling receiving and sending of packets of different formats (Single Hop Broadcast, Topologically Scoped Broadcast, GeoUnicast, GeoBroadcast, GeoAnycast) and is currently under testing.
Conclusions to the system architecture of the Trinité field trial.
A smartphone app has been developed that connects to the central system architecture DSS. The app is able the calculate CO2 emission and fuel consumption and communicate the information through a database to the DSS architecture. What needs to be done is to develop the Digital Road Authority (Area Traffic Manager) to calculate the most eco-friendly route.
Future work:
- Develop Area Traffic Manager
- Increase number of users
- Integrating with other systems (weather forecast, CO2 measurement etc. )
- Tuning app using historical data
- Multi model integration
- Extending the App with the functionality to enter mileage and refuel information

D4.2 [Report on first pilot (to be used in field study 1)]
69
So far, all architectural designs that need to support the different field trials are on schedule. As mentioned before, the lack of availability of the CANBus data can be a problem but this can be overcome by using the VT-micro model [22] of fuel consumption estimation.

D4.2 [Report on first pilot (to be used in field study 1)]
70
Glossary
AAU Aalborg University ATM Area Traffic Manager AU Aarhus University CANbus Controller Area Network bus CO2 Carbon dioxide CTL Cyprus Transport Logistics DDE Delphi Delco Electronics GMBH DDM Distributed Data Mining DSRC Dedicated Short Range Communication DSS Dynamic Subscription Software ETSI European Telecommunications Standards Institute FD FlexDanmark GHG Greenhouse gas GIS Geographic Information System GNSS Global Navigational Satellite System GPS Global Positioning System IVC Inter Vehicle Communication M-GEMMA Genetic Map Matching Algorithm P2P Peer to peer TRI Trinité Automation SSD Solid State Drive SUMO The Simulator of Urban Mobility UHI University of Hildesheim UTH University of Thessaly VANETS Vehicular Ad-hoc Networks V2I Vehicle to infrastructure V2V Vehicle to vehicle VMS Variable Message Sign WAVE Wireless Access in Vehicular Environments WP Work package
D4.2 [Report on first pilot (to be used in field study 1)]
71
References Andersen, O., & Torp, K. (2012). An Open-Source ITS Platform. Aalborg University DBTR-32.
Andersen, O., Krogh, B. B., & Torp, K. (2013 (to appear)). An Open-source Based ITS Platform. First International Workshop on Next-Generation Location-Based Services (LBS n.0) , 6.
DePriest, D. (u.d.). NMEA data. Hentede 01. 03 2013 fra www.gpsinformation.org/dale/nmea.htm
National Marine Electronics Association. (u.d.). NMEA 0183 Standard. Hentede 01. 03 2013 fra NMEA: www.nmea.org
NetworkX Developers. (u.d.). NetworkX v1.4 documentation. Hentede 01. 03 2013 fra NetworkX : networkx.github.com
Pereira, F., Costa, H., & Pereira, N. (2009). An off-line map-matching algorithm for incomplete map databases. European Transport Research Review (3), s. 107-124.
Python Software Foundation. (u.d.). Hentede 01. 03 2013 fra Python Programming Language - Official Website: www.python.org
Refractions Research. (u.d.). Hentede 01. 03 2013 fra PostGIS: http://postgis.refractions.net/
The PostgreSQL Global Development Group. (u.d.). Hentede 01. 03 2013 fra PostgreSQL: www.postgresql.org
Thomsen, C. (u.d.). ETL programming in Python. Hentede 01. 03 2013 fra pygrametl: www.pygrametl.org
ubuntu. (u.d.). Hentede 01. 03 2013 fra ubuntu.com
Varrazzo, D. (u.d.). Hentede 01. 03 2013 fra PostgreSQL + Python | Psycopg: initd.org/psycopg
[13] Souptik Datta, Kanishka Bhaduri, Chris Giannella, Ran Wolff, and Hillol Kargupta. Distributed Data Mining in Peer-to-Peer Networks. IEEE Internet Computing, 10(4):18--26, 2006
[14] Xie, Chao, Yi Pan. 2006. Analysis of large-scale hybrid peer-to-peer network topology. GLOBECOM. IEEE
[15] Khilar, Pabitra Mohan, Sudipta Mahapatra. 2007. Heartbeat based fault diagnosis for mobile ad-hoc network. Proceedings of the third conference on IASTED International Conference: Advances in Computer Science and Technology. ACST'07, ACTA Press, Anaheim, CA, USA, 194{199.
[16]Bhaduri, Kanishka, Ran Wolf , Chris Giannella, Hillol Kargupta. 2008. Distributed decision-tree induction in peer-to-peer systems. Stat. Anal. Data Min. 1 85-103.

D4.2 [Report on first pilot (to be used in field study 1)]
72
[17] Barabsi, Albert-Lszl, Rka Albert. 1999. Emergence of scaling in random networks. Science 286 509-512.
[18] Alberto Medina, Ibrahim Matta John Byers, Anukool Lakhina. 2002. Brite: Boston university representative internet topology generator.
[19] Lars Schmidt-Thieme. Reducing environmental footprint based on multi-modal fleet management system for eco-routing and driver behaviour adaptation. 2012.
[20] Josif Grabocka, Umer Khan, and Lars Schmidt-Thieme. Deliverable d2.2. 2012.
[21] Chenjuan Guo(AU), Bin Yang(AU), Christian S.Jensen(AU), and Kristian Torp (AAU). Deliverable d3.2. 2012.
[22] K. Ahn, A.A.Trani, H. Rakha, and M. Van Aerde. Microscopic fuel consumption and emission models. 78th Annual Meeting of the Transportation Research Board, 1999.
[23] M. T. Oliver-Hoyo and G. Pinto. Using the relationship between vehicle fuel consumption and co2 emissions to illustrate chemical principles. Journal of Chemical Education, 2008.
[24] The ΟΜΝΕΤ++ simulator. http://www.omnetpp.org/
[25] The Simulator of Urban MObility. http://sumo.sourceforge.net/
[26] The VEINS simulator. http://veins.car2x.org/