rena 1809092 atlas en-bref gb · renault, dacia and renault samsung motors, alpine and lada,...
TRANSCRIPT

GROUPERENAULT
FACTS & FIGURESKey figures extract
1st half 2018

CONTENTS
Datas are at the end of June 2018.
GROUPE RENAULT
2 / Key figures3 / Financial information4 / One Group, 5 brands
SALES
6 / Industrial sites8 / Global sales
11 / Sales in the Europe region16 / Sales in the Africa, Middle East, India region18 / Sales in the Eurasia region20 / Sales in the Asia-Pacific region23 / Sales in the Americas region
RENAULT-NISSAN-MITSUBISHI
26 / Presentation – Highlights28 / Synergies – Sales

GROUPE RENAULTGroupe Renault has been making cars since 1898. Today it is an international multi-brand group, selling close to 3.76 million vehicles in 134 countries in 2017, with 36 manufacturing sites, 12,700 points of sales and employing more than 180,000 people. To meet the major technological challenges of the future and continue its strategy of profitable growth, the Group is harnessing its international growth and the complementary fit of its five brands, Renault, Dacia and Renault Samsung Motors, Alpine and LADA, together with electric vehicles and the unique Alliance with Nissan and Mitsubishi. With a new team in Formula 1 and a commitment to Formula E, Renault sees motorsport as a vector of innovation and brand awareness.
Alpine A110 Pure
Groupe Renault Facts & Figures / 1st half of 2018 / 1

2 \ Groupe Renault
GROUPE RENAULT
KEY FIGURESAt 1st half of 2018
2017
June 2018
Jan. 2018
IN REVENUES
29,957Million €
GROUPE RENAULT
1st half of 2018
1st half of 2017
restated
Revenue€ million 29,957 29,537
Net income (1)€ million 2,040 2,437
Number of vehicles sold 2,067,695 1,882,391
(1) The figures for first-half 2017 include adjustments due to the change in the accounting treatment of redeemable shares in 2018 and allocation of the purchase price for the AVTOVAZ group which was finalized in the second half-year of 2017.
Effective from January1st, 2018, Groupe Renault has also integrated the sales volumes of Jinbei and Huansong.

Groupe Renault Facts & Figures / 1st half of 2018 / 3
GROUPE RENAULT
(1) The figures for first-half 2017 include adjustments due to the change in the accounting treatment of redeemable shares in 2018 and allocation of the purchase price for the AVTOVAZ Group which was finalized in the second half-year of 2017.
FINANCIAL INFORMATION
Financial results for the 1st half of 2018
— Registrations increased 9.8% to 2.07 million units (+5.3% excluding Jinbei and Huasong).— Group revenues increased by 1.4% to €29,957 million — Group operating margin stood at €1,914 million compared with €1,820 million, representing 6.4% of revenues. Excluding IFRS 15 impact, the operating margin would have reached 6.6%. — Group operating income stood at €1,734 million (–3.1%) compared with €1,789 million. This decrease came mainly from a provision for restructuring.— Net income at €2,040 million compared with €2,437 million(1) (–16.3%).This decrease came from Nissan’s contribution, down €483 million, which notably benefited from a capital gain last year. — Positive Automotive operational free cash flow of €418 million. — The Group confirms its full-year guidance.
Groupe Renault consolidated results
€ million
1st half of 2018
1st half of
2017restated Change
Group revenues 29,957 29,537 + 1.4%
Group operating profit 1,914 1,820 + 94
(% revenues) 6 46.4%% 6.2% + 0.2 points
Group operating income 1 71,73434 1,789 – 55
Contribution from associated companies 814 1,317 – 503
o/w Nissan 805 1,288 – 483
Net income(1) 2,040 2,437 – 397
Net income, Group share(1) 1,91,95252 2,399 – 447
Earnings net per share (€)(1) 7.24 8.85 – 1.61
Automotive Operational Free cash flow including AVTOVAZ + 418 + 358 + 60
Automotive net cash positionincluding AVTOVAZ(1) + 3,062
at 31 Dec. 2017
+ 3,209 – 147
Sales Financing, average performing assets (€ billion)
43.7 38.6 + 13.3%

ONE GROUP, 5 BRANDS
RENAULT1,378,583 vehicles sold in 1st half 2018 (PC + LCV)Renault, the leading French brand worldwide, is present in 134 countries with nearly 12,000 points of sale. Renault has been making its customers’ lives easier for 120 years. As leader of the European electric vehicle market and committed to motorsport, the brand is driven by passion on a daily basis, with its sensual and warm design.
DACIA378,095 vehicles sold in 1st half 2018 (PC + LCV)Dacia is present in 44 countries in Europe and few countries of the AMI region. It has attracted more than 5 million customers since 2004 by offering a range of simple vehicles at affordable prices and emblematic models such as Sandero and Duster.
RSM (1)
38,580 vehicles sold in 1st half 2018 (PC)Created in 2000, Renault Samsung Motors is one of the top five carmakers in South Korea. Particularly reputed for its service quality, RSM was recently voted number one on customer satisfaction in sales and after-sales for the 15th consecutive year.(1) Renault Samsung Motors.
A110 Vesta SW
Sandero Stepway SM6
LADA
186,526 vehicles sold in 1st half 2018 (PC + LCV)LADA became a Groupe Renault brand in January 2017. The long-standing leader of the Russian market has the country’s largest dealership network. With a completely renewed design and a fast-changing network, LADA has entered a new era.
ALPINE644 vehicles sold in 1st half 2018 (PC) Alpine was founded in 1955 by motorsport enthusiast Jean Rédélé.Alpine is back in 2017 with the new Alpine A110, reflecting brand DNA: lightweight, compact and agile – with the promise of driving pleasure.
Koleos
4 \ Groupe Renault
GROUPE RENAULT

SALESThe global market is expected to grow 3% on 2017.The group is expected to reap the benefits of range
renewal across all regions in 2018 and to pursue sales growth1, driven by international markets in
connection with the new Drive the Future plan.
Groupe Renault Facts & Figures / 1st half of 2018 / 5
6 \ Groupe Renault
SALES
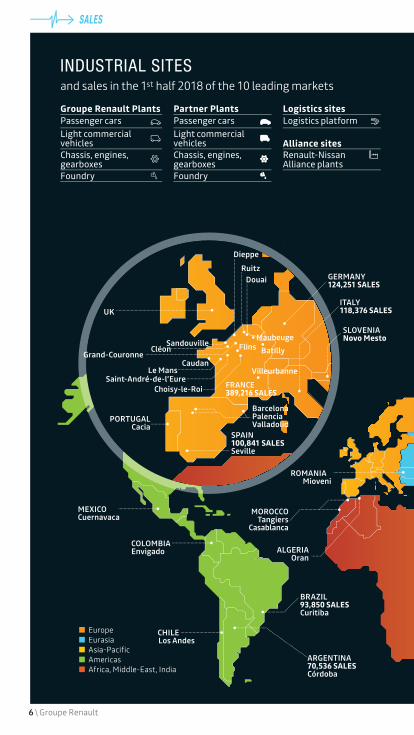
INDUSTRIAL SITESand sales in the 1st half 2018 of the 10 leading markets
Europe Eurasia Asia-Pacific Americas Africa, Middle-East, India
CHILELos Andes
COLOMBIAEnvigado
BRAZIL93,850 SALESCuritiba
ARGENTINA70,536 SALESCórdoba
ALGERIAOran
ROMANIAMioveni
MOROCCO Tangiers
Casablanca
ITALY118,376 SALES
GERMANY124,251 SALES
UK
SLOVENIA Novo Mesto
PORTUGAL Cacia
Caudan
Cléon FlinsGrand-Couronne
Dieppe
Ruitz
Douai
SandouvilleMaubeuge
Batilly
Le MansSaint-André-de-l’Eure
Choisy-le-Roi
SPAIN 100,841 SALES Seville
Barcelona PalenciaValladolid
Villeurbanne
FRANCE389,216 SALES
MEXICOCuernavaca
Groupe Renault Plants Partner Plants Logistics sitesPassenger cars Passenger cars Logistics platform
Light commercial vehicles
Light commercial vehicles Alliance sites
Chassis, engines, gearboxes
Chassis, engines, gearboxes
Renault-NissanAlliance plants
Foundry Foundry

Groupe Renault Facts & Figures / 1st half of 2018 / 7
SALES
Sitees in FranceBatilly (Sovab) Caudan (Fonderie de Bretagne) Choisy-le-Roi Cléon Dieppe (Alpine) Douai Flins Grand-Couronne Le Mans Maubeuge (MCA) Ruitz (STA) Sandouville Saint-André-de-l’Eure (SFKI) Villeurbanne
Sites in EurropeBarcelona (Nissan) Cacia Novo Mesto (Revoz) Palencia Seville Valladolid
Sitees in Africca, Middleee East, InddiaCasablanca (Somaca)
Chennai (Renault-Nissan) Oran Pune
Tangiers (Renault-Nissan) Tehran (Pars Khodro/Iran Khodro)
(Aci-Pars)
Sites in EurasiaBursa (Oyak-Renault) Izhevsk (AVTOVAZ) Mioveni (Dacia) Moscow Togliatti (AVTOVAZ)
Sitess Assia--PPaciffiicBusan (RSM) Shenyang (RBJAC) Wuhan (DRAC)
Sites in AmericasCórdoba Cuernavaca (Nissan)
Curitiba Envigado (Sofasa) Los Andes (Cormecanica)
TURKEY68,414 SALESBursa
IRAN61,354 SALESTehran
SOUTH KOREABusan
RUSSIA240,728 SALESMoscow, Togliatti, Izhevsk
CHINA117,646 SALESShenyang Wuhan
INDIAPuneChennai

8 \ Groupe Renault
SALES
GLOBAL SALES15 largest markets of Groupe Renault – 1st half 2018By volume and % of TIV, PCs + LCVs, including Renault, Dacia, Renault SamsungMotors, Alpine, LADA and Jinbei & Huasong
Sales Market shareFrance ,389,216 27.23%Russia 240,728, 28.35%
yGermany ,124,251 6.28%Italyy 118,376, 9.79%China ,117,646 0.88%Spainp 100,841, 11.89%Brazil ,93,850 8.33%Argentinag 70,536, 14.63%
yTurkey ,68,414 19.36%Iran 61,354, 8.10%
gUnited Kingdom ,57,290 3.82%Belgium + Luxembourgg g 52,962, 12.92%India ,42,697 2.11%South Korea 40,920, 4.62%Morocco ,39,747 43.67%
Groupe Renault worldwide sales by brand and modelBy volume PCs + LCVs
Passenger CarsRenault 1st half 2018f 1st half 2017f
Capturp 130,012, 122,850,pCaptur GA ,37,175 ,25,508
Clio 228,355, 222,039,Other ,2,713 ,1,148Duster 63,774, 65,452,
pEspace ,8,178 ,11,707Fluence/Fluence Z.E./ 1,513, 5,197,
jKadjar ,77,181 ,82,690Kangoo/Kangoo Z.E.g / g 21,538, 20,161,Koleos ,42,770 ,33,427Kwid 82,761, 51,461,
gyLodgy ,1,010 ,1,908Logang 111,154, 117,334,Master 934 986Méganeg 164,582, 169,827,Sandero ,97,368 ,115,121Talisman 14,164, 26,002,Trafic ,11,505 ,10,458Twingog 50,018, 44,093,ZOE 17,436, 16,974,Total RenaultTotal Renault 1,164,1411,164,141 1,144,3431,144,343DaciaOther 11 4Dokker ,28,038 ,23,329Duster 115,529, 88,232,
gyLodgy ,21,197 ,21,052Logang 38,657, 39,670,Sandero ,151,636 ,138,366Total DaciaTotal Dacia 355,068355,068 310,653310,653Renault Samsung MotorsQQM3 ,3,179 ,6,194QM6Q 12,804, 13,920,
/SM3/SM3 Z.E. ,2,878 ,3,232SM5 5,127, 2,263,SM6 ,12,364 ,23,917SM7 2,228 3,250
Total RSMTT 38,580 52,776

Groupe Renault Facts & Figures / 1st half of 2018 / 9
SALES
LADA 1st half 2018f 1st half 2017f
110 1,465 1,6411117 7,899 8,1434x4 19,833 16,692Other 392 309Granta 48,669 43,900Kalina 737 1,070
gLargus 22,839 14,649Priora 6,643 7,476Vesta 53,933 35,306Xray 17,433 15,646
Total LADA 179,843 144,832AlpineA110 644 –
Total Alpine 644 –Jinbei & HuasongTotal Jinbei & Huasong 8,657 –Total Group, Passenger Cars 1,746,933 1,652,604
Light commercial vehiclesRenault 1st half 2018f 1st half 2017f
Alaskan 2,093 296Capturp 571 705Clio 19,039 19,149Other 8,332 7,139Dokker 6,155 1,652Duster Oroch 18,154 14,982
gKangoo 55,826 58,697Kangoo Z.E.g 3,620 1,620
gLogan 1,543 1,158Master/Master Z.E. 52,149 47,204
gMégane 3,173 3,458Trafic 43,401 45,150ZOE 386 327Total Renault 214,442 201,537DaciaOther 1 0Dokker 21,385 20,571Duster 1,177 1,568
gyLodgy 38 44Logang 95 165Sandero 331 364Total Dacia 23,027 22,712
LADA4x4 424 268Other 4 34Granta 1,067 805
gLargus 5,188 4,431Total LADA 6,683 5,538Jinbei & Huasong ,Total Jinbei & Huasong 76,610 –
Total Group, LCVs 320,762 229,787
Total Group, PCs + LCVs 2,067,695 1,882,391

10 \ Groupe Renault
SALES
Groupe Renault worldwide sales by brand – 1st half 2018By volume PCs + LCVs
Renault 1st half 2018f 1st half 2017f ChangePassenger Cars (PCs) 1,164,141 1,144,343 1.7 %
Light commercial vehicles 214,442 201,537 6.4%
Total Renault 1,378,583 1,345,880 2.4%DaciaPassenger Cars (PCs) 355,068 310,653 14.3%
Light commercial vehicles 23,027 22,712 1.4%
Total Dacia 378,095 333,365 13.4%Renault Samsung MotorsCars 38,580 52,776 –26.9%
AlpineppPassenger Cars (PCs) 644 – –
LADAPassenger Cars (PCs) 179,843 144,832 24.2%
Light commercial vehicles 6,683 5,538 20.7%
Total LADA 186,526 150,370 24.0%Jinbei & HuasongPassenger Cars (PCs) 8,657 – –
Light commercial vehicles 76,610 – –
Total Jinbei & Huasong 85,267 – –GroupePassenger Cars (PCs) 1,746,933 1,652,604 5.7%
Light commercial vehicles 320,762 229,787 39.6%
Total Group, PCs + LCVs 2,067,695 1,882,391 9.8%
INTERNATIONALIZATION OF THE GROUP
% of sales outside the Europe regionGroup sales outside Europe (%)
99
6,9
77
1st H 2018
48.2%
36
9,5
59
1st H 2009
33.4%
45
0,4
06
1st H 2010
33.4%
54
3,0
46
1st H 2011
39.5%
62
1,8
74
1st H 2012
46.7%
64
6,9
03
1st H 2013
49.6%
59
6,2
26
1st H 2014
43.4%
53
2,6
41
1st H 2015
38.5%
59
8,8
91
1st H 2016
38.2%
85
6,8
31
1st H 2017
45.5%
(1) Inc. Lada from 2017.(2) Inc. Jinbei & Huasong from 2018.
(1)(2)

Groupe Renault Facts & Figures / 1st half of 2018 / 11
SALES
Worldwide automotive market by region – 1st half 2018By volume and % of TIV, PCs + LCVs
Volume% TIV
(PCs + LCVs)p gEurope Region 9,754,488 20.5%
France 1,429,435 3.0%pEurope G9 8,325,053 17.5%
International 37,784,313 79.5%Africa Middle-East, India 4,211,880 8.9%Eurasia 1,442,926 3.0%Americas 2,953,507 6.2%Asia-Pacific 19,522,493 41.1%North America 9,653,507 20.3%
Worldwide 47,538,801 100.0%
Groupe Renault worldwide sales by region – 1st half 2018PCs + LCVs, including Renault, Dacia, Renault Samsung Motors and LADA
1st half 2018f 1st half 2017f
p gEurope Region 1,070,718 1,025,560France 389,216 368,002
pEurope G9 681,502 657,558International 996,977 856,831Africa Middle-East, India 240,494 251,723Eurasia 371,789 323,051Americas 214,370 181,592Asia-Pacific 170,324 100,465
Worldwide 2,067,695 1,882,391
SALES, EUROPE REGIONTotal industry volumes, Europe RegionBy volume of registrations PCs + LCVs
1st half 2018f 1st half 2017f
Germany 1,977,583 1,919,214Austria 216,287 207,391Balkan States 27,349 23,550Belgium + Luxembourg 409,381 399,728Republic of Cyprus 8,685 8,565Croatia 43,574 36,856Denmark 138,442 142,847Spain + Canaries 848,140 769,242Finland 78,483 73,019France 1,429,435 1,364,901Greece 66,022 53,912Hungary 81,501 63,845Ireland 103,813 106,935Iceland 13,032 14,953Italy 1,209,057 1,227,601Malta 4,823 4,534Norway 96,270 96,025Baltic states 45,652 40,309Netherlands 297,693 267,623

12 \ Groupe Renault
SALES
1st half 2018f 1st half 2017f
Poland 305,410 276,243Portugalg 153,924 145,953
pCzech Republic 153,529 153,743United Kingdomg 1,499,742 1,590,389Slovakia 56,217 52,715Slovenia 47,933 45,284Sweden 266,628 221,698Switzerland 175,883 177,433
Europe Region 9,754,488 9,484,508
(1) Excluding sales to government departments.
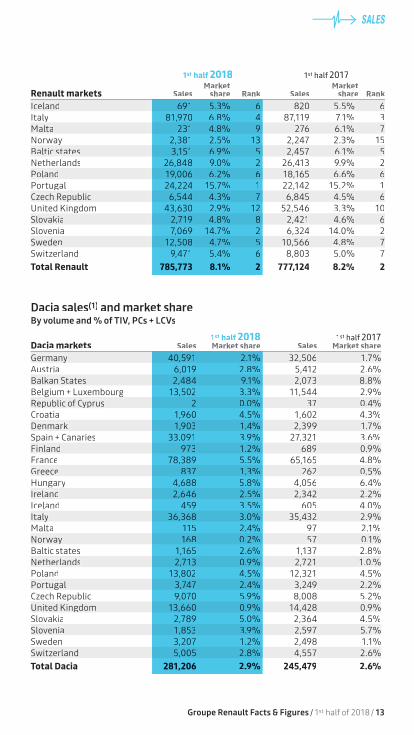
Renault sales (1) and market share By volume and % of TIV, PCs + LCVs
1st half 2018 1st half 2017
Renault markets SalesMarket
share Rank SalesMarket
share RankGermanyy 82,244 4.2% 8 82,202 4.3% 8Balkan States 2,286 8.4% 3 2,117 9.0% 3Austria 13,005 6.0% 4 12,479 6.0% 5
g gBelgium+Luxembourg 39,357 9.6% 2 38,696 9.7% 1Republic of Cyprusp yp 80 0.9% 21 191 2.2% 13Croatia 5,104 11.7% 2 3,807 10.3% 3Denmark 9,705 7.0% 4 10,423 7.3% 5
p ySpain+Canary islands 67,737 8.0% 3 62,154 8.1% 2Finland 1,540 2.0% 14 2,055 2.8% 12France 310,443 21.7% 1 302,837 22.2% 1Greece 2,623 4.0% 11 1,860 3.5% 12
g yHungary 4,091 5.0% 8 3,163 5.0% 8Ireland 7,115 6.9% 6 7,996 7.5% 6
Italy12.4%
France14.7%
Other 21.4%
Germany 20.3%
Netherlands3.1%
UK15.4%
Belgium + Luxembourg
4.2% Spain +
The Canaries8.7%
9,754,488
MARKET SHARES OF MAIN EUROPEAN COUNTRIES – 1 HALF OF 2018
As % of TIV, PCs + LCVs
Groupe Renault Facts & Figures / 1st half of 2018 / 13
SALES
1st half 2018 1st half 2017
Renault markets SalesMarket
share Rank SalesMarket
share RankIceland 691 5.3% 6 820 5.5% 6Italyy 81,970 6.8% 4 87,119 7.1% 3Malta 231 4.8% 9 276 6.1% 7Norwayy 2,381 2.5% 13 2,247 2.3% 15Baltic states 3,151 6.9% 5 2,457 6.1% 5Netherlands 26,848 9.0% 2 26,413 9.9% 2Poland 19,006 6.2% 6 18,165 6.6% 6Portugalg 24,224 15.7% 1 22,142 15.2% 1
pCzech Republic 6,544 4.3% 7 6,845 4.5% 6United Kingdomg 43,630 2.9% 12 52,546 3.3% 10Slovakia 2,719 4.8% 8 2,421 4.6% 6Slovenia 7,069 14.7% 2 6,324 14.0% 2Sweden 12,508 4.7% 5 10,566 4.8% 7Switzerland 9,471 5.4% 6 8,803 5.0% 7
Total Renault 785,773 8.1% 2 777,124 8.2% 2
Dacia sales(1) and market share By volume and % of TIV, PCs + LCVs
1st half 2018 1st half 2017Dacia markets Sales Market share Sales Market shareGermanyy 40,591 2.1% 32,506 1.7%Austria 6,019 2.8% 5,412 2.6%Balkan States 2,484 9.1% 2,073 8.8%
g gBelgium + Luxembourg 13,502 3.3% 11,544 2.9%Republic of Cyprusp yp 2 0.0% 37 0.4%Croatia 1,960 4.5% 1,602 4.3%Denmark 1,903 1.4% 2,399 1.7%
pSpain + Canaries 33,091 3.9% 27,321 3.6%Finland 973 1.2% 689 0.9%France 78,389 5.5% 65,165 4.8%Greece 837 1.3% 262 0.5%
g yHungary 4,688 5.8% 4,056 6.4%Ireland 2,646 2.5% 2,342 2.2%Iceland 459 3.5% 605 4.0%Italyy 36,368 3.0% 35,432 2.9%Malta 115 2.4% 97 2.1%Norwayy 168 0.2% 57 0.1%Baltic states 1,165 2.6% 1,137 2.8%Netherlands 2,713 0.9% 2,721 1.0.%Poland 13,802 4.5% 12,321 4.5%Portugalg 3,747 2.4% 3,249 2.2%
pCzech Republic 9,070 5.9% 8,008 5.2%United Kingdomg 13,660 0.9% 14,428 0.9%Slovakia 2,789 5.0% 2,364 4.5%Slovenia 1,853 3.9% 2,597 5.7%Sweden 3,207 1.2% 2,498 1.1%Switzerland 5,005 2.8% 4,557 2.6%
Total Dacia 281,206 2.9% 245,479 2.6%

14 \ Groupe Renault
SALES
Alpine salesBy volume PCs
Alpine markets 1st half 2018 1st half 2017
Germanyy 63 –Austria 22 –Belgium + Luxembourgg g 24 –
pSpain + Canaries 12 –France 384 –
yItaly 12 –Netherlands 36 –Poland 7 –Portugalg 8 –
pCzech Republic 1 –Switzerland 75 –
Total Alpine 644 –
LADA sales By volume PCs + LCVs
LADA markets 1st half 2018 1st half 2017
yGermany 1,353 1,363Austria 128 95Balkan States 311 202Belgium + Luxembourgg g 14 20Croatia 0 2Spain + Canariesp 1 0Finland 4 8Hungaryg y 521 559
yItaly 26 17Baltic states 225 57Poland 8 14Czech Republicp 55 135Slovakia 367 208Slovenia 7 0Sweden 6 0Switzerland 4 8
Total LADA 3,030 2,688
Groupe Renault sales by brand and modelBy volume PCs + LCVs
Renault 1st half 2018 1st half 2017
Capturp 121,324 112,304Clio 185,727 184,153Other 637 729
pEspace 7,918 11,699Kadjarj 58,605 63,344
g gKangoo/Kangoo Z.E. 13,767 13,366Koleos 11,775 3,137Master 553 731Méganeg 136,074 145,646Talisman 11,981 19,592Trafic 11,231 10,287
gTwingo 48,202 42,111ZOE 16,970 16,830
Total Renault 624,764 623,929

Groupe Renault Facts & Figures / 1st half of 2018 / 15
SALES
Dacia 1st half 2018 1st half 2017
Other 11 4Dokker 19,482 16,083Duster 94,499 72,454Lodgygy 16,849 15,147
gLogan 18,177 21,523Sandero 114,495 104,912
Total Dacia 263,513 230,123LADA4x4 1,326 1,000Other 392 311Granta 123 259Kalina 375 558Vesta 641 394Total LADA 2,857 2,522AlpineA110 644 –
Total Alpine 644 –Total Group, PCs 891,778 856,574
Light commercial vehicles Renault 1st half 2018 1st half 2017
Alaskan 1,435 -Capturp 551 677Clio 18,770 18,826Other 7,653 6,343
pEspace 32 75Kadjarj 433 393
gKangoo 42,290 41,554Kangoo Z.E.g 3,558 1,580Master/Master Z.E. 42,166 37,708Méganeg 3,170 3,456Talisman 25 56Trafic 40,514 42,261
gTwingo 77 194ZOE 381 327Total Renault 161,055 153,450DaciaOther 1 0Dokker 16,121 13,404Duster 1,141 1,399Lodgygy 38 44
gLogan 91 162Sandero 320 361Total Dacia 17,712 15,370LADA4x4 169 132Other 4 34Total LADA 173 166Total Group, LCVs 178,940 168,986Total Group, PCs + LCVs 1,070,718 1,025,560

16 \ Groupe Renault
SALES
(1) Sales volume + Brockers + Nitco. (2) DOM : Réunion, Martinique, Guadeloupe, French Guiana, and Saint-Pierre and Miquelon.
SALES, AFRICA, MIDDLE EAST, INDIA REGIONTotal industry volumes, Africa, Middle East, India regionBy volume , PCs + LCVs
Main markets 1st half 2018 1st half 2017
India 2,023,566 1,741,624Iran 757,610 657,022South Africa + Namibia 255,009 258,025Saudi Arabia 203,091 248,072Israel 165,071 171,074Pakistan 135,513 115,586Morocco 91,025 84,479
( )Dubai (UAE) 81,580 87,796Egyptgyp 75,183 53,059
gAlgeria 57,730 47,129Kuwait 49,478 48,469Africa Middle East India Region 4,211,880 3,826,505
Renault sales (1) and market shareBy volume and % of TIV PCs + LCVs
1st half 2018 1st half 2017Main Renault markets Sales Market share Sales Market shareIran 61,354, 8.1% 68,365, 10.4%India ,42,697 2.1% ,57,201 3.3%Algeriag 17,497, 30.3% 17,473, 37.1%Morocco ,13,692 15.0% ,10,955 13.0%South Africa + Namibia 11,459, 4.5% 9,798, 3.8%Saudi Arabia ,8,080 4.0% ,13,234 5.3%Israel 7,073, 4.3% 7,837, 4.6%
gypEgypt ,6,526 8.7% ,2,028 3.8%DOM(2) 6,009, 17.1% 5,167, 16.5%Tunisia ,2,738 9.9% ,3,283 9.9%Total Renault 188,152 4.5% 206,414 5.4%
Dacia sales (1) and market shareBy volume and % of TIV PCs + LCVs
1st half 2018 1st half 2017Main Dacia markets Sales Market share Sales Market shareMorocco 26,055, 28.6% 24,410, 28.9%
gAlgeria ,18,305 31.7% ,12,729 27.0%DOM(2) 2,897, 8.3% 2,360, 7.5%Israel ,2,352 1.4% ,2,773 1.6%Tunisia 524 1.9% 1,386, 4.2%Lebanon 194 1.0% 324 1.6%Mayotte 146 18.2% 167 22.0%Total Dacia 50,867 1.2% 44,779 1.2%
LADA sales (1) and market shareBy volume and % of TIV PCs + LCVs
1st half 2018 1st half 2017Main LADA markets Sales Market share Sales Market shareEgyptgyp 640 0.9% 257 0.5%Cuba 344 12.9% 0 0.0%Lebanon 199 1.1% 273 1.4%Tunisia 104 0.4% 0 0.0%Total LADA 1,353 0.0% 530 0.0%

Groupe Renault Facts & Figures / 1st half of 2018 / 17
SALES
(1) Sales volume + Brockers + Nitco.
Jinbei salesBy volume LCVs
Main Jinbei markets 1st half 2018 1st half 2017
South Africa + Namibia 120 –gBangladesh 2 –
Total Jinbei 122 –
Groupe Renault(1) sales by brand and modelBy volume, PCs + LCVs
Passenger CarsRenault 1st half 2018 1st half 2017Capturp 3,444, 5,485,
pCaptur GA ,2,100 0Clio 18,125, 13,934,Other 25 ,2,001Duster 11,257, 13,104,
jKadjar ,4,051 ,3,459Kangoo/Kangoo Z.E.g g 5,068, 4,320,Koleos ,5,306 ,5,448Kwid 38,765, 51,339,
gyLodgy 887 ,1,773Logang 55,654, 63,401,
gMégane ,6,001 ,2,751Sandero 27,106, 27,340,Talisman ,1,860 ,5,131Twingog 302 342Trafic 172 141ZOE 234 103Total Renault 180,357 200,072DaciaDokker 6,962 5,970Duster 6,787 4,626
gyLodgy 1,842 3,371Logang 7,513 7,636Sandero 26,306 21,054Total Dacia 49,410 42,657LADA4x4 195 145Granta 660 265Kalina 28 46
gLargus 51 19Vesta 365 0Xray 2 0Total LADA 1,301 475Total Group, PCs 231,068 243,204
Light commercial vehiclesRenault 1st half 2018 1st half 2017Alaskan 66 0
pCaptur 20 28Clio 269 262Other 120 80Dokker 1,688 580
g gKangoo/Kangoo Z.E. 1,622 2,165Logang 1,543 1,158Master 1,956 1,635Duster Oroch 167 92Trafic 344 342Total Renault 7,795 6,342
18 \ Groupe Renault
SALES
Dacia 1st half 2018 1st half 2017
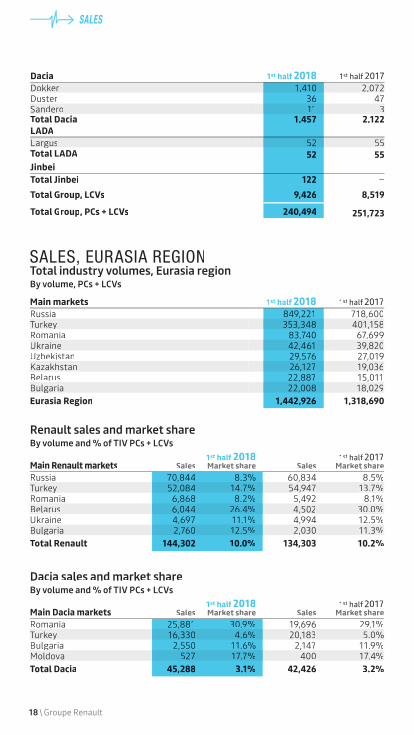
Dokker 1,410 2,072Duster 36 47Sandero 11 3Total Dacia 1,457 2,122LADA
gLargus 52 55Total LADA 52 55JinbeiTotal Jinbei 122 –Total Group, LCVs 9,426 8,519
Total Group, PCs + LCVs 240,494 251,723
SALES, EURASIA REGIONTotal industry volumes, Eurasia regionBy volume, PCs + LCVs
Main markets 1st half 2018 1st half 2017
Russia 849,221 718,600yTurkey 353,348 401,158
Romania 83,740 67,699Ukraine 42,461 39,820Uzbekistan 29,576 27,019Kazakhstan 26,127 19,036Belarus 22,887 15,011
gBulgaria 22,008 18,029
Eurasia Region 1,442,926 1,318,690
Renault sales and market shareBy volume and % of TIV PCs + LCVs
1st half 2018 1st half 2017Main Renault markets Sales Market share Sales Market shareRussia 70,844 8.3% 60,834 8.5%
yTurkey 52,084 14.7% 54,947 13.7%Romania 6,868 8.2% 5,492 8.1%Belarus 6,044 26.4% 4,502 30.0%Ukraine 4,697 11.1% 4,994 12.5%
gBulgaria 2,760 12.5% 2,030 11.3%
Total Renault 144,302 10.0% 134,303 10.2%
Dacia sales and market shareBy volume and % of TIV PCs + LCVs
1st half 2018 1st half 2017Main Dacia markets Sales Market share Sales Market shareRomania 25,881 30.9% 19,696 29.1%
yTurkey 16,330 4.6% 20,183 5.0%Bulgariag 2,550 11.6% 2,147 11.9%Moldova 527 17.7% 400 17.4%
Total Dacia 45,288 3.1% 42,426 3.2%

Groupe Renault Facts & Figures / 1st half of 2018 / 19
SALES
LADA sales and market shareBy volume and % of TIV PCs + LCVsy
1st half half 20182018 1st half half 20172017Main LADA markets Sales Market share Sales Market shareRussia 169,884 20.0% 140,231 19.5%Kazakhstan 5,854 22.4% 3,402 17.9%Belarus 4,206 18.4% 1,344 9.0%Uzbekistan 769 2.6% 212 0.8%
jAzerbaijan 590 49.0% 295 27.0%Ukraine 270 0.6% 481 1.2%
gBulgaria 224 1.0% 183 1.0%
Total LADA 181,999 12.6% 146,322 11.1%
Jinbei salesBy volume LCVs
Jinbei market 1st half 2018 1st half 2017
Armenia 200 –
Total Jinbei 200 –
Groupe Renault sales by brand and modelBy volume PCs + LCVs
Passenger CarsRenault 1st half 2018 1st half 2017
Captur 3,532 2,645
Captur GA 16,716 14,820
Clio 20,851 19,455
Other 77 34
Dokker 978 0
Duster 24,253 23,244
Kadjar 2,797 3,061
Kangoo/Kangoo Z.E. 61 33
Koleos 1,024 252
Lodgy 123 135
Logan 25,662 25,117
Master 162 29
Mégane 21,252 20,056
Sandero 18,216 15,676
Talisman 323 1,279
ZOE 116 20
Total Renault 136,143 125,856
DaciaDokker 1,594 1,276
Duster 13,885 10,782
Lodgy 2,482 2,505
Logan 12,868 10,436
Sandero 10,601 12,207
Total Dacia 41,430 37,206

20 \ Groupe Renault
SALES
LADA 1st half 2018 1st half 2017110 1,465, 1,641,1117 ,7,899 ,8,1434x4 18,193, 14,726,Granta ,47,876 ,43,376Kalina 327 466
gLargus ,22,784 ,14,630Priora 6,643, 7,474,Vesta ,52,923 ,34,912
yXray ,17,431 ,15,646
Total LADA 175,541 141,014Total Group, PCs 353,114 304,076
Light commercial vehiclesRenault 1st half 2018 1st half 2017Dokker 1,404, 642
g gKangoo/Kangoo Z.E. ,3,070 ,3,855Master 2,396, 2,737,Trafic ,1,289 ,1,213Total Renault 8,159 8,447DaciaDokker 3,854, 5,095,Duster 0 122Logan 4 3Total Dacia 3,858 5,220LADA4x4 255 136Granta 1,067, 805
gLargus ,5,136 ,4,367Total LADA 6,458 5,308JinbeiTotal Jinbei 200 –
Total Group, LCVs 18,675 18,975
Total Group, PCs + LCVs 371,789 323,051
SALES, ASIA-PACIFIC REGIONTotal industry volumes, Asia-Pacific regionBy volume, PCs + LCVs
Main markets 1st half 2018 1st half 2017
China 13,378,408 12,637,901pJapan 2,680,003 2,725,321
South Korea 884,802 887,297Australia 590,478 587,255Indonesia 524,023 466,831Thailand 486,714 409,946
yMalaysia 275,923 284,457Taiwan 215,488 212,562Philippinespp 197,586 213,300Vietnam 114,417 105,740New Zealand 77,938 76,582
g pSingapore 42,035 55,825g gHong Kong 19,995 21,594
Asia Pacific Region 19,522,493 18,715,166

Groupe Renault Facts & Figures / 1st half of 2018 / 21
SALES
Renault sales and market shareBy volume and % of TIV PCs + LCVs
1st half 2018 1st half 2017Main Renault markets Sales Market share Sales Market shareChina 32,934 0.2% 34,951 0.3%Australia 5,439 0.9% 5,593 1.0%Japanp 3,700 0.1% 4,007 0.1%South Korea 2,340 0.3% 106 0.0%Malaysiay 426 0.2% 296 0.1%
g pSingapore 347 0.8% 413 0.7%Tahiti 329 11.5% 213 8.7%New Caledonia 263 6.6% 257 6.2%Indonesia 234 0.0% 209 0.0%New Zealand 199 0.3% 178 0.2%
Total Renault 46,279 0.2% 46,326 0.2%
Dacia sales and market shareBy volume and % of TIV PCs + LCVs
1st half 2018 1st half 2017Main Dacia markets Sales Market share Sales Market shareNew Caledonia 403 10.0% 453 10,8%Tahiti 312 10.9% 214 8,7%
Total Dacia 715 0.0% 667667 0,0%
Renault Samsung Motors sales and market shareBy volume and % of TIV PCs
1st half 2018 1st half 2017RSM market Sales Market share Sales Market shareSouth Korea 38,580 5.0% 52,776 6.9%
Total RSM 38,580 0.2% 52,776 0.3%
LADA salesBy volume, PCs
LADA market 1st half 2018 1st half 2017
China 0 696
Total LADA 0 696
Jinbei & Huasong salesBy volume, PCs + LCVs
Main Jinbei & Huasong markets 1st half 2018 1st half 2017
China 84,712 –yMyanmar 34 –
Total Jinbei & Huasong 84,750 –

22 \ Groupe Renault
SALES
Groupe Renault sales by brand and modelBy volume, PCs + LCVs
Passenger CarsRenault 1st half 2018 1st half 2017
Capturp 1,172 1,742Clio 2,791 1,581Other 1,302 194Duster 165 112Fluence/Fluence Z.E. 121 273
jKadjar 11,728 12,826Kangoo/Kangoo Z.E.g g 1,044 1,204Koleos 22,519 22,654Kwid 45 83
gMégane 1,245 1,237Twingog 1,514 1,640ZOE 64 21
Total Renault 43,710 43,567DaciaDuster 358 370
gyLodgy 24 29Logang 99 75Sandero 234 193
Total Dacia 715 667Renault Samsung MotorsQM3 3,179 6,194
QM6 12,804 13,920
SM3/SM3 Z.E. 2,878 3,232SM5 5,127 2,263
SM6 12,364 23,917SM7 2,228 3,250
Total RSM 38,580 52,776LADA4x4 0 696
Total LADA 0 696Jinbei & HuasongTotal Jinbei & Huasong 8,657 –
Total Group, PCs 91,662 97,706
Light commercial vehiclesRenault 1st half 2018 1st half 2017
Kangoo/Kangoo Z.E.g g 550 586Master 942 1,172Trafic 1,077 1,001
Total Renault 2,569 2,759Jinbei & HuasongTotal Jinbei & Huasong 76,093 –
Total Group, LCVs 78,662 2,759
Total Group, PCs + LCVs 170,324 100,465

Groupe Renault Facts & Figures / 1st half of 2018 / 23
SALES
SALES, AMERICAS REGIONTotal industry volumes, Americas regionBy volume, PCs + LCVs
Main markets 1st half 2018 1st half 2017
Brazil 1,127,175 991,696Mexico 680,699 743,051Argentina 481,992 433,352Chile 200,965 166,747Colombia 108,873 108,191Peru 80,202 79,754Ecuador 63,404 41,357Puerto Rico 45,000 45,324
Americas Region 2,953,507 2,779,355
Renault sales and market shareBy volume and % of TIV PCs + LCVs
1st half 2018 1st half 2017Main Renault markets Sales Market share Sales Market shareBrazil 93,850 8.3% 73,416 7.4%
gArgentina 70,536 14.6% 57,709 13.3%Colombia 22,299 20.5% 23,498 21.7%Mexico 12,780 1.9% 13,515 1.8%Chile 7,058 3.5% 5,925 3.6%
g yUruguay 3,153 13.4% 2,042 7.8%Peru 2,135 2.7% 2,218 2.8%Ecuador 864 1.4% 1,099 2.7%Bolivia 718 4.5% 1,339 9.0%
Total Renault 214,031 7.2% 181,458 6.5%
LADA salesBy volume, PCs + LCVs
Main LADA markets 1st half 2018 1st half 2017
Bolivia 86 133Chile 58 0
Total LADA 144 134
Jinbei salesBy volume, LCVs
Main Jinbei markets 1st half 2018 1st half 2017
Ecuador 82 –Bolivia 74 –Peru 39 –
Total Jinbei 195 –

24 \ Groupe Renault
SALES
Groupe Renault sales by brand and modelBy volume, PCs + LCVs
Passenger CarsRenault 1st half 2018 1st half 2017
pCaptur 540 674Captur GAp 18,359 10,688Clio 861 2,916Other 83 102Duster 28,098 28,992Fluence/Fluence Z.E. 1,371 3,052
gKangoo 1,598 1,238Koleos 2,146 1,936Kwid 43,951 39Logang 29,838 28,816Master 214 224Méganeg 10 137Sandero 52,046 72,105ZOE 52 0
Total Renault 179,167 150,919LADA4x4 119 125Granta 10 0Kalina 7 0Largusg 4 0Vesta 4 0
Total LADA 144 125Total Group, PCs 179,311 151,044
Light commercial vehiclesRenault 1st half 2018 1st half 2017
Alaskan 592 296Clio 0 61Dokker 3,063 430
g gKangoo/Kangoo Z.E. 8,356 10,577Master 4,689 3,952Duster Oroch 17,987 14,890Trafic 177 333
Total Renault 34,864 30,539LADA
gLargus 0 9
Total LADA 0 9JinbeiTotal Jinbei 195 –
Total Group, LCVs 35,059 30,548
Total Group, PCs + LCVs 214,370 181,592
Groupe Renault Facts & Figures / 1st half of 2018 / 25
SALES
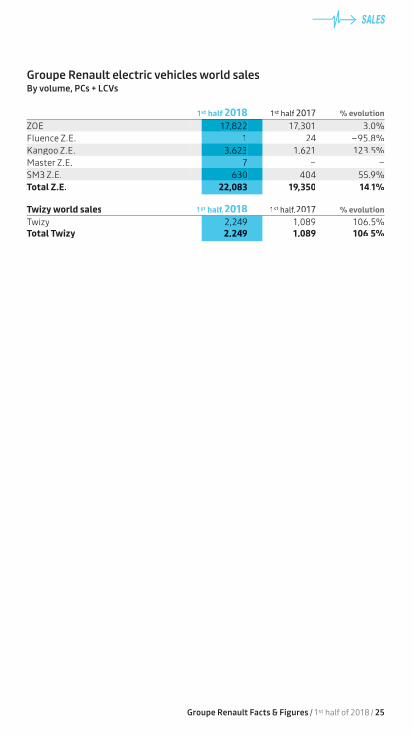
Groupe Renault electric vehicles world salesBy volume, PCs + LCVs
1st half 2018 1st half 2017 % evolutionZOE 17,822 17,301 3.0%
Fluence Z.E. 1 24 – 95.8%
Kangoo Z.E. 3,623 1,621 123.5%
Master Z.E. 7 – –
SM3 Z.E. 630 404 55.9%
Total Z.E. 22,083 19,350 14.1%
Twizy world sales 1st half,2018 1st half,2017 % evolutionTwizy 2,249 1,089 106.5%Total Twizy 2,249 1,089 106.5%

RENAULT-NISSAN-
MITSUBISHIIn 2017, the Alliance achieved significant growth, with over 10.6 million vehicles sold globally in the
world and became no. 1 worldwide in terms of sales of passenger cars and light commercial vehicles. The
Alliance is also the manufacturing leader of zero-emission vehicles, with more than 630,000 electric
vehicles sold since 2010, and is developing the innovative technologies of tomorrow’s autonomous,
connected and affordable vehicles.
GROUPE RENAULT
26 \ Groupe Renault

PRESENTATIONRenault-Nissan-Mitsubishi is the longest-lasting and most productive cross-cultural partnership in the auto industry. The goal of the Alliance is to turbocharge the member companies’ growth and performance. For 19 years, this partnership has offered a unique, pragmatic and agile model, always able to evolve and integrate new projects and partners. Now extended to the Mitsubishi group, it forms the largest automotive alliance in the world.The Alliance aims to create value for each partner and for all stakeholders (employees, customers, suppliers, etc.) through the identification of synergies and the implementation of common solutions in the interest of its members.
HIGHLIGHTS— On September 15, 2017, the Alliance announced a six-year plan (“Alliance 2022”) targeted at doubling annual synergies by the end of the plan from €5 billion in 2016 to €10 billion by the end of 2022. It is based on:
· four common platforms on which over nine million vehicles will be produced;· a greater proportion of common engines - from one-third in 2016 to three-
quarters of engines shared in 2022;· the sharing of electrification, connectivity and autonomous driving technologies;· 12 new 100% electric models with shared platforms and components;· 40 new vehicles with autonomous driving technology; and· the ambition to become an on-demand mobility services operator using
robo-vehicles.— On January 9, 2018, we announced the creation of a strategic venture capital fund, Alliance Ventures. Alliance Ventures plans to invest up to 1 billion USD over the next five years targeting the funding of start-ups to foster open innovation within the Alliance.
RENAULT-NISSAN-MITSUBISHI
Groupe Renault Facts & Figures / 1st half of 2018 / 27
PRESENTATIONRenault-Nissan-Mitsubishi is the longest-lasting and most productive cross-cultural partnership in the auto industry. The goal of the Alliance is to turbocharge the member companies’ growth and performance. For 19 years, this partnership has offered a unique, pragmatic and agile model, always able to evolve and integrate new projects and partners. Now extended to the Mitsubishi group, it forms the largest automotive alliance in the world.The Alliance aims to create value for each partner and for all stakeholders (employees, customers, suppliers, etc.) through the identification of synergies and the implementation of common solutions in the interest of its members.
HIGHLIGHTS— On September 15, 2017, the Alliance announced a six-year plan (“Alliance 2022”) targeted at doubling annual synergies by the end of the plan from €5 billion in 2016 to €10 billion by the end of 2022. It is based on:
· four common platforms on which over nine million vehicles will be produced;· a greater proportion of common engines - from one-third in 2016 to three-
quarters of engines shared in 2022;· the sharing of electrification, connectivity and autonomous driving technologies;· 12 new 100% electric models with shared platforms and components;· 40 new vehicles with autonomous driving technology; and· the ambition to become an on-demand mobility services operator using
robo-vehicles.— On January 9, 2018, we announced the creation of a strategic venture capital fund, Alliance Ventures. Alliance Ventures plans to invest up to 1 billion USD over the next five years targeting the funding of start-ups to foster open innovation within the Alliance.

28 \ Groupe Renault
RENAULT-NISSAN-MITSUBISHI
EVOLUTION OF SYNERGIES
€ million
— The amount of synergies is reviewed by the Controllers of each company.— Only new synergies are taken into account.— Synergies come from cost reductions, cost avoidance
and revenue increases.
SYNERGIES
— In March 2018, Renault-Nissan-Mitsubishi announced the acceleration of convergence in key operational areas: Engineering, Manufacturing, Purchasing, Quality & Total Customer Satisfaction, Aftersales and Business Development.— On June 13, 2018, the Alliance reported a 14% year-over-year increase in synergies to €5.7 billion, up from €5 billion in 2016.
SALES
— Renault-Nissan-Mitsubishi reported strong growth in 2017, with more than 10.6 million vehicles sold worldwide. One in nine vehicles sold in 2017 belongs to the Alliance.— This momentum has continued in 2018, with the Alliance announcing industry-leading mid-year sales of 5,538,530 in the first six months of the year (January 1 – June 30). — Renault-Nissan-Mitsubishi continues to lead the market for zero-emission vehicles, with more than 630,000 electric vehicles sold since 2010.
7,000
6,000
5,000
4,000
3,000
2,000
1,000
0
5,700
2017
Ob
ject
ive
20
22
4,316
2015
3,802
2014
2,872
2013
2,691
2012
1,746
2011
1,632
2010
5,025
2016
10,000
Ob
ject
ive
20
22
Groupe Renault Facts & Figures / 1st half of 2018 / 29
GROUPE RENAULTCORPORATE COMMUNICATION
Photo credits – Cover: Fernando Guerra – P. 1: Sébastien Staub – P. 4: Sean Klingelhoefer/Havas Paris, Renault Marketing 3D-Commerce, LADA – P. 5: Yannick Brossard – P. 26: Getty Images/Dong Wenjie – P. 27: Getty Images.
Design and production: .

Renault 13-15. quai Le Gallo
92513 Boulogne-Billancourt Cedex France
Tel.: 33 (0)1 76 84 04 04
Groupe Renault Communication
Find all our lastest news onwww.groupe.renault.com/enand follow us on social networks:
@Groupe_Renault @GroupeRenault @GroupeRenault @GroupeRenault @GroupeRenault @RenaultLive @GroupeRenault