self generation and consumption of solar...
TRANSCRIPT
Self Generation and
Consumption of
Solar Energy
Drivers
Rationale
Models
Enablers
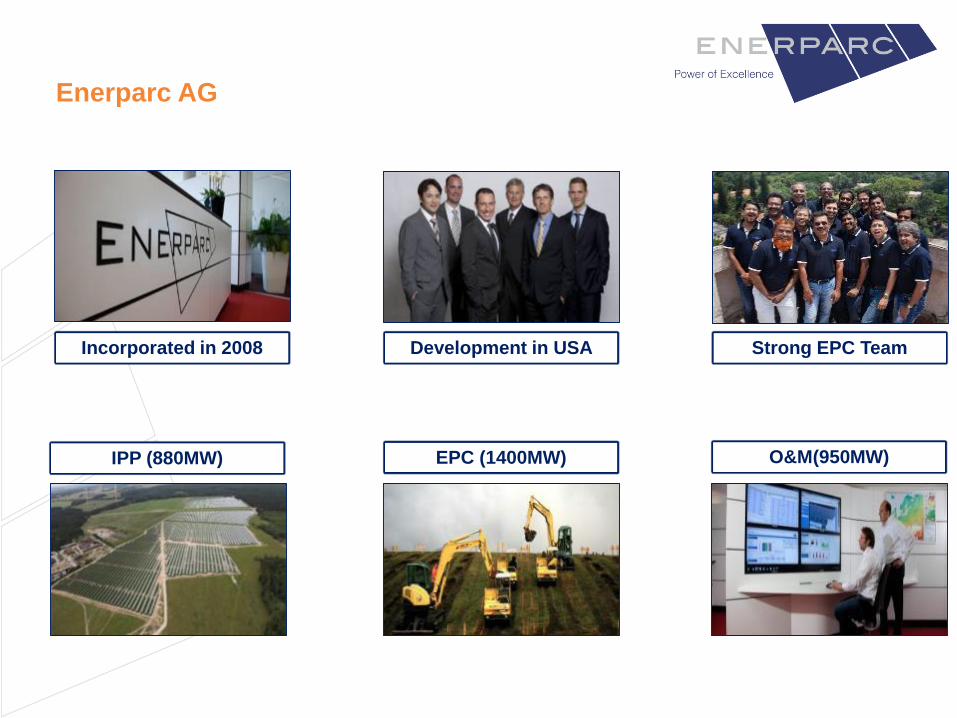
Enerparc AG
Incorporated in 2008 Development in USA Strong EPC Team
IPP (880MW) EPC (1400MW) O&M(950MW)
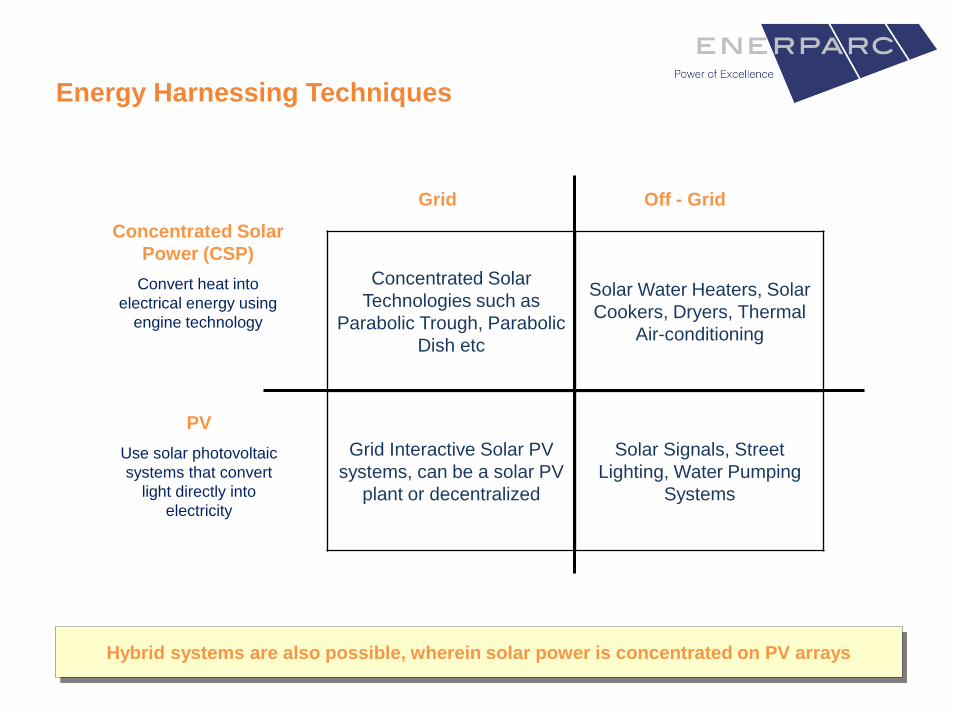
Concentrated Solar
Technologies such as
Parabolic Trough, Parabolic
Dish etc
Solar Water Heaters, Solar
Cookers, Dryers, Thermal
Air-conditioning
Grid Interactive Solar PV
systems, can be a solar PV
plant or decentralized
Solar Signals, Street
Lighting, Water Pumping
Systems
Concentrated Solar
Power (CSP)
Convert heat into
electrical energy using
engine technology
PV
Use solar photovoltaic
systems that convert
light directly into
electricity
Grid Off - Grid
Hybrid systems are also possible, wherein solar power is concentrated on PV arrays
Energy Harnessing Techniques
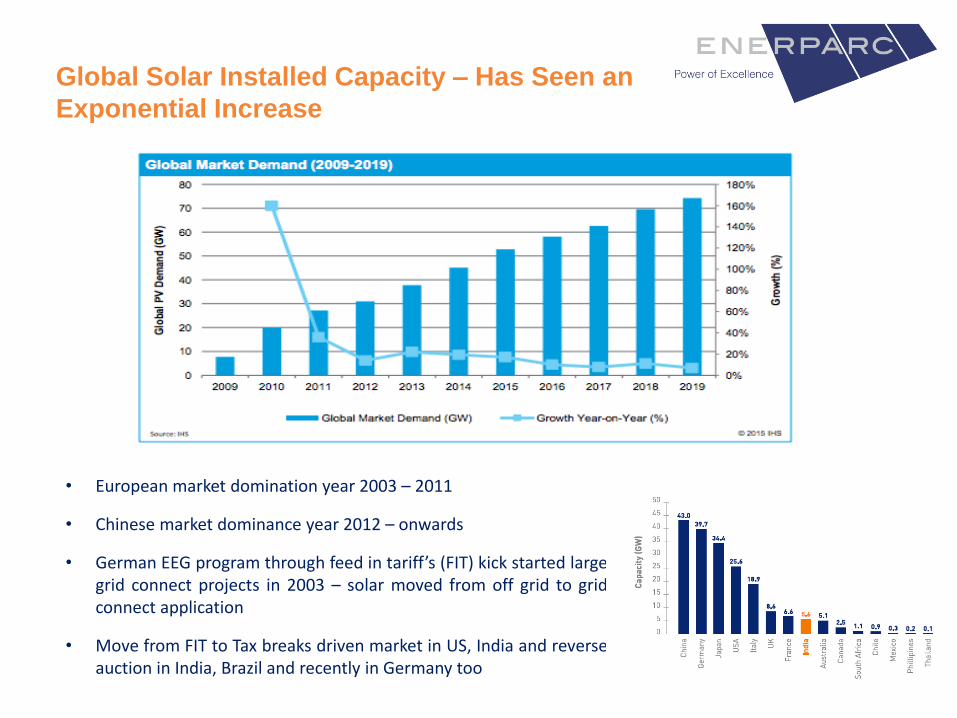
• European market domination year 2003 – 2011
• Chinese market dominance year 2012 – onwards
• German EEG program through feed in tariff’s (FIT) kick started largegrid connect projects in 2003 – solar moved from off grid to gridconnect application
• Move from FIT to Tax breaks driven market in US, India and reverseauction in India, Brazil and recently in Germany too
Global Solar Installed Capacity – Has Seen an
Exponential Increase
0
1000
2000
3000
4000
5000
6000
7000
8000
9000
10000
0
500
1000
1500
2000
2500
3000
3500
4000
2010 2011 2012 2013 2014 2015 2016 e
Cu
mu
lati
ve M
W
MW
Utility C&I Cumulative
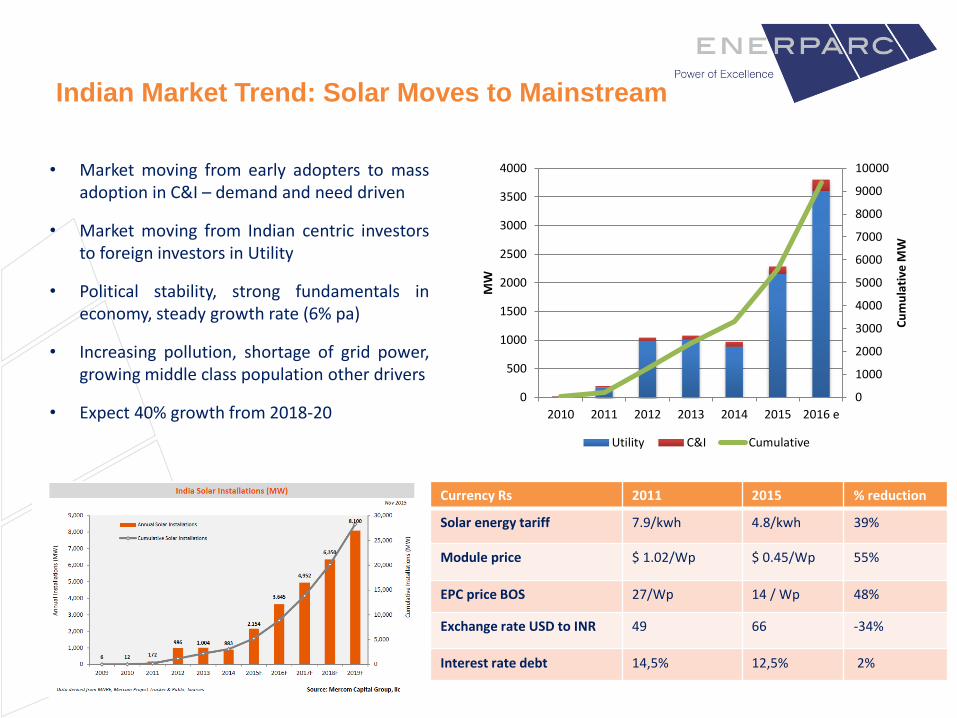
• Market moving from early adopters to massadoption in C&I – demand and need driven
• Market moving from Indian centric investorsto foreign investors in Utility
• Political stability, strong fundamentals ineconomy, steady growth rate (6% pa)
• Increasing pollution, shortage of grid power,growing middle class population other drivers
• Expect 40% growth from 2018-20
Currency Rs 2011 2015 % reduction
Solar energy tariff 7.9/kwh 4.8/kwh 39%
Module price $ 1.02/Wp $ 0.45/Wp 55%
EPC price BOS 27/Wp 14 / Wp 48%
Exchange rate USD to INR 49 66 -34%
Interest rate debt 14,5% 12,5% 2%
Indian Market Trend: Solar Moves to Mainstream
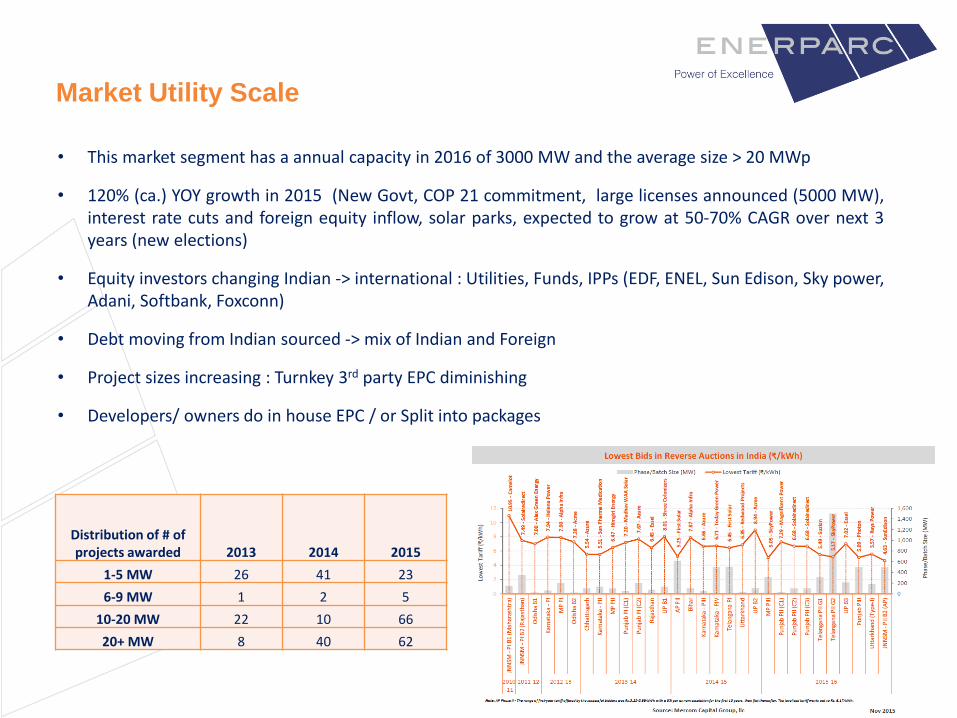
• This market segment has a annual capacity in 2016 of 3000 MW and the average size > 20 MWp
• 120% (ca.) YOY growth in 2015 (New Govt, COP 21 commitment, large licenses announced (5000 MW),interest rate cuts and foreign equity inflow, solar parks, expected to grow at 50-70% CAGR over next 3years (new elections)
• Equity investors changing Indian -> international : Utilities, Funds, IPPs (EDF, ENEL, Sun Edison, Sky power,Adani, Softbank, Foxconn)
• Debt moving from Indian sourced -> mix of Indian and Foreign
• Project sizes increasing : Turnkey 3rd party EPC diminishing
• Developers/ owners do in house EPC / or Split into packages
Distribution of # of projects awarded 2013 2014 2015
1-5 MW 26 41 23
6-9 MW 1 2 5
10-20 MW 22 10 66
20+ MW 8 40 62
Market Utility Scale
10
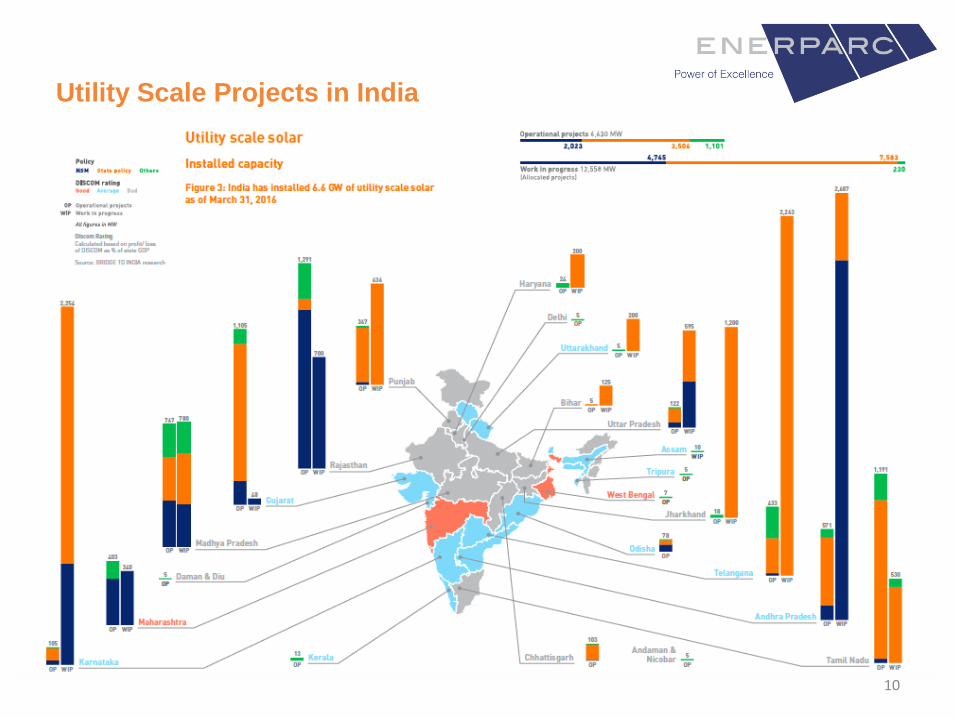
Utility Scale Projects in India
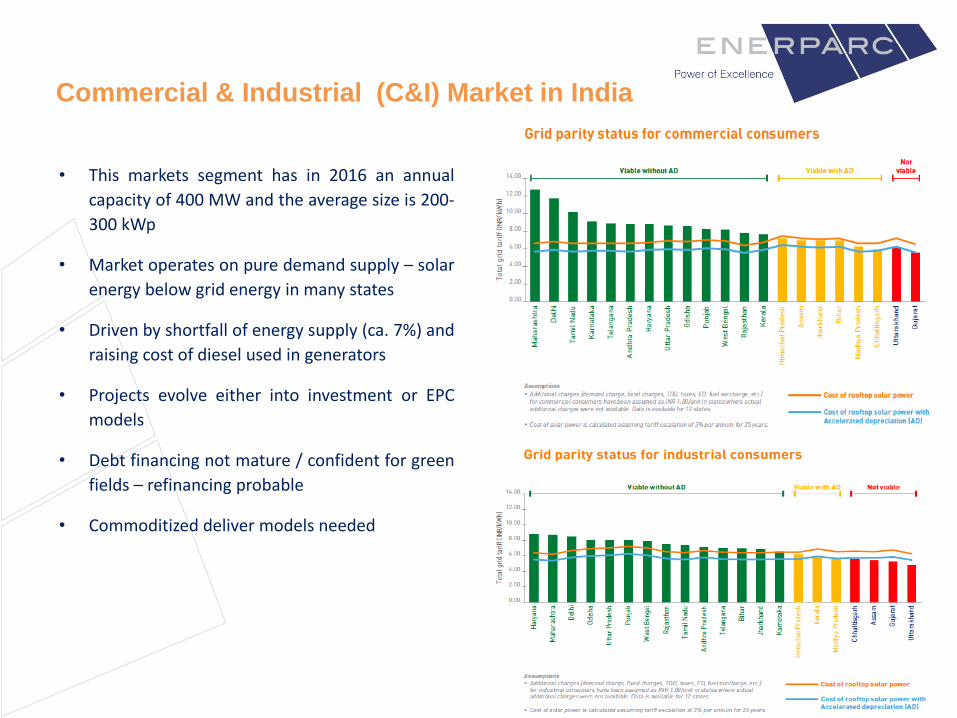
• This markets segment has in 2016 an annual
capacity of 400 MW and the average size is 200-
300 kWp
• Market operates on pure demand supply – solar
energy below grid energy in many states
• Driven by shortfall of energy supply (ca. 7%) and
raising cost of diesel used in generators
• Projects evolve either into investment or EPC
models
• Debt financing not mature / confident for green
fields – refinancing probable
• Commoditized deliver models needed
Commercial & Industrial (C&I) Market in India
12
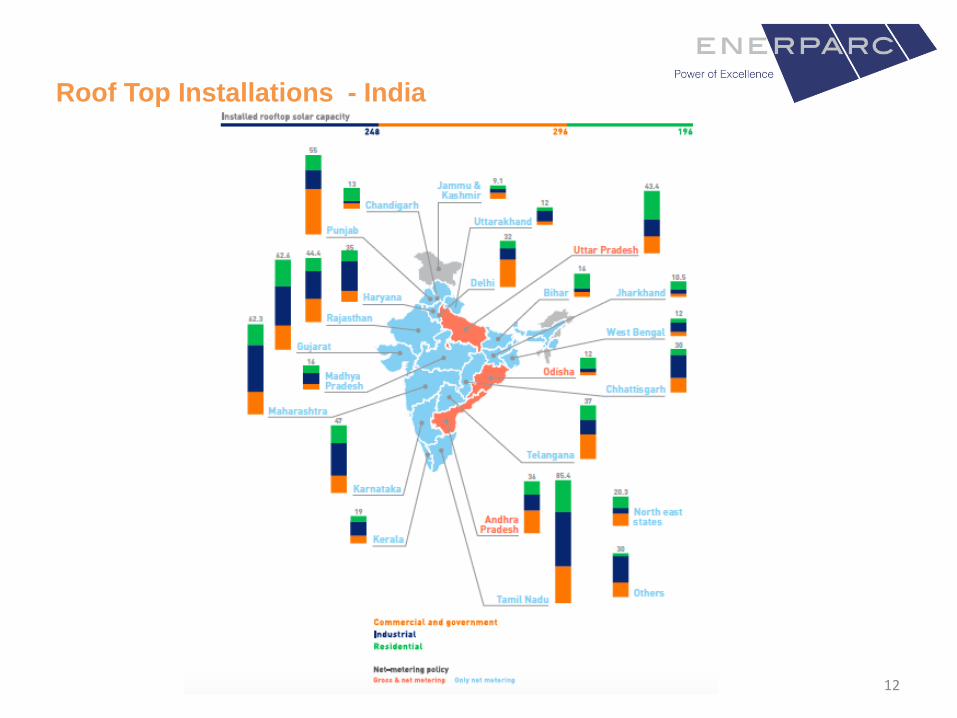
Roof Top Installations - India
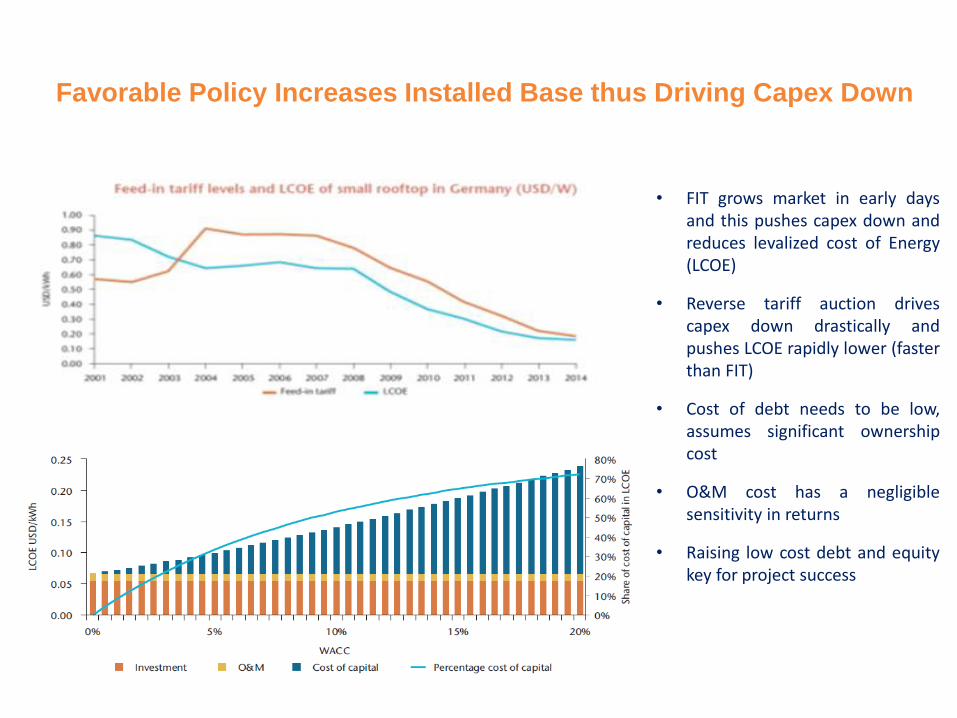
• FIT grows market in early daysand this pushes capex down andreduces levalized cost of Energy(LCOE)
• Reverse tariff auction drivescapex down drastically andpushes LCOE rapidly lower (fasterthan FIT)
• Cost of debt needs to be low,assumes significant ownershipcost
• O&M cost has a negligiblesensitivity in returns
• Raising low cost debt and equitykey for project success
Favorable Policy Increases Installed Base thus Driving Capex Down
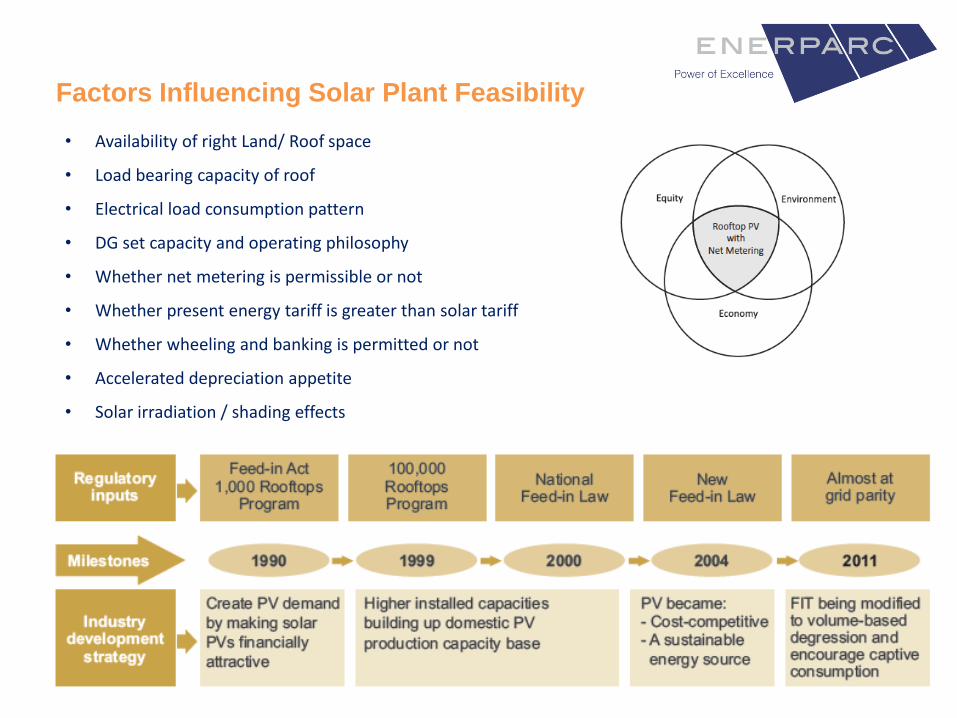
• Availability of right Land/ Roof space
• Load bearing capacity of roof
• Electrical load consumption pattern
• DG set capacity and operating philosophy
• Whether net metering is permissible or not
• Whether present energy tariff is greater than solar tariff
• Whether wheeling and banking is permitted or not
• Accelerated depreciation appetite
• Solar irradiation / shading effects
Factors Influencing Solar Plant Feasibility
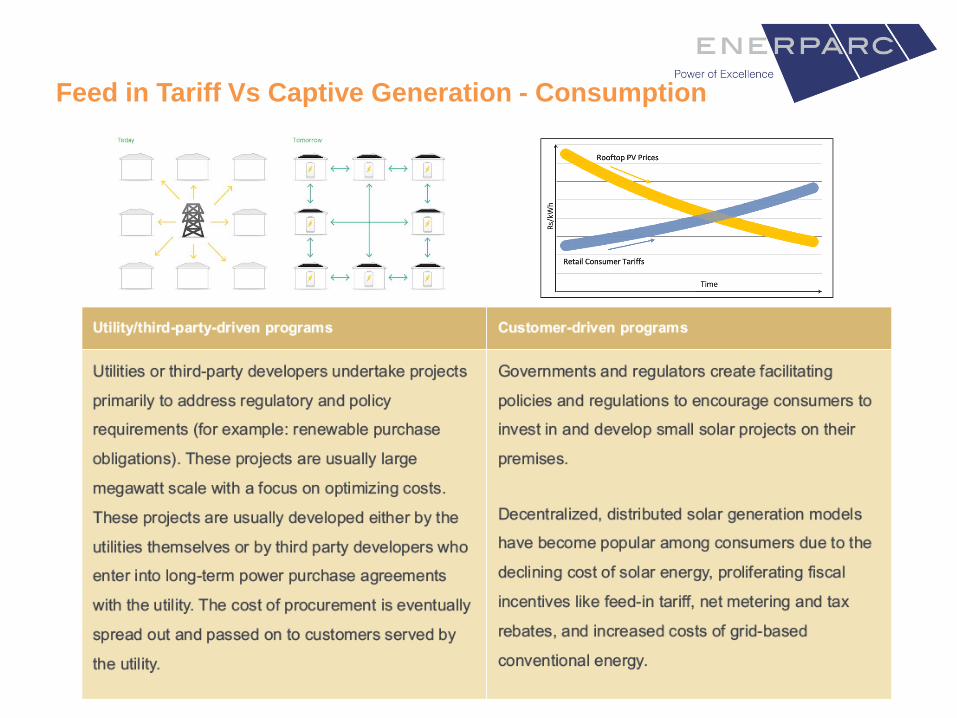
Feed in Tariff Vs Captive Generation - Consumption
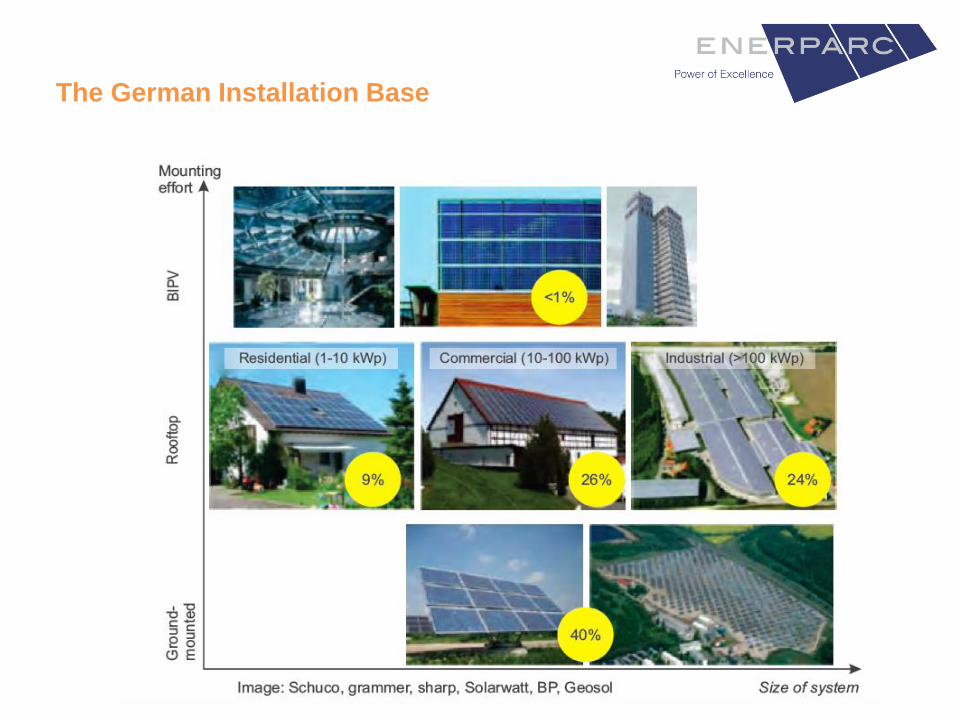
The German Installation Base
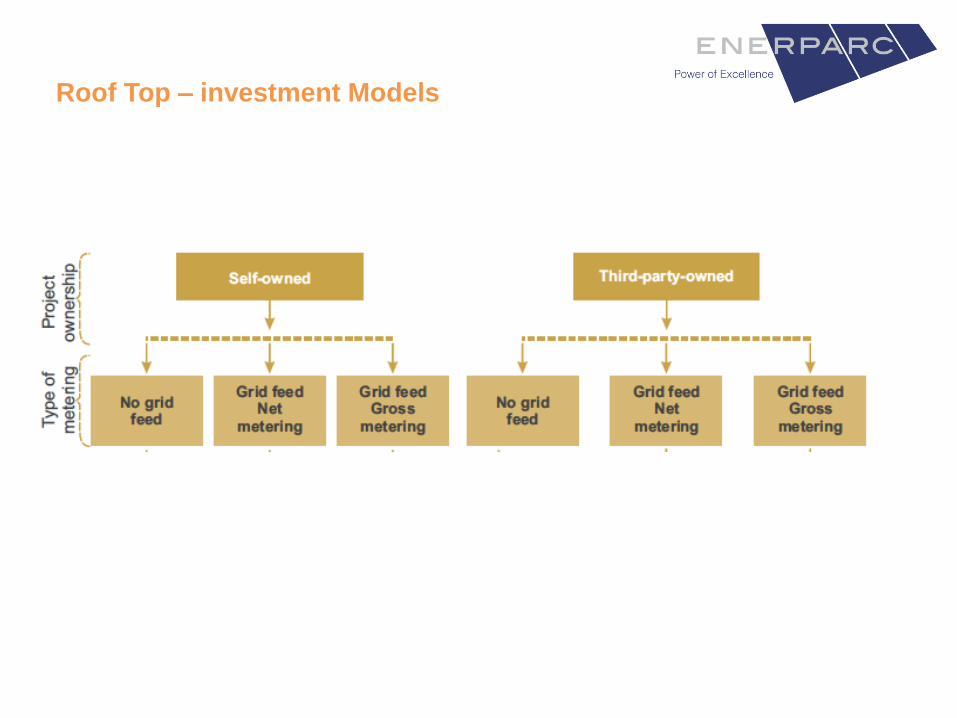
Roof Top – investment Models
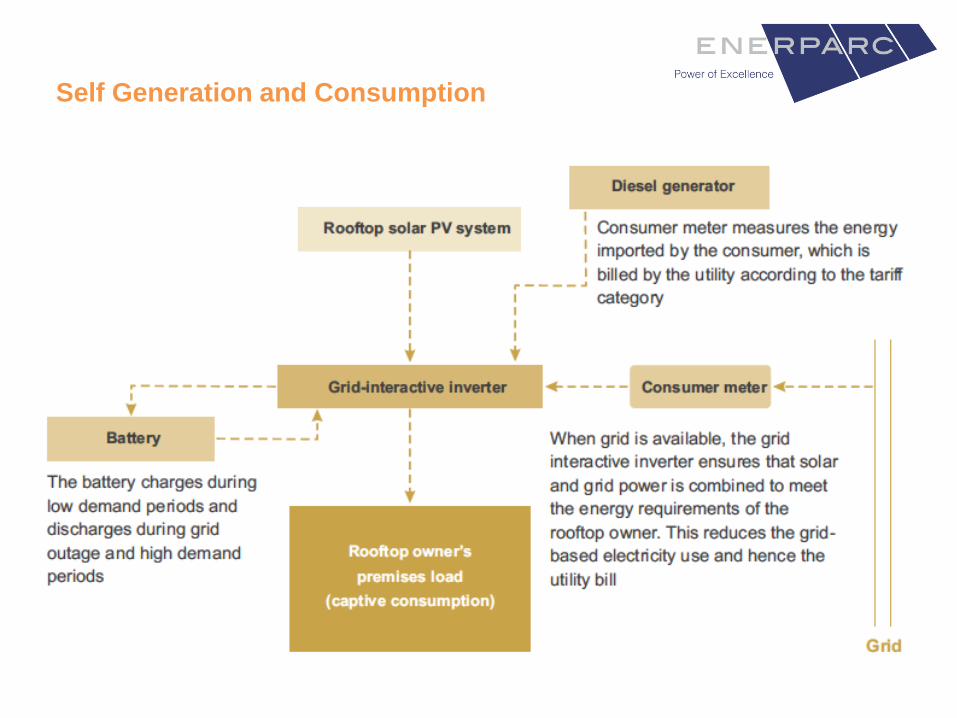
Self Generation and Consumption
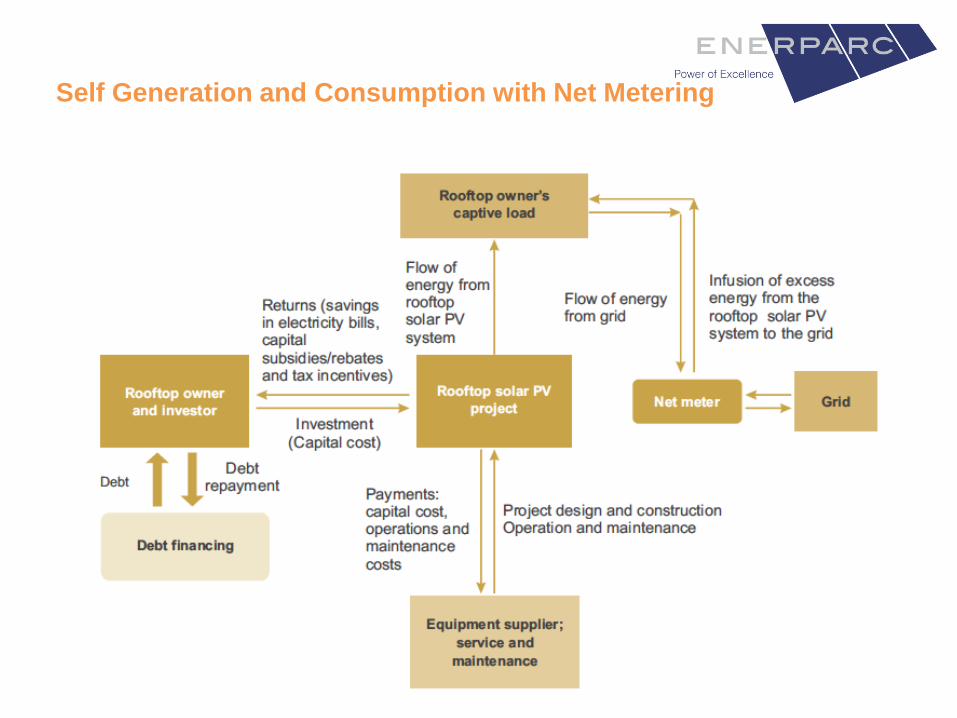
Self Generation and Consumption with Net Metering
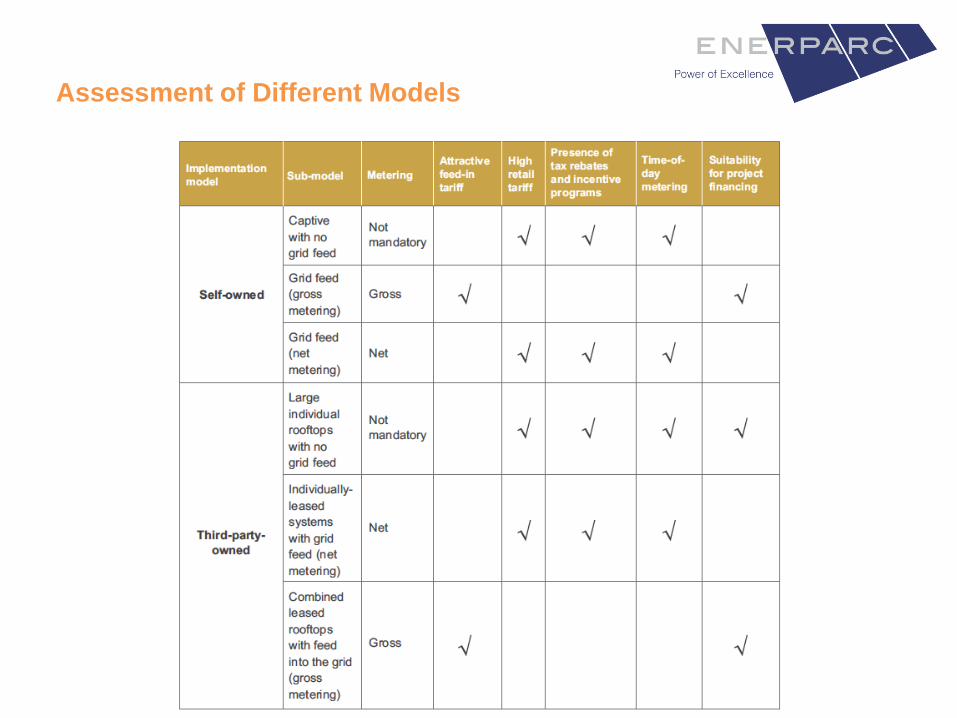
Assessment of Different Models
Your Partner in Creating a Greener World