tatiana andreyeva pierre-carl michaud - rand.org · tatiana andreyeva pierre-carl michaud arthur...
TRANSCRIPT
Obesity and Health in Europeans Ages 50 and Above TATIANA ANDREYEVA PIERRE-CARL MICHAUD ARTHUR VAN SOEST
WR-331
November 2005
WORK ING P A P E R
This product is part of the RAND Labor and Population working paper series. RAND working papers are intended to share researchers’ latest findings and to solicit informal peer review. They have been approved for circulation by RAND Labor and Population but have not been formally edited or peer reviewed. Unless otherwise indicated, working papers can be quoted and cited without permission of the author, provided the source is clearly referred to as a working paper. RAND’s publications do not necessarily reflect the opinions of its research clients and sponsors.
is a registered trademark.
Obesity and Health in Europeans Ages 50 and Above1
Tatiana Andreyeva, Pardee RAND Graduate School
Pierre-Carl Michaud, RAND
Arthur van Soest, RAND & Tilburg University
November 29, 2005
Correspondence:
Tatiana Andreyeva
1776 Main Street
Santa Monica, CA 90407-2138
Tel. (310) 393-0411 x6047
Fax (310) 260-8155
Email: [email protected]
Abstract
1 This paper benefited from comments by Arie Kapteyn, PhD. The data are from Release 1 of SHARE
2004. The SHARE data collection has been primarily funded by the European Commission through the 5th
framework program (project QLK6-CT-2001-00360 in the thematic program Quality of Life). Additional
funding came from the US National Institute on Aging (U01 AG09740-13S2, P01 AG005842, P01
AG08291, P30 AG12815, Y1-AG-4553-01 and OGHA 04-064). Data collection in Austria (through the
Austrian Science Fund, FWF), Belgium (through the Belgian Science Policy Office) and Switzerland
(through BBW/OFES/UFES) was nationally funded.
1
Abstract
We use a unique cross-country data set covering nearly 22,000 elderly individuals
(age 50+) from 10 European Countries. Cross-country differences in the prevalence
of obesity in older Europeans are substantial and exceed sociodemographic
differentials in obesity. Obesity is strongly associated with major health risk factors,
yet cross-country differences exist in how obesity is related to depression, heart
disease and high cholesterol levels. Large heterogeneity in obesity across European
countries should be investigated further to identify areas for effective public policy.
2

Introduction
Over the last several decades, obesity has been increasing globally in virtually all
population groups.1-7
The growth in the population fraction with unhealthy body weight
was particularly high in the US, although it has reached worrisome proportions in other
developed and developing countries as well. About two-thirds of US adults aged 20 years
and older is now either overweight or obese (defined as having a body mass index (BMI)
of 25 kg/m2
and above) and about 30% of US adults are obese (BMI>30 kg/m2).
2 On the
global scale, more than one billion adults are estimated to be overweight with at least 300
million of them qualifying as obese.8
Obesity is an established risk factor for many of the highly-prevalent, mortality-
driving and costly chronic conditions, such as cardiovascular disease, diabetes and some
types of cancer.6, 9-11
Through these and other health conditions, including work
disability, obesity increases the financial burden of public transfer programs and private
health plans. The costs are large. At the individual level, obesity is associated with health
care expenditures that are on average about one-third above medical costs of otherwise
similar individuals with normal weight.12-13
This exceeds the effects of smoking or
problem drinking on health care costs.12
At the aggregate level, obesity accounts for
about 6-10% of national health care spending in the US and 2.0-3.5% in other Western
countries.13-20
The rising trends in obesity can explain 27% of the growth in real health
care spending over 1987-2001.21
Obesity is a particular concern in older adults because its health effects are more
likely to develop in middle age. Studies of obesity in younger populations may not
capture all of the effects that obesity has on health and health care outcomes. Another
3
reason to focus an obesity study on older adults is that many of today’s obese are in their
50’s and 60’s.2 This population will be a long-time beneficiary of public transfer
programs that already pay for almost half of medical expenditures attributable to
overweight and obesity in the US.13
Older adults will be unlikely to have major changes
in weight by the end of life except before death or/and in cases like developing cancer.
As a consequence, these age groups are of particular interest from a policy perspective.
Despite the recent boom in obesity research, multinational comparisons of obesity
and its patterns remain scarce, particularly for population groups like the elderly. The
best-known cross-national estimates to date are generally limited to studies among
children,22-25
and data from the World Health Organization MONICA (Multinational
MONItoring of trends and determinants in CArdiovascular disease) project in 21
countries for 25-64-year old adults.26-28
One exception is a recent cross-national study
that looked at obesity across individuals aged 15-75 using data from the European
Community Household Panel.29
Cross-national data on obesity in older adults became
available for 10 European countries in the beginning of 2005, whereas parallel surveys
for all population groups are yet to be collected. As a result, national differences in the
prevalence of obesity and the factors that generate them remain largely unstudied.
In this paper we used data from the 2004 Survey of Health, Ageing and
Retirement in Europe (SHARE) to document the prevalence of obesity and obesity-
related health conditions in the population ages 50 and above in 10 European countries.
In addition, we examined the association between obesity and several major health risk
factors as well as self-reported health, and studied how it varied across SHARE countries.
We also evaluated whether differences in the sociodemographic composition of the
4
countries could explain large heterogeneity in the prevalence of obesity among older
Europeans.
Data and Methods
The perfect data for our study would be a recent, cross-national, representative
survey with detailed health information, body weight and height data, sociodemographic
characteristics and behavioral factors. A review of the existing nationally representative
surveys of older respondents in Europe has identified the 2004 SHARE as the best
available resource. The primary advantages of the SHARE data are cross-national
variation across 10 European countries and the focus on individuals aged 50 and above –
a population group at higher risk for developing chronic health problems and functional
limitations than all adults.
The SHARE is a multidisciplinary cross-national survey that combines
information on health, socio-economic status, social and family networks of Continental
Europeans over the age of 50 and their spouses. The baseline 2004 SHARE study
includes data on 11 countries that provide a balanced representation of the different
European regions from Scandinavia (Denmark and Sweden) through Central Europe
(Austria, France, Germany, Switzerland, Belgium, The Netherlands) to the Mediterranean
(Spain, Italy and Greece). This study used data from SHARE Release 1 (April 28th
,
2005), in which data from Belgium was not available yet.30
Designed after the role models of the US Health and Retirement Study (HRS) and
the English Longitudinal Study of Ageing (ELSA), the 2004 SHARE collected
information on health (e.g., self-reported health, physical functioning, cognitive
5
functioning, health behaviors, health care utilization and expenditure), psychological
conditions (e.g., psychological health, well-being, life satisfaction), socio-economic
status (e.g., work activity, job characteristics, income, wealth and consumption, housing,
education), and social support (e.g., social networks, volunteer activities).
The 2004 SHARE Release I sample included 22,777 respondents from 10
European countries. The survey was administered as computer assisted personal
interviewing (CAPI) in the fall of 2004 among participants drawn from probability
samples in all participating countries. The sampling plan followed a complex
probabilistic multistage design to produce estimates representative of the non-
institutionalized population aged 50 and above in each country. The study also
interviewed spouses younger than 50. The response rate varied by country but on average
was 57% for households and 86% for individuals within participating households.30
A
detailed description of the SHARE data and methodology were published elsewhere.30-31
The data is available to registered users from the SHARE website (http://www.share-
project.org).
We imposed several necessary sample restrictions. First, we excluded individuals
younger than the age of 50 (759 observations or 3.3% of the original sample). The second
exclusion (1663 observations or 7.3% of the original sample) was for the data with
missing values on at least one measure used in our estimations. After all exclusions
21,114 individuals remained eligible for our analysis (9679 men and 11,435 women).
Measures
Obesity: The variable of primary interest was a measure of relative body weight.
Individuals were classified into weight categories based on their BMI (weight in
6
kilograms divided by the square of height in meters) calculated from self-reported weight
and height. We used the evidence-based clinical guidelines for the classification of
overweight and obesity in adults, published by the National Heart, Lung and Blood
Institute of the National Institutes of Health (NIH) to stratify the study respondents into
four weight classes: underweight (BMI<18.5), normal weight (BMI: 18.5-24.9),
overweight (BMI: 25.0-29.9), moderate obesity (BMI: 30.0-34.9), and severe obesity
(BMI: >=35.0).32
The sample size for extreme obesity (BMI: >=40.0), another weight
class in the NIH guidelines, was too small to enable meaningful estimation. We separated
the obesity group into moderate and severe obesity because there are differential health
effects by degree of obesity. Severe obesity is associated with more chronic health
problems than moderate obesity, and the onset is at earlier ages.9-10,33
As a result, there
are large differences across the obesity groups in health care utilization and costs.34
Health conditions: We examined a vector of five chronic conditions that have
well-established links with obesity in the literature. These were self-reported doctor-
diagnosed chronic diseases as assessed from responses to the survey question “Has a
doctor ever told you that you have any of these conditions…” such as 1) diabetes or high
blood sugar (the type of diabetes was not assessed); 2) cardiovascular disease (a heart
attack, including myocardial infarction or coronary thrombosis or any other heart
problem, including congestive heart failure), 3) high blood pressure or hypertension, 4)
high blood cholesterol, and 5) arthritis, including osteoarthritis or rheumatism. We also
analyzed subjective assessments of general health using an indicator for fair or poor self-
reported health. Health status was evaluated by asking, “Would you say your health is
excellent, very good, good, fair, or poor?” Finally, we used the depression scale EURO-D
7
to evaluate how obesity is related to emotional health, validated in an earlier cross-
European study.35-36
The EURO-D depression scale was based on categorical responses to whether in
the month before the interview individuals experienced problems related to any of the 12
feelings, including sadness or depression, pessimism, suicidality, guilt, sleep trouble,
interest, concentration, appetite, irritability, fatigue, enjoyment, and tearfulness. The
threshold for depression was scoring 4 and above on the EURO-D depression scale.
Sociodemographic covariates: To isolate the effect of relative body weight on
health, we included a set of sociodemographic covariates, such as age (five-year
increment age groups of 50-54, 60-64, 65-69, 70-74, 75-79, 80+; 55-59 was the
reference), the highest educational achievement (secondary education, tertiary education;
primary or no education was the reference), and an indicator for marriage/registered
partnership. To account for the effects of behavioral risk factors on health, we used
tobacco-smoking status (current smoking, smoking in the past; never smoking was the
reference). The model specifications in the pooled sample included a vector of country
indicators.
We pooled the SHARE data across all countries and conducted all analyses
separately for men and women. Descriptive estimates accounted for the complex
sampling design using information on the survey weights as implemented in survey data
estimation commands in STATA 8.2 (Stata Corporation, College Station, TX). We
conducted statistical testing of differences between the country means and the sample
average for all prevalence estimates. We used logistic regression in STATA to generate
the odds ratio (ORs) and their 95% confidence intervals (CIs) for the association between
8
weight classes and health outcomes. We replicated all regression analyses in the pooled
sample and separately by country. Finally, we tested whether the observed cross-country
differences in obesity were generated by sociodemographic variation across countries
comparing the non-adjusted ORs (based on the descriptive statistics) and adjusted ORs
(based on the results from multivariate logistic regression) for obesity across countries
and population groups.
Results
Obesity: The prevalence of overweight and obesity (Table 1) in Europeans over
the age of 50 was high. On average, only a third of men (33.4%) qualified as having
normal weight, whereas notably more women (44.2%) had normal weight in the 2004
SHARE. About 50% of men were overweight with another 13.3% obese and almost 3%
severely obese. The percentage of overweight women was lower than that of men (36%)
but similar for obesity (13.5%) and slightly higher for severe obesity (4.3%). The
prevalence rate of underweight was very low for both men (0.5%) and women (2%).
Among education groups (Table 2), men and women with primary or no education had
the highest rate of moderate and severe obesity (19.2% and 20.4% respectively).
Stratifying by smoking status, the lowest prevalence of obesity was found among current
smokers (14.2% men; 12.1% women). There was little difference in the prevalence of
overweight and obesity between the samples of 50-64-year olds and 65 and older.
The rates of unhealthy body weight varied substantially across European countries
(Table 1). Spain had the highest prevalence of moderate and severe obesity among both
men (20.2%) and women (25.5%) with almost twice much severe obesity among Spanish
9
women than the SHARE average (7.4% vs. 4.3%, p<0.01). Men were the least likely to
qualify as moderately or severely obese in Sweden (12.8%) and women in Switzerland
(12.3%, less than half of the obesity rate in Spain). Switzerland, The Netherlands, the
Nordic countries Denmark and Sweden had significantly higher rates of normal weight
men than the average SHARE rate (p<0.01). The Nordic countries, Switzerland and
France had higher rates of normal weight women than the SHARE average. In contrast,
the Southern-European countries Greece and Spain had percentages of normal weight
men and women well below the sample average (p<0.01).
We tested whether the observed cross-country differences in the prevalence of
obesity were driven by sociodemographic differences in the composition of the countries.
Adjusting for age, education, marital status and smoking (based on a logistic regression
for obesity defined by BMI>=30) did not reduce the magnitudes much (results not
presented). The largest change after the compositional adjustment was for obesity in
Spain relative to Switzerland. The unadjusted OR for men was 1.71, which the
adjustment for sociodemographic covariates reduced to 1.43 (p<0.01). Similarly, the
unadjusted OR for women in Spain relative to Switzerland was 2.57, which was reduced
to 2.22 (p<0.01) after adjusting for sociodemographics. The unadjusted OR for women
with the least education relative to the highest educational level was 2.19, which after
adjusting for other individual characteristics and the country of residence grew to 2.21
(p=0.73). The OR for the comparison of the least educated and the most educated men
was 1.99 in the non-adjusted statistics and 2.31 in the regression framework (p<0.01).2
2 We tested the null hypothesis that the odds ratio was the same before and after adjusting for
sociodemographic covariates. This was done using a minimum distance test comparing the difference
between the two estimates (Hausman J. Specification tests in econometrics. Econometrica. 1978;46:1251-
71).
10
The cross-country differences in the prevalence of obesity-related chronic
conditions were also substantial (Table 3)3. Spain, the country with the biggest obesity
prevalence in older men and women, had the highest rate of diabetes as well (14.3% men;
13.5% women). In a similar fashion, Switzerland mirrored its low obesity rates in the
least prevalence of diabetes in SHARE (7.2% men; 4.1% women). The link with the
obesity patterns was however less apparent for other health conditions. For example,
France had the biggest prevalence of reported doctor-diagnosed high cholesterol levels in
both men and women (23.2% men; 25.8% women), albeit the prevalence of obesity was
relatively low in this country. Other than obesity factors such as cross-country differences
in smoking behavior, physical activity and diet were probably responsible for the
observed discrepancies in the prevalence of obesity and some chronic conditions (e.g.,
heart disease, high cholesterol levels).
Moderate and severe obesity were significantly associated with poor or fair self-
reported health, diabetes, high cholesterol levels, hypertension, arthritis, and heart disease
in both men and women (Table 4). Compared with older men with normal weight, men
with a BMI of 30-34.9 had an OR of 1.60 (95% CI, 1.38-1.86) for reporting fair or poor
health, 2.74 (95% CI, 2.23-3.37) for diagnosed diabetes, 1.54 (95% CI, 1.31-1.83) for
high cholesterol levels, 2.82 (95% CI, 2.44-3.27) for hypertension, 1.56 (95% CI, 1.28-
1.89) for arthritis, and 1.57 (95% CI, 1.30-1.89) for heart disease. The detrimental health
effects of severe obesity in men were even more substantial, particularly for poor or fair
health (OR=2.49; 95% CI, 1.89-3.29), hypertension (OR=4.09; 95% CI, 3.12-5.35), and
diabetes (OR=4.27; 95% CI, 3.08-5.90). Severe obesity was also negatively related to
depression in men (OR=1.47; 95% CI, 1.06-2.02), whereas there was no effect for
3 See [37] for a SHARE-based analysis of the prevalence of health conditions and socio-economic status.
11
moderate obesity or overall obesity (BMI>=30), and even a protective positive effect for
overweight men.
Moderate and severe obesity in women was associated with higher ORs than in
men for having diabetes, arthritis, heart disease, and reporting fair or poor health. For
example, compared to women with normal weight, obese women had on average an OR
of 2.27 (95% CI, 1.67-3.09) for reporting fair or poor health if they had a BMI in the 30-
34.9 range, and an OR of 4.15 (95% CI, 1.67-3.09) if they had a BMI of 35 and above.
Similar to the findings for men, severe obesity in women was associated with the biggest
health risk in terms of an OR for diabetes. It was associated with an almost six times
higher chance of diabetes in women with a BMI of 35 and above compared to normal
weight women (OR=5.97; 95% CI, 4.63-7.71). The results for depression in women did
not parallel those for men. We found that moderate obesity was associated with an OR of
1.37 (95% CI, 1.20-1.55) for depression in older women, whereas severe obesity had an
OR of 1.97 (95% CI, 1.62-2.41).
Discussion
Our study shows large heterogeneity in the prevalence of obesity among
Europeans aged 50 and above. The compositional differences of the countries with rather
distinct sociodemographic characteristics do not explain the observed variation in
obesity. Differences related to the culture of diet, physical activity and other lifestyle
behaviors, as well as genetics, may be responsible for the substantial variation in the
prevalence of obesity and obesity-related chronic health conditions in Europe. These
12
differences should be investigated, as they are likely to suggest some areas where public
health policy could be effective.
Obesity is strongly associated with major health risk factors, particularly diabetes
and hypertension, and the effect is robust in all European counties in SHARE. Yet, cross-
country differences exist in how obesity is related to depression, heart disease, and high
cholesterol levels (Table 5). We found a significant link between obesity and heart
disease among men in four out of the ten countries examined, with no apparent
explanation of the differences related to the sample size of the countries or other obvious
reasons. The association between obesity and high cholesterol levels was not significant
in the countries like France that have traditionally cholesterol-rich diet and high estimates
of excessive cholesterol levels. Arthritis in men was another condition that had weak
links with obesity in the by-country analysis. Obesity was found to have no relation with
depression for men in any of the countries examined, but it affected women in selected
countries (with no clear geographic or cultural pattern), and had no effect on depression
in others. Reasons for such differential effects of obesity across countries deserve further
research.
The current study has three potential limitations that may be overcome by future
data collection. First, we only have self-reported height and weight. Several studies show
that body weight, at least in the US, is often underreported by individuals with excessive
body weight (with an increasing proportion among the more obese). Moreover,
respondents tend to overestimate height, particularly in older population groups.38-40
If
the tendency to systematically under- or over-report varies across countries, this could
hamper our cross-country comparison. To test this hypothesis, we would also need
13
objective measurements in the SHARE countries. Second, in the analysis of the
association between obesity and chronic health conditions, undiagnosed chronic diseases
could not be counted. Given the potential differences in health care systems across the
SHARE countries, this may imply that the prevalence of specific health conditions is
underestimated more in some countries than in others. Third, we had relatively small
samples and low response rates in some countries, particularly Switzerland. Finally, the
survey does not cover the institutionalized population.
Obesity is preventable. Previous research has shown that sustained lifestyle
changes in physical activity and diet can be effective in preventing weight gain, reducing
obesity and related health risk factors.6,32,41
Obesity is a significant problem in older
Europeans that already affects every eighth Swiss, every sixth German men, and every
fourth women in Spain. Nevertheless, the obesity problem has yet to generate sufficient
social and policy attention to enable changes in the European countries, including those
that are of particular need for reform. Along with urgent policy initiatives to address
health care needs of their aging populations, identifying programs that are likely to have
the largest potential in maintaining healthy weight and reducing obesity should be
national priorities in European countries as well.
14
References
1. Flegal KM, Carroll MD, Kuczmarski RJ, Johnson CL. Overweight and obesity in the
United States: prevalence and trends, 1960-1994. Int J Obes Relat Metab Disord.
1998:22(1):39-47.
2. Flegal KM, Carroll MD, Ogden CL, Johnson CL. Prevalence and trends in obesity
among US adults, 1999-2000. JAMA. 2002;288(14):1723-7.
3. Mokdad AH, Serdula MK, Dietz WH, et al. The spread of the obesity epidemic in the
United States, 1991-1998. JAMA. 1999:282(16):1519-22.
4. National Center for Health Statistics. Health, United States, 2000. Hyattsville, MD:
NCHS, 2000.
5. Ogden CL, Flegal KM, Carroll MD, Johnson CL. Prevalence and trends in overweight
among US children and adolescents, 1999-2000. JAMA 2002;288:1728-32.
6. World Health Organization. Obesity: preventing and managing the global epidemic,
report of a World Health Organization consultation on obesity. World Health
Organization; WHO Technical Report Series, No. 894, 1998.
7. Truong KD, Sturm R. Weight gain trends across sociodemographic groups in the
United States. Am J Public Health. 2005;95(9):1602-6.
8. World Health Organization. The World Health Report 2002. Reducing Risks,
Promoting Healthy Life. Available at http://www.who.int/whr/2002/.
9. Must A, Spadano J, Coakley EH, Field AE, Colditz GA, Dietz WH. The disease
burden associated with overweight and obesity. JAMA. 1999;282(16):1523-9.
15
10. Field AE, Coakley EH, Must A, et al. Impact of overweight on the risk of developing
common chronic diseases during a 10-year period. Arch Intern Med.
2001;161(13):1581-6.
11. Mokdad AH, Ford E, Bowman B, et al. Prevalence of obesity, diabetes and obesity-
related health risk factors, 2001. JAMA. 2003;289(1):76-9.
12. Sturm R. The effects of obesity, smoking, and drinking on medical problems and
costs. Health Aff. 2002;21(2):245-54.
13. Finkelstein EA, Fiebelkorn IC, Wang G. National medical spending attributable to
overweight and obesity: how much, and who’s paying? Health Aff.
2003;Suppl:W3-219-26.
14. Wolf AM, Colditz GA. Current estimates of the economic cost of obesity in the
United States. Obes Res. 1998;6(2):97-106.
15. Colditz GA. Economic costs of obesity and inactivity. Med Sci Sports Exerc.
1999;31:S663-7.
16. Birmingham CL, Muller JL, Palepu A, Spinelli JJ, Anis AH. The costs of obesity in
Canada. CMAJ. 1999;160:483-8.
18. Schmid A, Schneider H, Golay A, Keller U. Economic burden of obesity and its
comorbidities in Switzerland. Soz Praventivmed. 2005; 50(2):87-94.
19. Swinburn B, Ashton T, Gillespie J, et al. Health care costs of obesity in New Zealand.
Int J Obes Relat Metab Disord. 1997; 21(10):891-6.
20. Levy E, Levy P, Le Pen C, Basdevant A. The economic cost of obesity: the French
situation. Int J Obes Relat Metab Disord. 1995;19(11):788-92.
16
21. Thorpe KE, Florence CS, Howard DH, Joski P. The impact of obesity on rising
medical spending. Health Aff. 2004;W4:480-486.
22. Lissau I, Overpeck MD, Ruan WJ, Due P, Holstein BE, Hediger ML; Health
Behavior in School-aged Children Obesity Working Group. Body mass index and
overweight in adolescents in 13 European countries, Israel, and the United States.
Arch Pediatr Adolesc Med. 2004;158(1):27-33.
23. Janssen I, Katzmarzyk PT, Boyce WF et al. Comparison of overweight and obesity
prevalence in school-aged youth from 34 countries and their relationships with
physical activity and dietary patterns. Obes Rev. 2005;6(2):123-32.
24. Lobstein T, Frelut ML. Prevalence of overweight among children in Europe. Obes
Rev. 2003;4(4):195-200.
25. Wang Y, Monteiro C, Popkin BM. Trends of obesity and underweight in older
children and adolescents in the United States, Brazil, China, and Russia. Am J
Clin Nutr. 2002;75(6):971-7.
26. Gostynski M, Gutzwiller F, Kuulasmaa K, et al. Analysis of the relationship between
total cholesterol, age, body mass index among males and females in the WHO
MONICA Project. Int J Obes Relat Metab Disord. 2004;28(8):1082-90.
27. Silventoinen K, Sans S, Tolonen H, et al. Trends in obesity and energy supply in the
WHO MONICA Project. Int J Obes Relat Metab Disord. 2004; 28(5):710-8.
28. Molarius A, Seidell JC, Sans S, Tuomilehto J, Kuulasmaa K. Educational level,
relative body weight, and changes in their association over 10 years: an
international perspective from the WHO MONICA Project. Am J Public Health.
2000;90(8):1260-8.
17
29. Sanz-de-Galdeano A. The obesity epidemic in Europe. IZA Discussion Paper No
1814, October 2005.
30. Borsch-Supan A, Brugiavini A, Jurges H, Mackenbach J, Siegrist J, Weber G. Health,
ageing and retirement in Europe: first results from the Survey of Health, Ageing
and Retirement in Europe. Manheim: MEA, 2005.
31. Borsch-Supan A, Jurges H (eds). Health, ageing and retirement in Europe -
methodology. Manheim: MEA, 2005 (forthcoming).
32. National Heart, Lung, and Blood Institute. Clinical Guidelines on the Identification,
Evaluation and Treatment of Overweight and Obesity in Adults: The Evidence
Report. Rockville, MD: National Heart, Lung, and Blood Institute; 1998.
33. Hillier TA, Pedula KL. Characteristics of an adult population with newly diagnosed
type 2 diabetes: the relation of obesity and age of onset. Diabetes Care.
2001;24(9):1522-7.
34. Andreyeva T, Sturm R, Ringel JS. Moderate and severe obesity have large
differences in health care costs. Obes Res. 2004;12(12):1936-43.
35. Prince MJ, Reischies F, Beekman AT, et al. Development of the EURO-D scale--a
European, Union initiative to compare symptoms of depression in 14 European
centres. Br J Psychiatry. 1999;174:330-8.
36. Prince MJ, Beekman AT, Deeg DJ, et al. Depression symptoms in late life assessed
using the EURO-D scale. Effect of age, gender and marital status in 14 European
centres. Br J Psychiatry. 1999;174:339-45.
37. Avendano M, Aro AR, Mackenbach J. Socio-economic disparities in physical health
in 10 European countries. In: Borsch-Supan A et al. Health, ageing and retirement
18
in Europe: first results from the Survey of Health, Ageing and Retirement in
Europe. Manheim: MEA, 2005, pp 89-94.
38. Rowland ML. Self-reported weight and height. Am J Clin Nutr. 1990;52:1125-33.
39. Palta M, Prineas RJ, Berman R, Hannan P. Comparison of self-reported and measured
height and weight. Am J Epidemiol. 1982;115(2):223-30.
40. Kuczmarski MF, Kuczmarski RJ, Najjar M. Effects of age on validity of self-reported
height, weight, and body mass index: findings from the Third National Health and
Nutrition Examination Survey, 1988-1994. J Am Diet Assoc. 2001;101(1):28-34.
41. The Surgeon General’s call to action to prevent and decrease overweight and obesity.
US Department of Health and Human Services; Public Health Service; Office of
the Surgeon General. Rockville, MD; 2001.
19
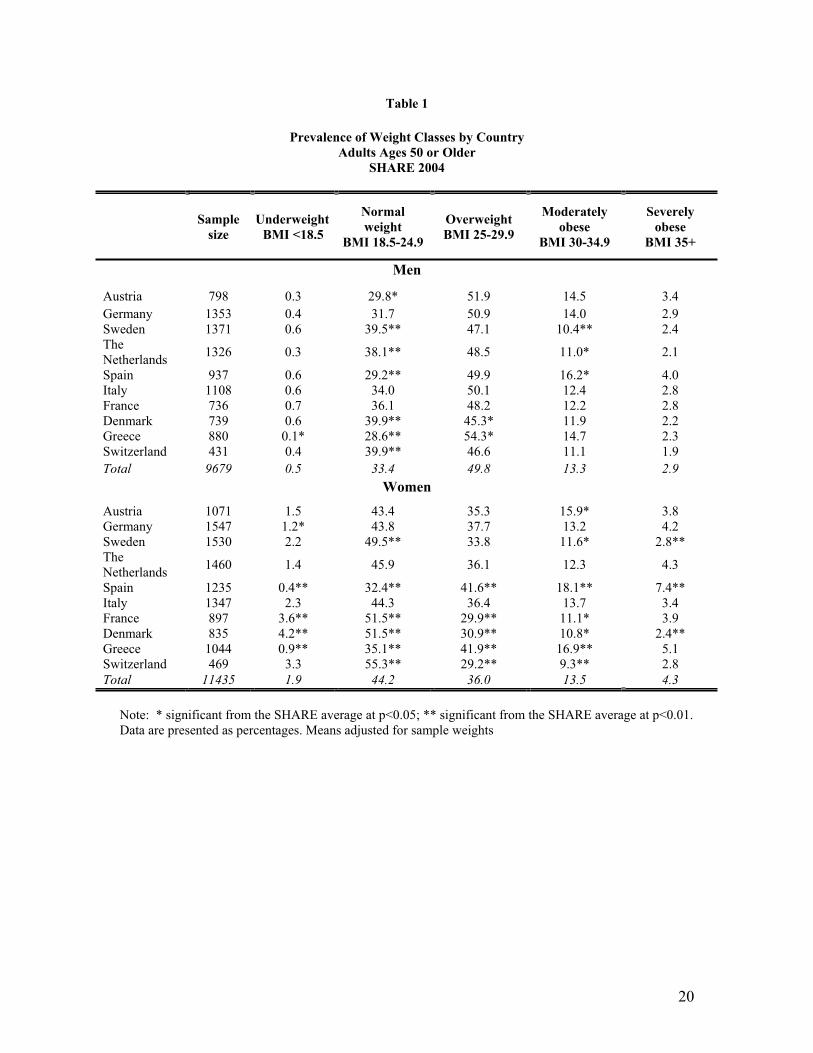
Table 1
Prevalence of Weight Classes by Country
Adults Ages 50 or Older
SHARE 2004
Sample
size
Underweight
BMI <18.5
Normal
weight
BMI 18.5-24.9
Overweight
BMI 25-29.9
Moderately
obese
BMI 30-34.9
Severely
obese
BMI 35+
Men
Austria 798 0.3 29.8* 51.9 14.5 3.4
Germany 1353 0.4 31.7 50.9 14.0 2.9
Sweden 1371 0.6 39.5** 47.1 10.4** 2.4
The
Netherlands1326 0.3 38.1** 48.5 11.0* 2.1
Spain 937 0.6 29.2** 49.9 16.2* 4.0
Italy 1108 0.6 34.0 50.1 12.4 2.8
France 736 0.7 36.1 48.2 12.2 2.8
Denmark 739 0.6 39.9** 45.3* 11.9 2.2
Greece 880 0.1* 28.6** 54.3* 14.7 2.3
Switzerland 431 0.4 39.9** 46.6 11.1 1.9
Total 9679 0.5 33.4 49.8 13.3 2.9
Women
Austria 1071 1.5 43.4 35.3 15.9* 3.8
Germany 1547 1.2* 43.8 37.7 13.2 4.2
Sweden 1530 2.2 49.5** 33.8 11.6* 2.8**
The
Netherlands1460 1.4 45.9 36.1 12.3 4.3
Spain 1235 0.4** 32.4** 41.6** 18.1** 7.4**
Italy 1347 2.3 44.3 36.4 13.7 3.4
France 897 3.6** 51.5** 29.9** 11.1* 3.9
Denmark 835 4.2** 51.5** 30.9** 10.8* 2.4**
Greece 1044 0.9** 35.1** 41.9** 16.9** 5.1
Switzerland 469 3.3 55.3** 29.2** 9.3** 2.8
Total 11435 1.9 44.2 36.0 13.5 4.3
Note: * significant from the SHARE average at p<0.05; ** significant from the SHARE average at p<0.01.
Data are presented as percentages. Means adjusted for sample weights
20
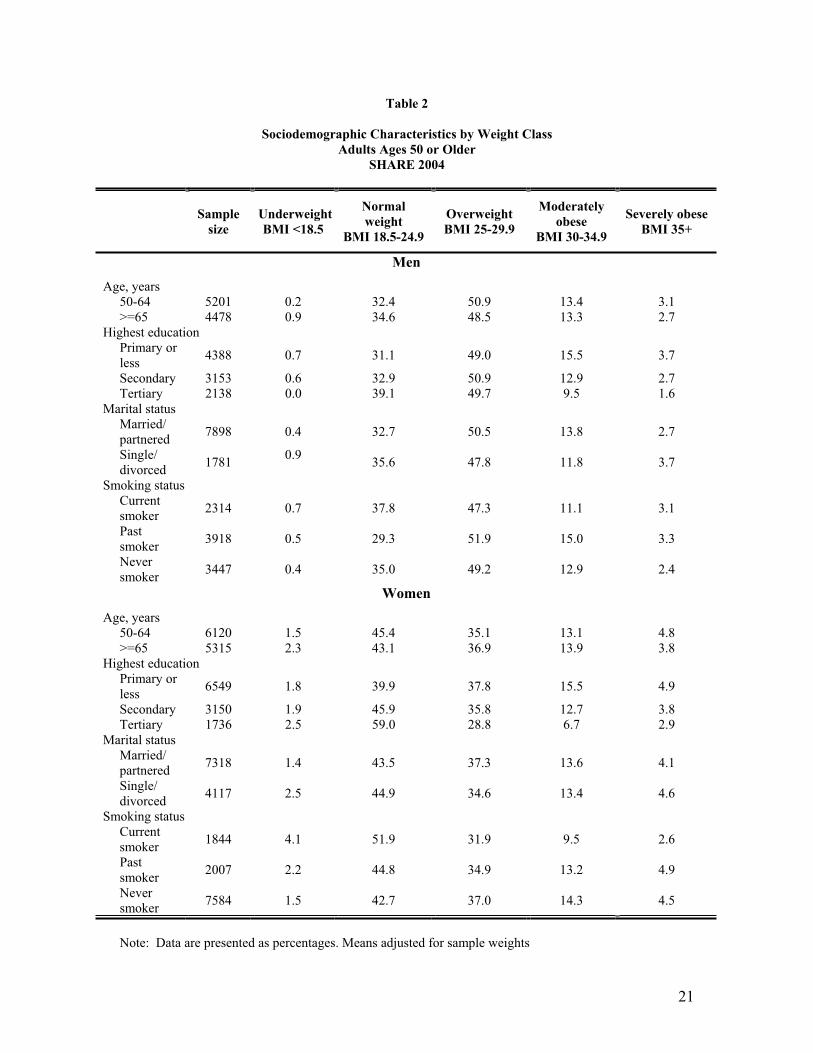
Table 2
Sociodemographic Characteristics by Weight Class
Adults Ages 50 or Older
SHARE 2004
Sample
size
Underweight
BMI <18.5
Normal
weight
BMI 18.5-24.9
Overweight
BMI 25-29.9
Moderately
obese
BMI 30-34.9
Severely obese
BMI 35+
Men
Age, years
50-64 5201 0.2 32.4 50.9 13.4 3.1
>=65 4478 0.9 34.6 48.5 13.3 2.7
Highest education
Primary or
less4388 0.7 31.1 49.0 15.5 3.7
Secondary 3153 0.6 32.9 50.9 12.9 2.7
Tertiary 2138 0.0 39.1 49.7 9.5 1.6
Marital status
Married/
partnered7898 0.4 32.7 50.5 13.8 2.7
Single/
divorced1781
0.935.6 47.8 11.8 3.7
Smoking status
Current
smoker2314 0.7 37.8 47.3 11.1 3.1
Past
smoker3918 0.5 29.3 51.9 15.0 3.3
Never
smoker3447 0.4 35.0 49.2 12.9 2.4
Women
Age, years
50-64 6120 1.5 45.4 35.1 13.1 4.8
>=65 5315 2.3 43.1 36.9 13.9 3.8
Highest education
Primary or
less6549 1.8 39.9 37.8 15.5 4.9
Secondary 3150 1.9 45.9 35.8 12.7 3.8
Tertiary 1736 2.5 59.0 28.8 6.7 2.9
Marital status
Married/
partnered7318 1.4 43.5 37.3 13.6 4.1
Single/
divorced4117 2.5 44.9 34.6 13.4 4.6
Smoking status
Current
smoker1844 4.1 51.9 31.9 9.5 2.6
Past
smoker2007 2.2 44.8 34.9 13.2 4.9
Never
smoker7584 1.5 42.7 37.0 14.3 4.5
Note: Data are presented as percentages. Means adjusted for sample weights
21
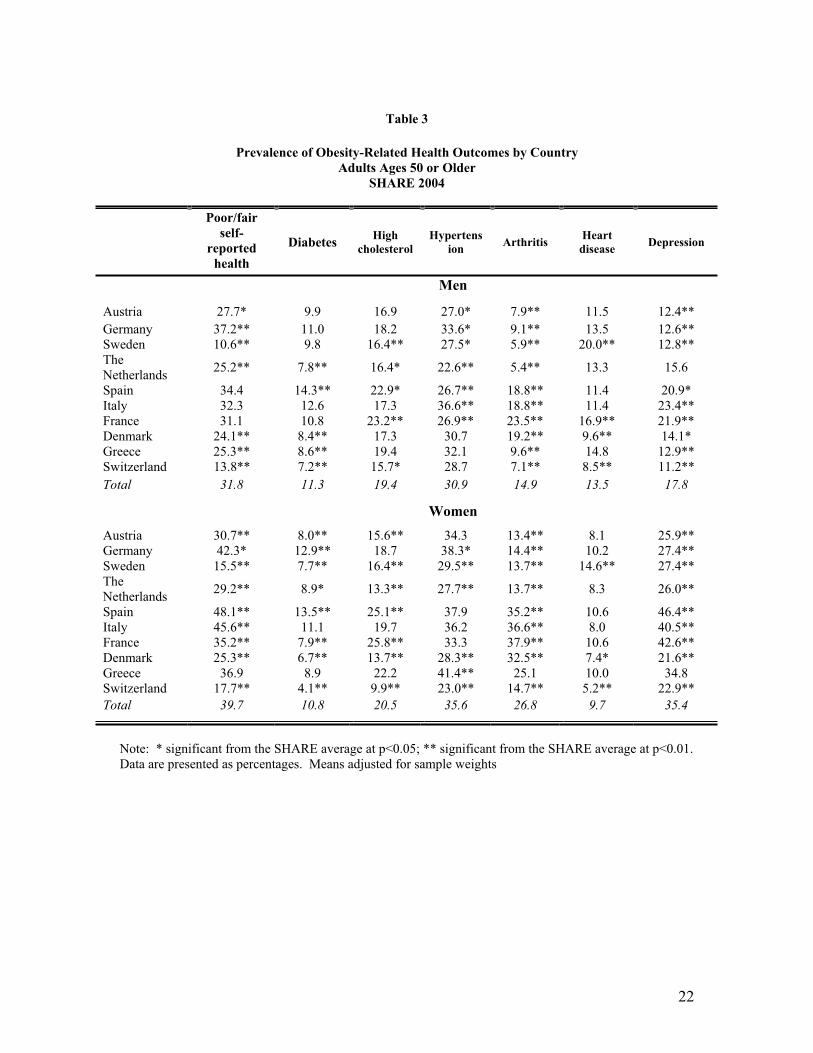
Table 3
Prevalence of Obesity-Related Health Outcomes by Country
Adults Ages 50 or Older
SHARE 2004
Poor/fair
self-
reported
health
DiabetesHigh
cholesterol
Hypertens
ionArthritis
Heart
diseaseDepression
Men
Austria 27.7* 9.9 16.9 27.0* 7.9** 11.5 12.4**
Germany 37.2** 11.0 18.2 33.6* 9.1** 13.5 12.6**
Sweden 10.6** 9.8 16.4** 27.5* 5.9** 20.0** 12.8**
The
Netherlands25.2** 7.8** 16.4* 22.6** 5.4** 13.3 15.6
Spain 34.4 14.3** 22.9* 26.7** 18.8** 11.4 20.9*
Italy 32.3 12.6 17.3 36.6** 18.8** 11.4 23.4**
France 31.1 10.8 23.2** 26.9** 23.5** 16.9** 21.9**
Denmark 24.1** 8.4** 17.3 30.7 19.2** 9.6** 14.1*
Greece 25.3** 8.6** 19.4 32.1 9.6** 14.8 12.9**
Switzerland 13.8** 7.2** 15.7* 28.7 7.1** 8.5** 11.2**
Total 31.8 11.3 19.4 30.9 14.9 13.5 17.8
Women
Austria 30.7** 8.0** 15.6** 34.3 13.4** 8.1 25.9**
Germany 42.3* 12.9** 18.7 38.3* 14.4** 10.2 27.4**
Sweden 15.5** 7.7** 16.4** 29.5** 13.7** 14.6** 27.4**
The
Netherlands29.2** 8.9* 13.3** 27.7** 13.7** 8.3 26.0**
Spain 48.1** 13.5** 25.1** 37.9 35.2** 10.6 46.4**
Italy 45.6** 11.1 19.7 36.2 36.6** 8.0 40.5**
France 35.2** 7.9** 25.8** 33.3 37.9** 10.6 42.6**
Denmark 25.3** 6.7** 13.7** 28.3** 32.5** 7.4* 21.6**
Greece 36.9 8.9 22.2 41.4** 25.1 10.0 34.8
Switzerland 17.7** 4.1** 9.9** 23.0** 14.7** 5.2** 22.9**
Total 39.7 10.8 20.5 35.6 26.8 9.7 35.4
Note: * significant from the SHARE average at p<0.05; ** significant from the SHARE average at p<0.01.
Data are presented as percentages. Means adjusted for sample weights
22
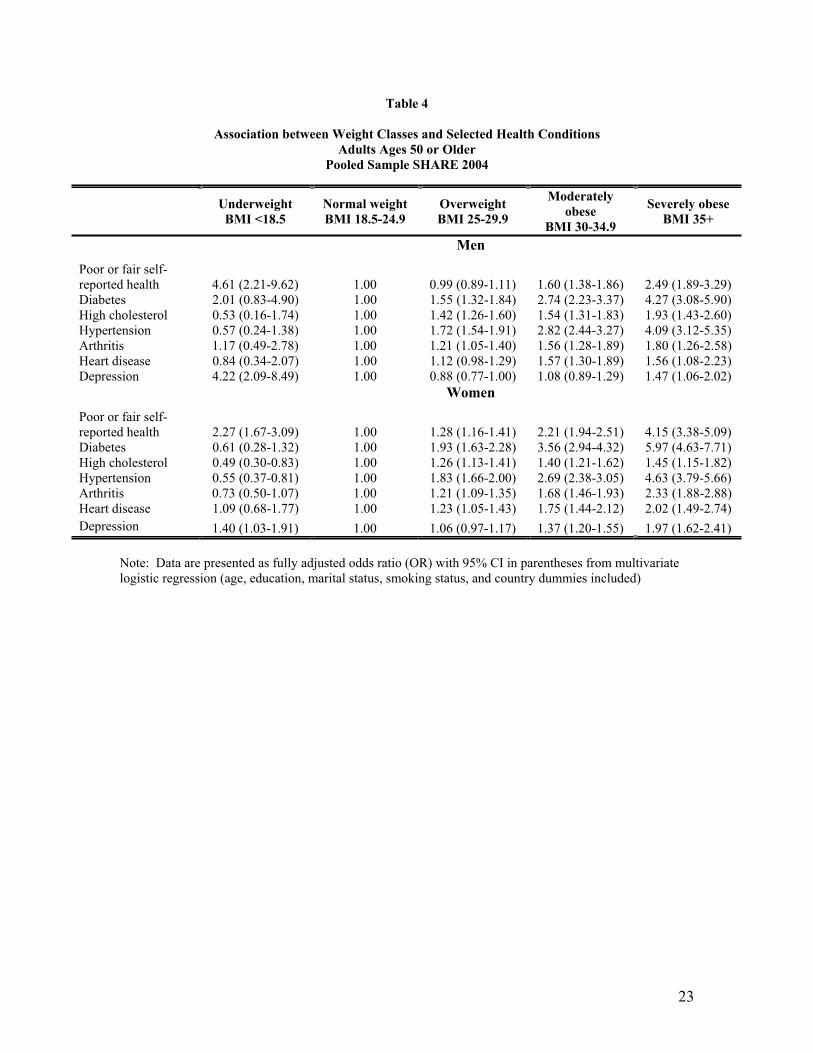
Table 4
Association between Weight Classes and Selected Health Conditions
Adults Ages 50 or Older
Pooled Sample SHARE 2004
Underweight
BMI <18.5
Normal weight
BMI 18.5-24.9
Overweight
BMI 25-29.9
Moderately
obese
BMI 30-34.9
Severely obese
BMI 35+
Men
Poor or fair self-
reported health 4.61 (2.21-9.62) 1.00 0.99 (0.89-1.11) 1.60 (1.38-1.86) 2.49 (1.89-3.29)
Diabetes 2.01 (0.83-4.90) 1.00 1.55 (1.32-1.84) 2.74 (2.23-3.37) 4.27 (3.08-5.90)
High cholesterol 0.53 (0.16-1.74) 1.00 1.42 (1.26-1.60) 1.54 (1.31-1.83) 1.93 (1.43-2.60)
Hypertension 0.57 (0.24-1.38) 1.00 1.72 (1.54-1.91) 2.82 (2.44-3.27) 4.09 (3.12-5.35)
Arthritis 1.17 (0.49-2.78) 1.00 1.21 (1.05-1.40) 1.56 (1.28-1.89) 1.80 (1.26-2.58)
Heart disease 0.84 (0.34-2.07) 1.00 1.12 (0.98-1.29) 1.57 (1.30-1.89) 1.56 (1.08-2.23)
Depression 4.22 (2.09-8.49) 1.00 0.88 (0.77-1.00) 1.08 (0.89-1.29) 1.47 (1.06-2.02)
Women
Poor or fair self-
reported health 2.27 (1.67-3.09) 1.00 1.28 (1.16-1.41) 2.21 (1.94-2.51) 4.15 (3.38-5.09)
Diabetes 0.61 (0.28-1.32) 1.00 1.93 (1.63-2.28) 3.56 (2.94-4.32) 5.97 (4.63-7.71)
High cholesterol 0.49 (0.30-0.83) 1.00 1.26 (1.13-1.41) 1.40 (1.21-1.62) 1.45 (1.15-1.82)
Hypertension 0.55 (0.37-0.81) 1.00 1.83 (1.66-2.00) 2.69 (2.38-3.05) 4.63 (3.79-5.66)
Arthritis 0.73 (0.50-1.07) 1.00 1.21 (1.09-1.35) 1.68 (1.46-1.93) 2.33 (1.88-2.88)
Heart disease 1.09 (0.68-1.77) 1.00 1.23 (1.05-1.43) 1.75 (1.44-2.12) 2.02 (1.49-2.74)
Depression 1.40 (1.03-1.91) 1.00 1.06 (0.97-1.17) 1.37 (1.20-1.55) 1.97 (1.62-2.41)
Note: Data are presented as fully adjusted odds ratio (OR) with 95% CI in parentheses from multivariate
logistic regression (age, education, marital status, smoking status, and country dummies included)
23
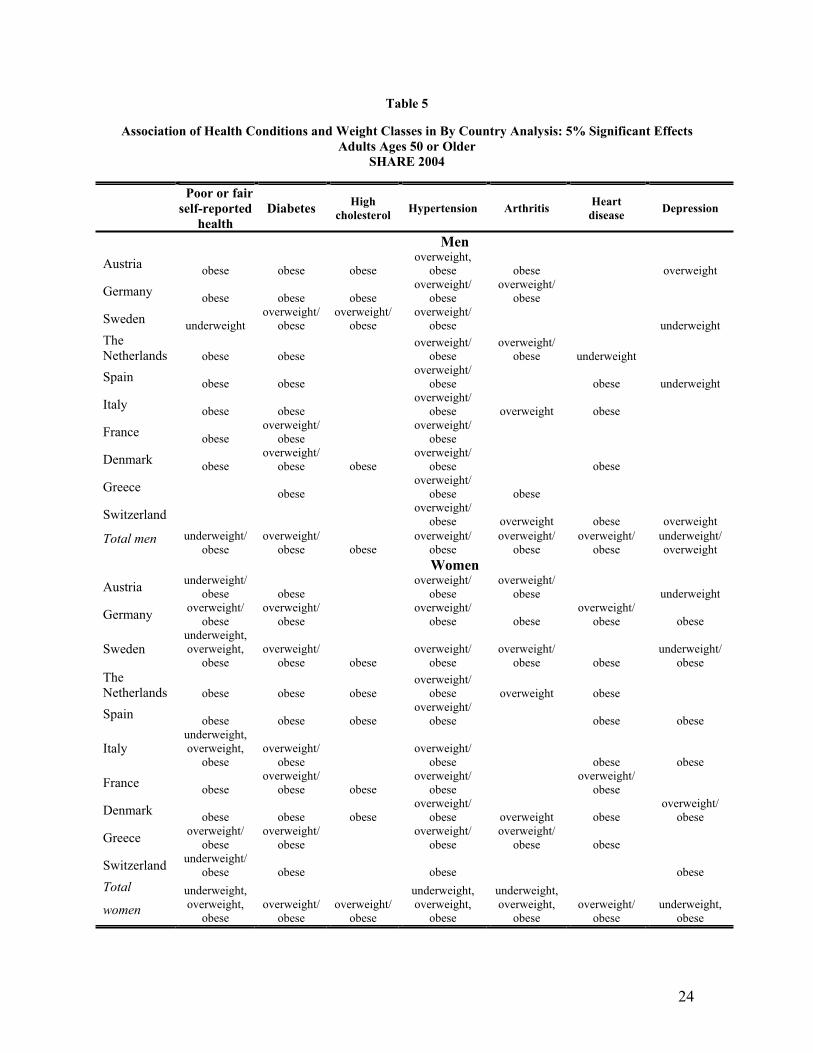
Table 5
Association of Health Conditions and Weight Classes in By Country Analysis: 5% Significant Effects
Adults Ages 50 or Older
SHARE 2004
Poor or fair
self-reported
health
DiabetesHigh
cholesterolHypertension Arthritis
Heart
diseaseDepression
Men
Austriaobese obese obese
overweight,
obese obese overweight
Germanyobese obese obese
overweight/
obese
overweight/
obese
Swedenunderweight
overweight/
obese
overweight/
obese
overweight/
obese underweight
The
Netherlands obese obese
overweight/
obese
overweight/
obese underweight
Spainobese obese
overweight/
obese obese underweight
Italyobese obese
overweight/
obese overweight obese
Franceobese
overweight/
obese
overweight/
obese
Denmarkobese
overweight/
obese obese
overweight/
obese obese
Greeceobese
overweight/
obese obese
Switzerlandoverweight/
obese overweight obese overweight
Total men underweight/
obese
overweight/
obese obese
overweight/
obese
overweight/
obese
overweight/
obese
underweight/
overweight
Women
Austriaunderweight/
obese obese
overweight/
obese
overweight/
obese underweight
Germanyoverweight/
obese
overweight/
obese
overweight/
obese obese
overweight/
obese obese
Swedenunderweight,
overweight,
obese
overweight/
obese obese
overweight/
obese
overweight/
obese obese
underweight/
obese
The
Netherlands obese obese obese
overweight/
obese overweight obese
Spainobese obese obese
overweight/
obese obese obese
Italyunderweight,
overweight,
obese
overweight/
obese
overweight/
obese obese obese
Franceobese
overweight/
obese obese
overweight/
obese
overweight/
obese
Denmarkobese obese obese
overweight/
obese overweight obese
overweight/
obese
Greeceoverweight/
obese
overweight/
obese
overweight/
obese
overweight/
obese obese
Switzerlandunderweight/
obese obese obese obese
Total
women
underweight,
overweight,
obese
overweight/
obese
overweight/
obese
underweight,
overweight,
obese
underweight,
overweight,
obese
overweight/
obese
underweight,
obese
24