the anatomy of factor markets
DESCRIPTION
The Anatomy of Factor Markets. Four factors of production are Labor Capital Land (natural resources) Entrepreneurship Let’s take a look at the markets in which these factors are traded. The Anatomy of Factor Markets. Market for Labor Services - PowerPoint PPT PresentationTRANSCRIPT

© 2010 Pearson Addison-Wesley
© 2010 Pearson Addison-Wesley
© 2010 Pearson Addison-Wesley
The Anatomy of Factor Markets
Four factors of production are
Labor
Capital
Land (natural resources)
Entrepreneurship
Let’s take a look at the markets in which these factors are traded.
© 2010 Pearson Addison-Wesley
Market for Labor Services
Labor services are the physical and mental work effort that people supply to produce goods and services.
A labor market is a collection of people and firms who trade labor services.
The price of labor services is the wage rate.
Most labor markets have many buyers and many sellers and are competitive. In these labor markets, the wage rate is determined by supply and demand.
The Anatomy of Factor Markets
© 2010 Pearson Addison-Wesley
Market for Capital Services
Capital consists of the tools, instruments, machines, buildings, and other constructions that have been produced in the past and that businesses now use to produce goods and services.
These physical objects are capital goods and capital goods are traded in goods markets. This market is not a market for capital services.
A market for capital services is a rental market—a market in which the services of capital are hired.
The Anatomy of Factor Markets
© 2010 Pearson Addison-Wesley
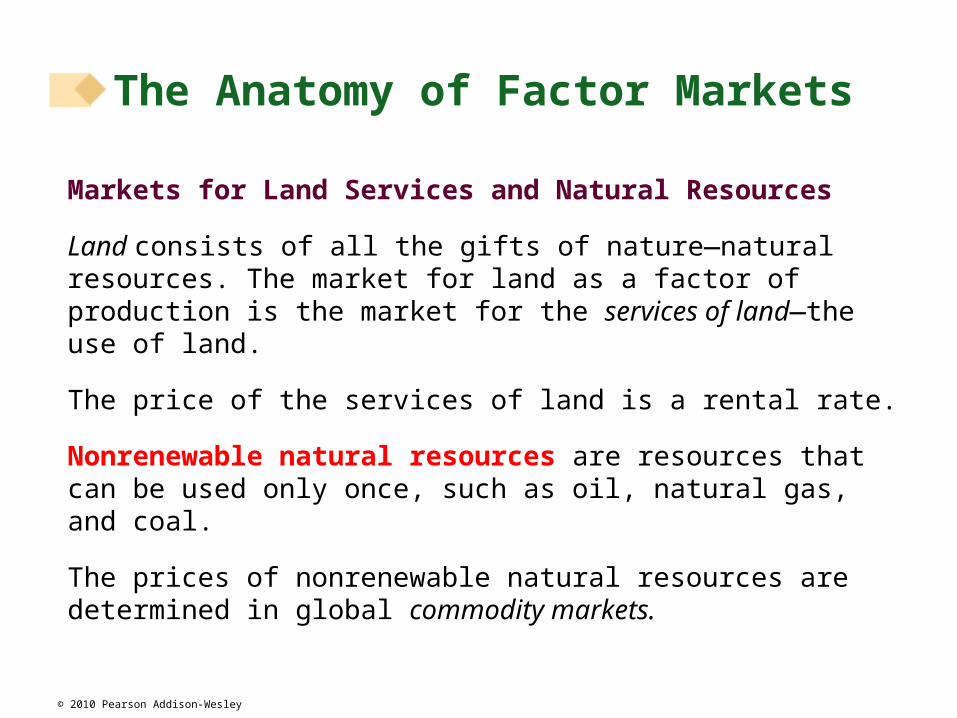
Markets for Land Services and Natural Resources
Land consists of all the gifts of nature—natural resources. The market for land as a factor of production is the market for the services of land—the use of land.
The price of the services of land is a rental rate.
Nonrenewable natural resources are resources that can be used only once, such as oil, natural gas, and coal.
The prices of nonrenewable natural resources are determined in global commodity markets.
The Anatomy of Factor Markets
© 2010 Pearson Addison-Wesley
Entrepreneurship
Entrepreneurship services are not traded in markets.
Entrepreneurs receive the profit or bear the loss that results from their business decisions.
The Anatomy of Factor Markets

© 2010 Pearson Addison-Wesley
The demand for a factor of production is a derived demand—it is derived from the demand for the goods that it is used to produce.
The quantities of factors of production demanded are a consequence of firms’ output decisions.
A firm hires the quantities of factors of production that maximize its profit.
The value to the firm of hiring one more unit of a factor of production is called the value of marginal product.
The Demand for a Factor of Production
© 2010 Pearson Addison-Wesley
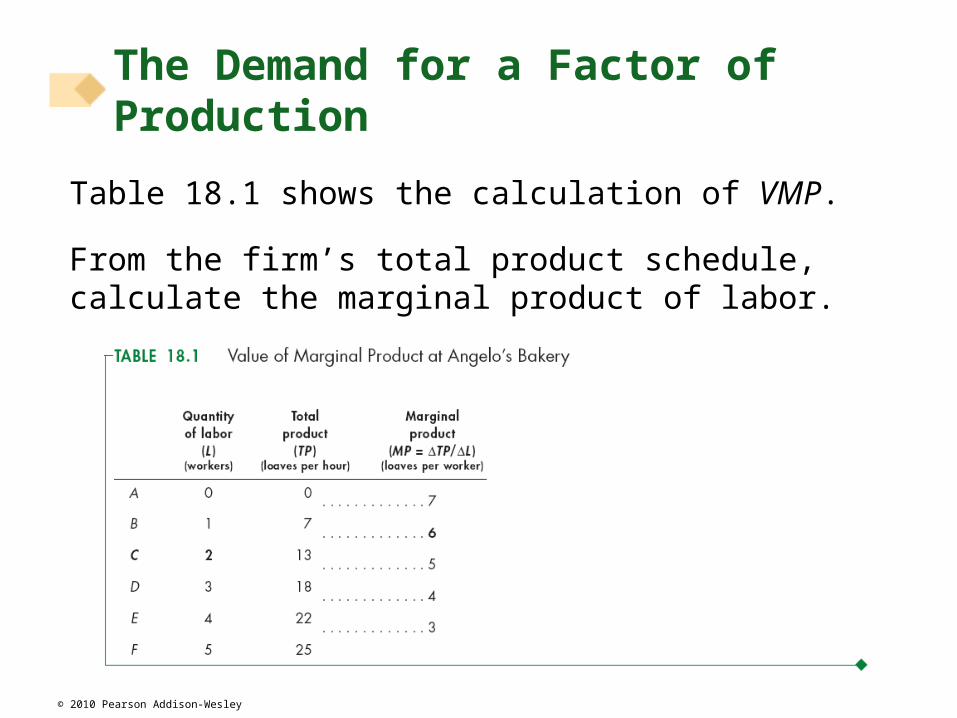
Table 18.1 shows the calculation of VMP.
From the firm’s total product schedule, calculate the marginal product of labor.
The Demand for a Factor of Production
© 2010 Pearson Addison-Wesley
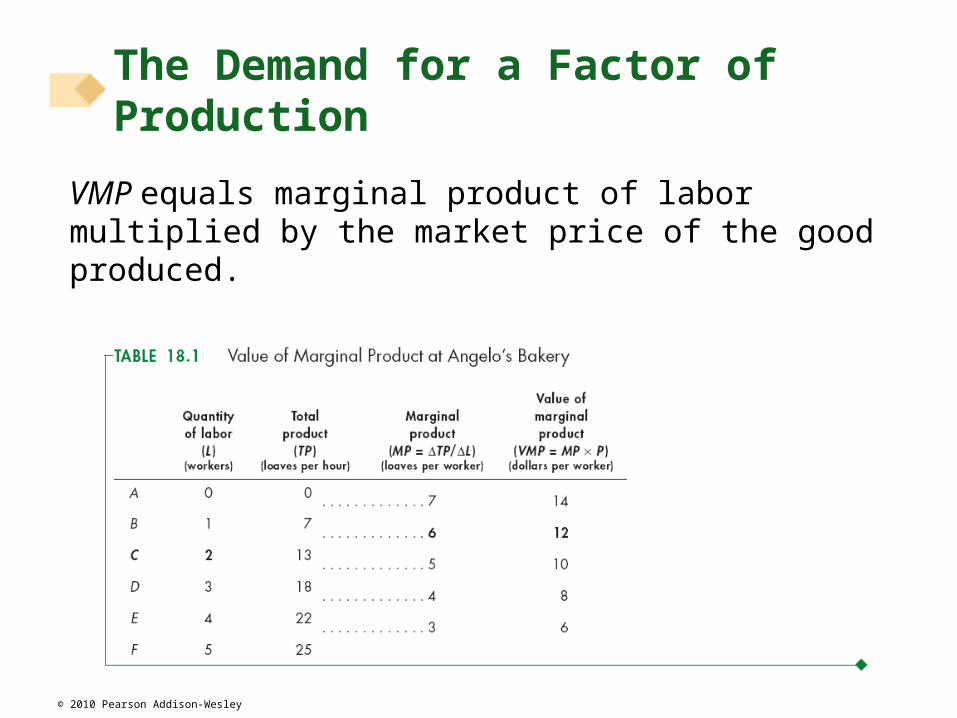
VMP equals marginal product of labor multiplied by the market price of the good produced.
The Demand for a Factor of Production
© 2010 Pearson Addison-Wesley
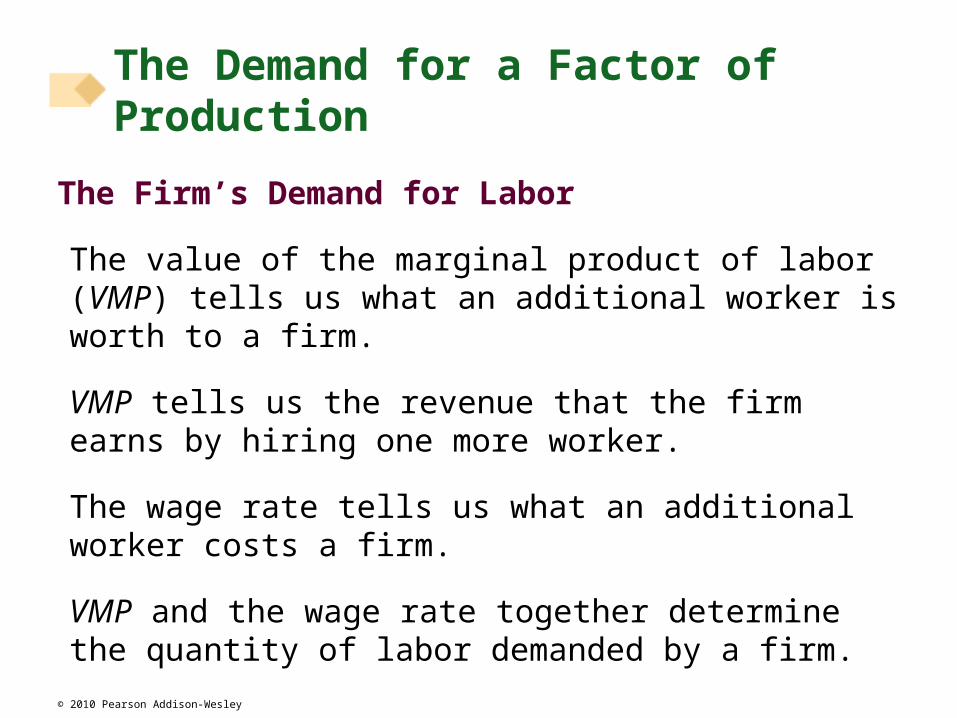
The Firm’s Demand for Labor
The value of the marginal product of labor (VMP) tells us what an additional worker is worth to a firm.
VMP tells us the revenue that the firm earns by hiring one more worker.
The wage rate tells us what an additional worker costs a firm.
VMP and the wage rate together determine the quantity of labor demanded by a firm.
The Demand for a Factor of Production
© 2010 Pearson Addison-Wesley
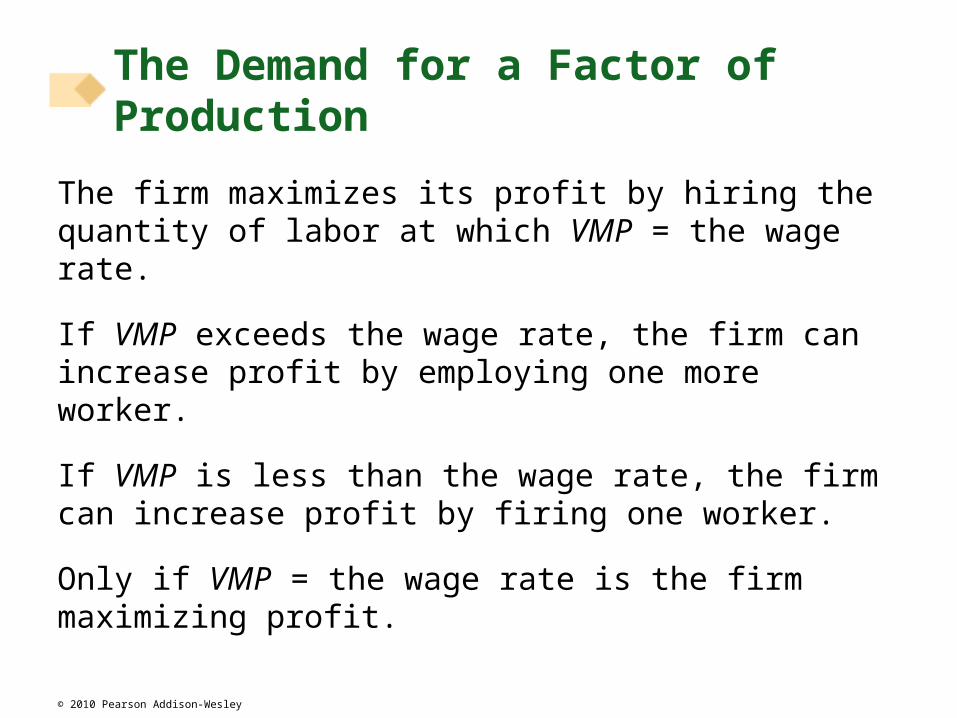
The firm maximizes its profit by hiring the quantity of labor at which VMP = the wage rate.
If VMP exceeds the wage rate, the firm can increase profit by employing one more worker.
If VMP is less than the wage rate, the firm can increase profit by firing one worker.
Only if VMP = the wage rate is the firm maximizing profit.
The Demand for a Factor of Production

© 2010 Pearson Addison-Wesley
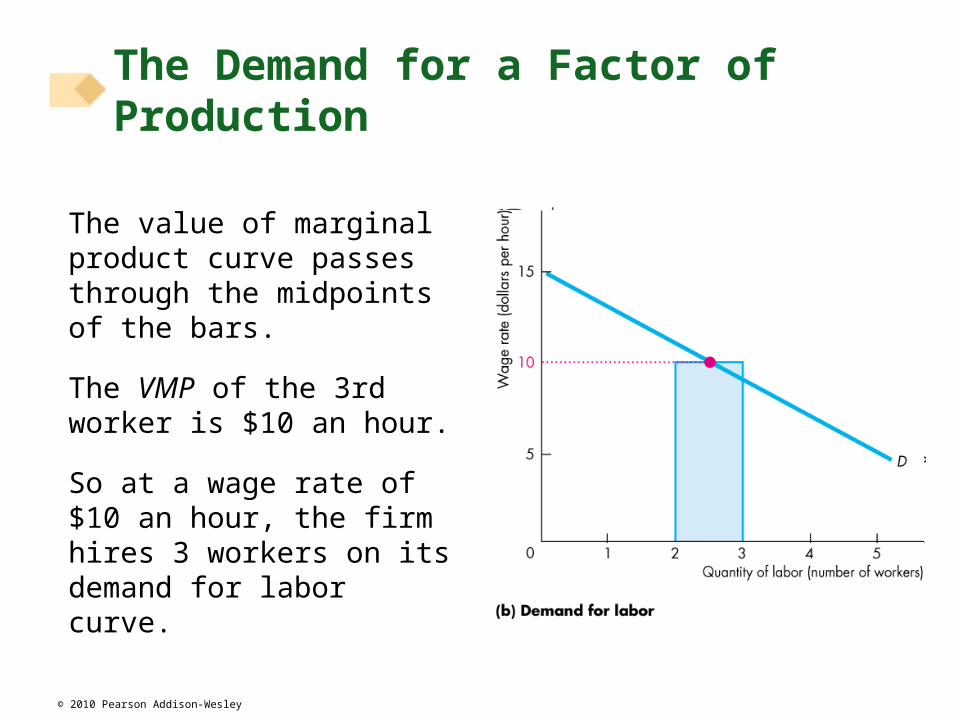
Figure 18.1 shows the relationship between a firm’s value of marginal product and its demand for labor.
The bars show the value of marginal product, which diminishes as the quantity of labor employed increases.
The Demand for a Factor of Production
© 2010 Pearson Addison-Wesley
The value of marginal product curve passes through the midpoints of the bars.
The VMP of the 3rd worker is $10 an hour.
So at a wage rate of $10 an hour, the firm hires 3 workers on its demand for labor curve.
The Demand for a Factor of Production
© 2010 Pearson Addison-Wesley
Changes in the Demand for Labor
The firm’s demand for labor depends on
1. The price of the firm’s output
2. The prices of other factors of production
3. Technology
The Demand for a Factor of Production
© 2010 Pearson Addison-Wesley
The Price of the Firm’s Output
The higher the price of a firm’s output, the greater is the firm’s demand for labor.
The price of output affects the demand for labor through its influence on the value of marginal product of labor.
If the price of the firm’s output increases, the demand for labor increases and the demand for labor curve shifts rightward.
The Demand for a Factor of Production
© 2010 Pearson Addison-Wesley
The Price of Other Factors of Production
If the price of using capital decreases relative to the wage rate, a firm substitutes capital for labor and increases the quantity of capital it uses.
Usually, the demand for labor will decrease when the price of using capital falls.
The Demand for a Factor of Production
© 2010 Pearson Addison-Wesley
Technology
New technologies decrease the demand for some types of labor and increase the demand for other types.
For example, if a new automated bread-making machine becomes available, a bakery might install one of these machines and fire most of its workforce—a decrease in the demand for bakery workers.
But the firms that manufacture and service automated bread-making machines hire more labor, so there is an increase in the demand for this type of labor.
The Demand for a Factor of Production
© 2010 Pearson Addison-Wesley
A Competitive Labor Market
A market in which many firms demand labor and many households supply labor.
Market Demand for Labor
The market demand for labor is obtained by summing the quantities of labor demanded by all firms at each wage rate.
Because each firm’s demand for labor curve slopes downward, so does the market demand curve.
Labor Markets
© 2010 Pearson Addison-Wesley
The Supply of Labor
People allocate their time between leisure and labor and this choice, which determines the quantity of labor supplied, depends on the wage rate.
A person’s reservation wage is the lowest wage rate for which he or she is willing to supply labor.
As the wage rate rises above the reservation wage, the household changes the quantity of labor supplied.
Labor Markets
© 2010 Pearson Addison-Wesley
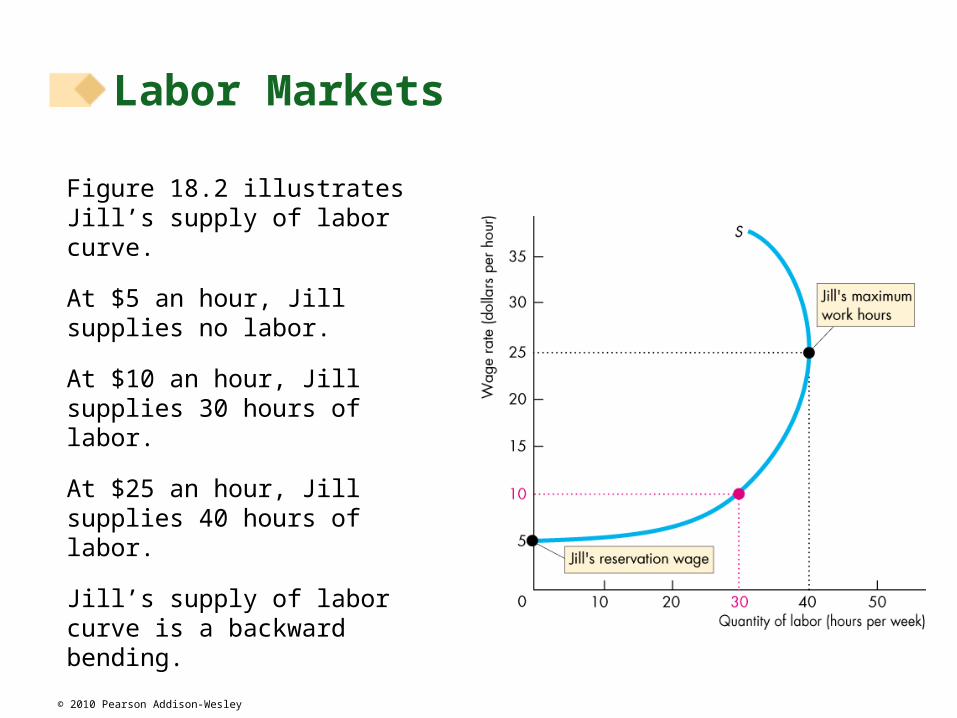
Figure 18.2 illustrates Jill’s supply of labor curve.
At $5 an hour, Jill supplies no labor.
At $10 an hour, Jill supplies 30 hours of labor.
At $25 an hour, Jill supplies 40 hours of labor.
Jill’s supply of labor curve is a backward bending.
Labor Markets
© 2010 Pearson Addison-Wesley
Substitution Effect
At wage rates below $25 an hour, the higher the wage rate the greater is the quantity of labor that Jill supplies.
The wage rate is Jill’s opportunity cost of leisure.
The substitution effect describes how a person responds to an increasing opportunity cost of leisure by reducing the amount of leisure and increasing the quantity of labor supplied.
Labor Markets
© 2010 Pearson Addison-Wesley
Income Effect
The higher the wage rate, the greater is Jill’s income.
An increase in income enables the consumer to buy more of most goods.
Leisure is a normal good, and the income effect describes how a person responds to a higher wage rate by increasing the quantity of leisure and decreasing the quantity of labor supplied.
Labor Markets
© 2010 Pearson Addison-Wesley
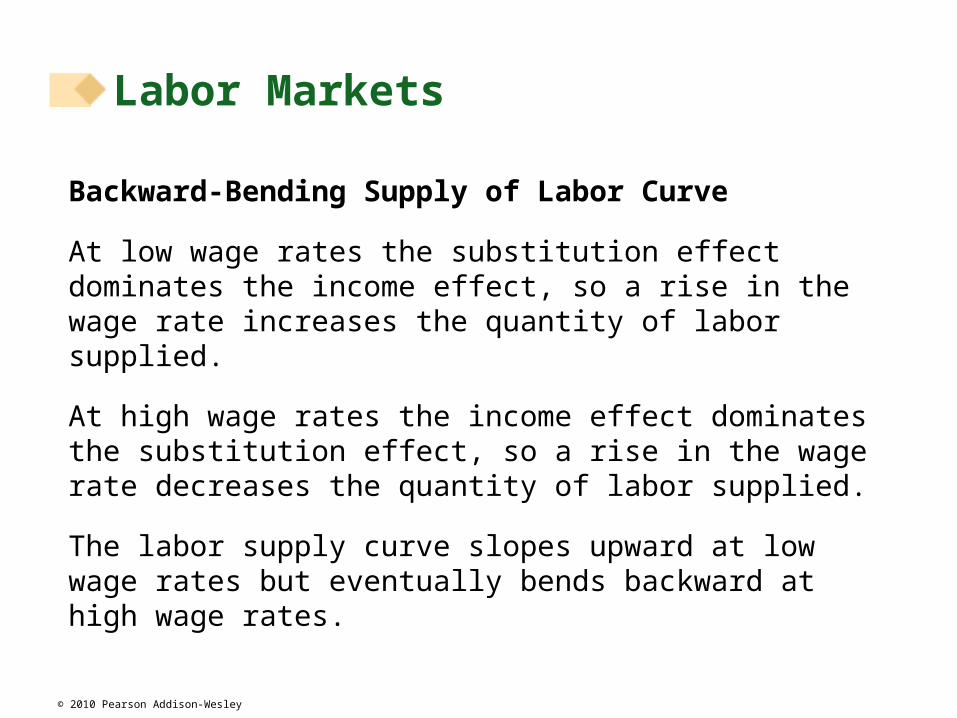
Backward-Bending Supply of Labor Curve
At low wage rates the substitution effect dominates the income effect, so a rise in the wage rate increases the quantity of labor supplied.
At high wage rates the income effect dominates the substitution effect, so a rise in the wage rate decreases the quantity of labor supplied.
The labor supply curve slopes upward at low wage rates but eventually bends backward at high wage rates.
Labor Markets
© 2010 Pearson Addison-Wesley
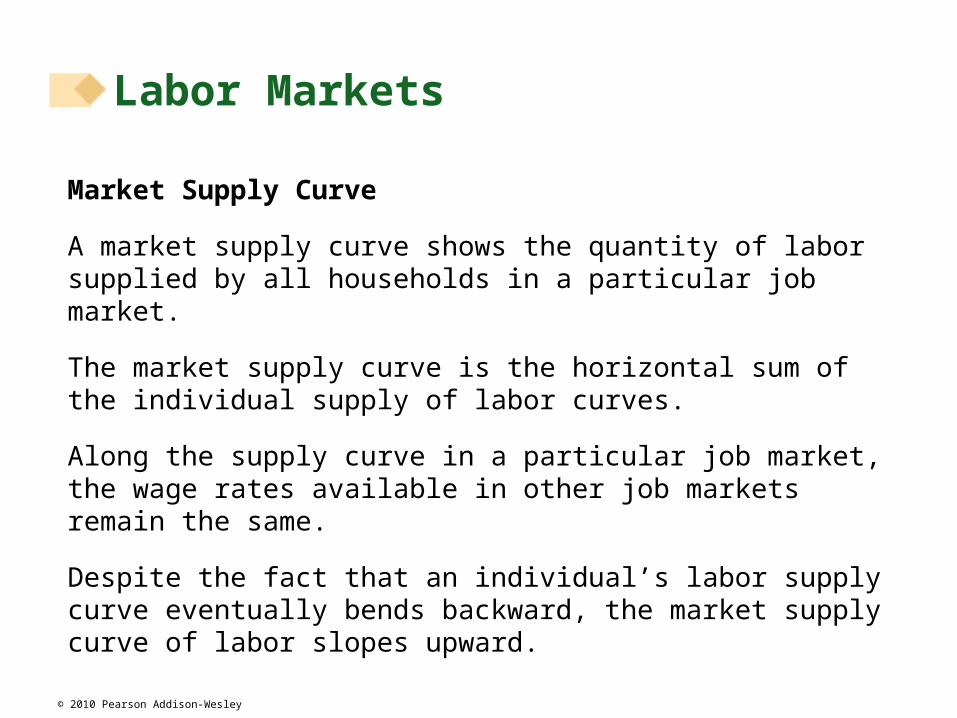
Market Supply Curve
A market supply curve shows the quantity of labor supplied by all households in a particular job market.
The market supply curve is the horizontal sum of the individual supply of labor curves.
Along the supply curve in a particular job market, the wage rates available in other job markets remain the same.
Despite the fact that an individual’s labor supply curve eventually bends backward, the market supply curve of labor slopes upward.
Labor Markets
© 2010 Pearson Addison-Wesley
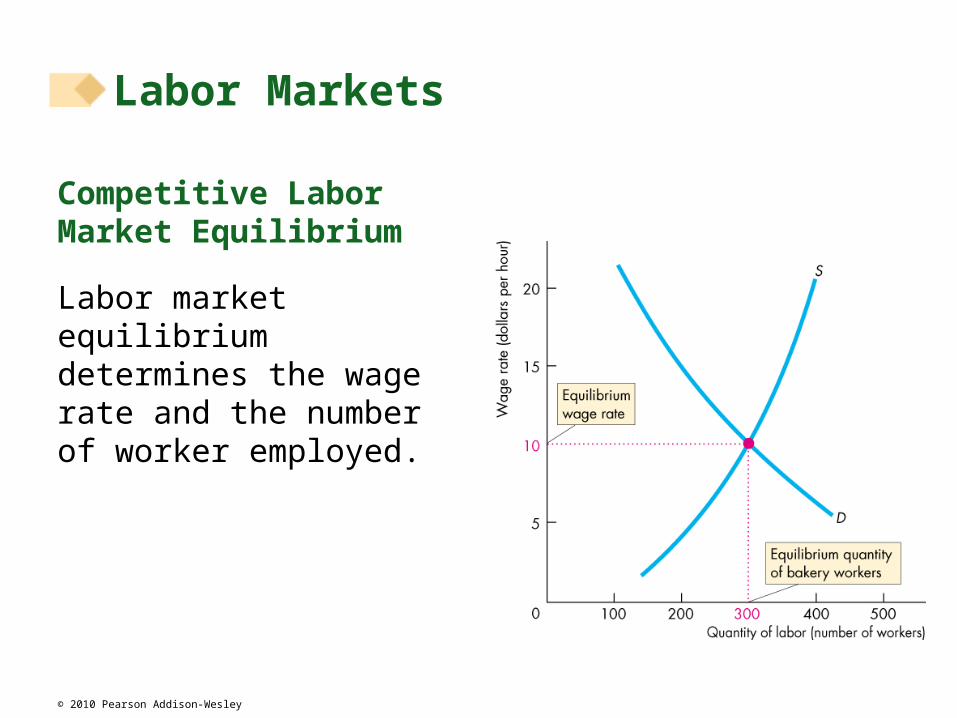
Competitive Labor Market Equilibrium
Labor market equilibrium determines the wage rate and the number of worker employed.
Labor Markets
© 2010 Pearson Addison-Wesley
A Labor Market with a Union
A labor union is an organized group of workers that aims to increase wages and influence other job conditions.
Influences on Labor Supply
One way to raise the wage rate is to decrease the supply of labor.
Influences on Labor Demand
Another way to raise the wage rate is to encourage people to buy goods produced by union workers, which raises the price of those goods and increases VMP of the workers.
Labor Markets
© 2010 Pearson Addison-Wesley
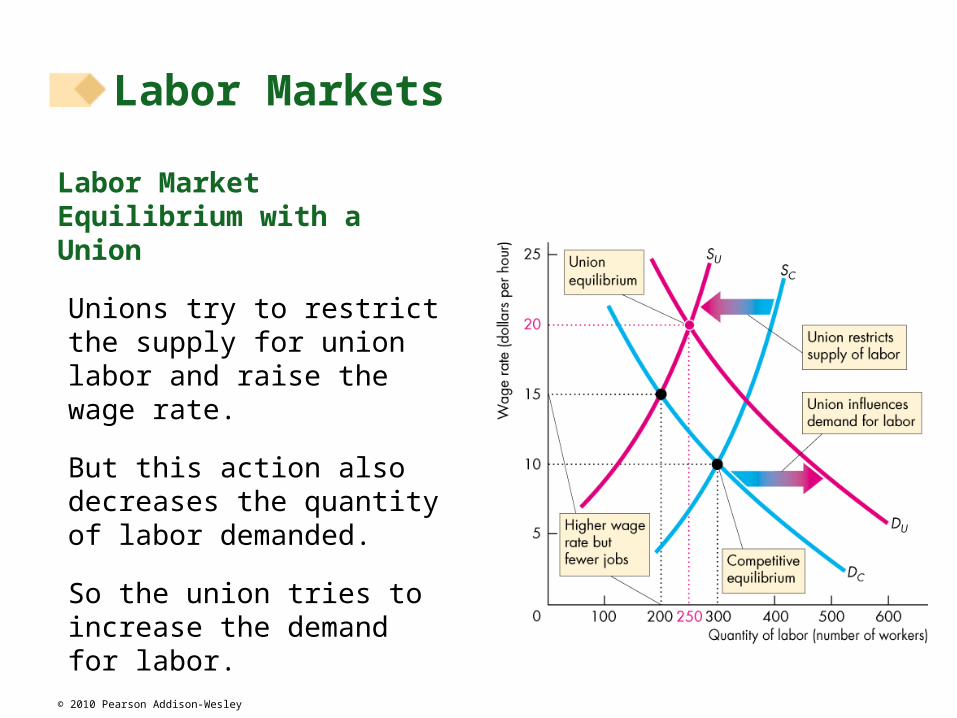
Labor Market Equilibrium with a Union
Unions try to restrict the supply for union labor and raise the wage rate.
But this action also decreases the quantity of labor demanded.
So the union tries to increase the demand for labor.
Labor Markets
© 2010 Pearson Addison-Wesley
Monopsony in the Labor market
A monopsony is a market with just one buyer.
Decades ago, large manufacturing plants, steel mills and coal mines were often the sole buyer of labor in their local labor markets.
Because a monopsony controls the labor market, it has the market power to set the market wage rate.
Today, in some parts of the country, large managed health-care organizations are the major employer of health-care professionals.
Labor Markets

© 2010 Pearson Addison-Wesley
Like all firms, the monopsony has a downward-sloping demand for labor curve.
The supply curve of labor tells us the lowest wage rate of which a given quantity of labor is willing to work.
Labor Markets

© 2010 Pearson Addison-Wesley
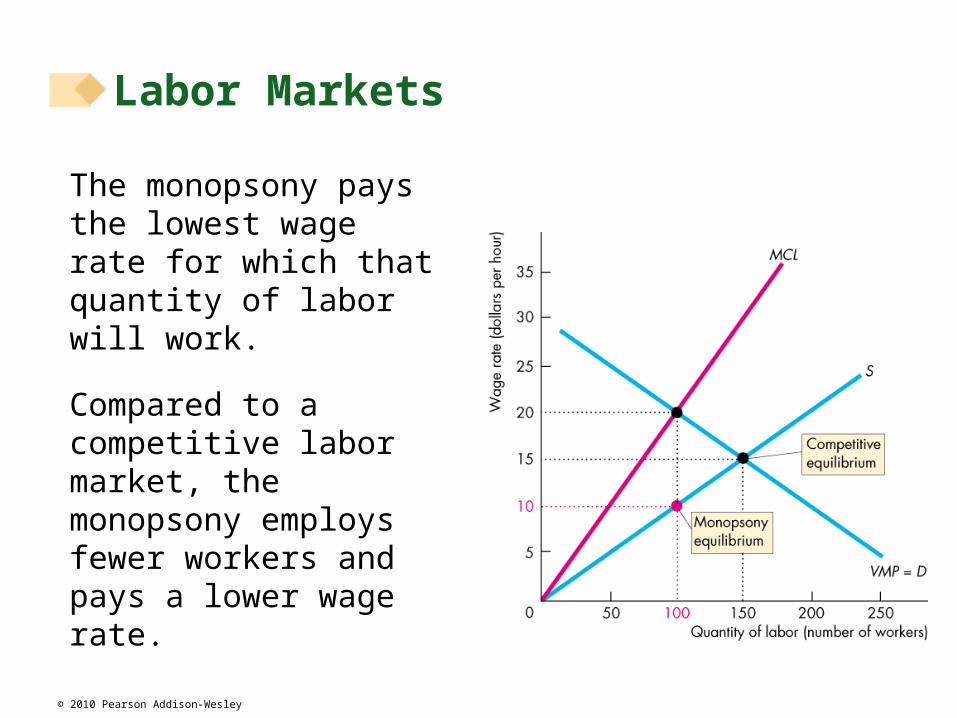
Because the monopsony controls the wage rate, the marginal cost of labor exceeds the wage rate.
The marginal cost of labor curve MCL is upward sloping.
The monopsony maximizes profit by hiring the quantity of labor at which MCL = VMP.
Labor Markets
© 2010 Pearson Addison-Wesley
The monopsony pays the lowest wage rate for which that quantity of labor will work.
Compared to a competitive labor market, the monopsony employs fewer workers and pays a lower wage rate.
Labor Markets
© 2010 Pearson Addison-Wesley
A Union and a Monopsony
Sometimes both the firm and the employees have market power when a monopsony encounters a labor union, a situation called a bilateral monopoly.
Both the employer and the union must judge each others market power and come to an agreement on the wage rate paid and the number of workers employed.
Depending on the relative costs that each party can inflict on the other, the outcome of this bargaining might favor either the union or the firm.
Labor Markets
© 2010 Pearson Addison-Wesley
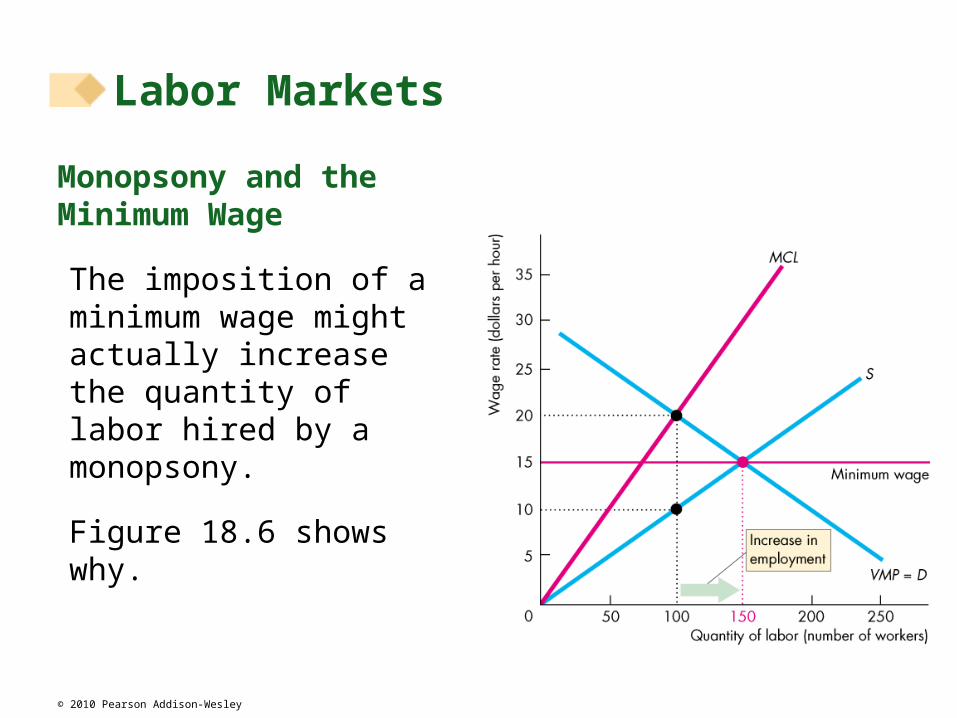
Monopsony and the Minimum Wage
The imposition of a minimum wage might actually increase the quantity of labor hired by a monopsony.
Figure 18.6 shows why.
Labor Markets
© 2010 Pearson Addison-Wesley
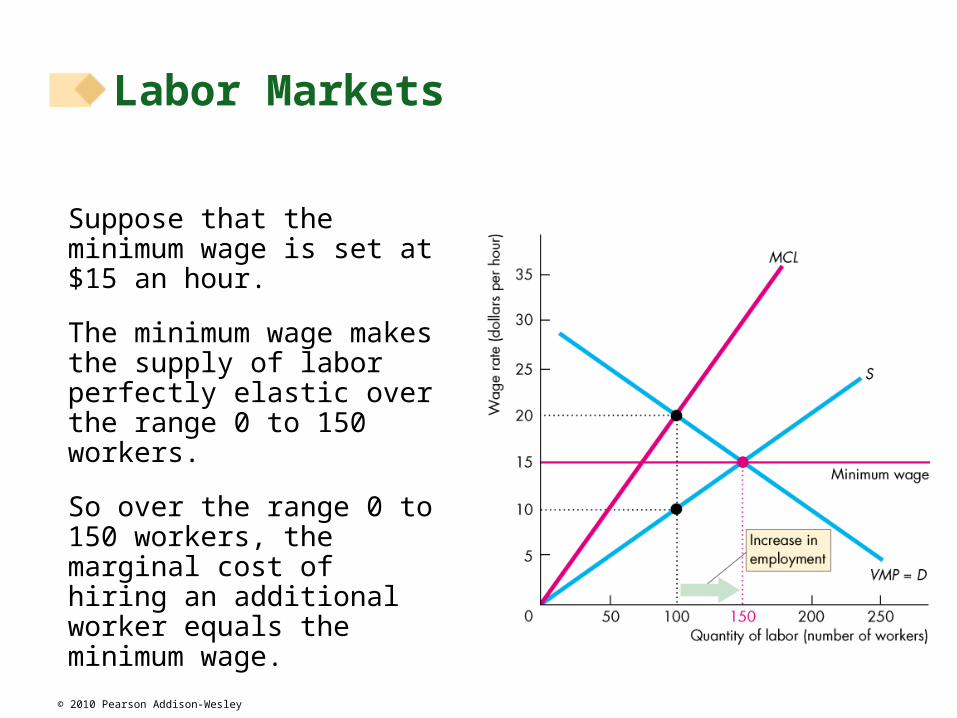
Suppose that the minimum wage is set at $15 an hour.
The minimum wage makes the supply of labor perfectly elastic over the range 0 to 150 workers.
So over the range 0 to 150 workers, the marginal cost of hiring an additional worker equals the minimum wage.
Labor Markets
© 2010 Pearson Addison-Wesley
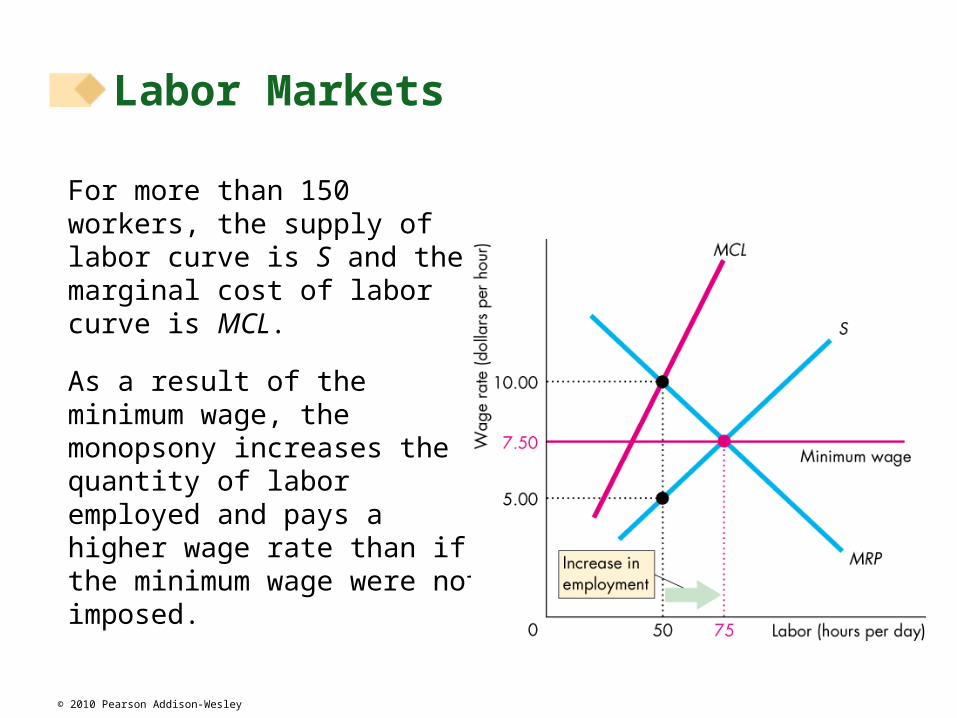
For more than 150 workers, the supply of labor curve is S and the marginal cost of labor curve is MCL.
As a result of the minimum wage, the monopsony increases the quantity of labor employed and pays a higher wage rate than if the minimum wage were not imposed.
Labor Markets

© 2010 Pearson Addison-Wesley
Scale of Union–Nonunion Wage Gap
How much of a difference to wage rates do unions actually make?
To measure the difference in wages attributable to unions, economists have looked at the wages of unionized and nonunionized workers who do similar work and have similar skills.
The evidence based on these comparisons is that the union–nonunion wage gap lies between 10 and 25 percent of the wage.
Labor Markets
© 2010 Pearson Addison-Wesley
Trends and Differences in Wage Rates
Wage rates increase over time—trend upward—because the value of marginal product of labor trends upward.
Technological change and the new types of capital that it brings make workers more productive.
With greater labor productivity, the demand for labor increases and so does the average wage rate.
Wage rates have become increasingly unequal.
High wage rates have increased rapidly while low wage rates have stagnated or even fallen.
Labor Markets
© 2010 Pearson Addison-Wesley
Capital and Natural Resource Markets
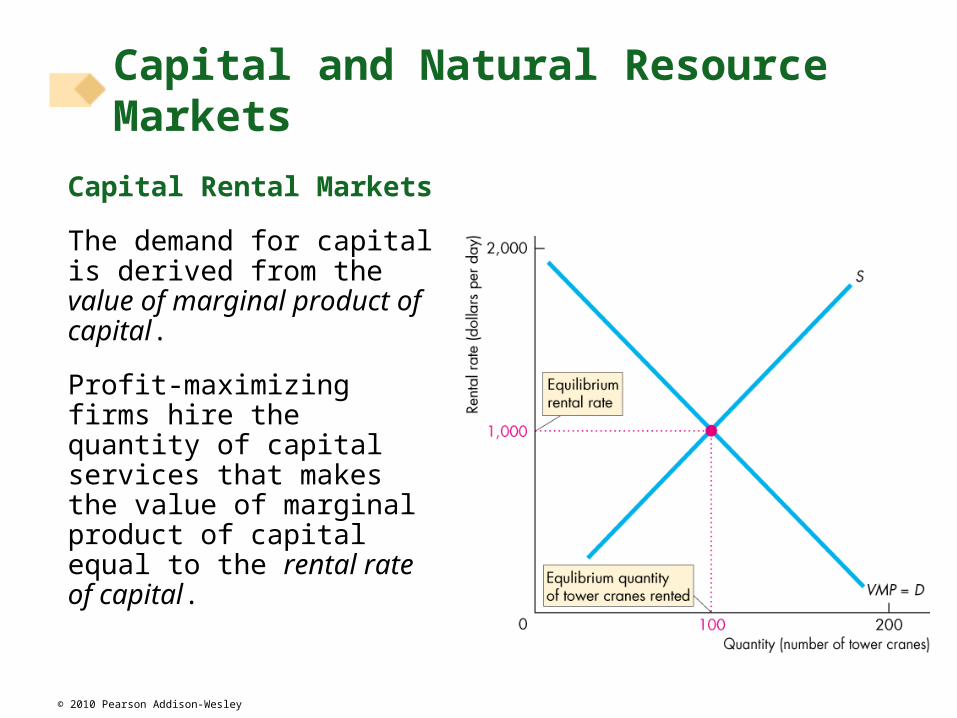
Capital Rental Markets
The demand for capital is derived from the value of marginal product of capital.
Profit-maximizing firms hire the quantity of capital services that makes the value of marginal product of capital equal to the rental rate of capital.
© 2010 Pearson Addison-Wesley
Rent-Versus-Buy Decision
The cost of the services of the capital that a firm owns and operates itself is an implicit rental rate that arises from depreciation and interest costs.
The decision to obtain capital services in a rental market rather than buy capital and rent it implicitly is made to minimize cost.
The firm compares the cost of explicitly renting the capital and the cost of buying and implicitly renting it.
Capital and Natural Resource Markets
© 2010 Pearson Addison-Wesley
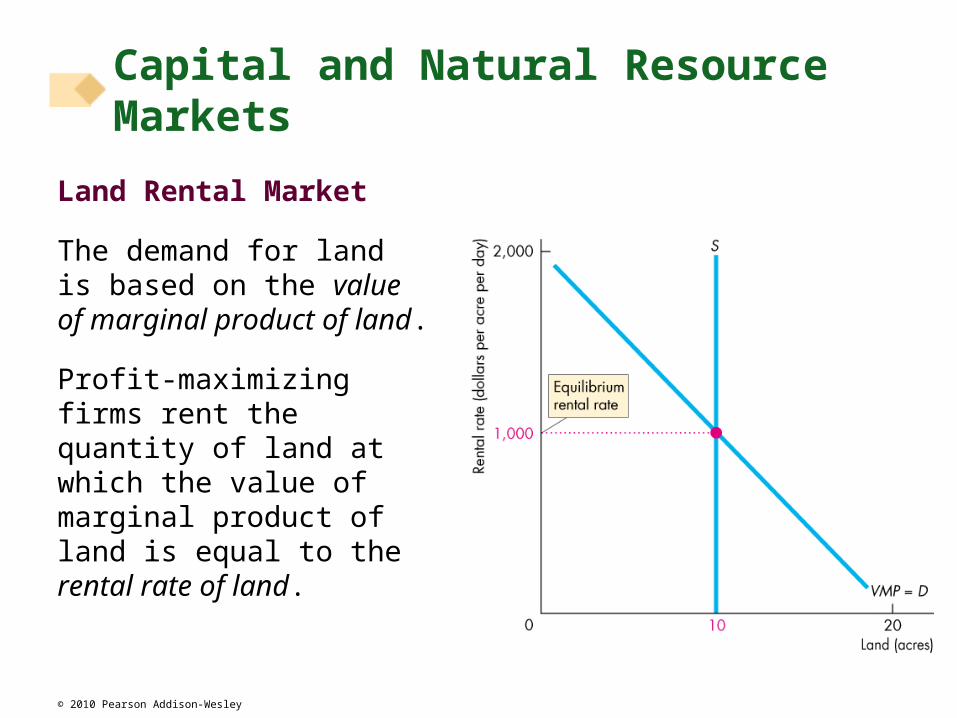
Land Rental Market
The demand for land is based on the value of marginal product of land.
Profit-maximizing firms rent the quantity of land at which the value of marginal product of land is equal to the rental rate of land.
Capital and Natural Resource Markets
© 2010 Pearson Addison-Wesley
Nonrenewable Natural Resource Markets
The nonrenewable natural resources are oil, gas, and coal and these resources are traded in global commodity markets.
Demand and supply determine the prices and the quantities traded in these commodity markets.
Capital and Natural Resource Markets
© 2010 Pearson Addison-Wesley
The Demand for Oil
Two key influences on the demand for oil are
1. The value of marginal product of oil
2. The expected future price of oil
The value of marginal product of oil is the fundamental influence on demand.
The greater the quantity of oil used, the smaller is the value of marginal product of oil.
Demand for oil slopes downward.
Capital and Natural Resource Markets
© 2010 Pearson Addison-Wesley
The higher the expected future price of oil, the greater the present demand for oil.
The expected future price is a speculative influence on demand.
A trader might buy oil to hold and to sell it later for a profit.
Instead of buying oil to hold and sell later, the trader could buy a bond and earn interest.
The opportunity cost of holding an inventory of oil is the forgone interest rate.
Capital and Natural Resource Markets
© 2010 Pearson Addison-Wesley
The Supply for Oil
Three key influences on the supply of oil are
1. The known reserves
2. The scale of current oil production facilities
3. The expected future price of oil
Known reserves are the oil that has been discovered and can be extracted with today’s technology.
The greater the size of the known reserves, the greater the supply of oil.
Capital and Natural Resource Markets
© 2010 Pearson Addison-Wesley
The scale of current oil production facilities is the fundamental influence on supply.
The increasing marginal cost of extracting oil means that the supply curve of oil slopes upward.
The higher the price of oil, the greater is the quantity supplied.
Capital and Natural Resource Markets
© 2010 Pearson Addison-Wesley
Speculative forces based on expectations about the future price also influence the supply of oil.
The higher the expected future price of oil, the smaller is the present supply of oil.
A trader with an oil inventory might plan to sell now or to hold and sell later. The opportunity cost of holding the oil is the forgone interest rate.
If the price of oil is expected to rise by a bigger percentage than the interest rate, it is profitable to incur the opportunity cost of holding oil rather than selling it immediately.
Capital and Natural Resource Markets
© 2010 Pearson Addison-Wesley
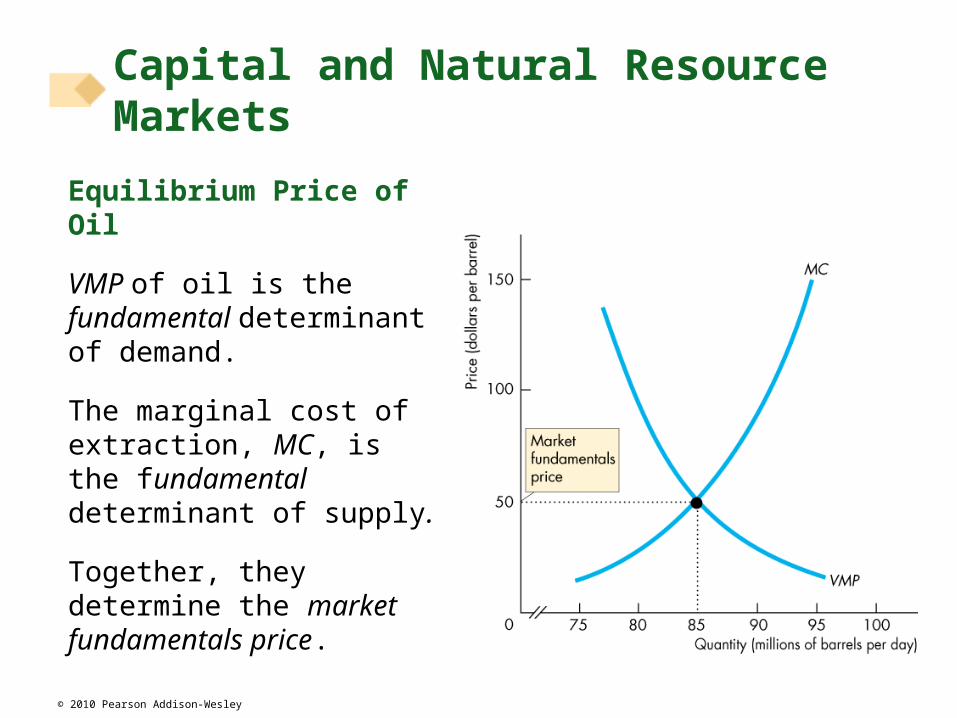
Equilibrium Price of Oil
VMP of oil is the fundamental determinant of demand.
The marginal cost of extraction, MC, is the fundamental determinant of supply.
Together, they determine the market fundamentals price.
Capital and Natural Resource Markets
© 2010 Pearson Addison-Wesley
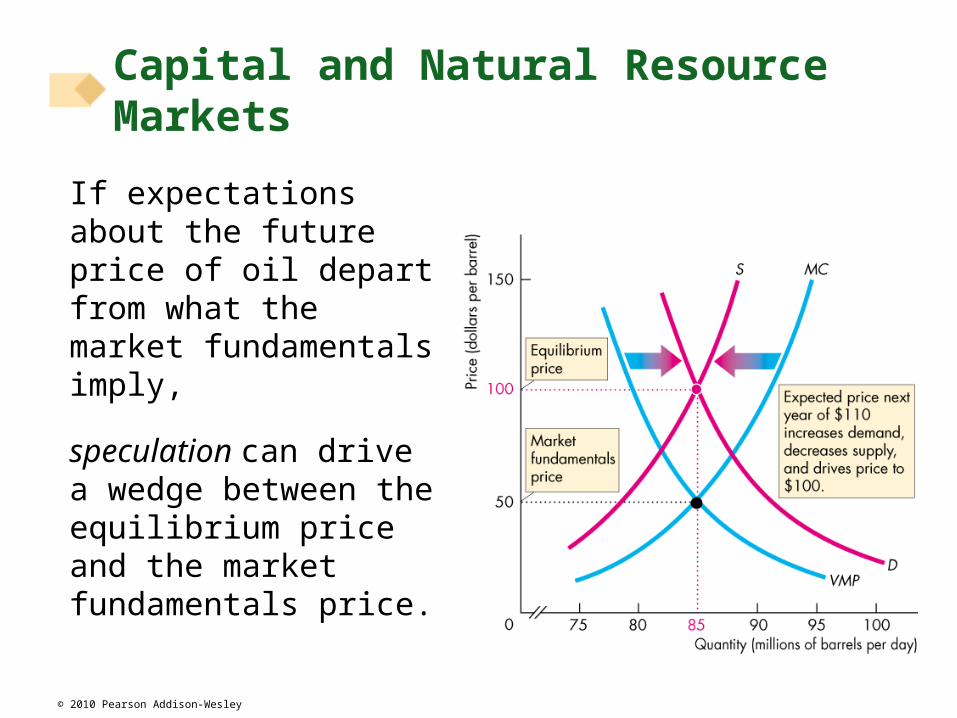
If expectations about the future price of oil depart from what the market fundamentals imply,
speculation can drive a wedge between the equilibrium price and the market fundamentals price.
Capital and Natural Resource Markets
© 2010 Pearson Addison-Wesley
The Hotelling Principle
Hotelling Principle: The idea that traders expect the price of a nonrenewable natural resource to rise at a rate equal to the interest rate.
If the price of oil is expected to rise at a rate that exceeds the interest rate, it is profitable to hold a bigger inventory.
Demand increases, supply decreases, and the price rises.
Capital and Natural Resource Markets
© 2010 Pearson Addison-Wesley
If the interest rate exceeds the rate at which the price of oil is expected to rise, it is not profitable to hold an oil inventory.
Demand decreases, supply increases, and the price falls.
But if the price of oil is expected to rise at a rate equal to the interest rate, holding an inventory of oil is just as good as holding bonds.
Demand and supply don’t change; the price is constant.
Only when the price of oil is expected to rise at a rate equal to the interest rate is the price at its equilibrium.
Capital and Natural Resource Markets