the investment payoff - ihep by: institute for higher education policy the investment payoff a...
TRANSCRIPT

PREPARED BY:
Institute for Higher Education Policy
The Investment PayoffA 50-State Analysis of the Public and Private Benefi ts of Higher Education

The Institute for Higher Education Policy is a non-profi t, non-partisan organization whose mission is to foster access and success in postsecondary education through public policy research and other activities that inform and infl uence the policymaking process. These activities include policy reports, seminars and meetings, capacity building activities such as strategic planning. The primary audiences of the Institute are those who make or inform decisions about higher education: government policymakers, senior institutional leaders, researchers, funders, the media, and private sector leaders.
For further information, please contact:
Institute for Higher Education Policy1320 19th Street, NW, Suite 400Washington, DC 20036Phone: 202-861-8223Facsimile: 202-861-9307Internet: www.ihep.org

PREPARED BY:
Institute for Higher Education Policy
February 2005
The Investment PayoffA 50-State Analysis of the Public and Private Benefi ts of Higher Education


Table of Contents
Acknowledgements . . . . . . . . . . . . . . . . . . . . . . . . . . . . . . . . . . . . . . . . . . . . . . . . . . . . . . . . . . . . . . . . 1
Introduction . . . . . . . . . . . . . . . . . . . . . . . . . . . . . . . . . . . . . . . . . . . . . . . . . . . . . . . . . . . . . . . . . . . . . . . . 3
Methodology . . . . . . . . . . . . . . . . . . . . . . . . . . . . . . . . . . . . . . . . . . . . . . . . . . . . . . . . . . . . . . . . . . . . . . . 5
Educational Attainment by State . . . . . . . . . . . . . . . . . . . . . . . . . . . . . . . . . . . . . . . . . . . . . . . . . . . . 5
Private Economic Benefi ts: Personal Income . . . . . . . . . . . . . . . . . . . . . . . . . . . . . . . . . . . . . . . . 7
Private Economic Benefi ts: Labor and Unemployment . . . . . . . . . . . . . . . . . . . . . . . . . . . . . . 9
Public Economic Benefi ts: Reduced Reliance on Public Assistance . . . . . . . . . . . . . . . . . .11
Private Social Benefi ts: Health . . . . . . . . . . . . . . . . . . . . . . . . . . . . . . . . . . . . . . . . . . . . . . . . . . . . . .13
Public Social Benefi ts: Volunteerism . . . . . . . . . . . . . . . . . . . . . . . . . . . . . . . . . . . . . . . . . . . . . . . .15
Public Social Benefi ts: Voting . . . . . . . . . . . . . . . . . . . . . . . . . . . . . . . . . . . . . . . . . . . . . . . . . . . . . .17
Conclusions . . . . . . . . . . . . . . . . . . . . . . . . . . . . . . . . . . . . . . . . . . . . . . . . . . . . . . . . . . . . . . . . . . . . . . .19
References . . . . . . . . . . . . . . . . . . . . . . . . . . . . . . . . . . . . . . . . . . . . . . . . . . . . . . . . . . . . . . . . . . . . . . . .20
Appendix . . . . . . . . . . . . . . . . . . . . . . . . . . . . . . . . . . . . . . . . . . . . . . . . . . . . . . . . . . . . . . . . . . . . . . . . . .21


Acknowledgments
This study represents the collective eff ort of a range of people who worked under a very tight timetable to produce the report. The report was written and researched by a team of Institute for Higher Education Policy staff members that included Alisa Cunningham, Director of Research; Sarah Krichels, Research Analyst; Jamie Merisotis, President; Christina Redmond Daulton, Research Analyst; Melissa Clinedinst, Senior Research Analyst; and Loretta Hardge, Director of Communications and Marketing. We also thank data consultant Natalie Jellinek.
Special thanks to Bob Dickeson and his colleagues at the Lumina Foundation for Education for their encouragement and generous support for this project.


The Investment Payoff 3
Introduction
Does college matter? In the last few years, a number of important eff orts have been made to better articulate the benefi ts that result from the investment in higher education, both to individual students and to society. Several national
organizations have made the public good of higher education a key theme of their ongoing work, ranging from the National Forum on Higher Education for the Public Good to the Association of American Colleges and Universities, among many others. Reports and studies also have been published that attempt to articulate the broad benefi ts of higher education, including the College Board’s Education Pays report (College Board, 2004), the National Center for Public Policy and Higher Education’s Measuring Up (2004) publication, and other highly regarded studies. These studies have consistently shown that going to college has broad and quantifi able national impacts, from higher salaries to improved health to increased volunteerism to a reduced reliance on welfare and other social support programs. In addition, these impacts occur over and above the eff ects of mediating factors such as income and age.
This report builds on the work of these ongoing eff orts by articulating the benefi ts of higher education on a 50-state basis.1 The framework used for this analysis is taken from a precursor to the aforementioned recent national eff orts, a 1998 Institute for Higher Education Policy report, Reaping the Benefi ts: Defi ning the Public and Private Value of Going to College. That report off ers a detailed historical perspective and contemporary catalog of benefi ts. Perhaps its most enduring contribution, however, is a simple matrix that groups the benefi ts of higher education into four major categories: public economic benefi ts, private economic benefi ts, public social benefi ts, and private social benefi ts (Figure 1). This matrix, which has appeared in forums ranging from the fl oor of the U.S. Senate to World Bank publications, includes 20 diff erent types of benefi ts that can be characterized. This extensive though far-from-complete list of the benefi ts of higher education has become of increasing interest at the state level as policymakers seek to better understand how the investment of state tax dollars pays off .
Like the federal government, state governments make a sizeable and vital public investment in postsecondary education. In fact, during academic year 1980-81, appropriations from state and local governments comprised nearly half of total revenue for public colleges and universities. By 1999-2000, however, only about one-third of public institutional revenues were provided by state and local governments (NCES, 2004). Unfortunately, the proportion of total revenues provided to public institutions through state and local appropriations decreased dramatically during the 1980s and has never fully rebounded. Yet this support for postsecondary education is an investment that has return benefi ts for both state and local governments and citizens living there.
Our goal for this study is to demonstrate that the same benefi ts that are found at a national level are also evident at the individual state level, and need to be taken into account in state policy discussions. A total of six measurable indicators from among those originally formulated in Reaping the Benefi ts have been articulated for all 50 states in this report. These six indicators represent each of the basic components of the four-square benefi ts matrix. Moreover, the data to assess these indicators are readily available for all 50 states. The following benefi t indicators are quantifi ed for all of the states:
◗ Private economic benefi ts: higher personal income, and lower unemployment;
◗ Public economic benefi ts: decreased reliance on public assistance;
1 The District of Columbia is not included as part of the 50-state analysis. However, data for the city are included in the Appendix tables.
Support for post-
secondary education
is an investment that
has return benefi ts for
both state and local
governments and
citizens living there.

4 The Investment Payoff
◗ Private social benefi ts: better health; and
◗ Public social benefi ts: increased volunteerism, and increased voting participation.
While this report presents data on a state-by-state basis in more detail, the scope of this exploratory eff ort is purposely narrow. The report does not attempt to look broadly at all indicators off ered in Reaping the Benefi ts for this state-level assessment. The sheer size of a 50-state study that attempts to describe all of the benefi ts that are found in Reaping the Benefi ts would require an enormous undertaking and commitment of substantial eff ort and resources. This study also does not attempt to rate state performance based on a series of graded measures. Nor does it attempt to draw inferences regarding causal relationships or to question why some states might fare better or worse compared to other states; it is beyond the scope of this study to examine the myriad infl uences in each state that may impact their performance in any given indicator.
The U.S. Census Bureau’s Current Population Survey (CPS) is the result of a partnership between the Census Bureau and the Bureau of Labor Statistics. They survey a sample of indi-viduals in all 50 states and the District of Columbia. In some of the indicators, state-level data showed peculiar results that may deviate from information reported by the states themselves. For example, no one in Mississippi age 25 or older with a high school diploma reported receiving public assistance in the prior year. This may be due to many reasons including, but not limited to: self-reporting, sample bias, or the particulars of welfare and social policy in that state. However, it is beyond the scope of this report to speculate why these anomalies occur.
Much of the focus of the analysis is concentrated on the added value of earning a college degree, as evidenced by examining the diff erence between a high school diploma and a bachelor’s degree for each of the six indicators. The added value of participating in at least some college (including an associate’s degree) also is important, and the data show that for the vast majority of states, some college is good, and more college is even better. A complete state-by-state breakdown for all six of the indicators by education level (less than high school, high school graduate, some college, bachelor’s degree, and advanced degree) can be found in the Appendix.
Figure 1. The Array of Higher Education Benefi ts
Economic
Public Private
Increased Tax Revenues Higher Salaries and Benefi ts
Greater Productivity Employment
Increased Consumption Higher Savings Levels
Increased Workforce Flexibility Improved Working Conditions
Decreased Reliance on Government Financial Support
Personal/Professional Mobility
Social
Reduced Crime Rates Improved Health/Life Expectancy
Increased Charitable Giving/Community Service
Improved Quality of Life for Off spring
Increased Quality of Civic Life Better Consumer Decision Making
Social Cohesion/Appreciation of Diversity Increased Personal Status
Improved Ability to Adapt to and Use Technology
More Hobbies, Leisure Activities
SOURCE: Institute for Higher Education Policy. 1998. Reaping the Benefi ts: Defi ning the Public and Private Value of Going to College. Washington, DC: Institute for Higher Education Policy.

The Investment Payoff 5
2 For more information on the Current Population Survey and its supplements, see “Current Population Survey, Technical Paper 63RV: Design And Methodology.” available at http://www.bls.census.gov/cps/tp/tp63.htm3 This is mathematically calculated as a percentage by dividing the marginal diff erence by the fi ndings for those with a high school diploma.
MethodologyThis report uses data obtained from the U.S. Census Bureau’s Current Population Survey (CPS),2 specifi cally from the March 2004 Supplement, the September 2004 Volunteer Supplement, and the November 2000 Voting Supplement.
The key measure for each indicator is the added benefi t, either to the individual or to society as a whole, from obtaining a bachelor’s degree in addition to a high school diploma. Because of its roots in economic theory, this concept is called the marginal diff erence of a bachelor’s degree compared to a high school diploma for each indicator, and is reported in either dollar amounts or percentage points. Further, the marginalpercentage diff erence expresses the diff erence as a percentage of the base (high school diploma) so that states can be compared in terms of the largest (or smallest) proportional benefi t of obtaining a bachelor’s degree in addition to a high school diploma.3
For example, in 2000 the voting rate in Wisconsin for those over the age of 25 with a high school diploma was 63 percent compared to 88 percent for those with a bachelor’s degree. This constitutes a diff erence of 25 percentage points (or a 40 percent increase) between the voting rate for those with a high school diploma and those with a bachelor’s degree. In Nevada, the voting rate for those over the age of 25 with a high school diploma was 47 percent compared to 68 percent for those with a bachelor’s degree. This constitutes a diff erence of 21 percentage points (or a 45 percent increase) between those with a high school diploma and those with a bachelor’s degree. Thus, the diff erence in voting rates between those with a high school diploma and those with a bachelor’s degree in Nevada is lower than the diff erence in Wisconsin, while the added percentage diff erence(which takes the base into account) of a bachelor’s degree is actually higher in Nevada.
In the following sections, each indicator has two tables. For most of the indicators, the fi rst table orders the states from the lowest to the highest within that indicator for those with a bachelor’s degree (not including those with advanced degrees), presenting the top fi ve and bottom fi ve states. For the indicators dealing with unemployment and public assistance, where the benefi t is actually a decrease between those with a high school diploma and those with a bachelor’s degree, states are ordered from the lowest to the highest for those with a high school diploma. The second table for each indicator orders states from lowest to highest in terms of the marginal percentage diff erence between those with a high school diploma and those with a bachelor’s degree. The second table presents the data for the top fi ve and bottom fi ve states. Data for all the states are available in the Appendix.
For ease of language and interpretation, from this point forward in the text the marginal diff erence is simply called the diff erence, and the marginal percentage diff erence is referred to as the percentage diff erence.
Educational Attainment by StateThe educational attainment levels of state residents for all 50 states were examined to provide context for this discussion about the state-level benefi ts of higher education. Nationally, 18 percent of the population age 25 and older hold a bachelor’s degree. Combined with those attaining an advanced degree, 28 percent of the population 25 and older hold at least a bachelor’s degree. Figure 2 provides a snapshot of the percentage of the population holding a bachelor’s degree for all 50 states. Data for all levels of educational attainment can be found in the Appendix tables.

6 The Investment Payoff
Figure 2. Percentage of the population age 25 and older with a bachelor’s degree in March 2004, by state of residence.
CONJVTMANHMNCTCAUTVANDMDWAKSSDGANEMT
US
MORIHIORNYILIDAKTXIAAZMEWIFLTNDENCSCWYPANVOKALOHLAMINMARINMSKYWV
0 5% 10% 15% 20% 25%
23.3%
23.1%
22.8%
21.8%
21.3%
21.2%
21.2%
20.6%
20.3%
20.3%
20.2%
20.0%
18.6%
18.7%
18.3%
18.3%
18.1%
17.9%
17.8%
17.8%
17.6%
17.6%
17.4%
17.4%
17.3%
17.3%
17.3%
17.2%
17.2%17.2%
17.1%
17.0%
16.6%
16.4%
16.4%
16.3%
16.2%
16.0%
16.0%
15.9%
15.8%
15.6%
15.3%
14.9%
14.2%
13.4%
12.5%
12.4%
9.8%
21.8%
22.7%
Source: U.S. Census Bureau, Current Population Survey (CPS), March 2004 Supplement (2004).

The Investment Payoff 7
Private Economic Benefi ts: Personal Income National discussions about the value of higher education focus a great deal on the private economic gains—often to the exclusion of the other public and private benefi ts. Data show that in terms of both lifetime earnings and average annual income, an individual’s ability to earn more and to maintain employment correlates to higher levels of education.
In March 2004, the national average total personal income of workers 25 and older with a bachelor’s degree was $48,417, roughly $23,000 higher than for those with a high school diploma (Figure 3). At the state level, the fi nancial impact varies although the increase in earnings for those holding a bachelor’s degree is clearly evident across all the states. Connecticut stands out as the state in which the average total personal income for those who hold a bachelor’s degree was the highest. The average total personal income for workers in Connecticut who have a bachelor’s degree was $56,211, roughly $27,000 more than their high school graduate counterparts.4 Maryland, Massachusetts, New Jersey, and Arkansas also led the nation among the states in which those with a bachelor’s degree reported high average personal incomes.
Workers holding a bachelor’s degree in the state of Montana earned an average total personal income of $35,622—almost $13,000 less than the national average—but $14,500 higher than the average total personal income of Montana workers with only a high school diploma. Average incomes for those with a bachelor’s degree in Wyoming, West Virginia, Maine, and North Dakota, while below the national average,
MT WY WV ME ND US AR NJ MA MD CT0
$10,000
$20,000
$30,000
$40,000
$50,000
$60,000
High School Diploma Bachelor’s Degree
AVER
AGE T
OTAL
PER
SONA
L INC
OME
Figure 3. Average total personal income among people age 25 and older in 2003: states with the highest and lowest average personal income for those with a bachelor’s degree.
NOTES: States were chosen based on the average income for bachelor’s degree recipients. Income for those with a high school diploma is provided for comparison purposes. Those with a bachelor’s degree does not include those who have attained an advanced degree as well.
Source: U.S. Census Bureau, Current Population Survey (CPS), March 2004 Supplement (2004).
4 In the United States, the diff erence in average total personal income between those with a high school diploma and those with a bachelor’s degree is $23,364, a 93 percent increase.

8 The Investment Payoff
nonetheless exceeded the average total personal income for individuals with only a high school diploma.
While all states showed some increase in earning potential that favors those holding bachelor’s degrees in terms of average total personal income, the percentage diff erence varied from state to state (Figure 4). For example, in Arkansas the diff erence in average total personal income between a worker with a high school diploma ($21,719) and a worker with a bachelor’s degree ($53,646) constituted an increase of 147 percent. Similarly high private economic benefi ts for residents who obtain a bachelor’s degree were found in Pennsylvania (109 percent), Arizona (112 percent), South Carolina (113 percent), and New Mexico (132 percent). Even in those states in which the added benefi t (in terms of increases to average total personal income) was the lowest, the data still showed dramatic percentage increases of close to 50 percent.
AK ID WY IA VT US PA AZ SC NM AR0
$10,000
$20,000
$30,000
$40,000
$50,000
$60,000
0
20%
40%
60%
80%
100%
120%
140%
160%
High School Diploma Bachelor’s Degree Percentage Difference
PERC
ENTA
GE D
IFFE
RENC
E
AVERAGE TOTAL PERSONAL INCOME
47% 48%48%
62%
62%
109%
93%
113%
112%
132%
147%
Figure 4. Average total personal income among people age 25 and older in 2003: states with the largest and smallest percentage difference between those with a high school diploma and those with a bachelor’s degree.
NOTES: The states included here were selected based on the percentage diff erences (see methodology) between those with a high school diploma and those with a bachelor’s degree, which are represented by the data points; the dashed line should not be interpreted as a trend. Data for two levels of educational attainment are included for reference purposes. Those with a bachelor’s degree does not include those who have attained an advanced degree as well.
Source: U.S. Census Bureau, Current Population Survey (CPS), March 2004 Supplement (2004).
While all states
showed some
increase in earning
potential that
favors those holding
bachelor’s degrees
in terms of average
total personal income,
the percentage
difference varied from
state to state.

The Investment Payoff 9
Private Economic Benefi ts: Labor and UnemploymentAs America invests in and develops an educated workforce, productivity increases along with individuals’ ability to sustain employment and earn higher income. Subsequently, the nation sees a return in the form of a higher tax base and an increased demand for goods and services. This is also true for state-level investment in an educated workforce.
The percentage of workers age 25 and older who are in the labor force but are not employed is another personal economic indicator that can be correlated with higher levels of educational attainment. In March 2004, 6 percent of the population nationwide age 25 and older with a high school diploma were not employed, compared to 3 percent for those with a bachelor’s degree (Figure 5). Among the states, those in which people with a high school diploma in the labor force reported the highest levels of unemployment included South Carolina (8 percent), Washington (8 percent), California (8 percent), Michigan (10 percent), and Alaska (12 percent). Those states with the lowest rates of unemployment reported by those with a high school diploma include Mississippi (2 percent) North Dakota (3 percent), Wyoming (3 percent), Oklahoma (4 percent), and Nebraska (4 percent). In each case, unemployment rates among those with a bachelor’s degree were much lower. Indeed, across all the states, individuals with a bachelor’s degree reported lower levels of unemployment than individuals with a high school diploma.
The diff erence between those who hold a high school diploma and those who hold a bachelor’s degree is more clearly illustrated by examining the percentage
MS ND WY OK NE US SC WA CA MI AK0
2%
4%
6%
8%
10%
12%
14%
High School Diploma Bachelor’s Degree
PERC
ENT N
OT EM
PLOY
ED
Figure 5. Percentage of people age 25 and older who were in the labor force and not employed: states with the highest and lowest rates among those who had a high school diploma.
NOTES: This fi gure shows the states with the highest and lowest rates reported by those with a high school diploma. Unemployment rates for those with a bachelor’s degree are provided for comparison purposes. Those with bachelor’s degrees does not include those who have an advanced degree as well.
Source: U.S. Census Bureau, Current Population Survey (CPS), March 2004 Supplement (2004).

10 The Investment Payoff
NJ LA NY OR RI US KY NE NM MS WV0
1.0%
2.0%
3.0%
4.0%
5.0%
6.0%
7.0%
8.0%
-120%
-100%
-80%.
-60%
-40%
-20%
0
High School Diploma Bachelor’s Degree Percentage Difference
PERC
ENTA
GE D
IFFE
RENC
E PERCENT NOT EMPLOYED
-10%
-17%
-18%
-19%
-24%
-48%
-82%
-83%-85%
-100%
-100%
Figure 6. Percentage of people age 25 and older who were in the labor force and not employed: states with the largest and smallest percentage difference between those with a high school diploma and those with bachelor’s degree.
NOTES: The states included here were selected based on the percentage diff erences (see methodology) between those with a high school diploma and those with a bachelor’s degree, which are represented by the data points; the dashed line should not be interpreted as a trend. Data for two levels of educational attainment are included for reference purposes. Those with a bachelor’s degree does not include those who have attained an advanced degree as well.
Source: U.S. Census Bureau, Current Population Survey (CPS), March 2004 Supplement (2004).
diff erence (Figure 6). In the United States as a whole, the 2.8 percentage point diff erence between the unemployment rates of those with a high school diploma and those with a bachelor’s degree constituted a 48 percent decrease. The states showing the largest percentage decrease between those who are unemployed with a high school diploma and those who are unemployed with a bachelor’s degree include Kentucky, Nebraska, New Mexico, Mississippi, and West Virginia. In states reporting relatively small percentage decreases (New Jersey, Louisiana, New York, Oregon, and Rhode Island), it is nonetheless notable that the percentage decrease between those with a high school diploma who were unemployed and those with a bachelor’s degree who were unemployed ranged from 10 percent to 24 percent. Despite the range of diff erences, the pattern is consistent: higher unemployment was reported among those with only a high school diploma than among those with a bachelor’s degree.
Despite the range
of diff erences, the
pattern is consistent:
higher unemployment
was reported among
those with only a high
school diploma than
among those with a
bachelor’s degree.

The Investment Payoff 11
Public Economic Benefi ts: Reduced Reliance on Public AssistanceAn educated workforce with a lower unemployment rate also brings benefi ts to the nation as a whole and to individual states. For example, improvements in the quality of life can take the form of less dependence on welfare assistance and diminished demand for other government-provided social services.5
Nationally, 1 percent of those with a high school diploma, and less than one-half percent of those with a bachelor’s degree, received some form of public assistance in 2003 (Figure 7). Overall, more people with a high school diploma reported receiving public assistance in every state than those with a bachelor’s degree, and in 28 states no one with a bachelor’s degree reported receiving public assistance in the prior year. When examining state-level data, the pattern of public assistance was linked to education attainment and varied across the states. Residents with high school diplomas in Alaska,
LA SC GA AR IA US NY CA ME WA AK0
0.5%
1.0%
1.5%
2.0%
2.5%
3.0%
3.5%
4.0%
High School Diploma Bachelor’s Degree
PERC
ENT R
ECEI
VING
PUB
LIC A
SSIS
TANC
E
Figure 7. Percentage of population age 25 and older who received some form of public assistance in 2003: states with the highest and lowest rates among those with a high school diploma.
NOTES: This fi gure shows the states with the highest and lowest rates reported by those with a high school diploma. Rates for those with a bachelor’s degree are provided for comparison purposes. Those with bachelor’s degrees does not include those who have an advanced degree as well. No one with a high school diploma or a bachelor’s degree in Mississippi reported receiving public assistance; therefore Mississsippi was excluded from this fi gure.
Source: U.S. Census Bureau, Current Population Survey (CPS), March 2004 Supplement (2004).
5 The March 2004 Supplement of the Current Population Survey defi nes public assistance as welfare payments, general assistance program payments, emergency assistance payments, Cuban/Haitian refugee payments, and Indian assistance payments. It specifi cally does not include Food Stamps or Social Security Insurance payments.

12 The Investment Payoff
Washington, Maine, California, and New York reported the highest rates of receipt for public assistance. In Alaska, 3.5 percent of residents with high school diplomas received public assistance. On the other end of the spectrum, the states in which the lowest portion of the population with high school diplomas reported receiving some form of public assistance in 2003 included Louisiana, South Carolina, Georgia, Arkansas, and Iowa.6
While the national percentages regarding the receipt of public assistance in 2003 were quite small, a decrease of 0.7 percentage points between the rate of receipt reported by those with a high school diploma and the rate reported by those a bachelor’s degree represented a percentage diff erence of 72 percent (Figure 8). Twenty-seven states showed a decrease of 100 percent between those with a high school degree and those with a bachelor’s degree (fi ve are refl ected in the fi gure). Only three states—New Mexico, New Hampshire, and Hawaii—demonstrated a positive percentage diff erence between those with a high school diploma and those with a bachelor’s degree who reported receiving public assistance, although the actual numbers of those with a bachelor’s degree who reported receiving some form of public assistance were lower than the numbers of those with a high school diploma. The data from the other 47 states reinforce the assertion that earning a bachelor’s degree reduces reliance on public assistance programs.
NM NH HI CT FL US CO VT MN TN AK0
0.5%
1.0%
1.5%
2.0%
2.5%
3.0%
3.5%
4.0%
-110%
-90%
-70%
-50%
-30%
-10%
10%
30%
50%
High School Diploma Bachelor’s Degree Percentage Difference
PERC
ENTA
GE D
IFFE
RENC
E
PERCENT RECEIVING PUBLIC ASSISTANCE
32%
25%
1%
-14%-17%
-72%
-100% -100% -100% -100% -100%
Figure 8. Percentage of the population age 25 or older who received public assistance in 2003: states with the largest and smallest percentage difference between those with a high school diploma and those with a bachelor’s degree.
NOTES: The states included here were selected based on the percentage diff erences (see methodology) between those with a high school diploma and those with a bachelor’s degree, which are represented by the data points; the dashed line should not be interpreted as a trend. Data for two levels of educational attainment are included for reference purposes. Those with a bachelor’s degree does not include those who have attained an advanced degree as well. Twenty-seven states had a percentage decrease of 100 percent, refl ecting the fact that no bachelor’s degree recipient received public assistance in those states. The fi ve included here also had the largest nominal diff erences.
Source: U.S. Census Bureau, Current Population Survey (CPS), March 2004 Supplement (2004).
An educated
workforce with a
lower unemployment
rate also brings
benefi ts to the nation
as a whole and to
individual states.
6 In Mississippi, no one with a high school diploma or a bachelor’s degree reported receiving public assistance and the state was therefore excluded from this comparison.

The Investment Payoff 13
Private Social Benefi ts: HealthPrivate social benefi ts accrue to individuals or groups and are not directly related to economic, fi scal, or labor market eff ects.7 One quantifi able indicator in this category is personal health. The health of individuals also clearly has a broader social benefi t in that healthier citizens reduce expenses on insurance, unreimbursed medical expenses, and other costs that are often passed on to other consumers.
Across the United States, 82 percent of those with a high school diploma reported being in “excellent, very good, or good” health, compared to 93 percent of those with a bachelor’s degree (Figure 9). Five states, in which the highest proportions of residents with a bachelor’s degree reported good health, stand out—Virginia, Iowa, Rhode Island, Utah, and Minnesota. In these states, 95 to 97 percent of bachelor’s degree holders described their health as good, very good, or excellent. Among those with high school diplomas in these same fi ve states, the percentage reporting positive health status ranged from 81 to 86 percent. While those with a high school diploma in four of these states reported higher than average rates of good health, in all fi ve states fewer respondents with a high school diploma reported good health than those who earned a bachelor’s degree. The states in which the lowest proportions of those with a bachelor’s
WV KY AZ OK SC US VA IA RI UT MN0
20%
40%
60%
80%
100%
120%
High School Diploma Bachelor’s Degree
PERC
ENT I
N GO
OD H
EALT
H
Figure 9. Percent of population age 25 or older who reported being in good, very good, or excellent health: states with the highest and lowest rates among those with a bachelor’s degree.
NOTES: This fi gure shows the states with the highest and lowest rates reported by those with a bachelor’s degree. Rates for those with a high school diploma are provided for comparison purposes. Those with bachelor’s degrees does not include those who have attained an advanced degree as well.
Source: U.S. Census Bureau, Current Population Survey (CPS), March 2004 Supplement (2004).
7 These eff ects occur within income and age groups; see College Board 2004.

14 The Investment Payoff
degree who reported good health included West Virginia, Kentucky, Arizona, Oklahoma, and South Carolina and ranged from 85 percent to 90 percent. Nonetheless, respondents with bachelor’s degrees in these states still reported higher rates of good health than those who hold a high school diploma. All the other states not included in this fi gure exhibit similar trends.
In terms of the percentage diff erence, fi ve states stand out in terms of the greatest percentage diff erences between those with a high school diploma and those with a bachelor’s degree in the reporting of good health (Figure 10). For example, in Alabama the proportion of bachelor’s degree recipients indicating “excellent, very good, or good heath” was 23 percentage points higher than for those with high school diplomas, a percentage diff erence of 32 percent. Montana, South Carolina, Tennessee, and Arkansas demonstrated similar trends with percentage diff erences in reported good health between those who hold high school diplomas and those who hold bachelor’s degrees ranging from 19 to 25 percent. This suggests that in those states, the prospects of good health for those who attained a bachelor’s degree were higher than they are for those holding a high school diploma. Even in the bottom fi ve states (Arizona, New Hampshire, Massachusetts, Delaware and Connecticut), the percentage diff erence in reported good health between high school graduates and bachelor’s degree recipients constituted increases of roughly 5 to 9 percent.
AZ NH MA DE CT US MT SC TN AR AL0
10%
20%
30%
40%
50%
60%
70%
80%
90%
100%
0
5%
10%
15%
20%
25%
30%
35%
PERC
ENTA
GE D
IFFER
ENCE
PERCENT IN GOOD HEALTH
High School Diploma Bachelor’s Degree Percentage Difference
5%
7%8%
8%9%
13%
19%20%
21%
25%
32%
Figure 10. Percent of population age 25 or older who reported being in good, very good, or excellent health: states with the largest and smallest percentage difference between those with a high school diploma and those with a bachelor’s degree.
NOTES: The states included here were selected based on the percentage diff erences (see methodology) between those with a high school diploma and those with a bachelor’s degree, which are represented by the data points; the dashed line should not be interpreted as a trend. Data for two levels of educational attainment are included for reference purposes. Those with a bachelor’s degree means that the highest level attained was a bachelor’s degree and does not include those who have attained an advanced degree as well.
Source: U.S. Census Bureau, Current Population Survey (CPS), March 2004 Supplement (2004).
The health of
individuals also
clearly has a broader
social benefi t in that
healthier citizens
reduce expenses
on insurance,
unreimbursed medical
expenses, and other
costs that are often
passed on to
other consumers.

The Investment Payoff 15
Public Social Benefi ts: VolunteerismThe public social benefi ts of higher education are probably the most complex and diffi cult to measure. Individual involvement in the community, concern for the quality of life, and caring for the social well-being of America benefi t society as well as the individual. These attributes can be captured to some degree by examining the rate of volunteer participation.
In September 2004, 21 percent of the U.S. population age 25 and older who had a high school diploma reported ever volunteering, compared to 36 percent of those with a bachelor’s degree or higher8 (Figure 11). The fi ve states in which those with bachelor’s degrees reported the highest level of volunteering include Missouri, Vermont, Iowa, Alaska, and Wyoming. For example, in Wyoming, 38 percent of the population age 25 and older who hold high school diplomas reported volunteering, compared to 58 percent of bachelor’s degree recipients. States with the lowest volunteering rates for those with a bachelor’s degree include Louisiana, Mississippi, Hawaii, West Virginia, and
LA MS HI WV NY US MO VT IA AK WY0
10%
20%
30%
40%
50%
60%
70%
High School Diploma Bachelor’s Degree
PERC
ENT W
HO V
OLUN
TEER
ED
Figure 11. Percentage of people age 25 and older who reported ever volunteering: states with the fi ve highest and fi ve lowest rates among those with a bachelor’s degree or higher.
NOTES: This fi gure shows the states with the highest and lowest rates reported by those with a bachelor’s degree or higher. Rates for those with a high school diploma are provided for comparison purposes.
Source: U.S. Census Bureau, Current Population Survey (CPS), Volunteer Supplement (September 2004).
8 The September 2004 Supplement of CPS does not allow an exact match of the educational attainment variable; therefore, data for this indicator groups bachelor’s degrees and advanced degrees.

16 The Investment Payoff
FL LA OK WA UT US CA VA AK AL MS0
10%
20%
30%
40%
50%
60%
0
50%
100%
150%
200%PE
RCEN
TAGE
DIF
FERE
NCE PERCENT W
HO VOLUNTEERED
29%35% 35% 35% 35%
73%
130%131% 135% 137%
199%
High School Diploma Bachelor’s Degree Percentage Difference
Figure 12. Percentage of people age 25 and older who reported ever volunteering: states with the largest and smallest percentage difference between those with a high school diploma and those with a bachelor’s degree or higher.
NOTES: The states included here were selected based on the percentage diff erences (see methodology) between those with a high school diploma and those with a bachelor’s degree or higher, which are represented by the data points; the dashed line should not be interpreted as a trend. Data for two levels of educational attainment are included for reference purposes.
Source: U.S. Census Bureau, Current Population Survey (CPS), Volunteer Supplement (September 2004).
New York, ranging from 20 to 25 percent. In Louisiana, 15 percent of those with a high school diploma volunteered, compared to 20 percent of bachelor’s degree recipients. However, in all states, higher levels of education were correlated to the likelihood that an individual would volunteer.
As with other indicators, the data suggest that the added value of a bachelor’s degree in terms of the percentage increase in volunteering rates may show a slightly diff erent pattern (Figure 12). California, Virginia, Alaska, Alabama, and Mississippi experienced the highest percentage increases between those with a high school diploma and those with a bachelor’s degree or higher, ranging up to 199 percent for Mississippi. Other states had relatively lower percentage diff erences. To return to the previous example, the 5 percentage point diff erence between those with a high school diploma in Louisiana and those with a bachelor’s degree constituted a 35 percent diff erence in volunteer rates. This indicates that even in those states with a small diff erence between volunteering rates, higher education still correlated with additional benefi ts.

The Investment Payoff 17
Public Social Benefi ts: VotingA thriving democratic society also benefi ts from increased political participation among the people. Voting is one indicator among many that can gauge civic involvement.
In November 2000, 56 percent of U.S. citizens who were age 25 and older and had a high school diploma responded that they had voted in the 2000 presidential election, compared to 76 percent of bachelor’s degree recipients (Figure 13). All of the states also show evidence that higher education increases the likelihood of voting. The fi ve states with the highest voting rates among those with a bachelor’s degree include North Dakota, Vermont, Maine, Wisconsin, and Iowa, where voting rates among those 25 and older with a bachelor’s degree hovered between 86 and 88 percent. On the other hand, Georgia, Arkansas, Hawaii, Nevada, and Tennessee had the lowest voting percentages in the United States among those with a bachelor’s degree (ranging from 63 to 70 percent). For all of these states (as well as states not included in the fi gure), voting rates were substantially lower for residents with a high school diploma.
The percentage diff erences in voting rates for those with a high school diploma compared to those with a bachelor’s degree ranged from 12 percent in Massachusetts to 78 percent in Hawaii; nationally, the percentage diff erence was 36 percent (Figure 14). The fi ve states with the highest percentage increase in voting rates between those with a high school diploma and those with a bachelor’s degree include North Carolina,
GA AR HI NV TN US ND VT ME WI IA0
10%
20%
30%
40%
50%
60%
70%
80%
90%
100%
High School Diploma Bachelor’s Degree
PERC
ENT W
HO V
OTED
Figure 13. Percentage of the population age 25 and older who voted in the November 2000 election: states with the highest and lowest rates among those with a bachelor’s degree.
NOTES: This fi gure shows the states with the highest and lowest rates reported by those with a bachelor’s degree. Rates for those with a high school diploma are provided for comparison purposes. Those with bachelor’s degrees does not include those who have attained an advanced degree as well.
Source: U.S. Census Bureau, Current Population Survey (CPS), Voting Supplement (November 2000).
A thriving democratic
society also benefi ts
from increased political
participation among
the people. Voting is
one indicator among
many that can gauge
civic involvement.

18 The Investment Payoff
MA MS MN MO RI US NC TX CO AZ HI0
10%
20%
30%
40%
50%
60%
70%
80%
90%
100%
0
10%
20%
30%
40%
50%
60%
70%
80%
90%
PERC
ENTA
GE D
IFFE
RENC
E PERCENT WHO VOTED
12%
16%
23%25%
27%
36%
50% 51%54% 54%
78%
High School Diploma Bachelor’s Degree Percentage Difference
Figure 14. Percentage of the population age 25 and older who voted in the November 2000 election: states with the largest and smallest percentage difference between those with a high school diploma and those with a bachelor’s degree.
NOTES: The states included here were selected based on the percentage diff erences (see methodology) between those with a high school diploma and those with a bachelor’s degree, which are represented by the data points; the dashed line should not be interpreted as a trend. Data for two levels of educational attainment are included for reference purposes. Those with a bachelor’s degree does not include those who have attained an advanced degree as well.
Source: U.S. Census Bureau, Current Population Survey (CPS), Voting Supplement (November 2000).
Texas, Colorado, Arizona, and Hawaii. In these states, a bachelor’s degree had the highest public benefi ts in terms of increased voting participation, compared with other states. Nonetheless, even the states with the lowest percentage diff erence in voting rates between the two populations (Massachusetts, Mississippi, Minnesota, Missouri, and Rhode Island) demonstrated a signifi cant diff erence in the voting rates. This indicates that all states benefi ted from higher education with respect to voting rates.

The Investment Payoff 19
ConclusionsHigher education provides a broad array of benefi ts to both individuals and society. While such a statement has been a long-held belief in American higher education, only recently has the combination of social and economic benefi ts that accrue from the investment in higher education received sustained attention. This study attempts to build on recent eff orts to better describe the broad national benefi ts of higher education by calculating state-by-state benefi ts using readily available data from the U.S. Census. The six indicators chosen for this analysis convincingly show that almost every state benefi ts from higher education in every indicator, even as some states benefi t more than others.
This simple articulation of the benefi ts of higher education for individual states needs to be more prominently featured in state policy debates regarding the investment of state resources in higher education. Moreover, additional eff orts should be undertaken to develop specifi c and quantifi able indicators of the value of higher education at the state level. Such an expanded understanding of the payoff s that result from the public and private expenditures in higher education could go a long way toward improving the prospects for state economic development, social stability, and individual prosperity.

20 The Investment Payoff
ReferencesCollege Board. 2004. Education Pays 2004: The Benefi ts of Higher Education for Individuals
and Society. Washington, DC: College Board.
Institute for Higher Education Policy. 1998. Reaping the Benefi ts: Defi ning the Public and Private Value of Going to College. Washington, DC: Institute for Higher Education Policy.
National Center for Public Policy and Higher Education. 2004. Measuring Up 2004: The National Report Card on Higher Education. San Jose, CA: The National Center for Public Policy and Higher Education.
U.S. Department of Education. National Center for Education Statistics. 2004. The Condition of Education 2004 (NCES 2004-077). Washington, DC: Government Printing Offi ce.

APPENDIX

22 The Investment Payoff
Table 1. Percentage of US population age 25 and older in March 2004, by educational attainment and by state of residence.
Less than high school
High school diploma
Some college (includes AS, AA,
Certifi cates)
Bachelor’s degree (BA,AB,BS)
Advanced (includes MA, MS, PhD, First
Professional)
United States 14.8% 32.0% 25.5% 18.1% 9.6%
Alabama 17.6% 34.5% 25.6% 15.9% 6.4%
Alaska 9.8% 31.4% 33.3% 17.3% 8.2%
Arizona 15.6% 27.0% 29.4% 17.2% 10.8%
Arkansas 20.8% 36.9% 23.6% 14.2% 4.6%
California 18.7% 21.9% 27.7% 21.2% 10.5%
Colorado 11.7% 26.1% 26.7% 23.3% 12.3%
Connecticut 11.2% 31.2% 23.1% 21.3% 13.2%
Delaware 13.5% 37.5% 22.1% 16.6% 10.3%
District of Columbia 13.6% 23.4% 17.3% 21.5% 24.2%
Florida 14.1% 32.6% 27.3% 17.1% 8.9%
Georgia 14.8% 33.1% 24.4% 18.6% 9.0%
Hawaii 12.0% 31.0% 30.4% 17.8% 8.8%
Idaho 12.1% 31.5% 32.6% 17.4% 6.4%
Illinois 13.2% 33.3% 26.1% 17.4% 10.0%
Indiana 12.8% 40.8% 25.3% 13.4% 7.6%
Iowa 10.2% 35.8% 29.7% 17.3% 7.0%
Kansas 10.4% 28.6% 30.9% 20.0% 10.0%
Kentucky 18.2% 36.3% 24.5% 12.4% 8.6%
Louisiana 21.3% 35.4% 20.8% 15.6% 6.8%
Maine 12.9% 38.0% 24.8% 17.2% 7.1%
Maryland 12.6% 31.5% 20.7% 20.3% 14.9%
Massachusetts 13.1% 29.8% 20.4% 22.7% 14.1%
Michigan 12.1% 35.2% 28.4% 15.3% 9.1%
Minnesota 7.7% 28.3% 31.5% 21.8% 10.7%
Mississippi 17.0% 36.3% 26.6% 12.5% 7.7%
Missouri 12.1% 35.6% 24.2% 17.9% 10.2%
Montana 8.1% 36.6% 29.8% 18.3% 7.2%
Nebraska 8.7% 33.2% 33.2% 18.3% 6.6%
Nevada 13.7% 34.1% 27.7% 16.0% 8.5%
New Hampshire 9.2% 29.6% 25.7% 21.8% 13.6%
New Jersey 12.4% 34.0% 19.0% 23.1% 11.6%
New Mexico 17.1% 28.9% 28.9% 14.9% 10.1%
New York 14.6% 33.6% 21.2% 17.6% 13.0%
North Carolina 19.1% 32.3% 25.2% 16.4% 7.0%
— continued on the following page

The Investment Payoff 23
Less than high school
High school diploma
Some college (includes AS, AA,
Certifi cates)
Bachelor’s degree (BA,AB,BS)
Advanced (includes MA, MS, PhD, First
Professional)
North Dakota 10.5% 32.2% 32.1% 20.3% 4.8%
Ohio 11.9% 39.1% 24.4% 15.8% 8.8%
Oklahoma 14.8% 34.0% 28.2% 16.0% 6.9%
Oregon 12.6% 28.9% 32.6% 17.6% 8.3%
Pennsylvania 13.5% 42.8% 18.5% 16.2% 9.1%
Rhode Island 18.9% 32.3% 21.6% 17.8% 9.4%
South Carolina 16.4% 32.9% 25.8% 16.4% 8.5%
South Dakota 12.5% 32.8% 29.2% 18.7% 6.8%
Tennessee 17.1% 35.6% 23.0% 17.0% 7.3%
Texas 21.7% 27.8% 25.9% 17.3% 7.2%
Utah 9.0% 28.7% 31.5% 21.2% 9.6%
Vermont 9.2% 34.1% 22.5% 22.8% 11.4%
Virginia 11.6% 31.3% 24.0% 20.6% 12.5%
Washington 10.3% 27.5% 32.4% 20.2% 9.7%
West Virginia 19.1% 44.7% 20.9% 9.8% 5.5%
Wisconsin 11.2% 36.2% 27.0% 17.2% 8.4%
Wyoming 8.1% 34.2% 35.1% 16.3% 6.2%
NOTE: These categories refl ect the highest level of education attained and are therefore mutally exclusive.Source: U.S. Census Bureau, Current Population Survey (CPS), March 2004 Supplement (2004).
Table 1—Continued

24 The Investment Payoff
Table 2. Average total personal income of US population age 25 and older in the year 2003, by educational attainment and by state of residence.
Less than high school
High school diploma
Some college (includes
AS, AA, Certifi cates)
Bachelor’sdegree
(BA,AB,BS)
Advanced (includes MA, MS, PhD, First Professional)
Diff erence between those with a high
school diploma and a bachelor’s degree
Percentage diff erence between those with a
high school diploma and a bachelor’s degree
United States $15,221 $25,053 $32,470 $48,417 $70,851 $23,364 93.3%
Alabama 12,822 23,929 30,138 47,117 67,490 23,187 96.9%
Alaska 17,800 29,069 36,765 42,588 69,003 13,519 46.5%
Arizona 15,085 24,644 33,358 52,179 70,335 27,534 111.7%
Arkansas 12,509 21,719 30,146 53,646 56,909 31,928 147.0%
California 16,044 26,630 35,445 49,657 74,404 23,028 86.5%
Colorado 16,078 27,608 35,117 47,530 68,152 19,922 72.2%
Connecticut 17,380 28,866 38,709 56,211 78,626 27,345 94.7%
Delaware 17,413 28,157 34,272 51,721 64,159 23,565 83.7%
District of Columbia 14,240 23,389 33,177 55,780 87,048 32,391 138.5%
Florida 13,676 23,657 31,789 48,112 61,738 24,455 103.4%
Georgia 17,712 23,979 29,195 44,348 58,771 20,369 84.9%
Hawaii 14,476 24,803 35,433 46,157 65,539 21,353 86.1%
Idaho 16,548 27,440 27,861 40,533 64,058 13,093 47.7%
Illinois 14,644 25,083 33,963 47,385 72,207 22,302 88.9%
Indiana 16,545 25,389 32,239 47,967 69,206 22,578 88.9%
Iowa 17,044 26,777 31,598 43,266 53,650 16,489 61.6%
Kansas 14,760 25,434 29,905 43,414 62,292 17,980 70.7%
Kentucky 13,244 23,822 30,179 40,332 66,748 16,510 69.3%
Louisiana 13,357 24,771 29,065 42,059 52,628 17,287 69.8%
Maine 13,552 23,161 29,399 38,810 55,359 15,650 67.6%
Maryland 20,290 27,406 39,527 55,432 82,519 28,026 102.3%
Massachusetts 13,832 27,872 32,891 55,038 72,343 27,167 97.5%
Michigan 17,495 24,210 34,492 47,558 72,969 23,347 96.4%
Minnesota 19,723 27,635 35,248 50,788 78,715 23,154 83.8%
Mississippi 13,015 21,796 25,704 42,249 58,833 20,453 93.8%
Missouri 14,375 24,441 31,400 42,182 68,230 17,741 72.6%
Montana 17,844 21,111 26,147 35,622 53,756 14,511 68.7%
Nebraska 14,545 26,604 33,449 46,584 65,005 19,981 75.1%
Nevada 16,086 26,504 33,974 52,822 64,027 26,319 99.3%
New Hampshire 20,138 27,585 35,300 53,051 78,645 25,466 92.3%
New Jersey 16,300 29,842 36,406 54,567 85,378 24,725 82.9%
New Mexico 12,203 20,794 24,521 48,231 69,799 27,437 131.9%
New York 15,311 24,984 31,053 48,794 70,662 23,810 95.3%
— continued on the following page

The Investment Payoff 25
Less than high school
High school diploma
Some college (includes
AS, AA, Certifi cates)
Bachelor’sdegree
(BA,AB,BS)
Advanced (includes MA, MS, PhD, First Professional)
Diff erence between those with a high
school diploma and a bachelor’s degree
Percentage diff erence between those with a
high school diploma and a bachelor’s degree
North Carolina 13,903 23,463 28,950 46,720 76,198 23,258 99.1%
North Dakota 16,694 23,027 27,769 39,158 53,931 16,132 70.1%
Ohio 15,369 24,882 32,637 46,950 77,553 22,068 88.7%
Oklahoma 12,427 22,190 28,696 44,816 54,456 22,626 102.0%
Oregon 15,799 25,125 31,200 41,941 61,739 16,816 66.9%
Pennsylvania 14,845 24,422 33,545 51,162 70,546 26,740 109.5%
Rhode Island 14,622 26,620 35,320 49,086 67,586 22,465 84.4%
South Carolina 14,784 22,224 29,449 47,422 59,056 25,199 113.4%
South Dakota 14,458 24,286 29,148 39,725 69,830 15,439 63.6%
Tennessee 13,844 21,815 27,106 43,644 67,986 21,830 100.1%
Texas 13,919 23,712 32,212 49,167 76,746 25,455 107.3%
Utah 16,488 22,437 30,356 45,776 65,301 23,339 104.0%
Vermont 16,357 26,281 29,998 42,606 60,988 16,326 62.1%
Virginia 17,134 26,979 32,863 49,274 76,642 22,295 82.6%
Washington 18,913 25,968 32,318 48,325 64,190 22,358 86.1%
West Virginia 12,922 20,865 28,444 37,616 56,953 16,751 80.3%
Wisconsin 16,820 27,813 30,648 47,170 61,640 19,357 69.6%
Wyoming 25,092 25,407 29,272 37,599 61,572 12,192 48.0%
Source: U.S. Census Bureau, Current Population Survey (CPS), March 2004 Supplement (2004).
Table 2—Continued

26 The Investment Payoff
Table 3. Percentage of US population age 25 and older in the labor force who were not employed in March 2004, by educational attainment and by state of residence.
Less than high school
High school diploma
Some college (includes
AS, AA, Certifi cates)
Bachelor’sdegree
(BA,AB,BS)
Advanced (includes MA, MS, PhD, First
Professional)
Diff erence between those with a high
school diploma and a bachelor’s degree
Percentage diff erence between those with a
high school diploma and a bachelor’s degree
United States 10.2% 5.9% 4.8% 3.0% 2.6% -2.8 -48.1%
Alabama 8.8% 4.5% 5.0% 1.7% 0.0% -2.8 -62.3%
Alaska 17.3% 12.4% 5.3% 2.7% 1.4% -9.7 -78.3%
Arizona 7.0% 4.4% 3.8% 1.8% 2.9% -2.6 -58.6%
Arkansas 6.5% 5.3% 2.6% 1.9% 7.9% -3.4 -64.7%
California 12.0% 8.4% 5.3% 3.8% 3.9% -4.7 -55.3%
Colorado 6.9% 5.1% 4.2% 2.0% 2.0% -3.2 -61.2%
Connecticut 14.6% 5.2% 5.8% 3.1% 2.7% -2.1 -39.9%
Delaware 8.4% 5.3% 2.5% 3.2% 0.9% -2.1 -40.1%
District of Columbia 14.6% 9.7% 9.1% 2.3% 5.0% -7.4 -76.4%
Florida 6.9% 4.8% 4.8% 2.3% 2.7% -2.6 -53.3%
Georgia 4.5% 5.5% 2.6% 1.9% 0.5% -3.6 -65.9%
Hawaii 5.1% 4.5% 2.1% 1.5% 6.9% -3.1 -67.7%
Idaho 13.8% 5.6% 2.3% 3.3% 0.0% -2.3 -40.8%
Illinois 10.9% 6.6% 4.0% 4.1% 1.5% -2.5 -37.4%
Indiana 9.1% 4.7% 5.1% 1.9% 1.8% -2.8 -60.6%
Iowa 10.3% 4.1% 3.3% 1.0% 1.8% -3.1 -75.6%
Kansas 11.7% 6.1% 4.5% 2.0% 0.8% -4.1 -67.8%
Kentucky 4.3% 5.1% 6.2% 0.9% 0.7% -4.2 -82.2%
Louisiana 7.3% 5.9% 4.2% 4.9% 1.8% -1.0 -17.3%
Maine 11.5% 5.9% 3.0% 2.5% 1.1% -3.5 -58.6%
Maryland 8.4% 5.0% 2.9% 2.8% 2.3% -2.2 -44.0%
Massachusetts 6.8% 6.9% 5.5% 2.7% 3.1% -4.2 -61.2%
Michigan 20.3% 10.1% 5.5% 2.9% 3.8% -7.2 -71.4%
Minnesota 9.5% 5.6% 5.7% 2.9% 3.5% -2.6 -47.2%
Mississippi 6.0% 1.9% 3.8% 0.0% 0.0% -1.9 -100.0%
Missouri 15.4% 5.5% 4.8% 1.9% 3.2% -3.6 -65.3%
Montana 8.9% 7.3% 2.9% 3.4% 1.3% -3.9 -53.0%
Nebraska 4.9% 3.7% 3.4% 0.6% 1.5% -3.1 -82.6%
Nevada 6.6% 5.3% 3.6% 3.6% 2.8% -1.8 -33.3%
New Hampshire 6.1% 4.1% 3.9% 1.8% 3.0% -2.3 -55.5%
New Jersey 15.5% 3.9% 6.6% 3.5% 3.1% -0.4 -10.0%
New Mexico 9.2% 5.2% 5.3% 0.8% 0.8% -4.4 -84.7%
New York 12.2% 6.0% 7.0% 4.9% 3.8% -1.1 -18.0%
North Carolina 10.6% 4.8% 3.4% 2.3% 3.3% -2.6 -53.1%
North Dakota 9.4% 2.8% 4.5% 0.5% 0.0% -2.2 -80.2%
Ohio 13.8% 5.4% 4.9% 3.0% 1.8% -2.4 -44.4%
Oklahoma 5.3% 3.7% 3.4% 2.6% 2.5% -1.1 -30.5%
Oregon 18.0% 7.0% 6.5% 5.7% 4.0% -1.3 -18.6%
Pennsylvania 12.2% 6.4% 5.2% 3.3% 2.4% -3.1 -48.6%
— continued on the following page

The Investment Payoff 27
Less than high school
High school diploma
Some college (includes
AS, AA, Certifi cates)
Bachelor’sdegree
(BA,AB,BS)
Advanced (includes MA, MS, PhD, First
Professional)
Diff erence between those with a high
school diploma and a bachelor’s degree
Percentage diff erence between those with a
high school diploma and a bachelor’s degree
Rhode Island 11.5% 5.1% 3.8% 3.9% 5.4% -1.2 -23.9%
South Carolina 10.5% 7.7% 4.3% 3.0% 0.0% -4.7 -60.7%
South Dakota 16.6% 3.9% 2.7% 2.2% 2.8% -1.7 -44.6%
Tennessee 6.9% 4.3% 4.5% 1.4% 2.9% -2.9 -67.4%
Texas 8.2% 5.4% 5.0% 4.0% 1.8% -1.5 -27.1%
Utah 9.3% 4.0% 4.8% 1.9% 3.2% -2.2 -53.7%
Vermont 9.8% 4.8% 4.8% 1.7% 1.0% -3.2 -65.4%
Virginia 8.7% 4.4% 3.9% 3.2% 1.3% -1.2 -26.8%
Washington 12.5% 8.1% 6.2% 3.8% 2.1% -4.3 -53.1%
West Virginia 13.3% 6.7% 4.4% 0.0% 0.7% -6.7 -100.0%
Wisconsin 11.3% 7.6% 3.8% 2.6% 0.5% -5.1 -66.6%
Wyoming 10.8% 2.9% 3.8% 1.7% 0.0% -1.1 -39.1%
Source: U.S. Census Bureau, Current Population Survey (CPS), March 2004 Supplement (2004).
Table 3—Continued

28 The Investment Payoff
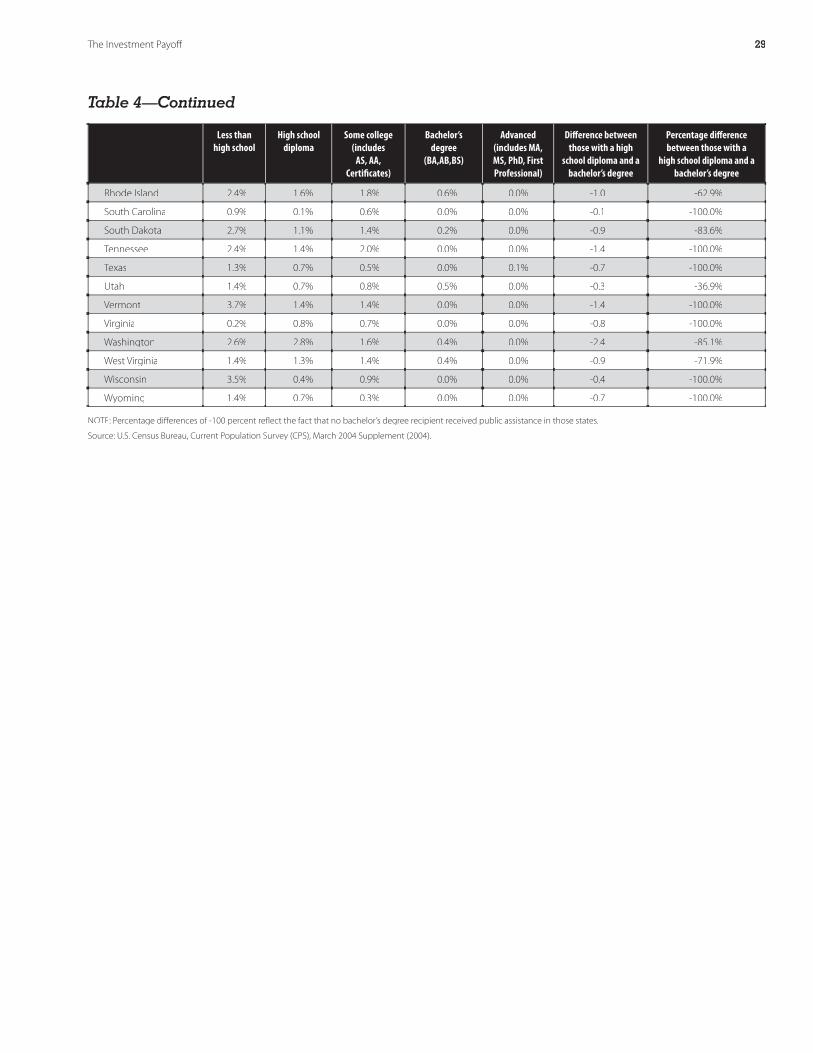
Table 4. Percentage of US population age 25 and older who received public assistance in the year 2003, by educational attainment and by state of residence.
Less than high school
High school diploma
Some college (includes
AS, AA, Certifi cates)
Bachelor’sdegree
(BA,AB,BS)
Advanced (includes MA, MS, PhD, First Professional)
Diff erence between those with a high
school diploma and a bachelor’s degree
Percentage diff erence between those with a
high school diploma and a bachelor’s degree
United States 2.1% 0.9% 0.9% 0.3% 0.1% -0.7 -72.0%
Alabama 1.5% 0.6% 0.6% 0.0% 0.0% -0.6 -100.0%
Alaska 5.3% 3.5% 3.4% 0.0% 0.0% -3.5 -100.0%
Arizona 3.2% 1.3% 0.1% 0.9% 0.0% -0.5 -34.6%
Arkansas 1.0% 0.3% 0.2% 0.0% 0.0% -0.3 -100.0%
California 3.6% 1.9% 1.1% 0.7% 0.2% -1.2 -61.6%
Colorado 2.4% 0.9% 0.8% 0.0% 0.0% -0.9 -100.0%
Connecticut 1.2% 1.1% 0.8% 1.0% 0.0% -0.2 -13.6%
Delaware 2.0% 0.5% 0.6% 0.0% 0.0% -0.5 -100.0%
District of Columbia 8.6% 2.6% 2.0% 0.0% 0.0% -2.6 -100.0%
Florida 1.0% 0.4% 0.3% 0.3% 0.0% -0.1 -16.7%
Georgia 0.4% 0.2% 0.5% 0.0% 0.8% -0.2 -100.0%
Hawaii 1.5% 0.5% 0.7% 0.5% 0.3% 0.0 1.5%
Idaho 1.7% 0.9% 1.1% 0.0% 0.9% -0.9 -100.0%
Illinois 1.3% 0.5% 0.5% 0.0% 0.3% -0.5 -100.0%
Indiana 1.6% 0.5% 1.1% 0.0% 0.0% -0.5 -100.0%
Iowa 2.5% 0.3% 0.4% 0.2% 0.0% -0.2 -53.6%
Kansas 1.7% 0.9% 2.1% 0.0% 0.0% -0.9 -100.0%
Kentucky 1.6% 0.5% 1.6% 0.0% 0.4% -0.5 -100.0%
Louisiana 0.9% 0.1% 0.2% 0.0% 0.0% -0.1 -100.0%
Maine 5.2% 2.1% 2.1% 0.8% 0.0% -1.4 -64.0%
Maryland 1.2% 0.7% 0.6% 0.3% 0.0% -0.4 -60.1%
Massachusetts 2.8% 0.7% 0.5% 0.3% 0.0% -0.4 -57.1%
Michigan 3.3% 1.5% 1.1% 0.8% 0.0% -0.7 -45.6%
Minnesota 1.8% 1.4% 1.9% 0.0% 0.0% -1.4 -100.0%
Mississippi 1.7% 0.0% 0.7% 0.0% 0.0% 0.0 0.0%
Missouri 2.3% 0.6% 0.4% 0.0% 0.5% -0.6 -100.0%
Montana 3.0% 0.8% 0.7% 0.0% 0.0% -0.8 -100.0%
Nebraska 2.6% 0.8% 1.0% 0.0% 0.0% -0.8 -100.0%
Nevada 0.2% 0.8% 0.2% 0.0% 0.0% -0.8 -100.0%
New Hampshire 2.6% 0.4% 0.8% 0.6% 0.0% 0.1 24.9%
New Jersey 1.2% 0.7% 0.5% 0.1% 0.0% -0.6 -82.9%
New Mexico 1.6% 1.3% 1.5% 1.8% 0.0% 0.4 32.0%
New York 3.7% 1.6% 1.3% 0.1% 0.2% -1.4 -90.9%
North Carolina 0.5% 0.7% 0.5% 0.3% 0.0% -0.4 -53.3%
North Dakota 2.7% 1.0% 1.5% 0.2% 0.0% -0.8 -80.1%
Ohio 2.9% 0.9% 0.8% 0.0% 0.0% -0.9 -100.0%
Oklahoma 3.7% 0.7% 1.1% 0.0% 0.0% -0.7 -100.0%
Oregon 0.8% 1.0% 0.7% 0.2% 0.0% -0.8 -78.4%
Pennsylvania 2.8% 0.8% 0.9% 0.3% 0.0% -0.5 -61.5%
— continued on the following page
The Investment Payoff 29
Less than high school
High school diploma
Some college (includes
AS, AA, Certifi cates)
Bachelor’sdegree
(BA,AB,BS)
Advanced (includes MA, MS, PhD, First Professional)
Diff erence between those with a high
school diploma and a bachelor’s degree
Percentage diff erence between those with a
high school diploma and a bachelor’s degree
Rhode Island 2.4% 1.6% 1.8% 0.6% 0.0% -1.0 -62.9%
South Carolina 0.9% 0.1% 0.6% 0.0% 0.0% -0.1 -100.0%
South Dakota 2.7% 1.1% 1.4% 0.2% 0.0% -0.9 -83.6%
Tennessee 2.4% 1.4% 2.0% 0.0% 0.0% -1.4 -100.0%
Texas 1.3% 0.7% 0.5% 0.0% 0.1% -0.7 -100.0%
Utah 1.4% 0.7% 0.8% 0.5% 0.0% -0.3 -36.9%
Vermont 3.7% 1.4% 1.4% 0.0% 0.0% -1.4 -100.0%
Virginia 0.2% 0.8% 0.7% 0.0% 0.0% -0.8 -100.0%
Washington 2.6% 2.8% 1.6% 0.4% 0.0% -2.4 -85.1%
West Virginia 1.4% 1.3% 1.4% 0.4% 0.0% -0.9 -71.9%
Wisconsin 3.5% 0.4% 0.9% 0.0% 0.0% -0.4 -100.0%
Wyoming 1.4% 0.7% 0.3% 0.0% 0.0% -0.7 -100.0%
NOTE: Percentage diff erences of -100 percent refl ect the fact that no bachelor’s degree recipient received public assistance in those states.
Source: U.S. Census Bureau, Current Population Survey (CPS), March 2004 Supplement (2004).
Table 4—Continued

30 The Investment Payoff
Table 5. Percentage of US population age 25 and older who described their health as good, very good or excellent in March 2004, by educational attainment and by state of residence.
Less than high school
High school diploma
Some college (includes
AS, AA, Certifi cates)
Bachelor’sdegree
(BA,AB,BS)
Advanced (includes MA, MS, PhD, First Professional)
Diff erence between those with a high
school diploma and a bachelor’s degree
Percentage diff erence between those with a
high school diploma and a bachelor’s degree
United States 67.3% 82.0% 87.2% 92.6% 92.5% 10.6 12.9%
Alabama 49.4% 71.9% 87.3% 94.8% 93.0% 22.9 31.8%
Alaska 69.8% 84.0% 86.4% 91.7% 91.2% 7.7 9.1%
Arizona 78.9% 84.8% 86.5% 89.3% 91.6% 4.5 5.3%
Arkansas 49.3% 72.5% 77.9% 91.0% 83.5% 18.5 25.5%
California 75.2% 82.7% 87.2% 91.6% 93.4% 8.9 11%
Colorado 80.4% 86.3% 89.0% 94.9% 94.8% 8.6 9.9%
Connecticut 65.8% 85.7% 89.4% 93.2% 92.8% 7.4 8.7%
Delaware 66.1% 85.1% 82.4% 92.2% 92.0% 7.1 8.3%
District of Columbia 65.4% 78.1% 86.3% 94.7% 94.0% 16.6 21.2%
Florida 69.4% 80.9% 87.1% 91.6% 91.2% 10.8 13.3%
Georgia 65.9% 81.8% 87.3% 92.2% 95.2% 10.4 12.7%
Hawaii 64.3% 82.1% 90.1% 90.2% 88.6% 8.1 9.9%
Idaho 71.8% 84.1% 87.5% 91.4% 97.4% 7.3 8.7%
Illinois 66.0% 81.9% 89.0% 93.7% 92.8% 11.7 14.3%
Indiana 60.6% 84.0% 87.9% 93.6% 88.7% 9.5 11.4%
Iowa 74.0% 85.0% 90.1% 95.5% 91.6% 10.6 12.5%
Kansas 68.2% 82.0% 86.8% 95.2% 95.1% 13.2 16.1%
Kentucky 50.1% 78.6% 82.1% 86.6% 93.0% 8.0 10%
Louisiana 65.0% 79.5% 86.8% 90.9% 87.1% 11.4 14.4%
Maine 58.0% 80.5% 85.6% 94.9% 92.3% 14.4 17.9%
Maryland 66.7% 84.3% 88.5% 92.8% 90.9% 8.4 10.0%
Massachusetts 69.4% 85.8% 90.0% 92.6% 95.3% 6.8 7.9%
Michigan 61.6% 80.6% 88.2% 92.7% 92.5% 12.1 15.0%
Minnesota 74.9% 84.0% 90.7% 96.7% 96.1% 13.1 15.7%
Mississippi 48.8% 79.7% 81.5% 93.2% 92.0% 13.5 16.9%
Missouri 64.3% 80.6% 86.2% 92.4% 91.0% 11.8 14.6%
Montana 57.9% 76.4% 89.8% 90.9% 91.4% 14.4 18.9%
Nebraska 69.9% 85.7% 88.2% 93.1% 96.7% 7.5 8.7%
Nevada 83.7% 83.8% 87.8% 93.9% 89.4% 10.1 12.1%
New Hampshire 75.6% 88.2% 88.5% 94.2% 93.4% 6.0 6.8%
New Jersey 74.5% 86.5% 90.5% 94.6% 94.0% 8.1 9.3%
New Mexico 66.2% 82.2% 85.0% 91.1% 90.7% 8.9 11%
New York 67.9% 82.1% 87.2% 91.0% 91.7% 8.9 10.8%
North Carolina 60.0% 81.7% 85.9% 94.0% 94.1% 12.3 15.1%
North Dakota 65.2% 86.0% 91.0% 94.3% 95.9% 8.3 9.6%
Ohio 66.1% 84.0% 87.2% 93.4% 94.4% 9.5 11.3%
Oklahoma 55.7% 80.3% 87.0% 89.8% 88.1% 9.5 11.8%
Oregon 71.2% 82.5% 89.8% 93.8% 89.4% 11.2 13.6%
Pennsylvania 63.6% 82.7% 87.7% 93.0% 93.6% 10.3 12.5%
Rhode Island 71.0% 86.0% 88.2% 96.0% 93.8% 9.7 11.2%
— continued on the following page

The Investment Payoff 31
Less than high school
High school diploma
Some college (includes
AS, AA, Certifi cates)
Bachelor’sdegree
(BA,AB,BS)
Advanced (includes MA, MS, PhD, First Professional)
Diff erence between those with a high
school diploma and a bachelor’s degree
Percentage diff erence between those with a
high school diploma and a bachelor’s degree
South Carolina 52.2% 75.3% 85.8% 90.1% 92.3% 14.8 19.6%
South Dakota 61.2% 85.0% 90.1% 94.2% 96.6% 9.2 11%
Tennessee 62.0% 76.6% 81.9% 92.6% 89.7% 16.0 20.9%
Texas 71.6% 81.0% 85.9% 91.3% 91.7% 10.3 12.8%
Utah 74.8% 81.0% 89.6% 96.3% 96.3% 15.1 18.6%
Vermont 62.4% 84.8% 89.6% 93.1% 94.8% 8.3 9.8%
Virginia 63.5% 84.0% 85.7% 95.3% 91.2% 10.9 12.9%
Washington 68.8% 79.8% 87.4% 92.9% 87.7% 13.1 16.4%
West Virginia 45.3% 76.3% 83.6% 84.8% 82.6% 8.4 11.1%
Wisconsin 73.2% 87.1% 88.6% 94.9% 93.7% 7.8 8.9%
Wyoming 68.7% 84.1% 88.1% 92.8% 92.6% 8.7 10%
Source: U.S. Census Bureau, Current Population Survey (CPS), March 2004 Supplement (2004).
Table 5—Continued

32 The Investment Payoff
Table 6. Percentage of US population age 25 and older who reported ever volunteering for or through an organization in September 2004, by educational attainment and state.
Less than high school
High school diploma
Some college (includes AS, AA,
Certifi cates)
Bachelor’s degree (BA, AB, BS) and higher (MA, MS, PhD, First Professional)
Diff erence between those with a high school diploma and a bachelor’s
degree or higher
Percentage diff erence between those with a high school diploma and a bachelor’s
degree or higher
United States 11.8% 20.8% 31.0% 36.1% 15.3 73.3%
Alabama 9.1% 17.4% 27.5% 41.4% 24.0 137.5%
Alaska 14.7% 23.7% 42.1% 55.9% 32.1 135.4%
Arizona 13.6% 23.8% 37.1% 41.2% 17.3 72.8%
Arkansas 5.7% 18.3% 27.4% 30.2% 11.9 65.2%
California 9.6% 15.5% 31.2% 35.6% 20.1 129.9%
Colorado 7.1% 24.3% 35.7% 42.6% 18.3 75.3%
Connecticut 8.4% 27.4% 37.2% 40.2% 12.8 46.9%
Delaware 16.9% 22.2% 28.1% 30.2% 7.9 35.7%
District of Columbia 11.0% 15.9% 20.5% 49.8% 33.9 212.7%
Florida 13.4% 22.9% 29.9% 29.4% 6.5 28.6%
Georgia 12.0% 14.6% 19.2% 27.8% 13.2 90.3%
Hawaii 12.4% 13.7% 24.0% 23.7% 10.0 73.0%
Idaho 11.5% 24.9% 32.5% 48.2% 23.3 93.4%
Illinois 13.5% 18.2% 27.6% 31.5% 13.3 73.4%
Indiana 9.8% 21.6% 27.8% 36.5% 14.9 69.2%
Iowa 24.3% 30.5% 42.3% 55.5% 24.9 81.8%
Kansas 19.4% 24.5% 40.7% 48.2% 23.8 97.2%
Kentucky 13.1% 19.7% 32.1% 45.2% 25.5 129.1%
Louisiana 9.4% 15.0% 24.7% 20.2% 5.2 34.6%
Maine 16.9% 24.5% 43.7% 46.7% 22.2 90.7%
Maryland 11.5% 24.4% 35.6% 38.5% 14.1 57.9%
Massachusetts 11.2% 20.9% 30.4% 35.6% 14.7 70.5%
Michigan 16.1% 25.2% 36.3% 44.6% 19.4 76.9%
Minnesota 22.4% 29.9% 41.6% 42.2% 12.3 41.3%
Mississippi 8.0% 7.9% 15.8% 23.5% 15.6 199.1%
Missouri 14.4% 22.9% 33.0% 52.2% 29.4 128.5%
Montana 33.7% 28.3% 42.1% 44.7% 16.5 58.2%
Nebraska 21.6% 28.5% 43.7% 48.7% 20.2 70.8%
Nevada 9.6% 18.5% 30.7% 33.9% 15.4 83.0%
New Hampshire 25.1% 32.4% 44.6% 45.9% 13.5 41.8%
New Jersey 10.4% 16.8% 24.2% 35.7% 18.9 112.2%
New Mexico 15.4% 24.9% 32.1% 38.7% 13.8 55.5%
New York 7.3% 16.4% 22.2% 24.8% 8.4 50.8%
North Carolina 12.4% 20.0% 34.2% 40.8% 20.7 103.3%
North Dakota 23.9% 31.0% 34.0% 46.7% 15.8 50.9%
Ohio 21.0% 25.5% 32.6% 36.5% 11.0 42.9%
Oklahoma 14.1% 21.8% 23.5% 29.4% 7.6 34.9%
Oregon 14.1% 25.9% 43.0% 47.8% 21.9 84.4%
Pennsylvania 18.2% 22.7% 36.5% 41.2% 18.6 81.9%
Rhode Island 10.7% 17.7% 31.5% 35.9% 18.2 103.1%
— continued on the following page

The Investment Payoff 33
Less than high school
High school diploma
Some college (includes AS, AA,
Certifi cates)
Bachelor’s degree (BA, AB, BS) and higher (MA, MS, PhD, First Professional)
Diff erence between those with a high school diploma and a bachelor’s
degree or higher
Percentage diff erence between those with a high school diploma and a bachelor’s
degree or higher
South Carolina 13.9% 18.4% 26.7% 38.0% 19.6 106.3%
South Dakota 18.7% 24.4% 29.8% 34.7% 10.3 42.2%
Tennessee 7.4% 15.5% 19.7% 26.0% 10.5 67.7%
Texas 8.7% 21.6% 32.6% 38.0% 16.4 76.0%
Utah 16.2% 30.8% 38.0% 41.7% 10.9 35.4%
Vermont 14.7% 29.7% 42.9% 52.4% 22.7 76.4%
Virginia 7.4% 15.1% 23.5% 34.8% 19.7 130.8%
Washington 19.5% 35.4% 40.7% 47.8% 12.4 35.1%
West Virginia 7.7% 16.1% 20.4% 24.0% 7.9 49.3%
Wisconsin 15.0% 26.0% 32.7% 46.5% 20.4 78.5%
Wyoming 29.3% 37.5% 47.1% 57.5% 20.0 53.4%
NOTE: As the CPS supplement does not provide a comparable educational attainment variable, bachelor’s degrees and advanced degrees are grouped.
Source: U.S. Census Bureau, Current Population Survey (CPS), Volunteer Supplement (September 2004).
Table 6—Continued

34 The Investment Payoff
Table 7. Percentage of US population age 25 and older who voted in the November 2000 election, by educational attainment and by state of residence.
Less than high school
High school diploma
Some college (includes
AS, AA, Certifi cates)
Bachelor’sdegree
(BA,AB,BS)
Advanced (includes MA, MS, PhD, First
Professional)
Diff erence between those with a high
school diploma and a bachelor’s degree
Percentage diff erence between those with a
high school diploma and a bachelor’s degree
United States 42.1% 56.0% 67.3% 76.3% 82.1% 20.2 36.1%
Alabama 43.2% 59.2% 69.4% 81.7% 90.9% 22.5 38.1%
Alaska 51.8% 61.3% 75.4% 82.3% 86.0% 21.0 34.2%
Arizona 32.5% 47.3% 59.3% 72.9% 79.4% 25.7 54.3%
Arkansas 34.6% 47.3% 63.7% 64.5% 75.8% 17.1 36.2%
California 40.9% 51.5% 64.0% 71.7% 80.1% 20.2 39.2%
Colorado 20.7% 50.0% 62.8% 76.9% 87.2% 26.9 53.9%
Connecticut 50.1% 50.2% 64.5% 70.6% 81.3% 20.4 40.7%
Delaware 43.3% 59.9% 72.5% 83.0% 87.1% 23.1 38.7%
District of Columbia 66.0% 65.3% 83.8% 82.3% 81.0% 17.1 26.2%
Florida 41.0% 57.3% 66.5% 76.9% 79.3% 19.6 34.2%
Georgia 38.6% 48.4% 61.2% 63.4% 66.2% 15.0 31.0%
Hawaii 29.7% 36.4% 50.2% 64.6% 71.2% 28.2 77.7%
Idaho 38.4% 51.8% 65.2% 72.4% 81.0% 20.7 39.9%
Illinois 49.8% 58.3% 70.8% 74.9% 78.3% 16.6 28.5%
Indiana 44.8% 56.8% 65.2% 77.7% 88.6% 20.9 36.7%
Iowa 53.8% 60.8% 73.2% 87.8% 90.1% 27.0 44.3%
Kansas 52.1% 54.9% 67.9% 79.3% 85.6% 24.4 44.3%
Kentucky 31.4% 56.6% 68.0% 76.4% 83.7% 19.8 34.9%
Louisiana 52.9% 63.7% 75.5% 84.9% 85.4% 21.3 33.4%
Maine 56.1% 64.1% 79.1% 87.2% 93.0% 23.1 36.0%
Maryland 42.0% 54.0% 67.6% 80.1% 83.3% 26.0 48.2%
Massachusetts 47.9% 65.9% 71.9% 74.0% 78.2% 8.1 12.3%
Michigan 42.0% 57.6% 75.0% 79.7% 84.9% 22.1 38.4%
Minnesota 51.5% 69.9% 71.8% 85.7% 84.6% 15.8 22.6%
Mississippi 51.6% 62.8% 67.5% 72.6% 71.1% 9.8 15.6%
Missouri 56.0% 65.8% 78.1% 82.4% 84.2% 16.7 25.4%
Montana 45.7% 58.3% 70.9% 81.7% 78.6% 23.4 40.2%
Nebraska 54.9% 59.3% 61.7% 81.5% 87.8% 22.2 37.4%
Nevada 40.3% 46.9% 57.8% 68.2% 71.2% 21.3 45.4%
New Hampshire 37.6% 62.9% 75.5% 85.4% 88.5% 22.5 35.8%
New Jersey 48.6% 57.4% 69.7% 75.1% 81.6% 17.8 31.0%
New Mexico 44.8% 51.8% 62.0% 76.4% 77.2% 24.6 47.4%
New York 46.2% 55.4% 64.9% 74.7% 80.5% 19.3 34.9%
North Carolina 35.5% 51.5% 70.8% 77.3% 84.3% 25.8 50.2%
North Dakota 57.6% 64.3% 73.8% 86.2% 92.6% 21.9 34.1%
Ohio 37.3% 55.8% 69.1% 78.3% 83.6% 22.5 40.3%
Oklahoma 37.9% 56.3% 69.4% 75.4% 86.3% 19.0 33.8%
Oregon 43.5% 60.4% 72.5% 82.1% 87.8% 21.7 35.8%
Pennsylvania 38.8% 55.9% 66.7% 74.6% 84.8% 18.8 33.6%
Rhode Island 45.3% 61.4% 66.6% 78.0% 84.7% 16.6 27.1%
— continued on the following page

The Investment Payoff 35
Less than high school
High school diploma
Some college (includes
AS, AA, Certifi cates)
Bachelor’sdegree
(BA,AB,BS)
Advanced (includes MA, MS, PhD, First
Professional)
Diff erence between those with a high
school diploma and a bachelor’s degree
Percentage diff erence between those with a
high school diploma and a bachelor’s degree
South Carolina 44.6% 60.1% 63.8% 79.0% 84.4% 19.0 31.6%
South Dakota 46.5% 58.3% 71.2% 77.8% 76.4% 19.6 33.5%
Tennessee 41.8% 54.0% 66.8% 70.3% 79.4% 16.3 30.3%
Texas 35.7% 51.4% 61.0% 77.7% 81.6% 26.3 51.2%
Utah 39.1% 51.7% 69.4% 76.3% 80.2% 24.6 47.6%
Vermont 37.2% 62.3% 70.0% 86.6% 92.1% 24.3 39.0%
Virginia 29.7% 53.4% 67.5% 75.6% 86.0% 22.3 41.7%
Washington 44.1% 59.6% 64.1% 77.8% 89.3% 18.3 30.6%
West Virginia 34.3% 50.7% 65.2% 75.8% 87.5% 25.1 49.5%
Wisconsin 63.2% 62.6% 78.3% 87.5% 89.0% 25.0 39.9%
Wyoming 38.7% 57.6% 72.7% 83.5% 86.3% 26.0 45.1%
Source: U.S. Census Bureau, Current Population Survey (CPS), Voting and Registration Supplement (November 2000).
Table 7—Continued


www.ihep.org