traffic review 2019 - schiphol
TRANSCRIPT

Traffi c review2019
Welcome to Amsterdam Airport

2
Contents
Summary 3
Figures by continent 6
Graphs 7
Air transport movements 8
Monthly and annual totals 10
Per hour of the day 12
Punctuality of passenger services 13
Average take off weight 13
Main countries 14
Origins and destinations European 16
Origins and destinations Intercontinental 17
Per aircraft type 18
Main airlines 19
New airlines 20
Passengers 21
Figures by month 23
Figures by continent 24
Figures by country 25
Figures by airport 26
Passenger profile 27
Cargo 28
Figures by month 30
Figures by continent 31
Figures by year 32
Figures by airport 33
Other airports 34
Other Airports 36
Infrastructure 37
Runways 39
Summarypage 3
Air transportmovements
page 8
Passengerspage 21
Cargopage 28
Other airportspage 34
Infrastructurepage 37

Summary
Contents Summary Air transport movements Passengers Cargo Other airports Infrastructure 3

Contents Summary Air transport movements Passengers Cargo Other airports Infrastructure 4
Highlights
332direct destinations
Growth: + 5
A102airlines
Growth: - 6
496,826air transport movements
Growth: - 0.5%
71.7million passengers
Growth: + 0.9%
36.1%transfer passengers
Growth: - 0.5% point
1.57million tonnes of cargo
Growth: - 8.5%

Contents Summary Air transport movements Passengers Cargo Other airports Infrastructure 5
Figures by segment
JAir transport movements
2019Compared to
2018 in %
Air transport movements (excl.
general aviation) 496,826 -0.5%
scheduled services 489,876 0.6%
non-scheduled services 6,950 -44.4%
passenger services 482,670 -0.2%
full freighter services 14,156 -11.2%
General Aviation 18,985 3.8%
Total air transport movements (incl.
general aviation) 515,811 -0.4%
Passenger transport
2019Compared to
2018 in %
Passenger transport (incl. transit-
direct 1x) 71,706,999 0.9%
scheduled services 71,118,854 2.3%
non-scheduled services 588,145 -62.2%
domestic 643 -33.7%
europe 50,542,563 1.1%
intercontinental 21,163,793 0.5%
transit-direct 26,665 -72.4%
Passenger transport (excl. transit-
direct) 71,680,334 1.0%
Cargo transport
2019Compared to
2018 in %
Cargo transport (tonnes) 1,570,261 -8.5%
inbound 791,613 -9.8%
outbound 778,648 -7.2%
passenger aircraft services 721,072 -2.3%
full freighter services 849,189 -13.2%
Mail transport (tonnes) 21,960 2.2%

Contents Summary Air transport movements Passengers Cargo Other airports Infrastructure 6
Figures by continent
Air transport movements Compared to 2018 in % Passengers (incl. transit-direct) Compared to 2018 in % Cargo (tonnes) Compared to 2018 in %
E.U.1 345,708 0.0% 42,703,875 1.3% 65,605 7.6%
Rest of Europe 58,916 -2.6% 7,839,331 -0.1% 160,510 -9.8%
Total of Europe 404,624 -0.4% 50,543,206 1.1% 226,115 -5.3%
North America 30,990 4.2% 7,617,265 4.4% 276,621 -7.5%
Mid./South America 12,774 1.6% 3,401,523 1.4% 191,665 -9.4%
Africa 14,325 -4.5% 2,872,100 -2.8% 148,106 -10.7%
Middle East 12,596 1.7% 2,573,479 5.8% 199,267 0.0%
Far East 21,517 -8.4% 4,699,426 -6.5% 528,487 -12.2%
Total of Intercontinental 92,202 -1.1% 21,163,793 0.5% 1,344,146 -9.0%
Grand total 496,826 -0.5% 71,706,999 0.9% 1,570,261 -8.5%
1 The 28 official members of the European Union

Contents Summary Air transport movements Passengers Cargo Other airports Infrastructure 7
Air transport movements
x 1.000
386.4386.4
420.3420.3 423.5423.5 425.6425.6438.3438.3
450.7450.7
478.9478.9
496.7496.7 499.4499.4 496.8496.8
2010 2011 2012 2013 2014 2015 2016 2017 2018 2019
350
400
450
500
550
Passenger transport
in millions
45.245.2
49.849.8 51.051.052.652.6
55.055.0
58.358.3
63.663.6
68.568.571.171.1 71.771.7
2010 2011 2012 2013 2014 2015 2016 2017 2018 2019
40
50
60
70
80
Cargo transport
in million tonnes
1.511.51 1.521.52
1.481.48
1.531.53
1.631.63 1.621.62
1.671.67
1.761.761.721.72
1.571.57
2010 2011 2012 2013 2014 2015 2016 2017 2018 2019
1.4
1.5
1.6
1.7
1.8

Air transport movements
Contents Summary Air transport movements Passengers Cargo Other airports Infrastructure 8

Contents Summary Air transport movements Passengers Cargo Other airports Infrastructure 9
Highlights
J496,826air transport movements
Growth: - 0.5%
>97.2%passengers movements
Growth: + 0.4% point
g2.8%full freighter movements
Growth: - 0.4% point

Contents Summary Air transport movements Passengers Cargo Other airports Infrastructure 10
Monthly and annual totals
Monthly totals
January February March April May June July August September October November December
I. Air transport
Scheduled
Passenger services 35,761 33,831 38,218 40,303 42,846 41,656 42,871 43,196 42,199 42,628 36,420 37,167
Full-freighter services 1,016 937 1,186 1,022 1,091 1,005 1,035 1,069 1,119 1,224 1,088 988
Subtotal 36,777 34,768 39,404 41,325 43,937 42,661 43,906 44,265 43,318 43,852 37,508 38,155
Non-scheduled
Passenger services 298 303 270 465 636 582 701 732 667 535 202 183
Full-freighter services 110 124 111 102 134 100 129 125 146 116 92 87
Subtotal 408 427 381 567 770 682 830 857 813 651 294 270
Total air transport 37,185 35,195 39,785 41,892 44,707 43,343 44,736 45,122 44,131 44,503 37,802 38,425
II. General aviation
Taxi / Business / Private 699 754 827 941 1,174 1,248 1,043 878 1,048 981 849 718
Other flights 640 617 670 707 630 658 649 662 579 706 671 636
Total general aviation 1,339 1,371 1,497 1,648 1,804 1,906 1,692 1,540 1,627 1,687 1,520 1,354
Grand total 38,524 36,566 41,282 43,540 46,511 45,249 46,428 46,662 45,758 46,190 39,322 39,779

Contents Summary Air transport movements Passengers Cargo Other airports Infrastructure 11
Annual totals
2019Compared to
2018 in %
I. Air transport
Scheduled
Passenger services 477,096 + 1.0
Full-freighter services 12,780 - 12.4
Subtotal 489,876 + 0.6
Non-scheduled
Passenger services 5,574 - 50.1
Full-freighter services 1,376 + 2.0
Subtotal 6,950 - 44.4
Total air transport 496,826 - 0.5
II. General aviation
Taxi / Business / Private 11,160 + 2.8
Other flights 7,825 + 5.2
Total general aviation 18,985 + 3.8
Grand total 515,811 - 0.4
Air transportmovements
2019
96%96%
4%4%
Commercial aviation
General aviation
Air transport movements:Commercial aviation
2019
97%97%
3%3%
Passenger services
Full-freighter services

Contents Summary Air transport movements Passengers Cargo Other airports Infrastructure 12
Per hour of the day
Landings Take-offs Total
Night 23:00-05:59 15,102 4,250 19,352
Early morning 06:00-06:59 5,573 4,953 10,526
Day 07:00-18:59 175,234 183,611 358,845
Evening 19:00-22:59 52,500 55,603 108,103
Total 248,409 248,417 496,826
x 1.000
3.1 1.80.8 0.4
1.23.9 5.6 16.2 22.7 13.1 12.6 17.2 12.3 16.9 10.6 19.6 10.5 9.4 14.2 22.6 12.1 8.9 8.8 3.9
0.5 0.2 0.2 0.1 0.11.4
5.0
15.0
10.5
16.3
21.4
12.8
19.8
14.716.6
13.6
16.7 16.9
9.4 9.3
12.7
24.0
9.5
1.7
Landings
Take-offs
0 1 2 3 4 5 6 7 8 9 10 11 12 13 14 15 16 17 18 19 20 21 22 23
30.0
20.0
10.0
0.0
10.0
20.0
30.0

Contents Summary Air transport movements Passengers Cargo Other airports Infrastructure 13
Punctuality of passenger services
Annual average in %
81.781.7
85.185.186.186.1
87.687.686.186.1
83.783.7 83.883.8
79.079.0
81.981.9
76.576.5
72.872.8
78.878.8
81.281.281.981.9
79.079.0
76.876.875.575.5
68.568.5
70.770.7
66.466.4
Arrivals
Departures
2010 2011 2012 2013 2014 2015 2016 2017 2018 2019
65
70
75
80
85
90
Average take off weight
2019 Compared to 2018 in %
Passenger or mixed version 95.9 0.5%
Full-freighter version 333.3 -1.2%
Total air transport movements 102.7 -0.5%

Contents Summary Air transport movements Passengers Cargo Other airports Infrastructure 14
Main countries
Main European countries
Ranking(2018ranking) Country Total movements
Compared to2018 in %
1 (1) Great Britain 93,287 0.5%
2 (2) Germany 44,975 -0.9%
3 (3) Spain 36,485 -2.7%
4 (4) Italy 32,750 1.9%
5 (5) France 30,013 -0.2%
6 (6) Norway 18,171 -0.1%
7 (7) Switzerland 17,620 -2.6%
8 (8) Denmark 14,542 -1.1%
9 (9) Sweden 12,359 -0.5%
10 (10) Turkey 11,951 0.8%
11 (11) Portugal 10,601 -3.1%
12 (12) Greece 10,343 -2.5%
13 (13) Ireland 10,255 -1.4%
14 (14) Poland 9,369 16.5%
15 (15) Austria 8,667 16.3%
16 (16) Czech Republic 5,562 0.3%
17 (17) Russia 5,222 -1.1%
18 (18) Finland 4,730 -5.0%
19 (19) Belgium 3,641 1.8%
20 (20) Romania 3,310 -0.4%
Rest of Europe 20,397 -9.8%
Total of Europe 404,250 -0.4%
Main Intercontinental countries
Ranking(2018ranking) Country Total movements
Compared to2018 in %
1 (1) United States of America 26627 6.8%
2 (2) China 10069 -5.2%
3 (4) United Arab Emirates 4777 0.4%
4 (3) Canada 4363 -9.6%
5 (5) Morocco 3701 1.7%
6 (6) Israel 3636 4.7%
7 (10) Netherlands Antilles 2353 8.4%
8 (12) Brasil 2228 13.6%
9 (9) Egypt 2108 -2.9%
10 (8) Kenya 2080 -7.2%
11 (11) Indonesia 2068 -1.0%
12 (13) Japan 2003 18.5%
13 (7) India 1820 -43.9%
14 (13) South Africa 1729 2.2%
15 (15) Mexico 1661 1.8%
16 (16) South Korea 1540 -0.1%
17 (17) Qatar 1453 -0.2%
18 (18) Ecuador 1145 -12.5%
19 (19) Singapore 1054 -10.2%
20 (21) Surinam 943 10.2%
Rest of Intercontinental 14844 -4.9%
Total of Intercontinental 92202 -1.1%

Contents Summary Air transport movements Passengers Cargo Other airports Infrastructure 15
Intercontinental
Total movementsCompared to
2018 in %
North America 30990 4.2%
Asia 21517 -8.4%
Africa 14325 -4.5%
Latin America 12774 1.6%
Middle East 12596 1.7%
Total of Intercontinental 92202 -1.1%

Total scheduled destinations Europe
194
Albania 1Spain 19
Austria 4
Croatia 4Switzerland 3
Italy 17Azerbaijan 1
Georgia 1
Belarus 1
Ukraine 1
Hungary 1
Czech Republic 1
Serbia 1
Slovenia 1 Romania 1
Bulgaria 3
Belgium 2Luxembourg 1
Ireland 2
Iceland 1
Norway 8
Sweden 4
Finland 5
Russia 6
Turkey 11
Malta 1 Cyprus 3Greece 20
Macedonia 1
Germany 12
Poland 5
Estonia 1
Latvia 1
Lithuania 1Denmark 3
France 14
United Kingdom 26
Portugal 6
Contents Summary Air transport movements Passengers Cargo Other airports Infrastructure 16
Origins and destinations European
Main European origins and destinations
Ranking(2018
ranking) AirportAir transportmovements
Compared to2018 in %
1 (1) London Heathrow 13,265 1.3
2 (2) Dublin 9,127 -1.7
3 (7) London City 8,998 7.6
4 (4) Paris de Gaulle 8,783 1.1
5 (6) Copenhagen 8,465 -0.1
6 (8) Manchester 8,421 0.9
7 (5) Barcelona 8,344 -1.6
8 (3) Munich 8,324 -9.3
9 (9) Frankfurt 8,183 0.9
10 (10) Zurich 7,450 -3.8
11 (11) London Gatwick 7,390 1.1
12 (20) Vienna 7,002 20.3
13 (12) Birmingham 6,882 -5.5
14 (16) Milan Malpensa 6,858 13.7
15 (14) Madrid 6,729 1.2
16 (13) Rome 6,664 -1.7
17 (15) Stockholm 6,100 -0.9
18 (17) Oslo 6,028 0.1
19 (19) Geneva 5,939 1.5
20 (18) Lisbon 5,931 -0.1

Total scheduled destinations Intercontinental
138
Latin America 29
Bahrain 1 Iran 1 Israel 3 Jordan 1 Kuwait 1Lebanon 1 Oman 1 Qatar 1 Saudi Arabia 3 United Arab Emirates 4
Canada 5 USA 22
Argentina 1 Aruba 1 Brazil 5 Chili 1 Colombia 2 Costa Rica 2 Cuba 3 Dominican Republic 1 Ecuador 2 Guatemala 1 Jamaica 1 Mexico 2 Netherlands Antilles 3 Panama 1 Peru 1 Puerto Rico 1 Suriname 1
Angola 1 Cape Verde Islands 4 Egypt 3 Gambia 1 Ghana 1
Senegal 1 South Africa 3 Tanzania 3 Tunesia 2 Uganda 1 Zambia 1Zimbabwe 1
Kenya 2 Mauritius 1 Morocco 8 Namibia 1 Nigeria 1 Rwanda 1
China 12 India 4 Indonesia 3 Japan 2 Kazakhstan 1 Malaysia 1 Philippines 1 Singapore 1 South Korea 1 Sri Lanka 1 Taiwan 1 Thailand 1
North America 27
Africa 36
Middle East 17
Asia 29
Contents Summary Air transport movements Passengers Cargo Other airports Infrastructure 17
Origins and destinations Intercontinental
Main Intercontinental origins/destinations
Ranking(2018
ranking) AirportAir transportmovements
Compared to2018 in %
1 (2) New York JFK 4,045 13.3
2 (1) Shanghai 3,767 -8.4
3 (3) Tel Aviv 3,558 3.4
4 (6) Dubai International 2,905 17.8
5 (4) Atlanta 2,891 1.0
6 (5) Detroit 2,549 2.6
7 (9) Minneapolis 2,276 2.4
8 (8) Nairobi 2,058 -7.8
9 (10) Hong Kong 2,020 -3.2
10 (7) Toronto 1,946 -20.4
11 (11) Chicago 1,658 -4.2
12 (16) Curacao 1,629 9.9
13 (12) Los Angeles 1,540 -0.3
14 (13) Seoul Incheon 1,539 -0.1
15 (14) Abu Dhabi 1,514 -1.0
16 (17) Mexico City 1,505 2.4
17 (15) Beijing 1,488 -1.5
18 (19) Doha 1,451 0.3
19 (20) Houston 1,436 -0.4
20 (25) Boston 1,414 22.4

Contents Summary Air transport movements Passengers Cargo Other airports Infrastructure 18
Per aircraft type
According to type, full-freighter version
Type Average MTOW1 Total movementsCompared to
2018 in %
1 Boeing 777-200 348 5,104 -10%
2 Boeing 747-400 401 3,989 -20%
3 Boeing 747-8 448 2,139 -7%
4 Boeing 757-200 104 890 7%
5 Airbus A300 159 730 -30%
6 Airbus A330-200 233 464 117%
7 Embraer EMB 120 12 393 -1%
8 Boeing 767-300 187 248 14%
9 Boeing 737-400 68 148 -37%
10 Airbus A310 164 40 100%
1 Maximum take off weight
According to type, passenger or mixed version
Type Average MTOW1 Total movementsCompared to
2018 in %
1 Boeing 737-800 74 109,748 1%
2 Embraer 190/195 46 78,408 8%
3 Airbus A320 75 51,708 -5%
4 Embraer 170/175 37 46,284 2%
5 Boeing 737-700 62 36,027 -16%
6 Airbus A319 66 29,434 -9%
7 Airbus A321 87 15,240 10%
8 Airbus A330-300 234 14,690 0%
9 Boeing 777-300 350 10,724 -8%
10 Boeing 737-900 78 10,707 11%
11 Boeing 787-9 253 10,669 16%
12 Boeing 777-200 298 10,513 -5%
13 Boeing 767-300 185 7,812 5%
14 Airbus A320neo 76 7,797 161%
15 Airbus A330-200 232 7,722 12%
16 Dash 8-400 30 7,653 -2%
17 Boeing 747-400 385 5,562 -15%
18 Bombardier CRJ 700/900/1000 35 4,170 -18%
19 Boeing 787-8 228 3,057 4%
20 Boeing 737-300 61 2,250 4%
21 Airbus 220-300 68 1,976 58%
22 Airbus A350-900 276 1,906 12%
23 Airbus A380 524 1,616 -2%
24 Boeing 767-400 205 1,063 114%
25 Airbus A321neo 92 982 923%
26 Airbus A318 60 938 22%
27 Embraer ERJ 145 20 928 -18%
28 Airbus A350-1000 316 712 1595%
29 Boeing 787-10 255 603 30050%
30 Airbus A340-300 271 402 -33%
1 Maximum take off weight

Contents Summary Air transport movements Passengers Cargo Other airports Infrastructure 19
2019
63.8%63.8%
16.1%16.1%
3.7%3.7%
2.8%2.8%
2.8%2.8%
10.7%10.7%
Skyteam & partners (pax only)¹
low cost carriers
leisure carriers
full freighter carriers
legacy carriers intercontinental
legacy carriers europe
1 all flights operated by KLM or in codeshare with KL
Main airlines
Air transport movements by airline segment
2019 Share in total
Skyteam & partners (pax only)1 317,145 63.8%
low cost carriers 79,950 16.1%
leisure carriers 18,162 3.7%
full freighter carriers 14,156 2.8%
legacy carriers intercontinental 14,059 2.8%
legacy carriers europe 53,354 10.7%
Total air transport movements 496,826 100.0%
1 all flights operated by KLM or in codeshare with KL
Air transport movements
Ranking(2018ranking) Airline Total
Compared to2018 in %
1 (1) KLM 250,450 1.5%
2 (2) easyJet 39,163 0.7%
3 (3) Transavia 34,228 0.0%
4 (4) Delta Air Lines 12,705 5.7%
5 (5) Flybe 11,799 0.7%
6 (6) British Airways 11,237 1.8%
7 (9) TUIfly 9,094 -5.0%
8 (8) Air France 8,881 -11.7%
9 (10) Lufthansa 8,125 1.2%
10 (7) Vueling 7,876 -24.8%
11 (11) SAS 5,480 -0.9%
12 (13) Aer Lingus 3,844 1.1%
13 (14) Turkish Airlines 3,736 -0.8%
14 (15) Alitalia 3,598 1.2%
15 (12) Corendon 3,559 -11.0%
16 (16) Ryanair 3,384 0.1%
17 (22) United Airlines 3,231 15.6%
18 (26) Austrian 3,059 19.7%
19 (18) Swiss 2,892 0.1%
20 (24) Norwegian Air 2,880 8.9%
21 (19) Air Baltic 2,854 -0.3%
22 (20) TAP Portugal 2,852 0.0%
23 - LEVEL 2,696 -
24 (23) China Southern 2,624 -1.9%
25 (25) Emirates 2,556 -1.0%
26 (27) Pegasus 2,445 0.6%
27 (21) LOT 2,302 -18.9%
28 (29) Aeroflot 2,189 -0.2%
29 (28) Germanwings 1,868 -16.6%
30 (31) Qatar Airways 1,663 -0.8%
Other airlines 43,556 -6.0%
Total 496,826 -0.5%

Contents Summary Air transport movements Passengers Cargo Other airports Infrastructure 20
New airlines
Example of airlines starting services in 2019
Airline Type Flights in 2019
Passenger 36
Passenger 2.696

Passengers
Contents Summary Air transport movements Passengers Cargo Other airports Infrastructure 21

Contents Summary Air transport movements Passengers Cargo Other airports Infrastructure 22
Highlights
71.7million passengers
Growth: + 0.9%
36.1%transfer passengers
Growth: - 0.4% point
r45.8number of O&Dpassengers
Growth: + 1.8%
J496.826passengers movements
Growth: - 0.5%
>174seats on average aircraftsize
Growth: + 2.8
d85%occupancy rate(seat load factor)
Growth: - 0.6% point

Contents Summary Air transport movements Passengers Cargo Other airports Infrastructure 23
Figures by month
Transport, transfer and O&D (excl. transit)
2019
36.1%36.1%
63.9%63.9%
Transfer
O&D
Passenger transportx 1,000
2,982 2,982 3,571 4,026 4,237 4,160 4,427 4,495 4,154 4,161 3,354 3,259
2,014 1,854
2,0592,078 2,204 2,343
2,297 2,3162,340 2,270
1,970 2,127
9 8
72
0 00 0
0 0
0 0
O&D
Transfer
Transito
January February March April May June July August September October November December
0
2,500
5,000
7,500
O&D Transfer Transito Total PAX per month Load Factor
January 2,982 2,014 9 5,005 80%
February 2,982 1,854 8 4,844 83%
March 3,571 2,059 7 5,638 84%
April 4,026 2,078 2 6,106 86%
May 4,237 2,204 0 6,441 85%
June 4,160 2,343 0 6,503 88%
July 4,427 2,297 0 6,724 88%
August 4,495 2,316 0 6,811 88%
September 4,154 2,340 0 6,493 86%
October 4,161 2,270 0 6,431 86%
November 3,354 1,970 0 5,324 84%
December 3,259 2,127 0 5,386 83%
Total (incl. Transito) 71,707 85%

Contents Summary Air transport movements Passengers Cargo Other airports Infrastructure 24
Figures by continent
Europe vs ICA
2019
70.5%70.5%
29.5%29.5%
Europe
Intercontinental
EU vs rest of Europe
2019
84.5%84.5%
15.5%15.5%
EU
Rest of Europe
ICA continents
2019
36%36%
16.1%16.1%13.6%13.6%
12.2%12.2%
22.2%22.2%
North America
Latin America
Africa
Middle East
Asia

Contents Summary Air transport movements Passengers Cargo Other airports Infrastructure 25
Figures by country
Main European countries
Ranking(2018ranking) Country Passengers 2019
Compared to2018 in %
1 (1) Great Britain 10,667,011 2.4%
2 (2) Spain 5,900,754 -1.0%
3 (3) Germany 4,562,553 0.5%
4 (4) Italy 4,256,011 2.0%
5 (5) France 3,507,553 -1.3%
6 (7) Turkey 2,179,646 5.4%
7 (6) Switzerland 2,133,700 0.2%
8 (8) Norway 1,876,712 2.8%
9 (9) Denmark 1,754,499 2.6%
10 (10) Greece 1,633,607 -3.9%
11 (11) Portugal 1,615,605 0.3%
12 (12) Sweden 1,413,677 1.0%
13 (13) Ireland 1,369,662 1.4%
14 (14) Austria 1,117,237 12.4%
15 (15) Poland 949,713 14.5%
16 (16) Russia 780,947 1.1%
17 (18) Czech Republic 758,542 9.8%
18 (17) Finland 744,513 0.3%
19 (19) Romania 480,812 2.1%
20 (20) Hungary 454,447 0.5%
Rest of Europe 2,386,005 -8.2%
Total of Europe 50,543,206 1.1%
Main Intercontinental countries
Ranking(2018ranking) Country Passengers 2019
Compared to2018 in %
1 (1) USA 6,357,536 6.8%
2 (2) China 1,750,629 1.3%
3 (4) United Arab Emirates 1,356,658 9.9%
4 (3) Canada 1,259,729 -6.1%
5 (6) Netherlands Antilles 726,365 7.8%
6 (7) Israel 615,233 4.9%
7 (8) Brasil 542,945 5.9%
8 (5) India 515,822 -41.5%
9 (11) Japan 505,702 15.3%
10 (10) South Africa 499,147 3.9%
11 (9) Morocco 492,922 -0.1%
12 (12) Kenya 417,701 -0.8%
13 (13) Mexico 404,235 5.2%
14 (15) Thailand 341,159 -1.7%
15 (14) Indonesia 340,621 -8.0%
16 (16) Singapore 318,998 -2.2%
17 (17) Egypt 311,378 -0.3%
18 (18) South Korea 296,815 1.0%
19 (20) Surinam 290,426 5.9%
20 (19) Peru 267,850 -5.0%
Rest of Intercontinental 3,551,922 -4.8%
Total of Intercontinental 21,163,793 0.5%

Contents Summary Air transport movements Passengers Cargo Other airports Infrastructure 26
Figures by airport
Main European origins and destinations
Ranking(2018ranking) Airport IATA code Passengers 2019
Compared to2018 in %
1 (1) London LHR 1,747,788 0.1%
2 (2) Barcelona BCN 1,382,607 -2.6%
3 (3) Paris CDG 1,239,837 0.1%
4 (4) Dublin DUB 1,212,587 1.5%
5 (9) Madrid MAD 1,139,999 10.1%
6 (5) Copenhagen CPH 1,110,441 1.8%
7 (6) London LGW 1,096,867 1.2%
8 (8) Manchester MAN 1,069,527 2.6%
9 (7) Rome FCO 1,048,531 -1.5%
10 (11) Zuerich ZRH 978,651 -1.7%
11 (10) Munich MUC 971,134 -2.5%
12 (18) Vienna VIE 945,631 15.2%
13 (12) Lisbon LIS 928,643 3.6%
14 (16) Milan MXP 923,704 10.1%
15 (13) Frankfurt FRA 882,456 2.0%
16 (15) Stockholm ARN 863,465 0.7%
17 (17) London LTN 846,029 1.7%
18 (22) Prague PRG 758,542 9.8%
19 (19) Oslo OSL 723,459 1.6%
20 (23) Geneva GVA 707,671 3.4%
Rest of Europe 29,965,637 0.3%
Total of Europe 50,543,206 1.1%
Main Intercontinental origins and destinations
Ranking(2018ranking) Airport IATA code Passengers 2019
Compared to2018 in %
1 (2) New York JFK 1,020,699 15.9%
2 (1) Dubai DXB 1,013,503 12.4%
3 (3) Atlanta ATL 808,734 -0.4%
4 (5) Detroit DTW 629,375 1.2%
5 (6) Tel Aviv TLV 605,224 3.8%
6 (4) Toronto YYZ 580,977 -15.2%
7 (7) Minneapolis MSP 566,998 2.7%
8 (8) Curacao CUR 557,243 8.2%
9 (9) Shanghai PVG 450,761 4.6%
10 (10) Hong Kong HKG 424,853 -0.4%
11 (11) Nairobi NBO 412,671 -1.5%
12 (22) San Francisco SFO 407,537 35.9%
13 (12) Los Angeles LAX 392,443 -4.3%
14 (14) Beijing PEK 391,316 -1.1%
15 (17) Mexico City MEX 348,241 4.2%
16 (18) Abu Dhabi AUH 342,883 4.4%
17 (15) Bangkok BKK 341,159 -1.7%
18 (16) Houston IAH 335,894 -1.7%
19 (27) Boston BOS 335,220 22.1%
20 (19) Singapore SIN 318,998 -2.2%
Rest of Intercontinental 10,879,064 -2.7%
Total of Intercontinental 21,163,793 0.5%

Contents Summary Air transport movements Passengers Cargo Other airports Infrastructure 27
Passenger profile
2019
30%30%
3%3%
46%46%
20%20%
1%1%
Business
Congress/study
Leisure
Visiting friends/relatives
Other
2019 2018
Business 30% 30%
Congress/study 3% 3%
Leisure 46% 46%
Visiting friends/relatives 20% 20%
Other 1% 1%

Cargo
Contents Summary Air transport movements Passengers Cargo Other airports Infrastructure 28

Contents Summary Air transport movements Passengers Cargo Other airports Infrastructure 29
Highlights
1.57million tonnes of cargo
Growth: - 8.5%
g14,156full freighter movements
Growth: - 11.2%
721.072belly tonnage
Growth: - 2.3%

Contents Summary Air transport movements Passengers Cargo Other airports Infrastructure 30
Figures by month
Monthly cargo totals (x1,000 tonnes)
56.2 55.8 63.8 59.0 60.9 59.4 61.6 60.4 60.1 62.7 61.7 59.4
66.4 60.0
81.067.7 72.8 64.5 67.6 70.2 76.7 80.8 74.5 67.0
Passenger aircraft
Full-freighter aircraft
Jan Feb Mar Apr May Jun Jul Aug Sep Oct Nov Dec
0
25
50
75
100
125
150
175

Contents Summary Air transport movements Passengers Cargo Other airports Infrastructure 31
Annual cargo totals (x 1,000 tonnes)
x 1,000 tonnes
106.5 112.0 115.5 96.3 93.1 268.2119.6 164.6 76.2 51.8 106.2 260.2
Inbound
Outbound
Europe North America Latin America Africa Middle East Asia
0
50
100
150
200
250
300
Figures by continent
Annual cargo totals (x 1,000 tonnes)
2019Compared to
2018 in %
Total 1,570.3 -8.5%
Passenger services 721.1 -2.3%
Full-freighter services 849.2 -13.2%
Inbound 791.6 -9.8%
Outbound 778.6 -7.2%

Contents Summary Air transport movements Passengers Cargo Other airports Infrastructure 32
Figures by year
Annual cargo totals (x 1,000 tonnes)
611611596596
612612 621621641641
671671
640640
590590
650650 641641
609609 605605
630630
654654671671
709709
738738721721
629629
710710
809809829829
886886
939939927927
696696
862862883883 875875
926926
1,0031,003
967967
996996
1,0521,052
979979
849849
Passenger aircraft
Full-freighter aircraft
2002 2003 2004 2005 2006 2007 2008 2009 2010 2011 2012 2013 2014 2015 2016 2017 2018 2019
500
600
700
800
900
1,000
1,100

Contents Summary Air transport movements Passengers Cargo Other airports Infrastructure 33
Figures by airport
Main cargo destinations (tonnes)
Ranking (2018 ranking) Airport IATA code 2019 in tonnes Compared to 2018 in %
1 (1) Shanghai PVG 181,030 -12.2%
2 (3) Moscow SVO 78,931 -0.4%
3 (2) Nairobi NBO 69,694 -18.7%
4 (4) Doha DOH 63,948 -1.1%
5 (5) Guangzhou CAN 48,830 0.5%
6 (8) Quito UIO 43,101 -9.0%
7 (7) Singapore SIN 39,818 -16.2%
8 (10) New York JFK 38,612 -6.4%
9 (6) Chicago ORD 37,557 -22.0%
10 (11) Jeddah JED 35,694 -3.1%
11 (15) Tokyo NRT 35,513 35.9%
12 (9) Hong Kong HKG 34,449 -17.9%
13 (20) Dubai DXB 33,652 34.2%
14 (13) Seoul ICN 30,229 -14.9%
15 (16) Leipzig LEJ 27,561 5.6%
16 (14) Taipei TPE 27,301 -4.7%
17 (17) Abu Dhabi AUH 26,346 3.0%
18 (21) Atlanta ATL 25,226 0.8%
19 (12) Baku GYD 25,085 -29.8%
20 (19) Johannesburg JNB 24,722 -1.9%

Other airports
Contents Summary Air transport movements Passengers Cargo Other airports Infrastructure 34

Contents Summary Air transport movements Passengers Cargo Other airports Infrastructure 35
Highlights
JRanking 3air transport movementsin Europe
Growth: + 0
>Ranking 3passenger transport inEurope
Growth: + 0
gRanking 4cargo air transport inEurope
Growth: - 1
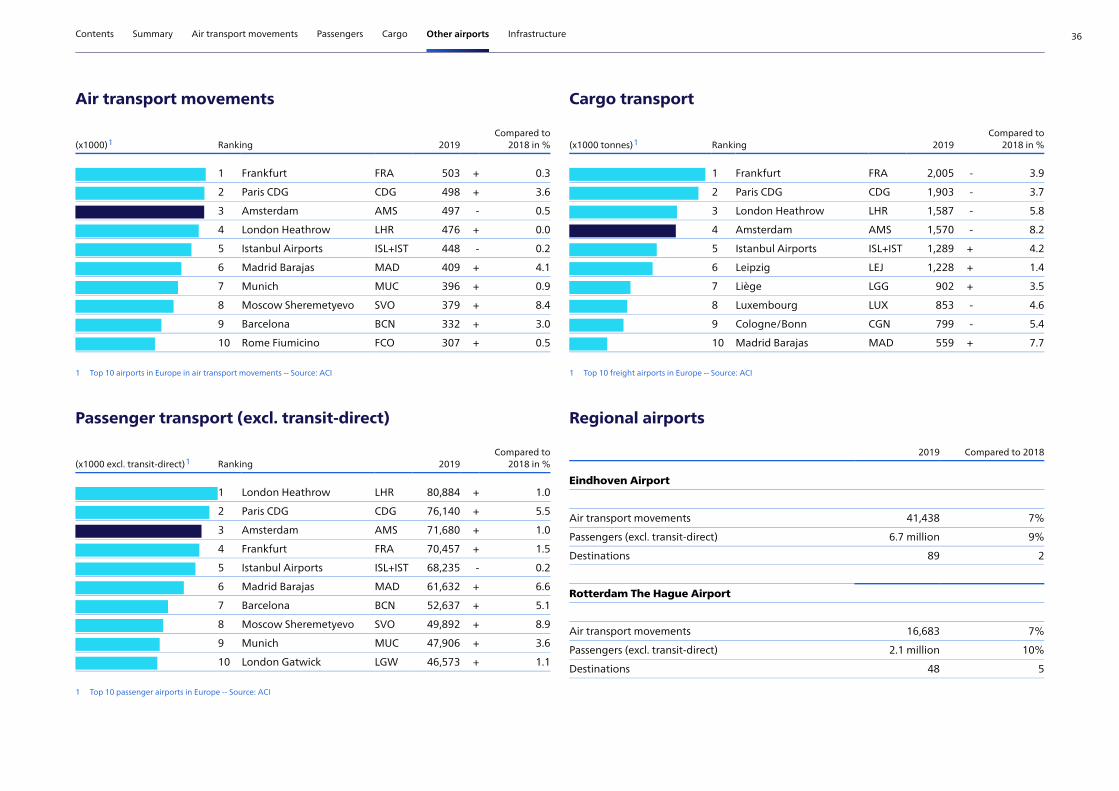
Contents Summary Air transport movements Passengers Cargo Other airports Infrastructure 36
Air transport movements
(x1000)1 Ranking 2019Compared to
2018 in %
1 Frankfurt FRA 503 + 0.3
2 Paris CDG CDG 498 + 3.6
3 Amsterdam AMS 497 - 0.5
4 London Heathrow LHR 476 + 0.0
5 Istanbul Airports ISL+IST 448 - 0.2
6 Madrid Barajas MAD 409 + 4.1
7 Munich MUC 396 + 0.9
8 Moscow Sheremetyevo SVO 379 + 8.4
9 Barcelona BCN 332 + 3.0
10 Rome Fiumicino FCO 307 + 0.5
1 Top 10 airports in Europe in air transport movements -- Source: ACI
Passenger transport (excl. transit-direct)
(x1000 excl. transit-direct)1 Ranking 2019Compared to
2018 in %
1 London Heathrow LHR 80,884 + 1.0
2 Paris CDG CDG 76,140 + 5.5
3 Amsterdam AMS 71,680 + 1.0
4 Frankfurt FRA 70,457 + 1.5
5 Istanbul Airports ISL+IST 68,235 - 0.2
6 Madrid Barajas MAD 61,632 + 6.6
7 Barcelona BCN 52,637 + 5.1
8 Moscow Sheremetyevo SVO 49,892 + 8.9
9 Munich MUC 47,906 + 3.6
10 London Gatwick LGW 46,573 + 1.1
1 Top 10 passenger airports in Europe -- Source: ACI
Cargo transport
(x1000 tonnes)1 Ranking 2019Compared to
2018 in %
1 Frankfurt FRA 2,005 - 3.9
2 Paris CDG CDG 1,903 - 3.7
3 London Heathrow LHR 1,587 - 5.8
4 Amsterdam AMS 1,570 - 8.2
5 Istanbul Airports ISL+IST 1,289 + 4.2
6 Leipzig LEJ 1,228 + 1.4
7 Liège LGG 902 + 3.5
8 Luxembourg LUX 853 - 4.6
9 Cologne/Bonn CGN 799 - 5.4
10 Madrid Barajas MAD 559 + 7.7
1 Top 10 freight airports in Europe -- Source: ACI
Regional airports
2019 Compared to 2018
Eindhoven Airport
Air transport movements 41,438 7%
Passengers (excl. transit-direct) 6.7 million 9%
Destinations 89 2
Rotterdam The Hague Airport
Air transport movements 16,683 7%
Passengers (excl. transit-direct) 2.1 million 10%
Destinations 48 5

Infrastructure
Contents Summary Air transport movements Passengers Cargo Other airports Infrastructure 37

Contents Summary Air transport movements Passengers Cargo Other airports Infrastructure 38
Capacity
223aircraft stands total
93connectedaircraft stands
130disconnectedaircraft stands
40,674car parking spaces total
27,897car parking spacespassengers/visitors
12,777car parking spacesemployees

Contents Summary Air transport movements Passengers Cargo Other airports Infrastructure 39
Runways
1
2
5
34
6
Runways Location Length Width
1 Polder Runway 18R - 36L 3,800 metres 60 metres
2 Zwanenburg Runway 18C - 36C 3,300 metres 45 metres
3 Kaag Runway 06 - 24 3,500 metres 45 metres
4 Aalsmeer Runway 18L - 36R 3,400 metres 45 metres
5 Buitenveldert Runway 09 - 27 3,453 metres 45 metres
6 Schiphol East Runway 04 - 22 2,014 metres 45 metres

Contents Summary Air transport movements Passengers Cargo Other airports Infrastructure 40
Glossary
Air transport movementsAn air transport movement means a landing or take-off. Air
transport movement in scheduled traffic means a movement in
commercial traffic according to an official timetable. Air transport
movement in non-scheduled traffic means a non-scheduled
movement in commercial traffic (charters, relief services, etc.; taxi
flights excluded).
Cargo transportBoth paying and non paying freight, including military mail and
express freight. Goods leaving the airport on the same aircraft as
the one by which they have arrived (transit-direct) are left out of
account, as well as trucking freight.
Mail transportMail handled exclusively by TNT Post Group N.V. excluding mail
leaving the airport on the same aircraft as the one by which it has
arrived (transit-direct).
MTOWMaximum take-off weight of an aircraft.
Network destinationsPassenger destinations count when an airline carries at least 10
passengers on a flight between Amsterdam Airport Schiphol and
that destination, for at least 8 weeks in a row. Freighter
destinations only count when more than 100,000 kg from/to a
destination have been shipped in a year, in at least 10 frequencies.
Passenger load factorThe passenger load factor means the number of passengers
(including 2x transit-direct) expressed in a percentage of the
number of available seats.
Passenger transportAll passengers on scheduled- and non-scheduled flights including
service passengers and infants. Passengers on taxi-, photo- and
sightseeing flights are excluded.
O&D passengers
Originating and destinating passengers. Those whose journey by
air starts or ends at Amsterdam Airport Schiphol.
Transfer passengers
Those who change planes within 24 hours without leaving the
customs area are counted both arriving and departing.
Transit-direct passengers
Those who leave the airport on the same flight number as the one
by which they arrived, without leaving the customs area are not
counted incoming or outgoing, but stated separately.
PunctualityPunctuality is the percentage of flights departing/arriving
whithin no more than 15 minutes of its scheduled time on/off
blocks, regarding passenger flights only.
