valbuena et al 2008 aee
TRANSCRIPT
8/13/2019 Valbuena Et Al 2008 AEE
http://slidepdf.com/reader/full/valbuena-et-al-2008-aee 1/10
A method to define a typology for agent-based analysis in regionalland-use research
Diego Valbuena *, Peter H. Verburg, Arnold K. Bregt
Department of Environmental Sciences, Wageningen University, PO Box 47, 6700 Wageningen, The Netherlands
1. Introduction
Land-use/cover change (LUCC) is a complex process caused by
the interaction between natural and social systems at different
temporal and spatial scales (Lambin and Geist, 2001; Rindfuss
et al., 2004). In rural areas, LUCC is related to the dynamics of the
agricultural sector in general, and those of the farming systems in
particular. However, each farming system is different (Kobrich
et al., 2003), reflecting the heterogeneity of human’s behaviour and
decisions. This heterogeneity is not only influenced by the
complexity of the human behaviour itself (Simon, 1955; Rokeach,
1968; Ajzen, 1991; Arthur, 1994), but also by both internal and
external factors such as land-holders’ experience, family structure,
economic and technical resources, and the socio-economic context
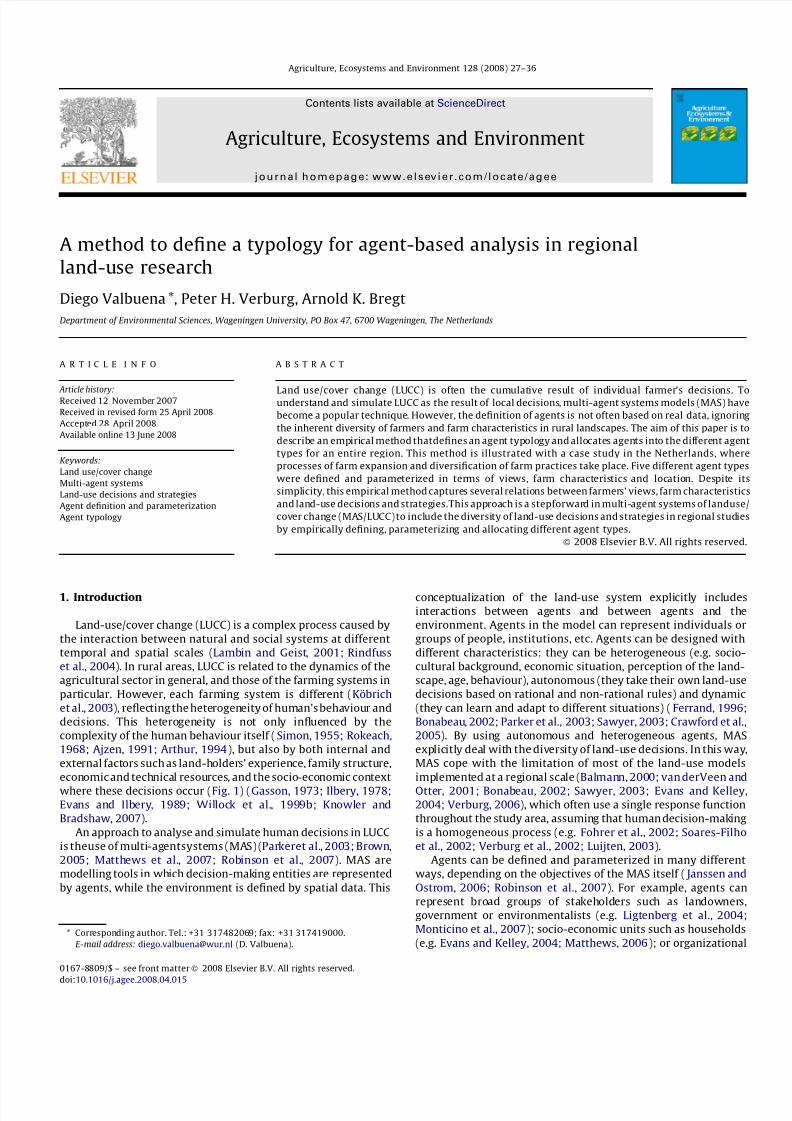
where these decisions occur (Fig. 1) (Gasson, 1973; Ilbery, 1978;Evans and Ilbery, 1989; Willock et al., 1999b; Knowler and
Bradshaw, 2007).
An approach to analyse and simulate human decisions in LUCC
is theuse of multi-agentsystems (MAS) (Parkeret al., 2003; Brown,
2005; Matthews et al., 2007; Robinson et al., 2007). MAS are
modelling tools in which decision-making entities are represented
by agents, while the environment is defined by spatial data. This
conceptualization of the land-use system explicitly includes
interactions between agents and between agents and the
environment. Agents in the model can represent individuals or
groups of people, institutions, etc. Agents can be designed with
different characteristics: they can be heterogeneous (e.g. socio-
cultural background, economic situation, perception of the land-
scape, age, behaviour), autonomous (they take their own land-use
decisions based on rational and non-rational rules) and dynamic
(they can learn and adapt to different situations) (Ferrand, 1996;
Bonabeau, 2002; Parker et al., 2003; Sawyer, 2003; Crawford et al.,
2005). By using autonomous and heterogeneous agents, MAS
explicitly deal with the diversity of land-use decisions. In this way,
MAS cope with the limitation of most of the land-use models
implemented at a regional scale (Balmann, 2000; van derVeen and
Otter, 2001; Bonabeau, 2002; Sawyer, 2003; Evans and Kelley,2004; Verburg, 2006), which often use a single response function
throughout the study area, assuming that human decision-making
is a homogeneous process (e.g. Fohrer et al., 2002; Soares-Filho
et al., 2002; Verburg et al., 2002; Luijten, 2003).
Agents can be defined and parameterized in many different
ways, depending on the objectives of the MAS itself ( Janssen and
Ostrom, 2006; Robinson et al., 2007). For example, agents can
represent broad groups of stakeholders such as landowners,
government or environmentalists (e.g. Ligtenberg et al., 2004;
Monticino et al., 2007); socio-economic units such as households
(e.g. Evans and Kelley, 2004; Matthews, 2006); or organizational
Agriculture, Ecosystems and Environment 128 (2008) 27–36
A R T I C L E I N F O
Article history:Received 12 November 2007
Received in revised form 25 April 2008
Accepted 28 April 2008
Available online 13 June 2008
Keywords:
Land use/cover change
Multi-agent systems
Land-use decisions and strategies
Agent definition and parameterization
Agent typology
A B S T R A C T
Land use/cover change (LUCC) is often the cumulative result of individual farmer’s decisions. Tounderstand and simulate LUCC as the result of local decisions, multi-agent systems models (MAS) have
become a popular technique. However, the definition of agents is not often based on real data, ignoring
the inherent diversity of farmers and farm characteristics in rural landscapes. The aim of this paper is to
describe an empirical method thatdefines an agent typology and allocates agents into the different agent
types for an entire region. This method is illustrated with a case study in the Netherlands, where
processes of farm expansion and diversification of farm practices take place. Five different agent types
were defined and parameterized in terms of views, farm characteristics and location. Despite its
simplicity, this empirical method captures several relations between farmers’ views, farm characteristics
and land-use decisions and strategies.This approach is a stepforward in multi-agent systems of landuse/
cover change (MAS/LUCC) to include the diversity of land-use decisions and strategies in regional studies
by empirically defining, parameterizing and allocating different agent types.
2008 Elsevier B.V. All rights reserved.
* Corresponding author. Tel.: +31 317482069; fax: +31 317419000.
E-mail address: [email protected] (D. Valbuena).
Contents lists available at ScienceDirect
Agriculture, Ecosystems and Environment
j o u r n a l h o m e p a g e : w w w . e l s ev i e r . c o m / l o c at e / a g e e
0167-8809/$ – see front matter 2008 Elsevier B.V. All rights reserved.
doi:10.1016/j.agee.2008.04.015
8/13/2019 Valbuena Et Al 2008 AEE
http://slidepdf.com/reader/full/valbuena-et-al-2008-aee 2/10
units such as farms (e.g. Balmann, 2000; Happe et al., 2006). The
decision-making process of agents needs to be specifically
parameterized by decision rules. These rules can be defined
based on either artificial or empirical data. Agent parameteriza-
tion with artificial data is the more common approach in MAS
(Berger and Schreinemachers, 2006). Although improving the
theoretical insight into LUCC dynamics, the validity of such
artificial agent definition is often difficult to assess (Gimblett,
2002; Parker et al., 2003). On the other hand, agent parameter-
izationwith empirical datacan facilitate theunderstanding of real
LUCC processes. Still, most studies using empirical data to define
and parameterize agents rely on intensive data gathering (e.g.
Bousquet et al., 2001; Huigen, 2004; Castella et al., 2005; Jepsenet al., 2006).
At a regional scale, intensive data gathering is limited by the
large number of agents. Despite the heterogeneity of farming
systems at such spatial scale, general farming strategies can be
distinguished, what Bowler (1992) define as ‘‘paths of develop-
ment’’ (see also Wilson, 2007). These general pathways are a
simplificationof how farming can developin a certainarea(Meert
et al., 2005). A relevant approach to analyse the heterogeneity in
decision-making of farmers is to formulate typologies (McKinney,
1950; Jollivet, 1965; Escobar and Berdegue, 1990; Perrot and
Landais, 1993b; van der Ploeg, 1994). A typology is a tool to
simplify the diversity of farmers and farming strategies. This
means that a typology is an artificial way to define different
groups based on specific criteria in order to organize and analysereality (McKinney, 1950; Jollivet, 1965). Thecriteria to construct a
typology, as well as to evaluate it, primarily depend on the
objectives of its implementation (Escobar and Berdegue, 1990).
Different kinds of typologies for agents in rural areas can be
distinguished based on their aim. For example, some typologies
intend to understand the whole farming process, which include
the most relevant farm(er) characteristics (e.g. Escobar and
Berdegue, 1990; Perrot and Landais, 1993a; van der Ploeg, 1994).
Other typologies aim to analyse the underlying reasons of certain
farmers’ decisions (e.g. Morris and Potter, 1995; Fish et al., 2003;
Guillaumin et al., 2004). Finally, other typologies aim to explain
the different production strategies that farmers developed or
might develop (e.g. Ondersteijn et al., 2003; de Lauwere, 2005;
Vanclay et al., 2006; Van Doorn and Bakker, 2007). Nevertheless,most of the current typologies do not account for the spatial
linkage in which land-use decisions are embedded (Landais,
1998).
The aim of this study is to describe an empirical method to
define and parameterize differentagent types for use in MAS/LUCC
at a regional scale. This method first defines an agent typology and
subsequently distributes spatially the defined agent types in the
entire region. After describing the general method, this paper
illustrates the method with a case study in the East of the
Netherlands where processes of farm diversification and farm
expansion are taking place. Finally, this paper discusses the
advantages and the limitation of the proposed method, including
its potential applications in MAS/LUCC research and policy-making
processes.
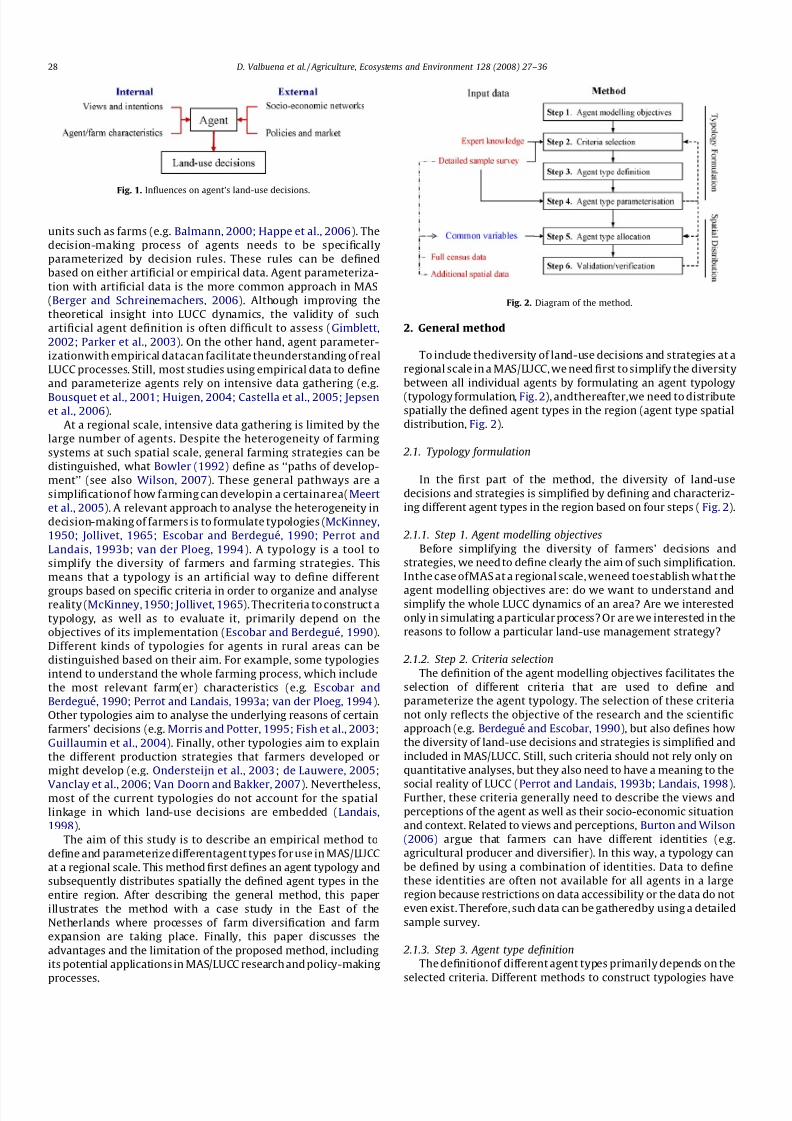
2. General method
To include thediversity of land-use decisions and strategies at a
regional scale in a MAS/LUCC, we need first to simplify the diversity
between all individual agents by formulating an agent typology
(typology formulation, Fig. 2), andthereafter,we need to distributespatially the defined agent types in the region (agent type spatial
distribution, Fig. 2).
2.1. Typology formulation
In the first part of the method, the diversity of land-use
decisions and strategies is simplified by defining and characteriz-
ing different agent types in the region based on four steps ( Fig. 2).
2.1.1. Step 1. Agent modelling objectives
Before simplifying the diversity of farmers’ decisions and
strategies, we need to define clearly the aim of such simplification.
Inthe case ofMAS at a regional scale, weneed toestablish what the
agent modelling objectives are: do we want to understand andsimplify the whole LUCC dynamics of an area? Are we interested
only in simulating a particular process? Or are we interested in the
reasons to follow a particular land-use management strategy?
2.1.2. Step 2. Criteria selection
The definition of the agent modelling objectives facilitates the
selection of different criteria that are used to define and
parameterize the agent typology. The selection of these criteria
not only reflects the objective of the research and the scientific
approach (e.g. Berdegue and Escobar, 1990), but also defines how
the diversity of land-use decisions and strategies is simplified and
included in MAS/LUCC. Still, such criteria should not rely only on
quantitative analyses, but they also need to have a meaning to the
social reality of LUCC (Perrot and Landais, 1993b; Landais, 1998).Further, these criteria generally need to describe the views and
perceptions of the agent as well as their socio-economic situation
and context. Related to views and perceptions, Burton and Wilson
(2006) argue that farmers can have different identities (e.g.
agricultural producer and diversifier). In this way, a typology can
be defined by using a combination of identities. Data to define
these identities are often not available for all agents in a large
region because restrictions on data accessibility or the data do not
even exist. Therefore, such data can be gatheredby using a detailed
sample survey.
2.1.3. Step 3. Agent type definition
The definitionof different agent types primarily depends on the
selected criteria. Different methods to construct typologies have
Fig. 1. Influences on agent’s land-use decisions.
Fig. 2. Diagram of the method.
D. Valbuena et al. / Agriculture, Ecosystems and Environment 128 (2008) 27–36 28
8/13/2019 Valbuena Et Al 2008 AEE
http://slidepdf.com/reader/full/valbuena-et-al-2008-aee 3/10
been described (e.g. Escobar and Berdegue, 1990; Landais, 1998;
van der Ploeg, 2003). For example, a typology can be constructed
using qualitative (e.g. Guillaumin et al., 2004; Schmitzberger et al.,
2005) or quantitative analyses (e.g. Wilsonand Hart, 2000; Kobrich
et al., 2003; Kristensen, 2003; de Lauwere, 2005); attitudinal (e.g.
Fairweather and Keating, 1994; Morris and Potter, 1995) or socio-
economic variables (e.g. Commandeur, 2005; Schmitzberger et al.,
2005); and scientist knowledge (e.g. Perrot and Landais, 1993a;
van der Ploeg, 1994) or participatory processes (e.g. Girard, 2006).
The choice of a particular analysis depends on the selected criteria
and the available data.
2.1.4. Step 4. Agent type parameterization
In this step, agent types are described in terms of views and
strategies relevant to the MAS/LUCC. This is a step to understand
the differences between agent types based not only on views
and decisions, but also their socio-economic situation and
context. To assess whether these differences are significant,
statistical analyses are used. Most of the attitudinal and
socio-economic variables used to parameterize agent types
are included in the detailed sample survey. Finally, some of
these variables can be also used as common variables (see
below).
2.2. Agent type spatial distribution
Inthe secondpartof the method, all agents inthe study area are
classified as one of the defined agent types. Further, the method is
validated and verified.
2.2.1. Step 5. Agent type allocation
Although full census data of the entire population of a region
are often available, the level of detail and/or accessibility of such
data areoften limited. Therefore, these data arenot used to define
the different agent types. The use of common variables between a
detailed sample survey, full census data and additional socio-
economic and biophysical dataallows us to classify all agents intoone of the defined agent types (Fig. 2). Although spatial variables
canbe usedto define andparameterize thedifferent agent types, it
is in this step that agent types are explicitly linked to the
landscape. Finally, depending on the available data for the entire
study region, different quantitative analyses techniques can be
used to classify agents, such as regression, multivariate and
probabilistic analyses.
2.2.2. Step 6. Validation/verification
Thedefinition andallocation of the different agent types (step 3
and 5, Fig. 2) may result in some degree of overlap between agent
types and consequently uncertainty about the definition of the
variables due to both the complexity of land-use decisions and the
limited data availability. For this reason, it is necessary to validatethese steps and determine the level of uncertainty of the results.
Based on this validation/verification process, early steps of the
method might need to be modified. Participatory approaches could
be used to validate an agent typology (e.g. Girard, 2006). However,
agent types arean abstract representationof reality whichmakesit
difficult for people to recognize themselves in the agent types as
defined and therefore hampers such a validation.
3. Case study
In this part, theproposed method is illustrated with a case study
in the eastern part of the Netherlands, where processes of
diversification of farm practices and farm expansion are reshaping
the landscape structure.
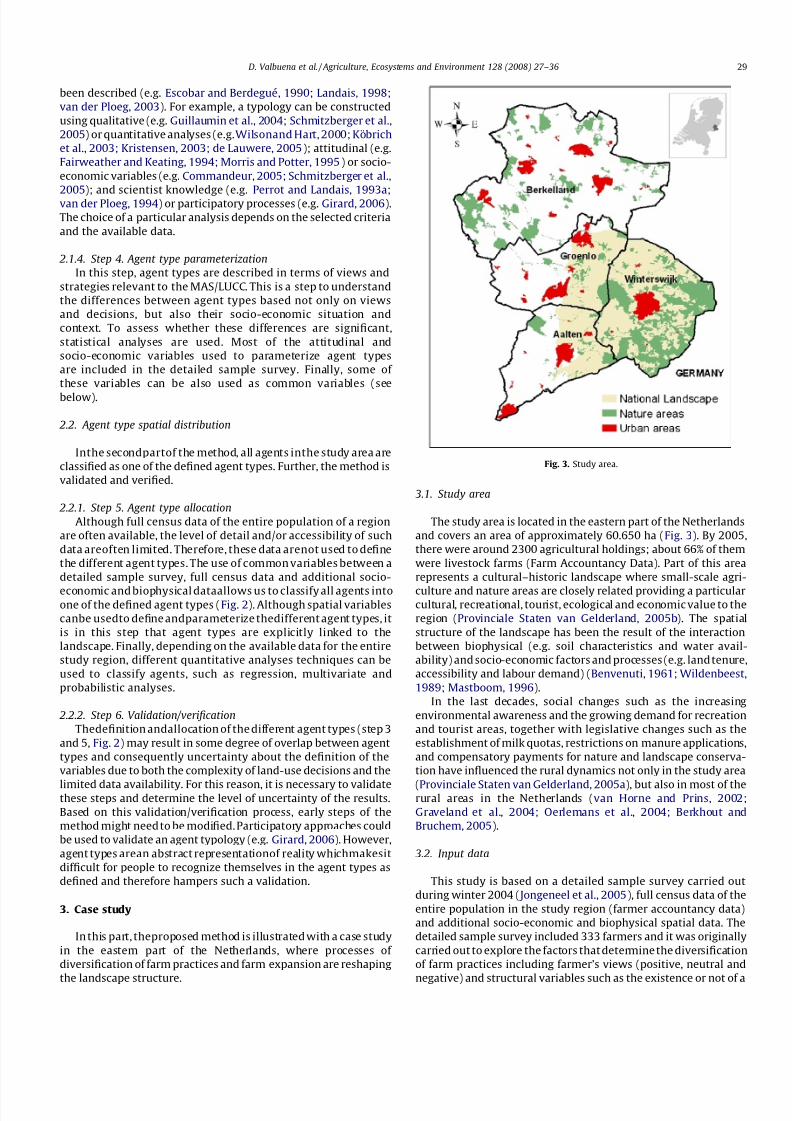
3.1. Study area
The study area is located in the eastern part of the Netherlands
and covers an area of approximately 60.650 ha (Fig. 3). By 2005,
there were around 2300 agricultural holdings; about 66% of them
were livestock farms (Farm Accountancy Data). Part of this area
represents a cultural–historic landscape where small-scale agri-
culture and nature areas are closely related providing a particularcultural, recreational, tourist, ecological and economic value to the
region (Provinciale Staten van Gelderland, 2005b). The spatial
structure of the landscape has been the result of the interaction
between biophysical (e.g. soil characteristics and water avail-
ability) and socio-economic factors and processes (e.g. land tenure,
accessibility and labour demand) (Benvenuti, 1961; Wildenbeest,
1989; Mastboom, 1996).
In the last decades, social changes such as the increasing
environmental awareness and the growing demand for recreation
and tourist areas, together with legislative changes such as the
establishment of milk quotas, restrictions on manure applications,
and compensatory payments for nature and landscape conserva-
tion have influenced the rural dynamics not only in the study area
(Provinciale Staten van Gelderland, 2005a), but also in most of therural areas in the Netherlands (van Horne and Prins, 2002;
Graveland et al., 2004; Oerlemans et al., 2004; Berkhout and
Bruchem, 2005).
3.2. Input data
This study is based on a detailed sample survey carried out
during winter 2004 ( Jongeneel et al., 2005), full census data of the
entire population in the study region (farmer accountancy data)
and additional socio-economic and biophysical spatial data. The
detailed sample survey included 333 farmers and it was originally
carried out to explore the factors that determine the diversification
of farm practices including farmer’s views (positive, neutral and
negative) and structural variables such as the existence or not of a
Fig. 3. Study area.
D. Valbuena et al. / Agriculture, Ecosystems and Environment 128 (2008) 27–36 29
8/13/2019 Valbuena Et Al 2008 AEE
http://slidepdf.com/reader/full/valbuena-et-al-2008-aee 4/10
successor, production scale, degree specialization of the farm and
past land-use changes ( Jongeneel et al., 2005). The full census data
include only a limited number of structural variables such as
agribusiness type, production scale, cultivated area, head farmer’s
age and labour, and no attitudinal variables. Finally, additional
spatial data include: groundwater table, altitude, proportion of
nature and historical areas, farm density, production scale and
cultivated area.
To simplify the parameterization and allocation of the different
agent types, some variables were grouped. In particular, agribusi-
ness type and category of production scale were defined based on
CBS (Statistics Netherlands) terminology. Four main agribusiness
types from the Dutch version of the Community Typology were
distinguished for the study area: arable, livestock, intensive
livestock and other farms. Also, based on the production scale,
farms were divided into four main categories: hobby (3–20 dsu),
small (20–50 dsu), medium (50–100 dsu) and large farms
(>100 dsu). Dsu or Dutch size units represent the economic size
of a farm including the amount and use of the land; in 2005, a dsu
was equal to 1400 euros.
3.3. Typology formulation
3.3.1. Step 1. Agent modelling objectives
The agent modelling objective is to understand the different
strategies that farmers have followed and/or might follow in terms
of farm diversification practices and farm expansion.
3.3.2. Step 2. Criteria selection
Because these land-use decisions often depend on individual
decisions, the criteria to define this typology should include
farmers’ views or willingness (Siebert et al., 2006). In particular,
views on expansion of production scale as a future alternative,
diversification of farm practices as an additional income and
participation in compensation schemes for nature and landscape
conservation practices were selected. At the same time, socio-
economic variables can implicitly represent different farmingstrategies. This is partly related to the farmer’s ability to carry out
certain action (Siebert et al., 2006). Specifically, farming is an
important source of income for some farmers or it is simply a
hobby for others. This distinction has an influence in decisions
concerning the diversification of farm practices and the expansion
of their holdings (e.g. Primdahl, 1999; Kristensen, 2003; Schmitz-
berger et al., 2005). Therefore, both socio-economic and attitudinal
variables are used as criteria to define the different agent types.
3.3.3. Step 3. Agent type definition
Based on an analysis of the diversity in views and socio-
economic conditions, a ‘‘classification tree’’ was chosen as most
appropriate method to construct the typology in this case study.
This tree is based on Boolean statements defined in the criteriadescribed above: production scale larger than 20 dsu, view on
expansion of the production scale and on participating in
compensation schemes. The results of this classification tree were
supported by explorative analyses, including regression, factor and
cluster analysis.
3.3.4. Step 4. Agent type parameterization
After agent types were defined, they were parameterized based
on additional variables suchas age, education, cultivated area, type
of agribusiness, successor, past land-use decisions, membership of
different organizations, knowledge about different agricultural
projects, etc. To define whether the differences of the metric
variables between agent types were significant, analysis of
variance (ANOVA) was used.
3.4. Agent type spatial distribution
3.4.1. Step 5. Agent type allocation
In this case study, full census data were available for the entire
agent population. This means thatsocio-economic data of eachreal
agent and its exact location were available. Therefore, a
classification of these agents into agent types could be made
using the common variables between the detailed survey data and
census data. The common variables included: age, agribusiness
type, production scale and landscape structure.
The analysis of the landscape structure was carried out at
postcode level (average area 550 ha), at which the location of the
farms of the detailed survey was known. To calculate the relation
between these spatial variables, Pearson correlation analyses were
carried out. Finally, to assess whether the landscape structure was
significantly related to the agent typology or farming decisions
(non-parametric variables), Kruskal–Wallis tests were carried out
(for detailed information on these analyses see Legendre and
Legendre, 1998; Lesschen et al., 2005).
To classify the different agent types a classification tree was
calculated using the CRT growing method (SPSS 15.0). This
approach is similar to the one discussed by Speybroeck et al.
(2004), who selected as splitting criteria the ‘Gini method’ becauseit performs the best. To avoid overfitting the model, the size of
parent and child nodes was limited to 20 and 4 respectively. The
definition of these sizes was related to both the size of the detailed
sample survey and the validation procedure (see below). The
advantages of using classification trees are that it allows
combining metric and non-metric variables, and including non-
linear relationships.
3.4.2. Step 6. Validation/verification
To assess the uncertainty of the classification process, a cross-
validation method for the classification tree was implemented
(SPSS 15.0). With this method, the dataset was divided into 25 sub-
samples. Each sub-sample was classifiedbasedon the results of the
classification tree of the other 24 samples. The proportion of casesthat were correctly classified was calculated for the 25 runs.
Further, the classification tree assigns to each agent the probability
to belong to each agent type, selecting the type that hasthe highest
probability. To see whether this probability was the same
throughout the landscape, a map of the mean highest probability
was calculated (ArcMap 9.2).
4. Results
In the study area, there is a tendency towards the reduction of
the production scale. While around 7% of farmers belonged in 2005
to a higher category of production scale than in 2001, almost 30%
belonged in 2005 to a lower category. Furthermore, according to
the CBS data, between 2001 and 2005 there was a decrease of 12%of farm holdings in the entire province (around 1950 holdings).
4.1. Typology formulation
As it was mentioned before, the agent modelling objective in
this case study is to understand and simplify the different
strategies that farmers have followed and/or might follow in
terms of farm diversificationpractices and farm expansion (step1).
Two different criteria to define agent types were selected:
production scale and farmers’ views (step 2). This first distinction
reflects to some extent the role of agriculture for a farmer (life-
style vs. life-style and production). It also distinguishes farmers
with very small farms who might have a relative less relevant role
in landscape dynamics than those with bigger farms. This is
D. Valbuena et al. / Agriculture, Ecosystems and Environment 128 (2008) 27–36 30
8/13/2019 Valbuena Et Al 2008 AEE
http://slidepdf.com/reader/full/valbuena-et-al-2008-aee 5/10
partially reflected by the fact that most farmers with hobby farms
(<20 dsu) had similar views: they were not willing to expand their
production scale (84%) and they did not have a negative view on
compensation schemes for nature and landscape conservation
practices (95%).
The second distinction reflects the current and potential
probability that a farmer diversifies farm practices and/or expands
the productionscale of his/her holding. In fact, around 80%of those
who think that a future alternative is to increase the production
scale have increased the area of their farm and the milk quotabetween 2001 and 2005. On the other hand, around 17% of those
who have a negative view on participating on compensation
schemes have diversified farm practices, compared to 32% of those
with neutral view and 51% of those with a positive view. However,
there were no differences in terms of farm diversification between
those farmers with a negative and those with a neutral view on
participating on such schemes.
Based on these two criteria and the fact that most farmers did
not disagree on seeing diversification of farm practices as a means
to obtain more income, five different agent types were defined
(step 3): hobby farms (H), non-expansionist conventional (NC);
non-expansionist diversifiers (ND); expansionist conventional
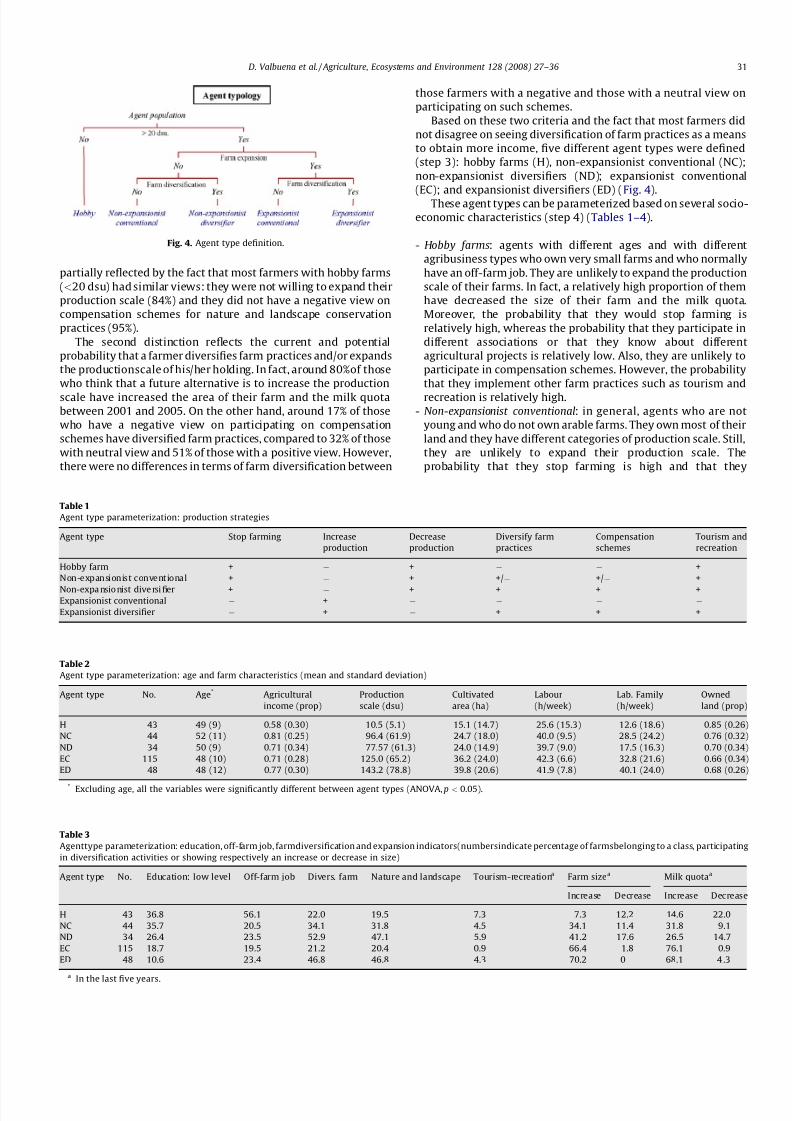
(EC); and expansionist diversifiers (ED) (Fig. 4).
These agent types can be parameterized based on several socio-
economic characteristics (step 4) (Tables 1–4).
- Hobby farms: agents with different ages and with different
agribusiness types who own very small farms and who normally
have an off-farm job. They are unlikely to expand the production
scale of their farms. In fact, a relatively high proportion of them
have decreased the size of their farm and the milk quota.
Moreover, the probability that they would stop farming is
relatively high, whereas the probability that they participate in
different associations or that they know about different
agricultural projects is relatively low. Also, they are unlikely to
participate in compensation schemes. However, the probability
that they implement other farm practices such as tourism and
recreation is relatively high.- Non-expansionist conventional: in general, agents who are not
young and who do not own arable farms. They own most of their
land and they have different categories of production scale. Still,
they are unlikely to expand their production scale. The
probability that they stop farming is high and that they
Fig. 4. Agent type definition.
Table 1
Agent type parameterization: production strategies
Agent type Stop farming Increase
production
Decrease
production
Diversify farm
practices
Compensation
schemes
Tourism and
recreation
Hobby farm + + +
Non-expansionist conventional + + +/ +/ +
Non-expa nsio nist dive rsi fier +
+ + + +Expansionist conventional +
Expansionist diversifier + + + +
Table 2
Agent type parameterization: age and farm characteristics (mean and standard deviation)
Agent type No. Age* Agricultural
income (prop)
Production
scale (dsu)
Cultivated
area (ha)
Labour
(h/week)
Lab. Family
(h/week)
Owned
land (prop)
H 43 49 (9) 0.58 (0.30) 10.5 (5.1) 15.1 (14.7) 25.6 (15.3) 12.6 (18.6) 0.85 (0.26)
NC 44 52 (11) 0.81 (0.25) 96.4 (61.9) 24.7 (18.0) 40.0 (9.5) 28.5 (24.2) 0.76 (0.32)
ND 34 50 (9) 0.71 (0.34) 77.57 (61.3) 24.0 (14.9) 39.7 (9.0) 17.5 (16.3) 0.70 (0.34)
EC 115 48 (10) 0.71 (0.28) 125.0 (65.2) 36.2 (24.0) 42.3 (6.6) 32.8 (21.6) 0.66 (0.34)
ED 48 48 (12) 0.77 (0.30) 143.2 (78.8) 39.8 (20.6) 41.9 (7.8) 40.1 (24.0) 0.68 (0.26)
* Excluding age, all the variables were significantly different between agent types (ANOVA, p < 0.05).
Table 3
Agenttype parameterization: education, off-farm job, farmdiversification and expansion indicators(numbersindicate percentage of farmsbelonging to a class, participating
in diversification activities or showing respectively an increase or decrease in size)
Agent type No. Education: low level Off-farm job Divers. farm Nature and landscape Tourism-recreationa Farm sizea Milk quotaa
Increase Decrease Increase Decrease
H 43 36.8 56.1 22.0 19.5 7.3 7.3 12.2 14.6 22.0
NC 44 35.7 20.5 34.1 31.8 4.5 34.1 11.4 31.8 9.1
ND 34 26.4 23.5 52.9 47.1 5.9 41.2 17.6 26.5 14.7
EC 115 18.7 19.5 21.2 20.4 0.9 66.4 1.8 76.1 0.9
ED 48 10.6 23.4 46.8 46.8 4.3 70.2 0 68.1 4 .3
a
In the last five years.
D. Valbuena et al. / Agriculture, Ecosystems and Environment 128 (2008) 27–36 31
8/13/2019 Valbuena Et Al 2008 AEE
http://slidepdf.com/reader/full/valbuena-et-al-2008-aee 6/10
participate in different associations or that they know about
different agricultural projects is relatively low. Although they do
not have a positive view towards compensation schemes, the
proportion of diversification of farm practices is relatively higher
than that of hobby farms.
- Non-expansionist diversifiers: agents who are neither young nor
old, mainly with livestock and intensive livestock farms. They
own small and medium farms, and they normally own most of
their land. They are unlikely to expand their production scale,
and many of them have decreased their farm size and their milk
quota. The probability that they stop farming, that they
participate in different associations, that they know aboutdifferent agricultural projects and that they diversify farm
practices is relatively high.
- Expansionist conventional: agents with different ages, and with
livestock and intensive livestock farms. They own medium and
large farms and only half of them own most of their land. The
probability that they increase the production scale of their farms
is high, and that they decrease the production scale or that they
stop farming is low. Their participation in agricultural organiza-
tions is high, excluding those for nature and landscape
conservation. The probability that they diversify farm practices
is low.
- Expansionist diversifiers: agents who are relatively young with
relatively high level of education. They own medium and large
farms with different agribusiness types. The probability that they
increase the production scale of their farms is high and that they
stop farming is low. Their participation in agricultural organiza-
tions is the highest. The probability that they diversify farm
practices is also high, mainly their participation in compensation
schemes.
4.2. Agent type spatial distribution
The common variables include age, agribusiness type, produc-
tion scale and landscape structure. In terms of age, around 40% of
the agents of type ED are less than 40 years old and of type EC are
between 40 and 50 years old. In terms of production scale, almost
42% of agents of type ND own small farms, while more than 60% of
type EC and ED own large farms. In terms of agribusiness type,
Table 4
Agent type parameterization: views, membership and acquaintance with projects (percentages)
Agent type No. Stop farming Agriculture
organization
Local parties: improve
agricultural sector
Agriculture association:
nature and landscape management
Acquaintance of different
agriculture projects
H 43 34.1 46.3 7.3 24.4 65.9
NC 44 36.4 77.3 6.8 13.6 61.4
ND 34 32.4 76.5 26.5 47.1 88.2
EC 115 6.2 89.4 18.6 16.8 84.1
ED 48 4.3 91.5 34.0 53.2 85.1
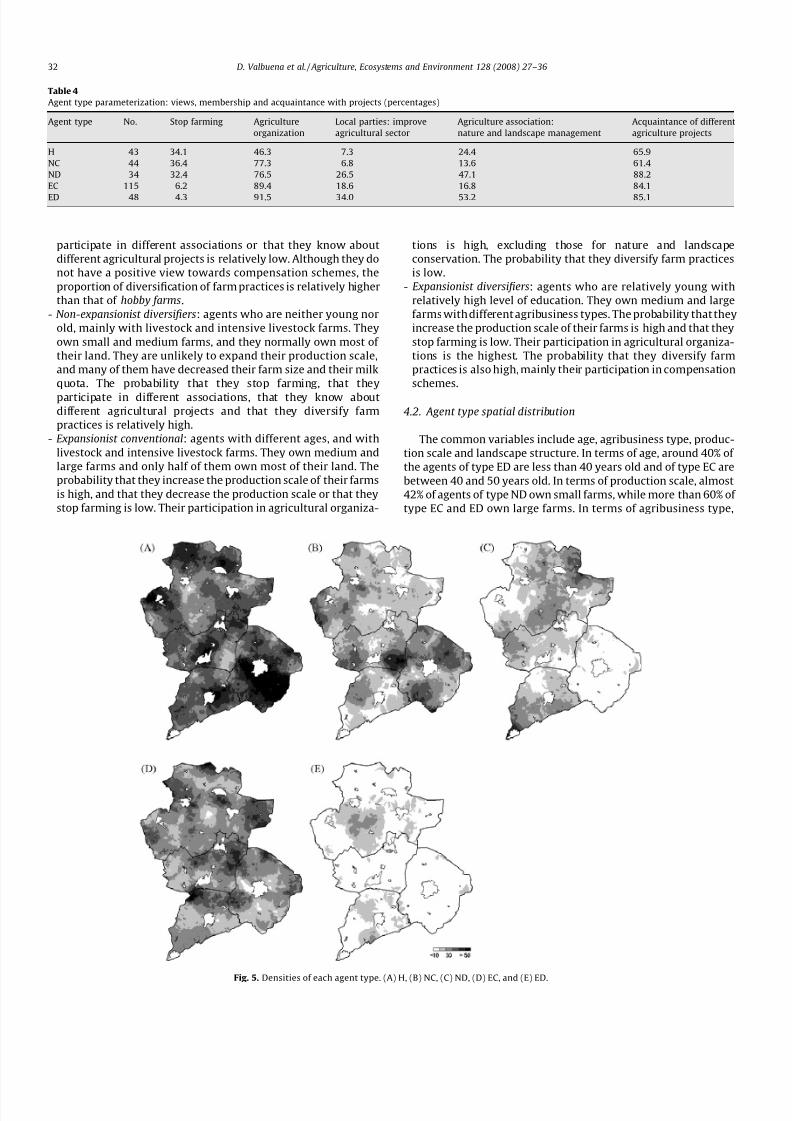
Fig. 5. Densities of each agent type. (A) H, (B) NC, (C) ND, (D) EC, and (E) ED.
D. Valbuena et al. / Agriculture, Ecosystems and Environment 128 (2008) 27–36 32
8/13/2019 Valbuena Et Al 2008 AEE
http://slidepdf.com/reader/full/valbuena-et-al-2008-aee 7/10
most of the arable farms belong to agents of type H, while about
82% of the agents of type EC own a livestock farm and relatively
more intensive farms belong to agents of type NC and ND. Finally,
about half of the agents of type H are located in postcode areas
with a proportion of nature areasbetween 5% and 20%, whileonly
29% of the agents of type ED are located in those areas. Also,
around 50% of agents of type H and 41% of those of type ND are
located in areas with small-scale agriculture—postcode areas
where parcels smaller than 2 ha represent more than 20% of the
total area—while only 32% of those of type ED are also located in
those areas.
The landscape structure is significantly related to the diversi-
fication of farm practices. Agents who have diversified farm
practices tend to be located in postcode areas higher in altitude
( Z = 1.93 p< 0.1) and with more nature ( Z = 2.02 p < 0.05)
where the average parcel size is relatively smaller ( Z = 3.45
p< 0.01) than those who have not diversified. At the same time,
some of these variables are correlated. Nature tends to be located
in higher areas (r = 0.54, p < 0.01) where the groundwater table is
lower (r = 0.25, p< 0.05). Also part of the nature areas have a
historical value in the study area (r = 0.36, p < 0.01). On the other
hand, postcode areas with a high nature density tend to have a
higher farm density (r = 0.55, p< 0.01), more hobby farms(r = 0.27, p< 0.05), less intensive livestock farms (r = 0.26,
P < 0.05) and more farms with tourism and recreational facilities
(r = 0.30, p < 0.01).
The classification process shows that each type is not equally
distributed throughout the region (step 5). This distribution is
partly caused by the spatial structure of the landscape: small-scale
agriculture towards the South-West and large-scale agriculture in
some parts in centre of the study area (Fig. 5). For example, the
density of hobby farms is higher near urban and nature areas
(Fig. 5A), where small-scale agriculture often takes place. In
contrast, the density of EC and ED is higher in areas where large-
scale agriculture occurs (Fig. 5D and E).
Excluding hobby farms, the cross-validation of the classification
tree (step 6) shows that around 50% of the agents of the detailedsurvey were correctly classified using this approach. This
percentage is higher than if the entire allocation/classification
process is carried out randomly (25%). This degree of uncertainty
was mainly caused by the overlap between different agent types.
This overlap is related to the distribution of the common variables
within each agent type. For example, the overlap between agent
types EC and ED was relatively high, making the distinction
between these two types less clear than in other cases. This
uncertainty is reflected differently among the different agent
types. As it was mentioned before, an agent is assigned to the type
in which he obtained the highest probability. Thus, the highest
probability that an agent belong to a particular type varied among
types. In particular, about 66% of the agents of EC had a probability
to belong to this agent type lower than 60%, while about 88% of those of ED had a probability higher than 80%. Because the agent
distribution is not homogenous throughout the region, then the
uncertainty of the classification process throughout the region is
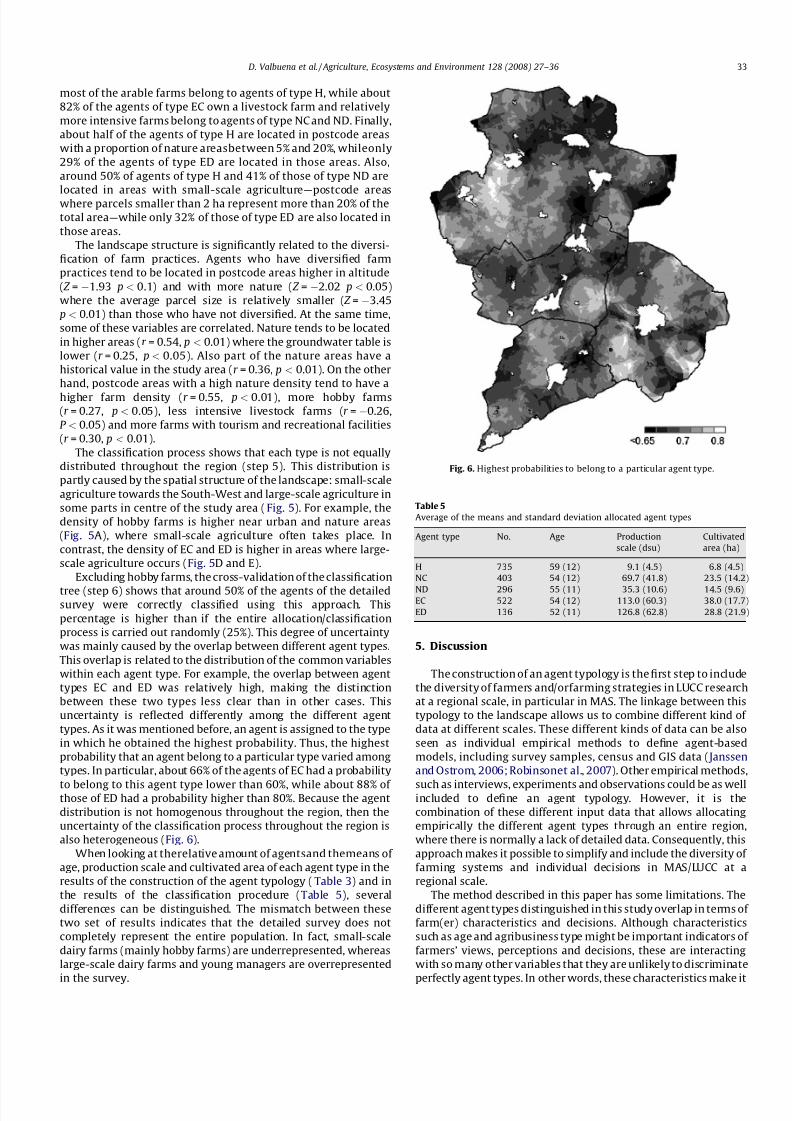
also heterogeneous (Fig. 6).
When looking at therelative amount of agentsand themeans of
age, production scale and cultivated area of each agent type in the
results of the construction of the agent typology (Table 3) and in
the results of the classification procedure (Table 5), several
differences can be distinguished. The mismatch between these
two set of results indicates that the detailed survey does not
completely represent the entire population. In fact, small-scale
dairy farms (mainly hobby farms) are underrepresented, whereas
large-scale dairy farms and young managers are overrepresented
in the survey.
5. Discussion
The construction of an agent typology is the first step to include
the diversity of farmers and/orfarming strategies in LUCC research
at a regional scale, in particular in MAS. The linkage between this
typology to the landscape allows us to combine different kind of
data at different scales. These different kinds of data can be also
seen as individual empirical methods to define agent-based
models, including survey samples, census and GIS data ( Janssen
and Ostrom, 2006; Robinsonet al., 2007). Other empirical methods,
such as interviews, experiments and observations could be as wellincluded to define an agent typology. However, it is the
combination of these different input data that allows allocating
empirically the different agent types through an entire region,
where there is normally a lack of detailed data. Consequently, this
approach makes it possible to simplify and include the diversity of
farming systems and individual decisions in MAS/LUCC at a
regional scale.
The method described in this paper has some limitations. The
different agent types distinguished in this study overlap in terms of
farm(er) characteristics and decisions. Although characteristics
such as age and agribusiness type might be important indicators of
farmers’ views, perceptions and decisions, these are interacting
with so many other variables that they are unlikely to discriminate
perfectly agent types. In other words, these characteristics make it
Fig. 6. Highest probabilities to belong to a particular agent type.
Table 5
Average of the means and standard deviation allocated agent types
Agent type No. Age Production
scale (dsu)
Cultivated
area (ha)
H 735 59 (12) 9.1 (4.5) 6.8 (4.5)
NC 403 54 (12) 69.7 (41.8) 23.5 (14.2)
ND 296 55 (11) 35.3 (10.6) 14.5 (9.6)EC 522 54 (12) 113.0 (60.3) 38.0 (17.7)
ED 136 52 (11) 126.8 (62.8) 28.8 (21.9)
D. Valbuena et al. / Agriculture, Ecosystems and Environment 128 (2008) 27–36 33

8/13/2019 Valbuena Et Al 2008 AEE
http://slidepdf.com/reader/full/valbuena-et-al-2008-aee 8/10
possible to distinguish general farming strategies at a regional
scale, but describing the differences of socio-economic character-
istics between these strategies is difficult. This is in line with the
statement of Vanclay et al. (2006) that types always overlap
because the vast diversity of farm(er)s.
Views and attitudes of farmers are assumed to have a major
influence on land-use decisions and strategies (Fairweather and
Keating, 1994; Willock et al., 1999a; Busck, 2002; Sharpley and
Vass, 2006). However, the data showed exceptions. For example,
althoughsome agents were not supposed to diversifytheirfarming
practices based on their views, they did it in reality. This supports
the claim of Burton and Wilson (2006) that farmers have different
identities, depending on the circumstances when they take their
decisions. Therefore, typologies do not represent reality perfectly,
however, they are relevant tools whose use can facilitate our
understanding of land-use dynamics (McKinney, 1950; Jollivet,
1965; Perrot and Landais, 1993a; Fish et al., 2003; Vanclay et al.,
2006).
The method presentedin this paper depends on the amount and
quality of the data. Thus, it requires a set of common variables
through whichdifferent kinds of data canbe linked. In addition,the
information that farmers supply to registration systems might not
always match with the real data (van der Ploeg, 2003). Related tothis, a detailed sample survey that tries to cover a whole region
does not necessarily represent the entire population, leading to a
mismatch between the detailed sample survey and the statistical
data used for allocation/classification.
Nevertheless, the agent typology formulated for the study area
included many of the interactions that have been described in
literature between farmers’ views, farm(er) characteristics and
currentrural processes suchas diversificationof farm practicesand
farm expansion (e.g. Kelly and Ilbery, 1995; Austin et al., 1996;
Willock et al., 1999a; Knickel and Renting, 2000; Wilson and Hart,
2000; Ondersteijn et al., 2003; Knowler and Bradshaw, 2007;
Jongeneel et al., 2008). Moreover, most of agent types defined in
this researchare related to one or to the combination of some of the
identities that currently define European farmers (Burton andWilson, 2006). All this suggests that the agent typology presented
in this paper has been able to capture the diversity of land-use
decisions and strategies occurring in rural landscapes.
The analyses of the case study also confirm previous studies
that showed that spatial location of a farm can influence land-use
decisions and therefore farming strategies (Bryant and Johnston,
1992; Luttik and van der Ploeg, 2004; Jongeneel et al., 2008). These
results also showed that the spatial distribution of such decisions
and strategies are not randomly distributed throughout the
landscape, which is in accordance with the findings of Kobrich
et al. (2003). By defining agent typology and linking it with the
landscape, the approach proposed in this paper allows us to link
agents’ decisions to their environment, which is one of the key
aspects of LUCC/MAS (Balmann, 2000; Parker and Berger, 2002;Evans and Kelley, 2004). The empirical definition of an agent
typology differs with theagentdefinition of most MAS that assume
more ‘‘stereotype’’ agents that assume very different character-
istics and decisions. In fact, the results suggest that defining
‘‘stereotype’’ agents may oversimplify the real diversity in
decision-making, restricting their implementation to more theo-
retical problems.
According to Geertman and Stillwell (2003), Uran and Janssen
(2003) and McIntosh et al. (2007), the lack of clarity and flexibility
represents a barrier to implement land-use models and decisions
support-systems in planning and policy-making processes.
Because of its clarity and flexibility, the approach described in
this paper moves thus towards a better adoption of MAS/LUCC in
such processes. The flexibility of this approach makes it also
suitable to be used in different cases studies, where farming
systems and rural dynamics might be different.
In conclusion, the method described in this paper is a simple
and straightforward approach that combines different empirical
methods to built agents-based models. This combination, together
with the spatial definition of different agent types, allows us to
parameterize, allocate and validate different agent types in an
entire region. This empirical method is a step forward to include
the diversity of land-use decisions and strategies in MAS/LUCC at a
regional scale, as well as the spatial dimension where these
decisions take place.
Acknowledgements
The authors gratefully acknowledge Nico Polman and Roel
Jongeneel for allowing us to use their dataset; the LEI, in particular
Tom Kuhlman for the access to the Farm Accountancy Data; to the
Province of Gelderland for proving us with the spatial data; and to
the three anonymous referees who provide us with relevant
comments to improve this paper.
References
Ajzen, I.,1991. The theory of planned behavior. Organizational Behavior and HumanDecision Processes 50, 179–211.
Arthur, W.B., 1994. Inductive reasoning and bounded rationality. American Eco-nomic Review 84, 406–411.
Austin, E.J., Deary, I.J., Gibson, G.J., McGregor, M.J., Dent, J.B., 1996. Attitudes andvaluesof Scottish farmers: ‘‘Yeoman’’and ‘‘entrepreneur’’ as factors, not distincttypes. Rural Sociology 61, 464–474.
Balmann, A., 2000. Modeling land use with multi-agent systems. Perspectives forthe analysis of agricultural policies.In: IIFET 2000: Microbehavior and Macro-results. Proceedings. International Institute of Fisheries Economics and Trade,Oregon State University, Corvallis, Oregon, USA.
Benvenuti, B., 1961. Farming in cultural change. Van Gorcum, Assen.Berdegue, J., Escobar, G., 1990. Efectos de la metodologıa de tipificacion en la
investigacion de sistemas de produccion. In: Escobar, G., Berdegue, J. (Eds.), Ti-pificacion de Sistemas de Produccion. RIMISP, Santiago de Chile, pp. 251–265.
Berger, T., Schreinemachers, P., 2006. Creating agents and landscapes for MAS from
random samples. Ecology and Society 11, 19.Berkhout, P., Bruchem, C. van, 2005. Agricultural economic report 2005 of the
Netherlands: summary. In: LEI (Ed.), Den Haag.Bonabeau, E., 2002. Agent-based modeling: methods and techniques for simulating
human systems. Proceedings of National Academy of Sciences 99, 7280–7287.Bousquet, F., Le Page, C., Bakam, I., Takforyan, A., 2001. Multiagent simulations of
hunting wild meat in a village in eastern Cameroon. Ecological Modelling 138,331–346.
Bowler, I., 1992. ‘Sustainable agriculture’ as an alternative path of farm businessdevelopment.In: Bowler, I., Bryant, C.R.,Nellis, M.D. (Eds.), Contemporary RuralSystems in Transitions. Redwood Press, Melksham.
Brown, D.G., 2005. Agent-based models. In: Geist, H.J. (Ed.), Our Earth’s ChangingLand: An Encyclopedia of Land-Use and Land-Cover Change. Greenwood Press.
Bryant, C.R., Johnston, T.R.R., 1992. Agriculture in the City’s Countryside. BelhavenPress, London.
Burton, R.J.F., Wilson, G.A., 2006. Injecting social psychology theory into concep-tualisations of agricultural agency: towards a post-productivist farmer self-identity? Journal of Rural Studies 22, 95–115.
Busck, A.G., 2002. Farmers’ landscape decisions: relationships between farmers’
values and landscape practices. Sociologia Ruralis 42, 233–249.Castella, J.-C., Boissau, S., Trung, T.N., Quang, D.D., 2005. Agrarian transition and
lowland-upland interactions in mountain areas in northern Vietnam: applica-tion of a multi-agent simulation model. Agricultural Systems 86, 312–332.
Commandeur, M.A.M., 2005. Styles of pig farming and family labour in the Nether-lands. Journal of Comparative Family Studies 36, 391–398.
Crawford, T.W., Messina, J.P., Manson, S.M., David, O.S., 2005. Complexity science,complex systems,and land-useresearch.Environment and Planning B-Planning& Design 32, 792–798.
de Lauwere, C.C., 2005. The role of agricultural entrepreneurship in Dutch agri-culture of today. Agricultural Economics 33, 229–238.
Escobar, G., Berdegue, J., 1990. Conceptos y metodologıas para la tipificacion d esistemas de finca: la experiencia de RIMISP. In: Escobar, G., Berdegue, J.(Eds.), Tipificacion de Sistemas de Produccion. RIMISP, Santiago de Chile, pp.13–43.
Evans, N.J.,Ilbery, B.W.,1989. A conceptual frameworkfor investigating farm-basedaccommodation and tourism in Britain. Journal of Rural Studies 5, 257–266.
Evans, T.P., Kelley, H., 2004. Multi-scale analysis of a household level agent-based
model of landcover change. Journal of Environmental Management 72, 57–72.
D. Valbuena et al. / Agriculture, Ecosystems and Environment 128 (2008) 27–36 34
8/13/2019 Valbuena Et Al 2008 AEE
http://slidepdf.com/reader/full/valbuena-et-al-2008-aee 9/10
Fairweather, J.R., Keating, N.C., 1994. Goals and management styles of New Zealandfarmers. Agricultural Systems 44, 181–200.
Ferrand, N., 1996. Modeling and supporting multi-actor spatial planning usingmulti-agents systems. In: Third International Conference Integrating GIS andEnvironmental Modeling, Santa Fe.
Fish, R., Seymour, S., Watkins, C., 2003. Conserving English landscapes: landmanagers and agri-environmental policy. Environment and Planning A 35,19–41.
Fohrer, N., Moller, D., Steiner, N., 2002. An interdisciplinary modelling approach toevaluate theeffectsof land usechange.Physicsand Chemistry ofthe Earth,Parts
A/B/C 27, 655–662.Gasson, R., 1973. Goals and values of farmers. Journal of Agricultural Economics 24,
521–542.Geertman, S., Stillwell, J., 2003. Planning support systems in practice. In: Advances
in Spatial Science, Springer Verlag, Berlin, p. 578.Gimblett, H.R., 2002. Integrating geographic information systems and agent-based
technologies for modeling and simulating social and ecological phenomena. In:Gimblett, H.R. (Ed.), Integrating Geographic Information Systems and Agent-based Modeling Techniques for Simulating Social and Ecological Processes.Oxford University Press, New York, pp. 1–20.
Girard, N., 2006. Categoriser les practiques d’agriculteurs pour reformuler unprobleme en partenariat: une proposition methodologique. Cahiers Agricul-tures 15, 261–272.
Graveland,C., van Rheenen,T., Brouwer,F., 2004.Countrystudy for the Netherlands.In: BiofACT, LEI, The Hague.
Guillaumin, A., Bousquet, D., Villaret, A., 2004. Multifonctionnalite de l’agriculture:demandes locales et attitudes des agriculteurs. In: Laurent, C., Remy, J. (Eds.),Les Cahiers de la Multifonctionnalite. INRA-CEMAGREF-CIRAD.
Happe, K., Kellermann, K., Balmann, A., 2006. Agent-based analysis of agricultural
policies: an illustration of the agricultural policy simulator AgriPoliS, its adapta-tion and behavior. Ecology and Society 11, 49., http://www.ecologyandsociety.org/vol11/iss1/art49/.
Huigen, M.G.A., 2004. First principles of the MameLuke multi-actor modellingframeworkfor land use change, illustrated with a Philippine case study.Journalof Environmental Management 72, 5–21.
Ilbery, B.W., 1978. Agricultural decision-making: a behavioural perspective. Pro-gress in Human Geography 2, 448–466.
Janssen, M.A., Ostrom, E., 2006. Empirically based, agent-based models. Ecology andSociety 11, 37–49.
Jepsen, M.R., Leisz, S., Rasmussen, K., Jakobsen, J., Møller-Jensen, L., Christiansen, L.,2006. Agent-based modelling of shifting cultivation field patterns, Vietnam.International Journal of Geographical Information Science 20, 1067–1085.
Jollivet, M., 1965. D’une methode typologique pour l’etude des societes rurales.Revue Francaise de Sociologie VI, 33–54.
Jongeneel, R., Polman, N.N., Slangen, L., 2005. Multifunctional alternatives foragriculture in changing landscapes: understanding multifunctionality in theWinterswijk region-case. In: Multifunctionality of Landscapes, Germany.
Jongeneel, R.A., Polman, N.B.P., Slangen, L.H.G., 2008. Why are Dutch farmers g oingmultifunctional? Land Use Policy 25, 81–94.Kelly, C.E., Ilbery, B.W., 1995. Defining and examining rural diversification – a
framework for analysis. Tijdschrift Voor Economische En Sociale Geografie 86,177–185.
Knickel, K., Renting, H., 2000. Methodological and conceptual issues in the study of multifunctionality and rural development. Sociologia Ruralis 40, 512–528.
Knowler, D., Bradshaw, B., 2007. Farmers’ adoption of conservation agriculture: areview and synthesis of recent research. Food Policy 32, 25–48.
Kobrich, C., Rehman, T., Khan, M., 2003. Typification of farming systems for con-structing representative farm models: two illustrations of the application of multi-variate analyses in Chileand Pakistan. Agricultural Systems 76, 141–157.
Kristensen, S.P., 2003. Multivariate analysis of landscape changes and farm char-acteristicsin a study area in central Jutland,Denmark.Ecological Modelling 168,303–318.
Lambin, E.F., Geist, H.J., 2001. Global land-use and cover change: What have welearned so far? Global Change Newsletter No. 46, 27–30.
Landais, E.,1998. Modelling farm diversity:new approaches to typology building inFrance. Agricultural Systems 58, 505–527.
Legendre, P., Legendre, L., 1998. Numerical Ecology. Elsevier, Amsterdam.Lesschen, J.P., Verburg, P.H., Staal, S.J., 2005. Statistical methods for analysing the
spatial dimension of changes in land use and farming systems. In: LUCC, IHDP,IGBP (Eds.), LUCC Report Series 7.
Ligtenberg, A., Wachowicz, M., Bregt, A.K., Beulens, A., Kettenis, D.L., 2004. A designand application of a multi-agent system for simulation of multi-actor spatialplanning. Journal of Environmental Management 72, 43–55.
Luijten, J.C., 2003. A systematic method for generating land use patterns usingstochastic rules and basic landscape characteristics: results for a Colombianhillside watershed. Agriculture, Ecosystems & Environment 95, 427–441.
Luttik, J., van der Ploeg, B., 2004. Functions of agriculture in urban society in theNetherlands. In: Brouwer, F. (Ed.), Sustaining Agriculture and the Rural Envir-onment: Governance, Policy and Multifunctionality. Edward Elgar Publishing,Cheltenham, UK, pp. 204–222.
Mastboom, J.M.J., 1996. Protoindustrialization and agriculture in the eastern Neth-erlands. Social Science History 20, 235–258.
Matthews, R., 2006. The People and Landscape Model (PALM): towards full inte-gration of human decision-making and biophysical simulation models. Ecolo-gical Modelling 194, 329–343.
Matthews, R., Gilbert, N., Roach, A., Polhill, J., Gotts, N., 2007. Agent-based land-usemodels: a review of applications. Landscape Ecology 22, 1447–1459.
McIntosh, B.S., Seaton, R.A.F., Jeffrey, P., 2007. Tools to think with? Towards under-standing the use of computer-based support tools in policy relevant research.Environmental Modelling & Software 22, 640–648.
McKinney, J.C., 1950. The role of constructive typology in scientific sociologicalanalysis. Social Forces 28, 235–240.
Meert, H., Van Huylenbroeck, G., Vernimmen, T., Bourgeois, M., van Hecke, E., 2005.Farm household survival strategies and diversification on marginal farms.
Journal o f Rural Studies 2 1, 81–97.
Monticino, M., Acevedo, M., Callicott, B., Cogdill, T., Lindquist, C., 2007. Coupledhuman and natural systems: a multi-agent-based approach. EnvironmentalModelling & Software 22, 656–663.
Morris, C., Potter, C., 1995. Recruiting the new conservationists: farmers’adoption of agri-environmental schemes in the UK. Journal of Rural Studies11, 51–63.
Oerlemans, N., van Well, E., Guldemond, A., 2004. Agrarische natuurverenigingenaan de slag: een tweede verkenning naar de rol van agrarische natuutver-enigingen in natuurbeheer. In: Centrum voor Landbouw en Milieu, Culem-borg, p. 30.
Ondersteijn, C.J.M., Giesen, G.W.J., Huirne, R.B.M., 2003. Identification of farmercharacteristics and farm strategies explaining changes in environmental man-agement and environmental and economic performance of dairy farms. Agri-cultural Systems 78, 31–55.
Parker, D.C., Berger, T., 2002. Synthesis and discussion. In: Parker, D.C., Berger, T.,Manson, S.M. (Eds.), Agent-based models of land-use and land-coverchange: report and review of an international workshop, Irvine, California,pp. 79–88.
Parker, D.C., Manson, S.M., Janssen, M.A., Hoffmann, M.J., Deadman, P., 2003. Multi-
agent systems for the simulation of land-use and land-cover change: a review.Annals of the Association of American Geographers 93, 314–337.
Perrot, C., Landais, E., 1993a. Comment modeliser la diversite des exploitationsagricoles? Les Cahiers de la Recherche Developpement 24–40.
Perrot, C., Landais, E., 1993b. Exploitations agricoles: pourquoi poursuivre larecherche sur les methodes typologiques? Les Cahiers de la Recherche Devel-oppement 13–23.
Primdahl, J., 1999. Agricultural landscapes as places of production and for living inowner’s versus producer’s decision making and the implications for planning.Landscape and Urban Planning 46, 143–150.
Provinciale Statenvan Gelderland,2005a. Streekplan Gelderland 2005:kansen voorde regio’s, p. 161.
Provinciale Staten van Gelderland, 2005b. Grond voor verandering: reconstructieAchterhoek en Liemers, p. 134.
Rindfuss, R.R., Walsh, S.J., Turner II, B.L., Fox, J., Mishra, V., 2004. Developing ascience of land change: challenges and methodological issues. Proceedings of National Academy of Sciences 101, 13976–13981.
Robinson, D.T., Brown, D.G.,Parker, D.C.,Schreinemachers, P., Janssen,M.A., Huigen,
M., Wittmer, H., Gotts, N., Promburom, P., Irwin, E., Berger, T., Gatzweiler, F.,Barnaud, C., 2007. Comparison of empirical methods for building agent-basedmodels in land use science. Journal of Land Use Science 2, 31–55.
Rokeach, M., 1968. Theory of organization and change within value-attitudesystems. Journal of Social Issues 24, 13–33.
Sawyer, R.K., 2003. Artificial societies: multiagent systems and the micro-macrolink in sociological theory. Sociological Methods Research 31, 325–363.
Schmitzberger, I., Wrbka, T., Steurer, B., Aschenbrenner, G., Peterseil, J., Zechme-ister, H.G., 2005. How farming styles influence biodiversity maintenance inAustrian agricultural landscapes. Agriculture, Ecosystems & Environment108, 274–290.
Sharpley, R., Vass, A., 2006. Tourism, farming and diversification: an attitudinalstudy. Tourism Management 27, 1040–1052.
Siebert, Rosemarie, Toogood, Mark, Knierim, Andrea, 2006. Factors affecting Eur-opeanfarmers’participation in biodiversitypolicies. Sociologia Ruralis 46, 318–340.
Simon, H.A., 1955. A behavioral model of rational choice. The Quarterly Journal of Economics 69, 99–118.
Soares-Filho, B.S., Coutinho Cerqueira, G., Lopes Pennachin, C., 2002. DINAMICA – a
stochastic cellular automata model designed to simulate the landscapedynamics in an Amazonian colonization frontier. Ecological Modelling 154,217–235.
Speybroeck, N., Berkvens, D., Mfoukou-Ntsakala, A., Aerts, M., Hens, N., Van Huy-lenbroeck, G., Thys, E., 2004. Classification trees versus multinomial models inthe analysis of urbanfarming systems in Central Africa. Agricultural Systems 80,133–149.
Uran, O., Janssen, R., 2003. Why are spatial decision support systems not used?Some experiences from the Netherlands. Computers, Environment and UrbanSystems 27, 511–526.
van der Ploeg, J.D., 1994. Styles of farming: an introductory note on concepts andmethodology. In: van der Ploeg, J.D.,Long, A. (Eds.), Practice and Perspectives of Endogenous Rural Development. Van Gorcum, Assen, pp. 7–31.
van der Ploeg, J.D., 2003. The virtual farmer. Royal van Gorcum, Assen.van der Veen, A., Otter, H.S., 2001. Land use changes in regional economic theory.
Environmental Modeling and Assessment 6, 145–150.Van Doorn, A., Bakker, M., 2007. The destination of arable land in a marginal
agricultural landscape in South Portugal: an exploration of land use changedeterminants. Landscape Ecology 22, 1073–1087.
D. Valbuena et al. / Agriculture, Ecosystems and Environment 128 (2008) 27–36 35

8/13/2019 Valbuena Et Al 2008 AEE
http://slidepdf.com/reader/full/valbuena-et-al-2008-aee 10/10
van Horne, P., Prins, H., 2002. Development of dairy farming in the Netherlands inthe period 1960–2000. In: LEI, The Hague, p. 24.
Vanclay, F., Howden, P., Mesiti, L., Glyde, S., 2006. The social and intellectualconstruction of farming styles: testing Dutch ideas in Australian agriculture.Sociologia Ruralis 46, 61–82.
Verburg, P.H., 2006. Simulating feedbacks in land use and land cover changemodels. Landscape Ecology V21, 1171–1183.
Verburg, P.H.,Soepboer,W., Veldkamp,A., Limpiada,R., Espaldon,V., Mastura, S.S.A.,2002. Modeling the spatial dynamics of regional land use: The CLUE-S model.Environmental Management 30, 391–405.
Wildenbeest, G., 1989. Recent farmers’ protest in a Dutch municipality: the legacyof the past. In: Boissevain, J., Verrips, J. (Eds.), Dutch Dilemmas: Antropologistslook at the Netherlands. Van Gorcum, Assen, pp. 70–88.
Willock, J., Deary, I.J., Edwards-Jones, G., Gibson, G.J., McGregor, M.J., Sutherland, A.,Dent, J.B., Morgan, O., Grieve, R., 1999a. The role of attitudes and objectives infarmer decision making: business and environmentally-oriented behaviour inScotland. Journal of Agricultural Economics 50, 286–303.
Willock, J., Deary, I.J.,McGregor, M.M.,Sutherland, A., Edwards-Jones,G., Morgan, O.,Dent, B., Grieve, R., Gibson, G., Austin, E., 1999b. Farmers’ attitudes, objectives,behaviors, and personality traits: the Edinburgh study of decision making onfarms. Journal of Vocational Behavior 54, 5–36.
Wilson, G.A., 2007. Multifunctional Agriculture: A Transition Theory Perspective.Cromwell Press, Trowbridge.
Wilson, G.A., Hart, K., 2000. Financial imperative or conservation concern? EUfarmers’ motivations for participation in voluntary agri-environmentalschemes. Environment and Planning A 32, 2161–2185.
D. Valbuena et al. / Agriculture, Ecosystems and Environment 128 (2008) 27–36 36