wwu statistical yearbook 2011 - uni-muenster.de · 9 < // 01 profile // lesezeichen > budget...
TRANSCRIPT
1 <
WW
U s
tatis
tical
yea
rboo
k 20
11 //
3 <
Fore
wor
d //
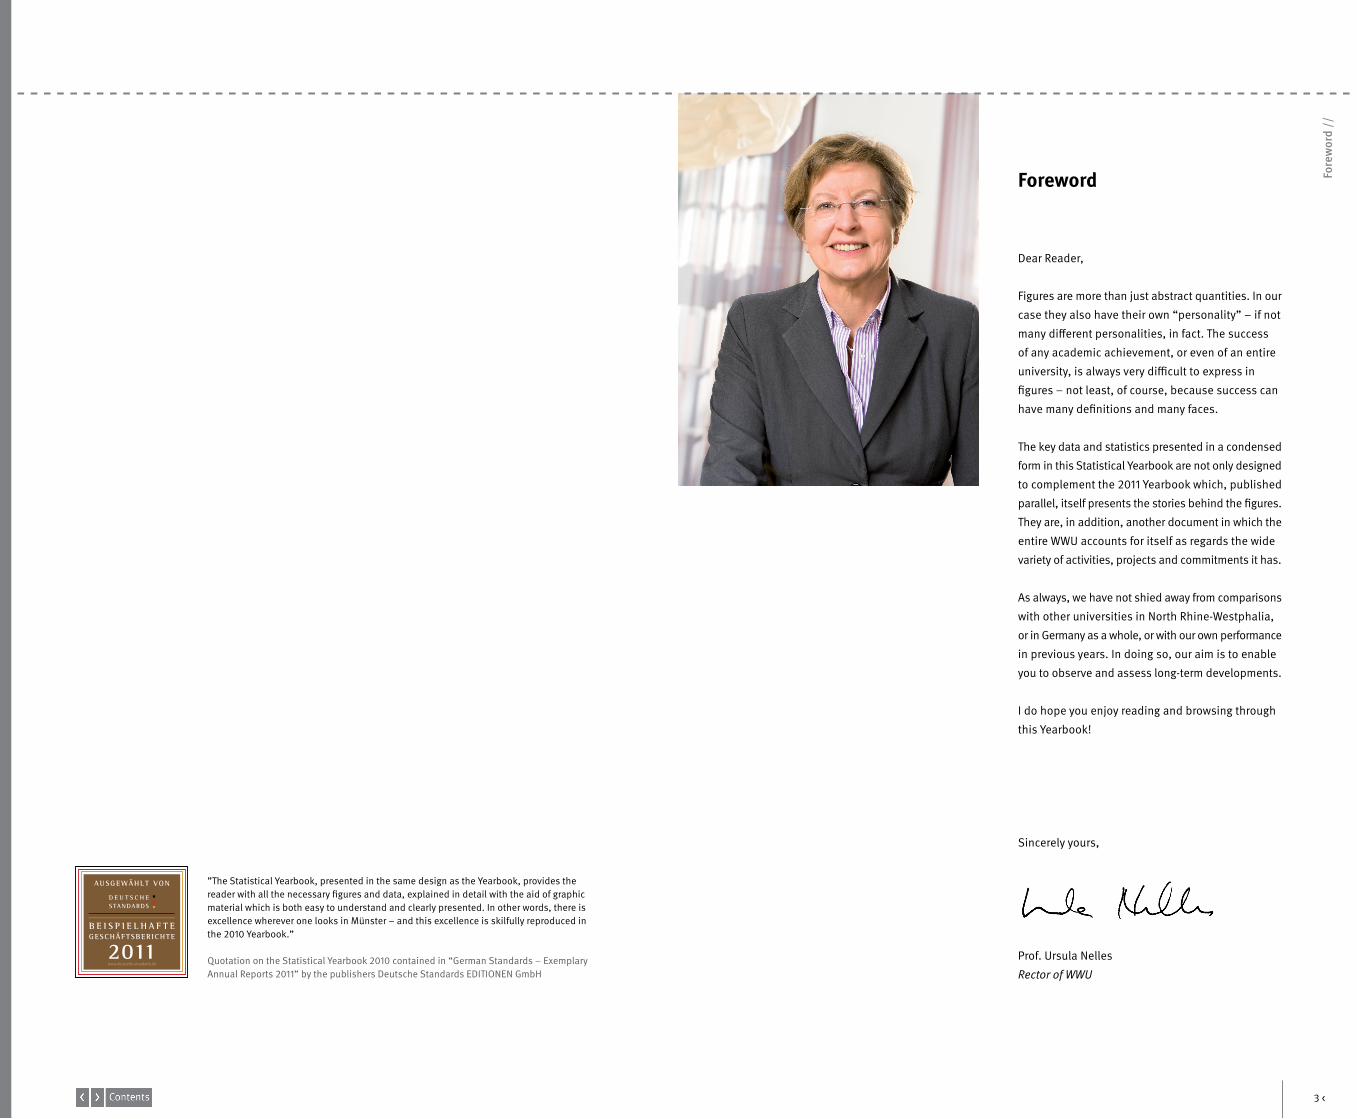
Foreword
Dear Reader,
Figures are more than just abstract quantities. In our
case they also have their own “personality” – if not
many different personalities, in fact. The success
of any academic achievement, or even of an entire
university, is always very difficult to express in
figures – not least, of course, because success can
have many definitions and many faces.
The key data and statistics presented in a condensed
form in this Statistical Yearbook are not only designed
to complement the 2011 Yearbook which, published
parallel, itself presents the stories behind the figures.
They are, in addition, another document in which the
entire WWU accounts for itself as regards the wide
variety of activities, projects and commitments it has.
As always, we have not shied away from comparisons
with other universities in North Rhine-Westphalia,
or in Germany as a whole, or with our own performance
in previous years. In doing so, our aim is to enable
you to observe and assess long-term developments.
I do hope you enjoy reading and browsing through
this Yearbook!
Sincerely yours,
Prof. Ursula Nelles
Rector of WWU
”The Statistical Yearbook, presented in the same design as the Yearbook, provides the reader with all the necessary figures and data, explained in detail with the aid of graphic material which is both easy to understand and clearly presented. In other words, there is excellence wherever one looks in Münster – and this excellence is skilfully reproduced in the 2010 Yearbook.”
Quotation on the Statistical Yearbook 2010 contained in “German Standards – Exemplary Annual Reports 2011” by the publishers Deutsche Standards EDITIONEN GmbH
5 <
cont
ents
//
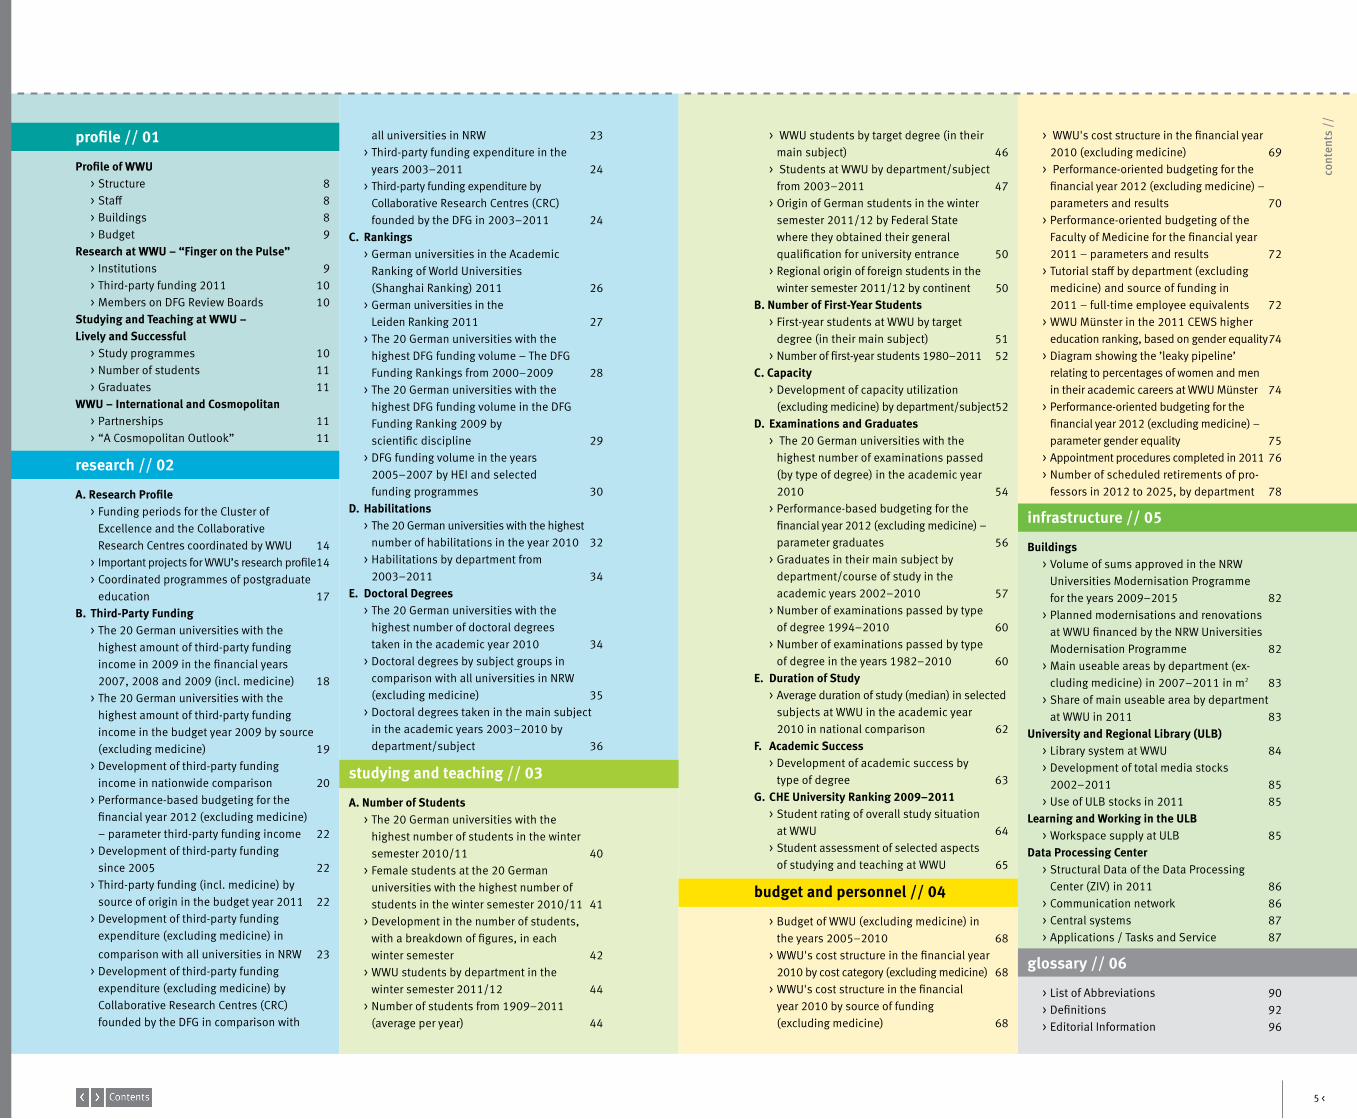
profile // 01
Profile of WWU> Structure 8> Staff 8> Buildings 8> Budget 9
Research at WWU – “Finger on the Pulse”> Institutions 9> Third-party funding 2011 10> Members on DFG Review Boards 10
Studying and Teaching at WWU – Lively and Successful
> Study programmes 10> Number of students 11> Graduates 11
WWU – International and Cosmopolitan> Partnerships 11> “A Cosmopolitan Outlook” 11
research // 02
A. Research Profile> Funding periods for the Cluster of Excellence and the Collaborative Research Centres coordinated by WWU 14> Important projects for WWU’s research profile 14> Coordinated programmes of postgraduate
education 17B. Third-Party Funding
> The 20 German universities with the highest amount of third-party funding income in 2009 in the financial years 2007, 2008 and 2009 (incl. medicine) 18> The 20 German universities with the highest amount of third-party funding income in the budget year 2009 by source (excluding medicine) 19> Development of third-party funding income in nationwide comparison 20> Performance-based budgeting for the
financial year 2012 (excluding medicine) – parameter third-party funding income 22
> Development of third-party funding since 2005 22> Third-party funding (incl. medicine) by source of origin in the budget year 2011 22> Development of third-party funding expenditure (excluding medicine) in
comparison with all universities in NRW 23> Development of third-party funding
expenditure (excluding medicine) by Collaborative Research Centres (CRC)
founded by the DFG in comparison with
all universities in NRW 23> Third-party funding expenditure in the years 2003–2011 24> Third-party funding expenditure by Collaborative Research Centres (CRC)
founded by the DFG in 2003–2011 24C. Rankings
> German universities in the Academic Ranking of World Universities (Shanghai Ranking) 2011 26> German universities in the Leiden Ranking 2011 27> The 20 German universities with the highest DFG funding volume – The DFG Funding Rankings from 2000–2009 28> The 20 German universities with the highest DFG funding volume in the DFG Funding Ranking 2009 by scientific discipline 29> DFG funding volume in the years 2005–2007 by HEI and selected funding programmes 30
D. Habilitations> The 20 German universities with the highest
number of habilitations in the year 2010 32> Habilitations by department from 2003–2011 34
E. Doctoral Degrees> The 20 German universities with the highest number of doctoral degrees taken in the academic year 2010 34> Doctoral degrees by subject groups in
comparison with all universities in NRW (excluding medicine) 35
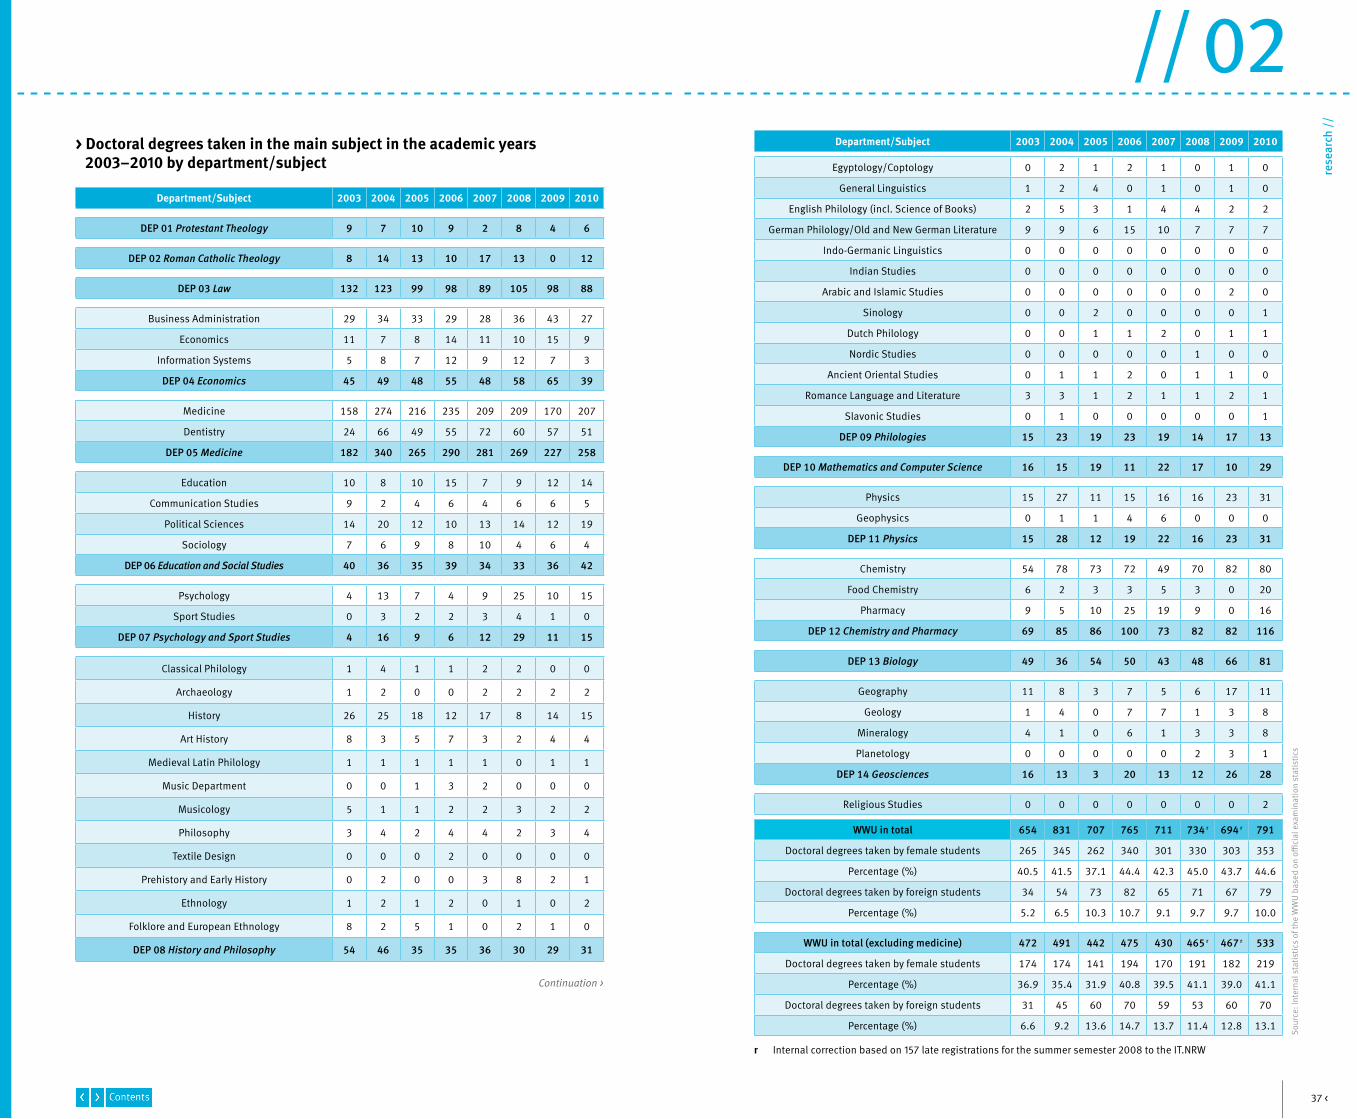
> Doctoral degrees taken in the main subject in the academic years 2003–2010 by department/subject 36
studying and teaching // 03
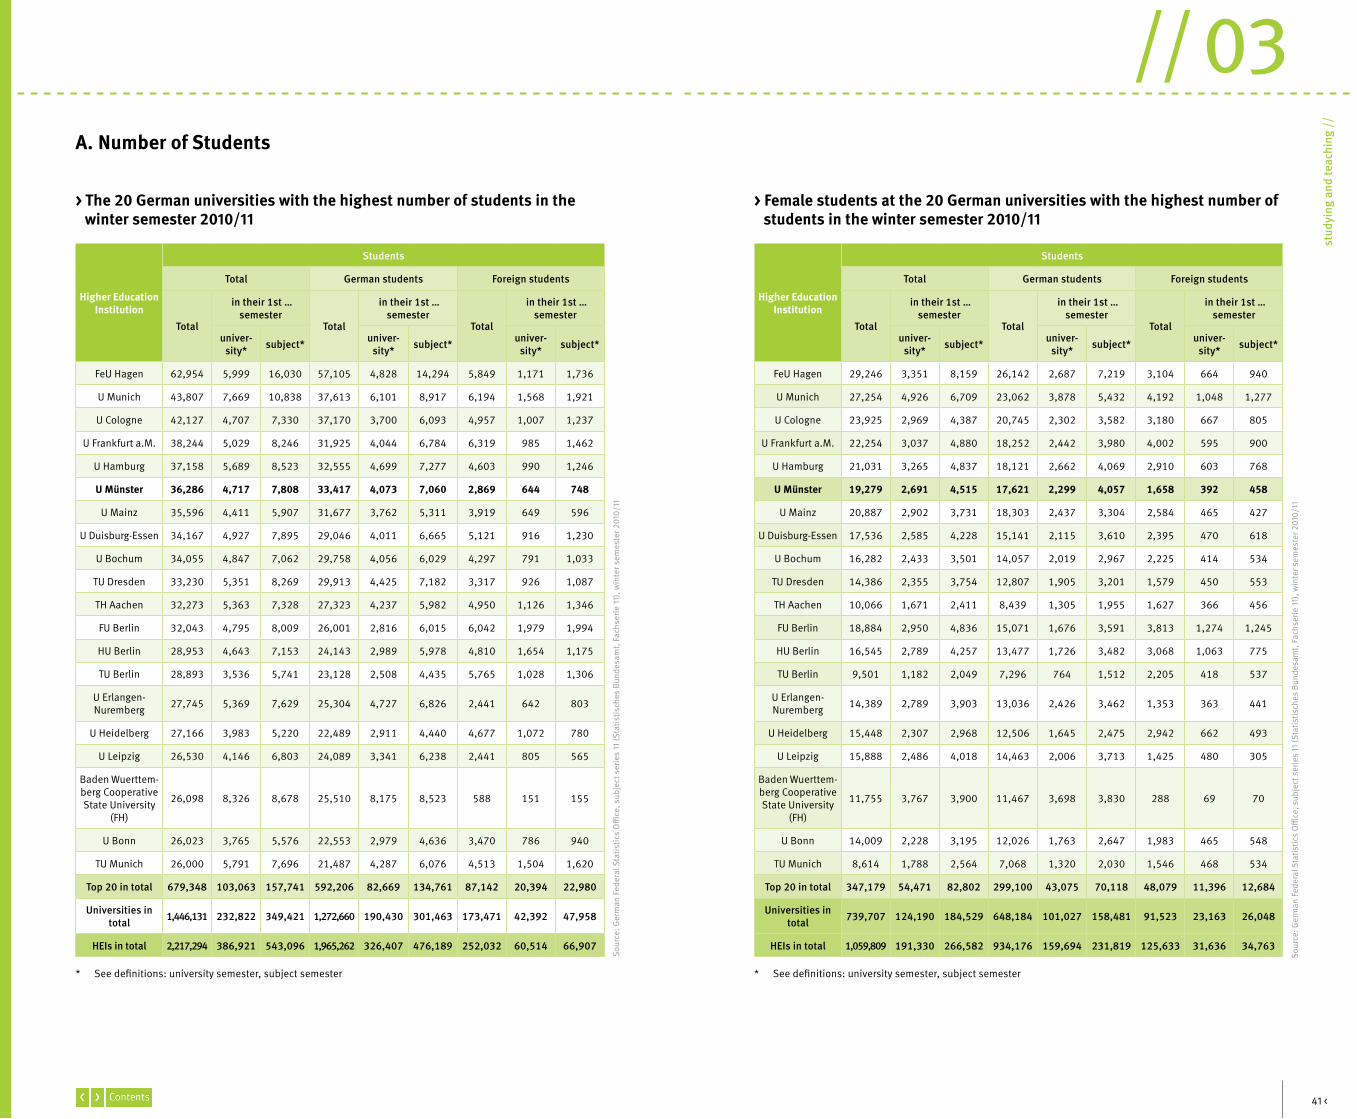
A. Number of Students> The 20 German universities with the highest number of students in the winter semester 2010/11 40> Female students at the 20 German universities with the highest number of students in the winter semester 2010/11 41> Development in the number of students, with a breakdown of figures, in each winter semester 42> WWU students by department in the winter semester 2011/12 44> Number of students from 1909–2011 (average per year) 44
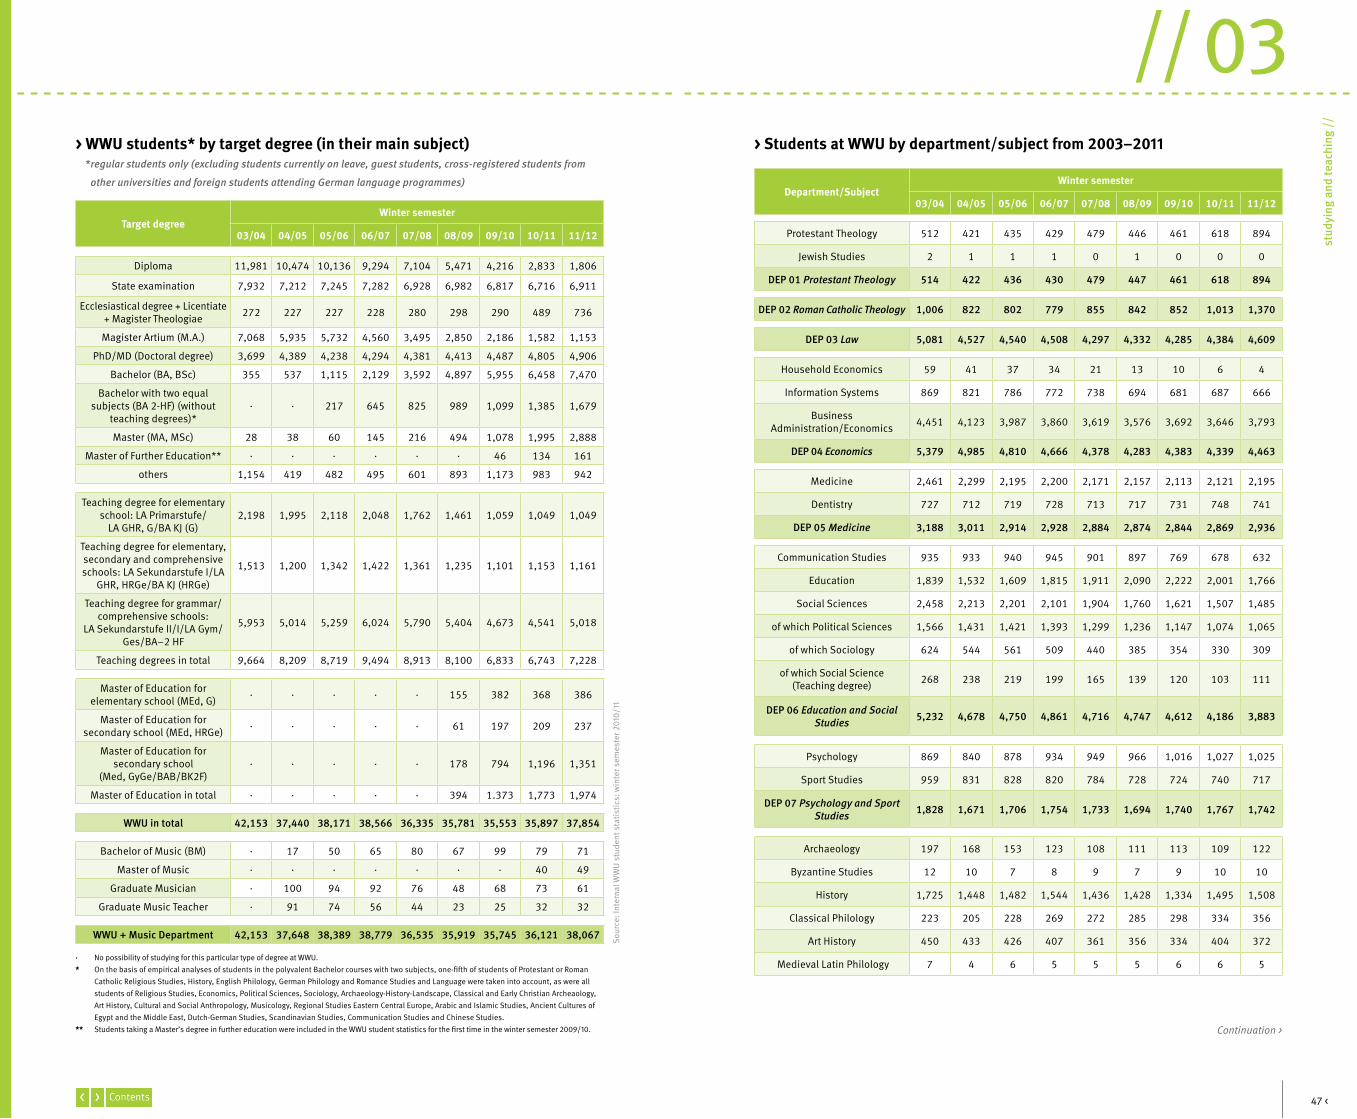
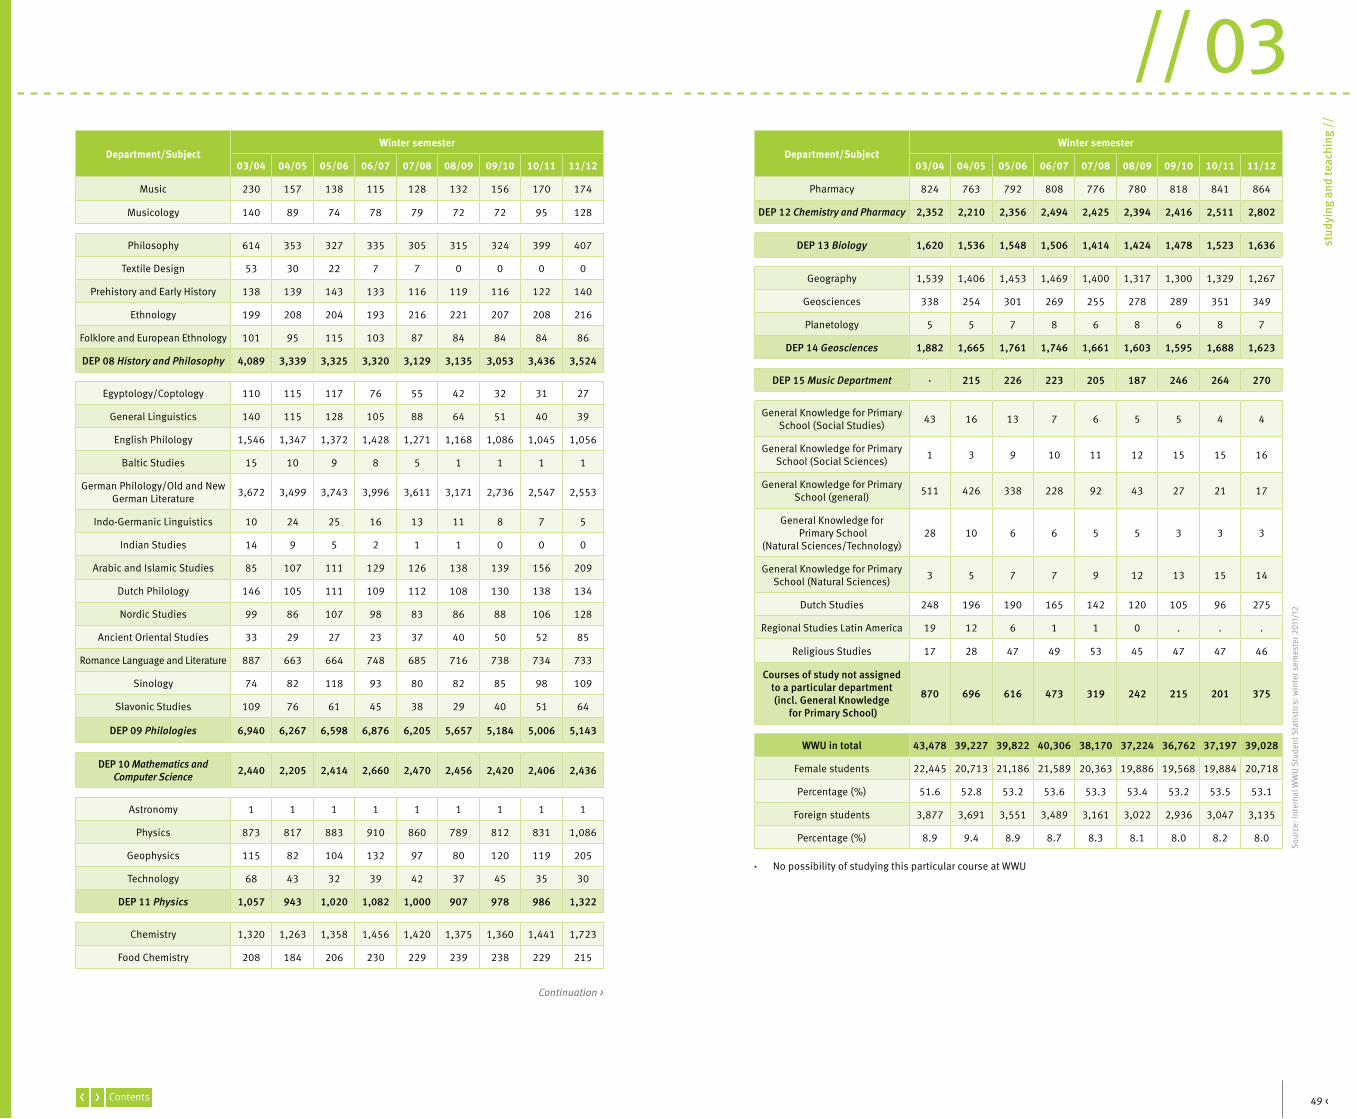
> WWU students by target degree (in their main subject) 46> Students at WWU by department/subject from 2003–2011 47> Origin of German students in the winter semester 2011/12 by Federal State where they obtained their general qualification for university entrance 50> Regional origin of foreign students in the winter semester 2011/12 by continent 50
B. Number of First-Year Students> First-year students at WWU by target degree (in their main subject) 51> Number of first-year students 1980–2011 52
C. Capacity> Development of capacity utilization (excluding medicine) by department/subject 52
D. Examinations and Graduates> The 20 German universities with the highest number of examinations passed (by type of degree) in the academic year
2010 54> Performance-based budgeting for the financial year 2012 (excluding medicine) – parameter graduates 56> Graduates in their main subject by department/course of study in the academic years 2002–2010 57> Number of examinations passed by type of degree 1994–2010 60> Number of examinations passed by type of degree in the years 1982–2010 60
E. Duration of Study> Average duration of study (median) in selected subjects at WWU in the academic year
2010 in national comparison 62F. Academic Success
> Development of academic success by type of degree 63
G. CHE University Ranking 2009–2011> Student rating of overall study situation at WWU 64> Student assessment of selected aspects of studying and teaching at WWU 65
budget and personnel // 04
> Budget of WWU (excluding medicine) in the years 2005–2010 68> WWU's cost structure in the financial year 2010 by cost category (excluding medicine) 68> WWU's cost structure in the financial year 2010 by source of funding (excluding medicine) 68
> WWU's cost structure in the financial year 2010 (excluding medicine) 69> Performance-oriented budgeting for the financial year 2012 (excluding medicine) – parameters and results 70> Performance-oriented budgeting of the Faculty of Medicine for the financial year 2011 – parameters and results 72> Tutorial staff by department (excluding medicine) and source of funding in 2011 – full-time employee equivalents 72> WWU Münster in the 2011 CEWS higher
education ranking, based on gender equality 74> Diagram showing the ’leaky pipeline’ relating to percentages of women and men
in their academic careers at WWU Münster 74> Performance-oriented budgeting for the
financial year 2012 (excluding medicine) – parameter gender equality 75
> Appointment procedures completed in 2011 76> Number of scheduled retirements of pro-
fessors in 2012 to 2025, by department 78
infrastructure // 05
Buildings> Volume of sums approved in the NRW Universities Modernisation Programme for the years 2009–2015 82> Planned modernisations and renovations at WWU financed by the NRW Universities Modernisation Programme 82> Main useable areas by department (ex-
cluding medicine) in 2007–2011 in m2 83> Share of main useable area by department at WWU in 2011 83
University and Regional Library (ULB)> Library system at WWU 84> Development of total media stocks 2002–2011 85> Use of ULB stocks in 2011 85
Learning and Working in the ULB> Workspace supply at ULB 85
Data Processing Center> Structural Data of the Data Processing Center (ZIV) in 2011 86> Communication network 86> Central systems 87> Applications / Tasks and Service 87
glossary // 06
> List of Abbreviations 90> Definitions 92> Editorial Information 96

// 01pr
ofile
//
9 <
// 01
profi
le /
/
Lesezeichen
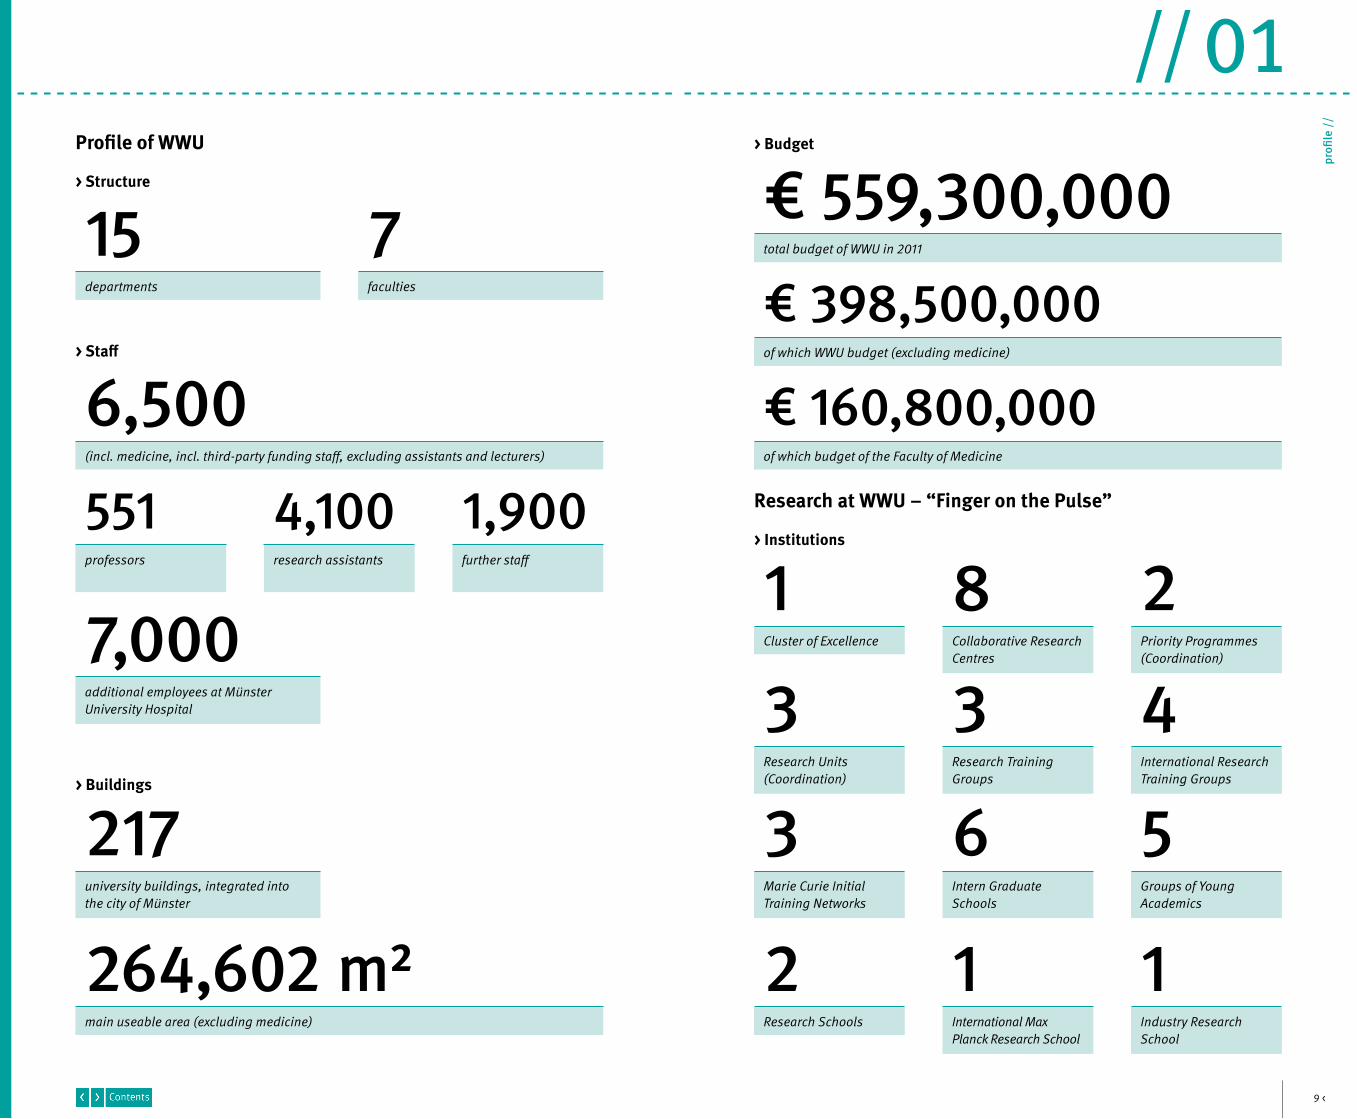
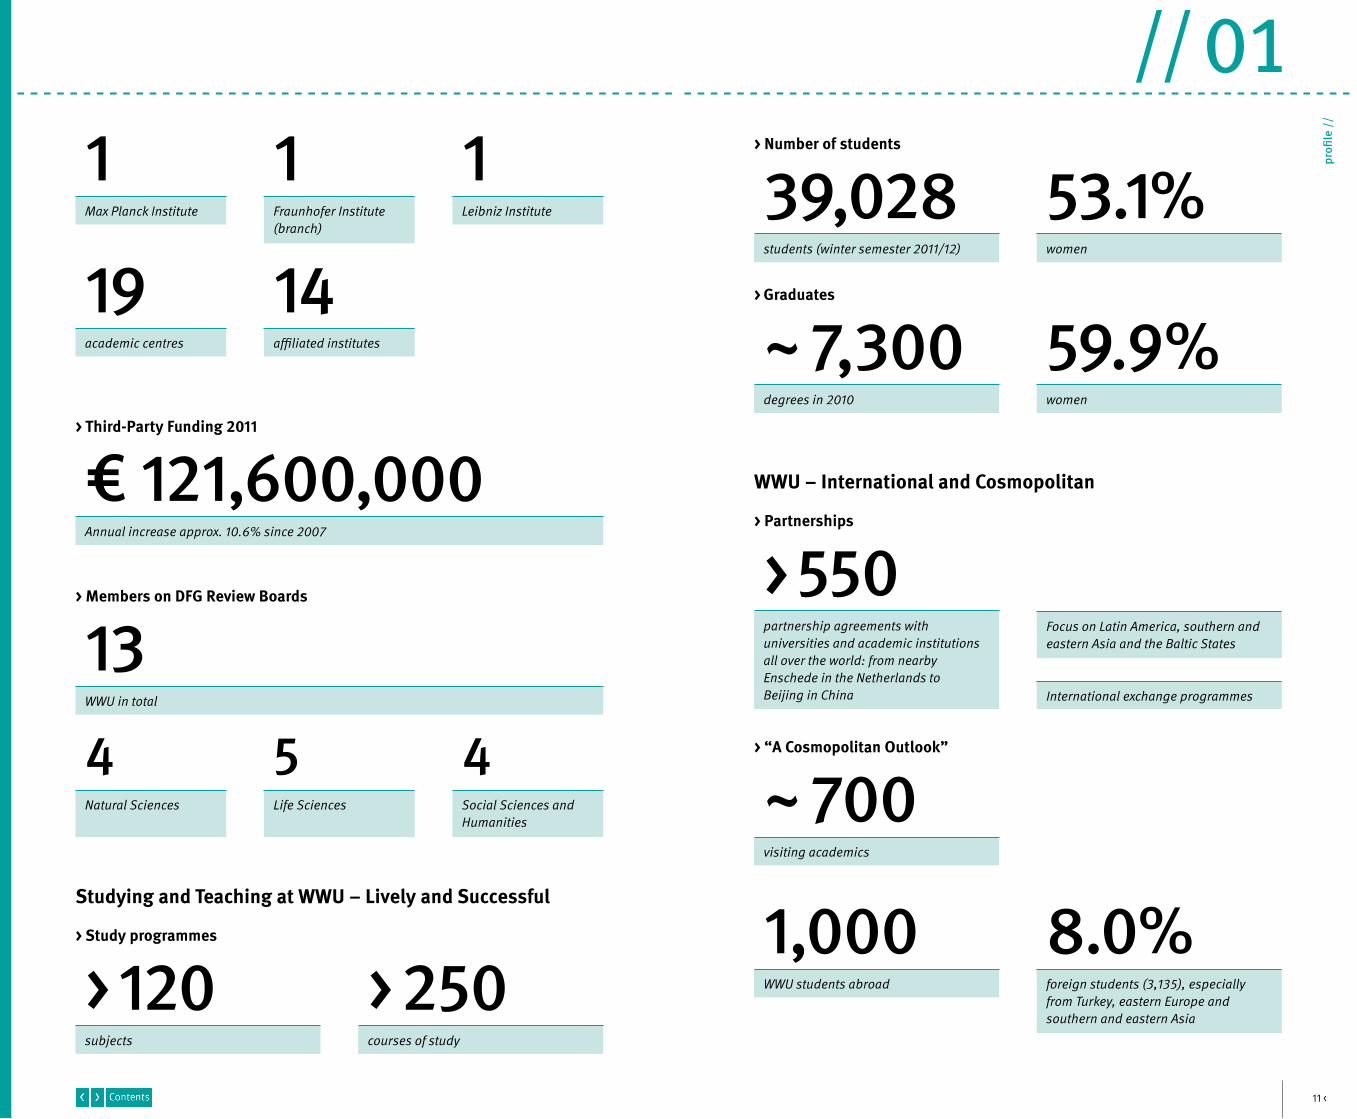
> Budget
€ 559,300,000total budget of WWU in 2011
Research at WWU – “Finger on the Pulse”
> Institutions
81 2
6
33 4Collaborative ResearchCentres
Priority Programmes(Coordination)
3Marie Curie Initial Training Networks
Intern GraduateSchools
Research TrainingGroups
Research Units(Coordination)
International ResearchTraining Groups
Cluster of Excellence
5Groups of YoungAcademics
Profile of WWU
> Structure
> Buildings
> Staff
15
551
€ 398,500,000
€ 160,800,000
264,602 m2
6,500
7,000
7
4,100 1,900
departments
(incl. medicine, incl. third-party funding staff, excluding assistants and lecturers)
professors
of which WWU budget (excluding medicine)
of which budget of the Faculty of Medicine
research assistants further staff
additional employees at MünsterUniversity Hospital
faculties
217university buildings, integrated intothe city of Münster
main useable area (excluding medicine)
1Industry Research School
1International MaxPlanck Research School
2Research Schools
11 <
// 01
profi
le /
/
Lesezeichen
WWU – International and Cosmopolitan
> Partnerships
> 550partnership agreements withuniversities and academic institutionsall over the world: from nearbyEnschede in the Netherlands toBeijing in China
Focus on Latin America, southern andeastern Asia and the Baltic States
International exchange programmes
> Graduates
~ 7,300 59.9%degrees in 2010 women
> “A Cosmopolitan Outlook”
~ 700
1,000 8.0%visiting academics
WWU students abroad foreign students (3,135), especiallyfrom Turkey, eastern Europe andsouthern and eastern Asia
Studying and Teaching at WWU – Lively and Successful
> Study programmes
> 120 > 250subjects courses of study
> Number of students
39,028 53.1%students (winter semester 2011/12) women
14affiliated institutes
1
19Leibniz Institute
academic centres
> Third-Party Funding 2011
> Members on DFG Review Boards
€ 121,600,000
13
Annual increase approx. 10.6% since 2007
WWU in total
4 5 4Natural Sciences Life Sciences Social Sciences and
Humanities
1Fraunhofer Institute (branch)
1Max Planck Institute
// 02re
sear
ch /
/
2002
2008
1998
2004
2010
2000
2006
2012
2003
2009
1999
2005
2011
2001
2007
2013
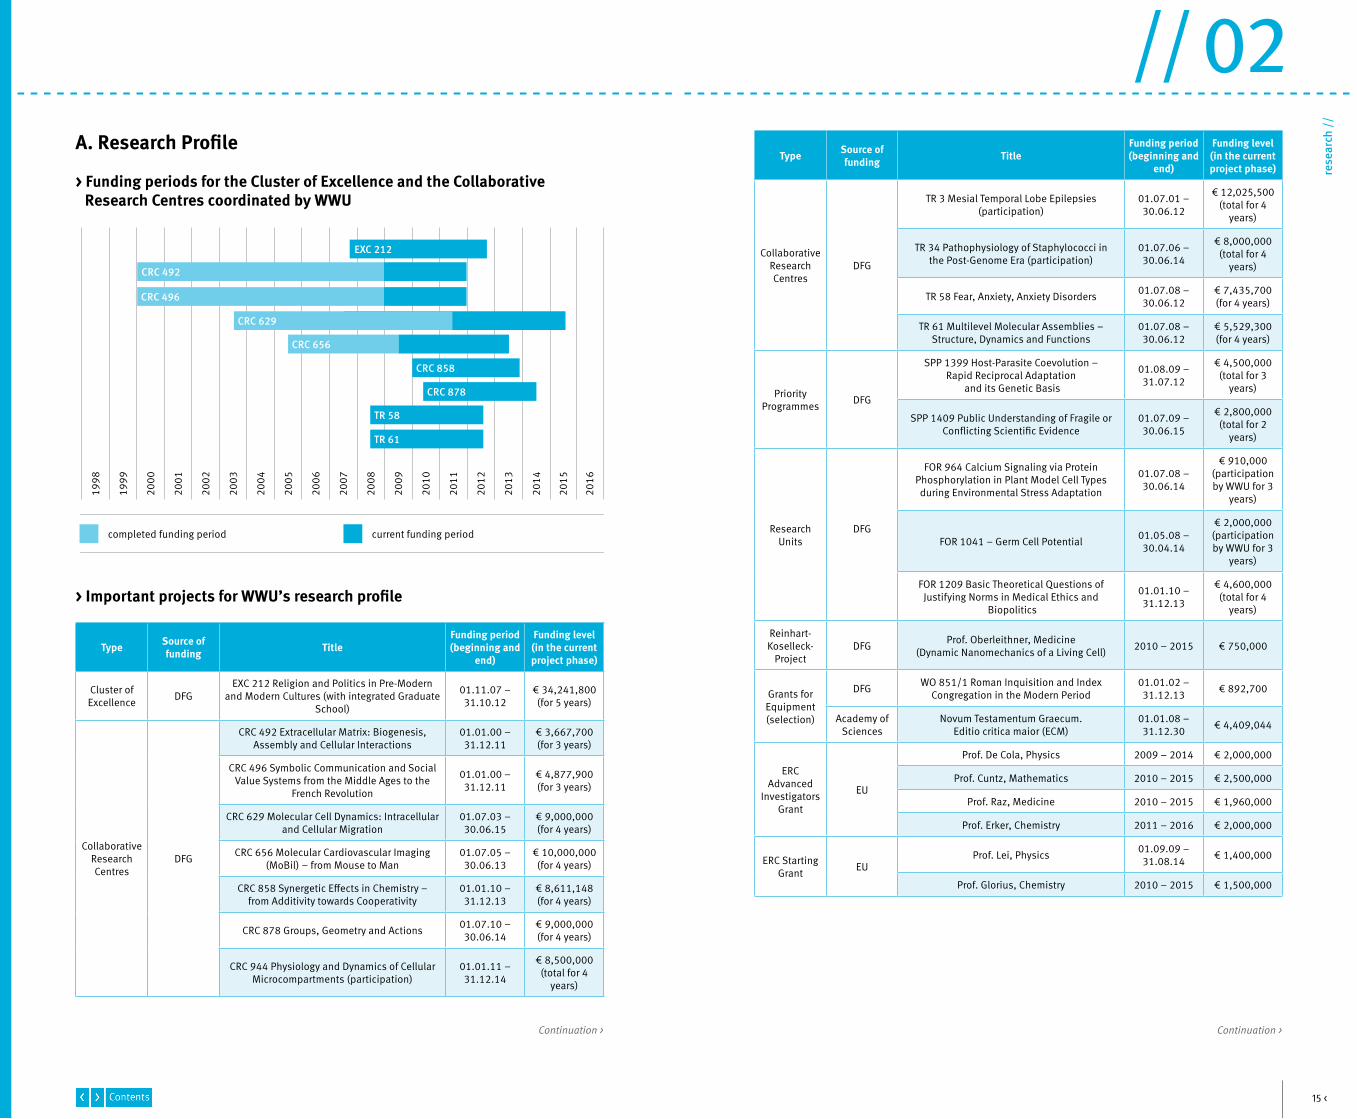
TR 61
TR 58
CRC 858
CRC 656
CRC 496
2014
CRC 492
CRC 878
2015
2016
CRC 629
EXC 212
15 <
// 02
rese
arch
//
Lesezeichen
Continuation >
A. Research Profile
> Important projects for WWU’s research profile
Continuation >
> Funding periods for the Cluster of Excellence and the Collaborative Research Centres coordinated by WWU
completed funding period current funding period
Type Source offunding Title
Funding period(beginning and
end)
Funding level(in the currentproject phase)
Cluster ofExcellence DFG
EXC 212 Religion and Politics in Pre-Modernand Modern Cultures (with integrated Graduate
School)
01.11.07 – 31.10.12
€ 34,241,800 (for 5 years)
CollaborativeResearchCentres
DFG
CRC 492 Extracellular Matrix: Biogenesis,Assembly and Cellular Interactions
01.01.00 – 31.12.11
€ 3,667,700 (for 3 years)
CRC 496 Symbolic Communication and SocialValue Systems from the Middle Ages to the
French Revolution
01.01.00 – 31.12.11
€ 4,877,900 (for 3 years)
CRC 629 Molecular Cell Dynamics: Intracellularand Cellular Migration
01.07.03 – 30.06.15
€ 9,000,000 (for 4 years)
CRC 656 Molecular Cardiovascular Imaging(MoBil) – from Mouse to Man
01.07.05 – 30.06.13
€ 10,000,000 (for 4 years)
CRC 858 Synergetic Effects in Chemistry –from Additivity towards Cooperativity
01.01.10 – 31.12.13
€ 8,611,148 (for 4 years)
CRC 878 Groups, Geometry and Actions 01.07.10 – 30.06.14
€ 9,000,000 (for 4 years)
CRC 944 Physiology and Dynamics of CellularMicrocompartments (participation)
01.01.11 – 31.12.14
€ 8,500,000 (total for 4
years)
Type Source offunding Title
Funding period(beginning and
end)
Funding level(in the currentproject phase)
CollaborativeResearchCentres
DFG
TR 3 Mesial Temporal Lobe Epilepsies(participation)
01.07.01 – 30.06.12
€ 12,025,500 (total for 4
years)
TR 34 Pathophysiology of Staphylococci in the Post-Genome Era (participation)
01.07.06 – 30.06.14
€ 8,000,000(total for 4
years)
TR 58 Fear, Anxiety, Anxiety Disorders 01.07.08 – 30.06.12
€ 7,435,700 (for 4 years)
TR 61 Multilevel Molecular Assemblies –Structure, Dynamics and Functions
01.07.08 –30.06.12
€ 5,529,300 (for 4 years)
PriorityProgrammes DFG
SPP 1399 Host-Parasite Coevolution – Rapid Reciprocal Adaptation
and its Genetic Basis
01.08.09 – 31.07.12
€ 4,500,000 (total for 3
years)
SPP 1409 Public Understanding of Fragile orConflicting Scientific Evidence
01.07.09 – 30.06.15
€ 2,800,000 (total for 2
years)
ResearchUnits
DFG
FOR 964 Calcium Signaling via ProteinPhosphorylation in Plant Model Cell Typesduring Environmental Stress Adaptation
01.07.08 – 30.06.14
€ 910,000 (participationby WWU for 3
years)
FOR 1041 – Germ Cell Potential 01.05.08 – 30.04.14
€ 2,000,000 (participationby WWU for 3
years)
FOR 1209 Basic Theoretical Questions ofJustifying Norms in Medical Ethics and
Biopolitics
01.01.10 – 31.12.13
€ 4,600,000 (total for 4
years)
Reinhart-Koselleck-
ProjectDFG Prof. Oberleithner, Medicine
(Dynamic Nanomechanics of a Living Cell) 2010 – 2015 € 750,000
Grants forEquipment(selection)
DFG WO 851/1 Roman Inquisition and IndexCongregation in the Modern Period
01.01.02 –31.12.13 € 892,700
Academy ofSciences
Novum Testamentum Graecum. Editio critica maior (ECM)
01.01.08 –31.12.30 € 4,409,044
ERC Advanced
Investigators Grant
EU
Prof. De Cola, Physics 2009 – 2014 € 2,000,000
Prof. Cuntz, Mathematics 2010 – 2015 € 2,500,000
Prof. Raz, Medicine 2010 – 2015 € 1,960,000
Prof. Erker, Chemistry 2011 – 2016 € 2,000,000
ERC Starting Grant EU
Prof. Lei, Physics 01.09.09 – 31.08.14 € 1,400,000
Prof. Glorius, Chemistry 2010 – 2015 € 1,500,000
17 <
// 02
rese
arch
//
Lesezeichen
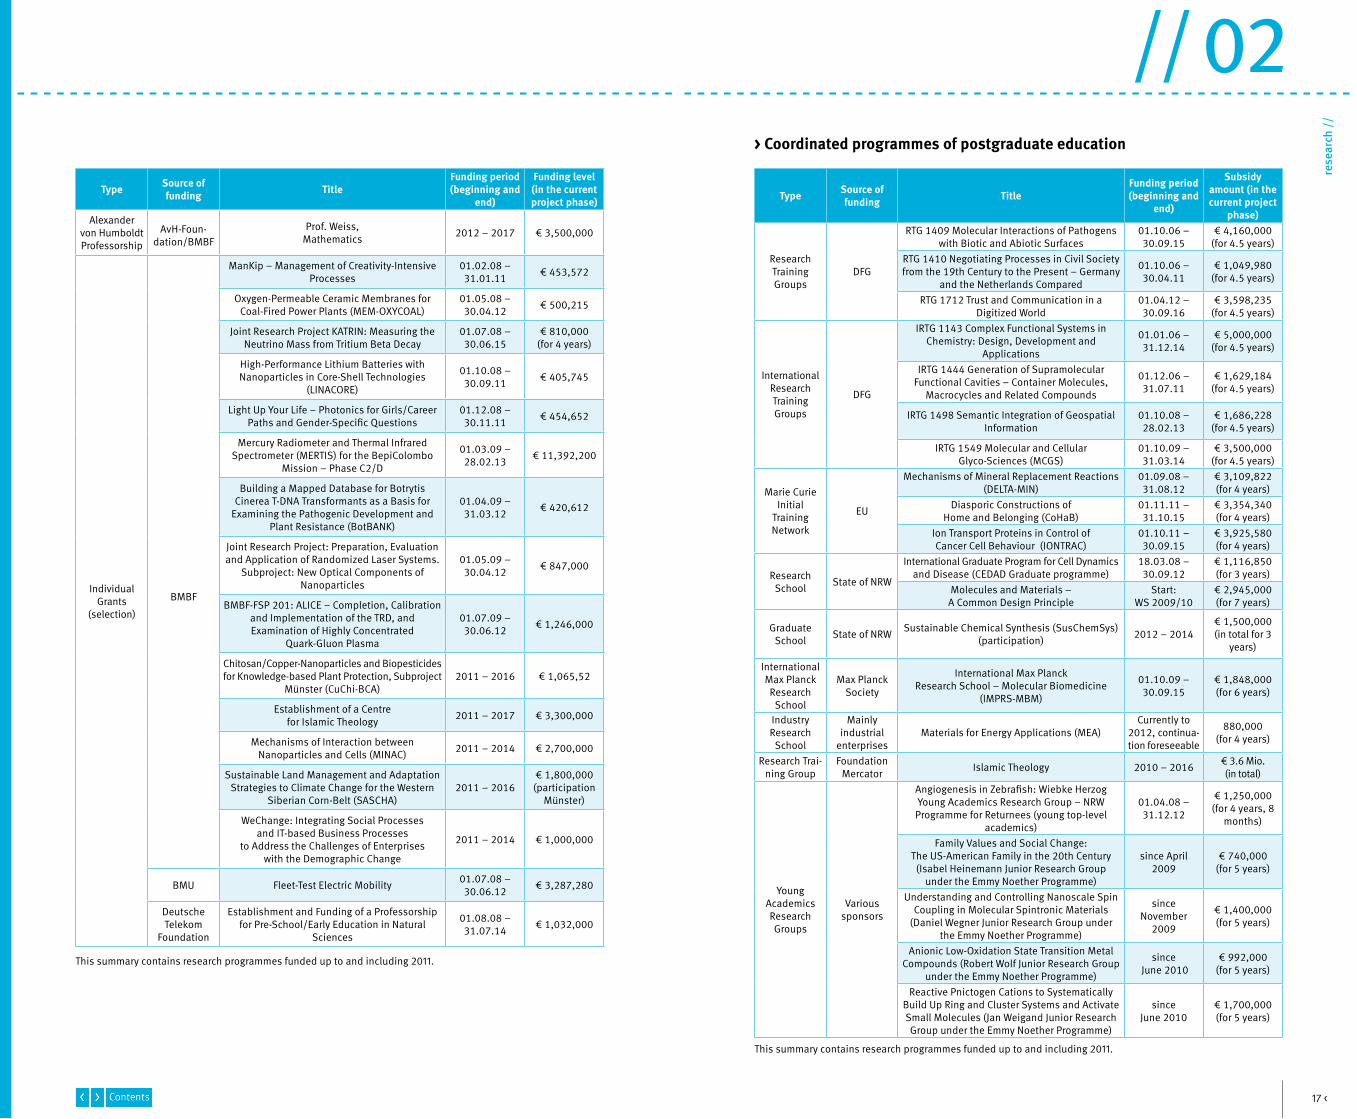
This summary contains research programmes funded up to and including 2011.
This summary contains research programmes funded up to and including 2011.
> Coordinated programmes of postgraduate education
Type Source offunding Title
Funding period(beginning and
end)
Funding level(in the currentproject phase)
Alexander von Humboldt Professorship
AvH-Foun-dation/BMBF
Prof. Weiss, Mathematics 2012 – 2017 € 3,500,000
IndividualGrants
(selection)
BMBF
ManKip – Management of Creativity-IntensiveProcesses
01.02.08 – 31.01.11 € 453,572
Oxygen-Permeable Ceramic Membranes forCoal-Fired Power Plants (MEM-OXYCOAL)
01.05.08 – 30.04.12 € 500,215
Joint Research Project KATRIN: Measuring theNeutrino Mass from Tritium Beta Decay
01.07.08 – 30.06.15
€ 810,000 (for 4 years)
High-Performance Lithium Batteries withNanoparticles in Core-Shell Technologies
(LINACORE)
01.10.08 – 30.09.11 € 405,745
Light Up Your Life – Photonics for Girls/CareerPaths and Gender-Specific Questions
01.12.08 – 30.11.11 € 454,652
Mercury Radiometer and Thermal InfraredSpectrometer (MERTIS) for the BepiColombo
Mission – Phase C2/D
01.03.09 – 28.02.13 € 11,392,200
Building a Mapped Database for BotrytisCinerea T-DNA Transformants as a Basis for
Examining the Pathogenic Development andPlant Resistance (BotBANK)
01.04.09 – 31.03.12 € 420,612
Joint Research Project: Preparation, Evaluationand Application of Randomized Laser Systems.
Subproject: New Optical Components ofNanoparticles
01.05.09 – 30.04.12 € 847,000
BMBF-FSP 201: ALICE – Completion, Calibrationand Implementation of the TRD, andExamination of Highly Concentrated
Quark-Gluon Plasma
01.07.09 – 30.06.12 € 1,246,000
Chitosan/Copper-Nanoparticles and Biopesticides for Knowledge-based Plant Protection, Subproject
Münster (CuChi-BCA)2011 – 2016 € 1,065,52
Establishment of a Centre for Islamic Theology 2011 – 2017 € 3,300,000
Mechanisms of Interaction between Nanoparticles and Cells (MINAC) 2011 – 2014 € 2,700,000
Sustainable Land Management and Adaptation Strategies to Climate Change for the Western
Siberian Corn-Belt (SASCHA)2011 – 2016
€ 1,800,000 (participation
Münster)
WeChange: Integrating Social Processes and IT-based Business Processes
to Address the Challenges of Enterprises with the Demographic Change
2011 – 2014 € 1,000,000
BMU Fleet-Test Electric Mobility 01.07.08 – 30.06.12 € 3,287,280
DeutscheTelekom
Foundation
Establishment and Funding of a Professorshipfor Pre-School/Early Education in Natural
Sciences
01.08.08 – 31.07.14 € 1,032,000
Type Source offunding Title
Funding period(beginning and
end)
Subsidyamount (in thecurrent project
phase)
ResearchTrainingGroups
DFG
RTG 1409 Molecular Interactions of Pathogenswith Biotic and Abiotic Surfaces
01.10.06 – 30.09.15
€ 4,160,000 (for 4.5 years)
RTG 1410 Negotiating Processes in Civil Societyfrom the 19th Century to the Present – Germany
and the Netherlands Compared
01.10.06 – 30.04.11
€ 1,049,980 (for 4.5 years)
RTG 1712 Trust and Communication in a Digitized World
01.04.12 – 30.09.16
€ 3,598,235 (for 4.5 years)
InternationalResearchTrainingGroups
DFG
IRTG 1143 Complex Functional Systems inChemistry: Design, Development and
Applications
01.01.06 – 31.12.14
€ 5,000,000 (for 4.5 years)
IRTG 1444 Generation of SupramolecularFunctional Cavities – Container Molecules,
Macrocycles and Related Compounds
01.12.06 – 31.07.11
€ 1,629,184 (for 4.5 years)
IRTG 1498 Semantic Integration of GeospatialInformation
01.10.08 – 28.02.13
€ 1,686,228 (for 4.5 years)
IRTG 1549 Molecular and CellularGlyco-Sciences (MCGS)
01.10.09 – 31.03.14
€ 3,500,000 (for 4.5 years)
Marie Curie Initial
Training Network
EU
Mechanisms of Mineral Replacement Reactions (DELTA-MIN)
01.09.08 –31.08.12
€ 3,109,822 (for 4 years)
Diasporic Constructions of Home and Belonging (CoHaB)
01.11.11 – 31.10.15
€ 3,354,340 (for 4 years)
Ion Transport Proteins in Control of Cancer Cell Behaviour (IONTRAC)
01.10.11 – 30.09.15
€ 3,925,580 (for 4 years)
ResearchSchool State of NRW
International Graduate Program for Cell Dynamics and Disease (CEDAD Graduate programme)
18.03.08 – 30.09.12
€ 1,116,850 (for 3 years)
Molecules and Materials – A Common Design Principle
Start: WS 2009/10
€ 2,945,000 (for 7 years)
Graduate School State of NRW Sustainable Chemical Synthesis (SusChemSys)
(participation) 2012 – 2014€ 1,500,000 (in total for 3
years)
International Max Planck Research
School
Max PlanckSociety
International Max Planck Research School – Molecular Biomedicine
(IMPRS-MBM)
01.10.09 –30.09.15
€ 1,848,000 (for 6 years)
IndustryResearch
School
Mainlyindustrial
enterprisesMaterials for Energy Applications (MEA)
Currently to2012, continua-tion foreseeable
880,000(for 4 years)
Research Trai-ning Group
Foundation Mercator Islamic Theology 2010 – 2016 € 3.6 Mio.
(in total)
YoungAcademicsResearchGroups
Varioussponsors
Angiogenesis in Zebrafish: Wiebke HerzogYoung Academics Research Group – NRWProgramme for Returnees (young top-level
academics)
01.04.08 –31.12.12
€ 1,250,000 (for 4 years, 8
months)
Family Values and Social Change:The US-American Family in the 20th Century(Isabel Heinemann Junior Research Group
under the Emmy Noether Programme)
since April2009
€ 740,000 (for 5 years)
Understanding and Controlling Nanoscale SpinCoupling in Molecular Spintronic Materials
(Daniel Wegner Junior Research Group underthe Emmy Noether Programme)
sinceNovember
2009
€ 1,400,000 (for 5 years)
Anionic Low-Oxidation State Transition Metal Compounds (Robert Wolf Junior Research Group
under the Emmy Noether Programme)
since June 2010
€ 992,000 (for 5 years)
Reactive Pnictogen Cations to Systematically Build Up Ring and Cluster Systems and ActivateSmall Molecules (Jan Weigand Junior Research Group under the Emmy Noether Programme)
sinceJune 2010
€ 1,700,000 (for 5 years)
19 <
// 02
rese
arch
//
Lesezeichen
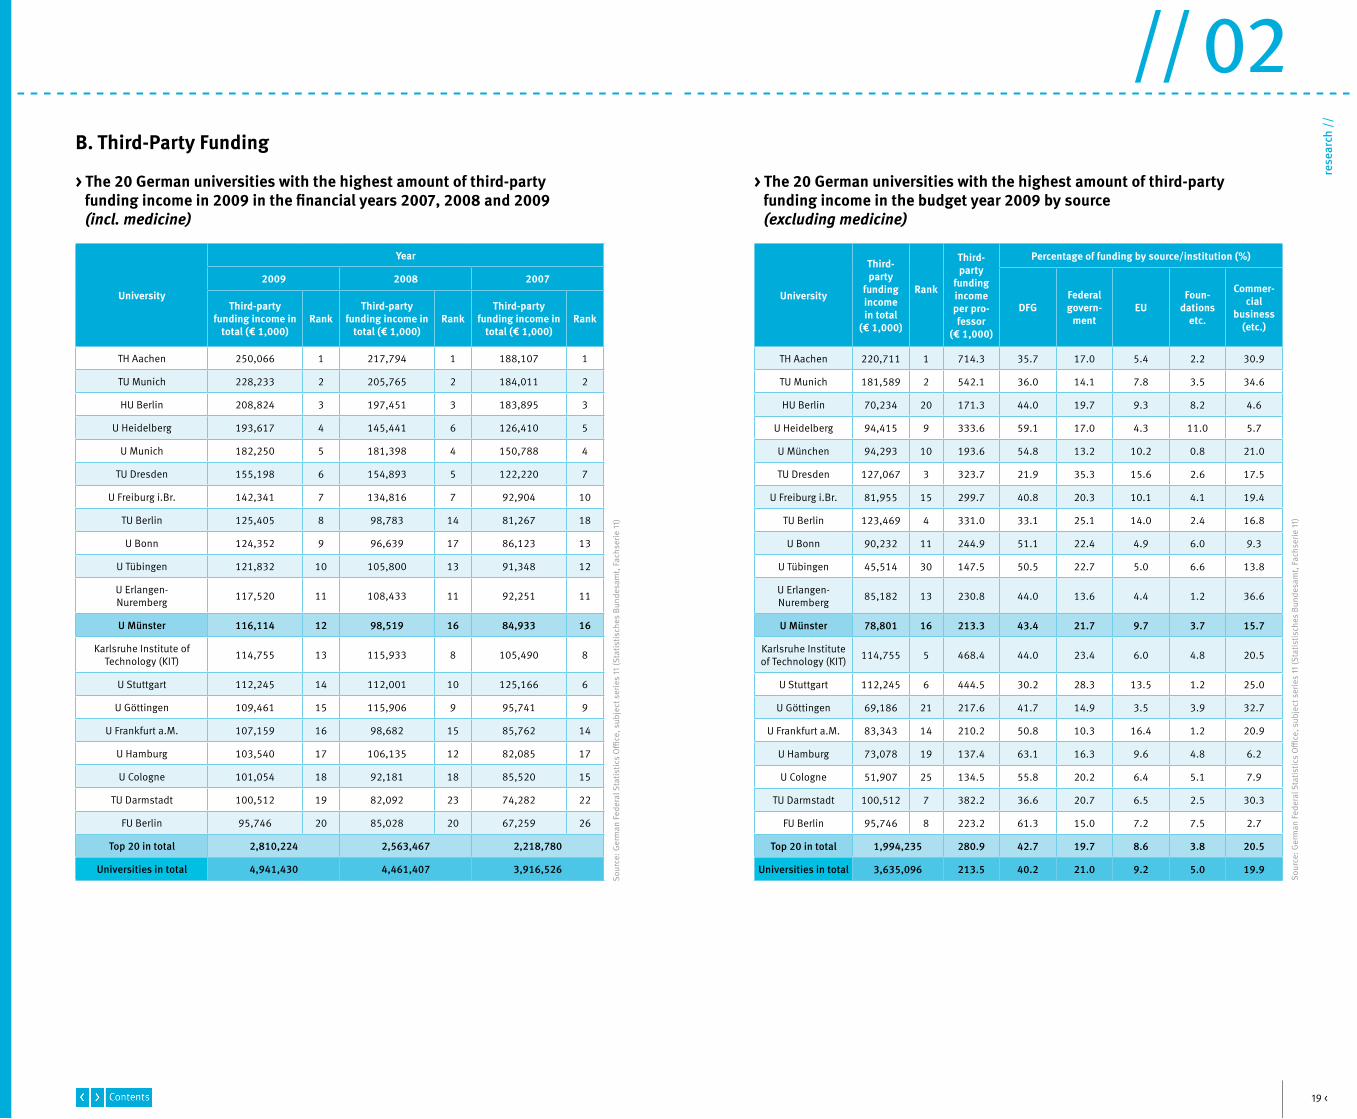
> The 20 German universities with the highest amount of third-party funding income in 2009 in the financial years 2007, 2008 and 2009 (incl. medicine)
> The 20 German universities with the highest amount of third-party funding income in the budget year 2009 by source (excluding medicine)
Sour
ce: G
erm
an F
eder
al S
tatis
tics
Offi
ce, s
ubje
ct s
erie
s 11
(Sta
tistis
ches
Bun
desa
mt,
Fach
serie
11)
Sour
ce: G
erm
an F
eder
al S
tatis
tics
Offi
ce, s
ubje
ct s
erie
s 11
(Sta
tistis
ches
Bun
desa
mt,
Fach
serie
11)
B. Third-Party Funding
University
Year
2009 2008 2007
Third-partyfunding income in
total (€ 1,000)Rank
Third-partyfunding income in
total (€ 1,000)Rank
Third-partyfunding income in
total (€ 1,000)Rank
TH Aachen 250,066 1 217,794 1 188,107 1
TU Munich 228,233 2 205,765 2 184,011 2
HU Berlin 208,824 3 197,451 3 183,895 3
U Heidelberg 193,617 4 145,441 6 126,410 5
U Munich 182,250 5 181,398 4 150,788 4
TU Dresden 155,198 6 154,893 5 122,220 7
U Freiburg i.Br. 142,341 7 134,816 7 92,904 10
TU Berlin 125,405 8 98,783 14 81,267 18
U Bonn 124,352 9 96,639 17 86,123 13
U Tübingen 121,832 10 105,800 13 91,348 12
U Erlangen-Nuremberg 117,520 11 108,433 11 92,251 11
U Münster 116,114 12 98,519 16 84,933 16
Karlsruhe Institute of Technology (KIT) 114,755 13 115,933 8 105,490 8
U Stuttgart 112,245 14 112,001 10 125,166 6
U Göttingen 109,461 15 115,906 9 95,741 9
U Frankfurt a.M. 107,159 16 98,682 15 85,762 14
U Hamburg 103,540 17 106,135 12 82,085 17
U Cologne 101,054 18 92,181 18 85,520 15
TU Darmstadt 100,512 19 82,092 23 74,282 22
FU Berlin 95,746 20 85,028 20 67,259 26
Top 20 in total 2,810,224 2,563,467 2,218,780
Universities in total 4,941,430 4,461,407 3,916,526
University
Third-party
fundingincomein total
(€ 1,000)
Rank
Third-party
fundingincomeper pro-fessor
(€ 1,000)
Percentage of funding by source/institution (%)
DFGFederalgovern-
mentEU
Foun-dations
etc.
Commer-cial
business(etc.)
TH Aachen 220,711 1 714.3 35.7 17.0 5.4 2.2 30.9
TU Munich 181,589 2 542.1 36.0 14.1 7.8 3.5 34.6
HU Berlin 70,234 20 171.3 44.0 19.7 9.3 8.2 4.6
U Heidelberg 94,415 9 333.6 59.1 17.0 4.3 11.0 5.7
U München 94,293 10 193.6 54.8 13.2 10.2 0.8 21.0
TU Dresden 127,067 3 323.7 21.9 35.3 15.6 2.6 17.5
U Freiburg i.Br. 81,955 15 299.7 40.8 20.3 10.1 4.1 19.4
TU Berlin 123,469 4 331.0 33.1 25.1 14.0 2.4 16.8
U Bonn 90,232 11 244.9 51.1 22.4 4.9 6.0 9.3
U Tübingen 45,514 30 147.5 50.5 22.7 5.0 6.6 13.8
U Erlangen- Nuremberg 85,182 13 230.8 44.0 13.6 4.4 1.2 36.6
U Münster 78,801 16 213.3 43.4 21.7 9.7 3.7 15.7
Karlsruhe Institute of Technology (KIT) 114,755 5 468.4 44.0 23.4 6.0 4.8 20.5
U Stuttgart 112,245 6 444.5 30.2 28.3 13.5 1.2 25.0
U Göttingen 69,186 21 217.6 41.7 14.9 3.5 3.9 32.7
U Frankfurt a.M. 83,343 14 210.2 50.8 10.3 16.4 1.2 20.9
U Hamburg 73,078 19 137.4 63.1 16.3 9.6 4.8 6.2
U Cologne 51,907 25 134.5 55.8 20.2 6.4 5.1 7.9
TU Darmstadt 100,512 7 382.2 36.6 20.7 6.5 2.5 30.3
FU Berlin 95,746 8 223.2 61.3 15.0 7.2 7.5 2.7
Top 20 in total 1,994,235 280.9 42.7 19.7 8.6 3.8 20.5
Universities in total 3,635,096 213.5 40.2 21.0 9.2 5.0 19.9
2002
2003
2004
2005
2006
2007
2008
2009
2002
2003
2004
2005
2006
2007
2008
2009
2010
2010
2011
2011
2002
2003
2004
2005
2006
2007
2008
2009
2010
2011
2002
21 <
// 02
rese
arch
//
Lesezeichen
2002
= 1
00U
nive
rsiti
es n
atio
n-
wid
e ex
clud
ing
WW
UW
WU
100108
103109
114
126
101
104
121
137 136
158
186
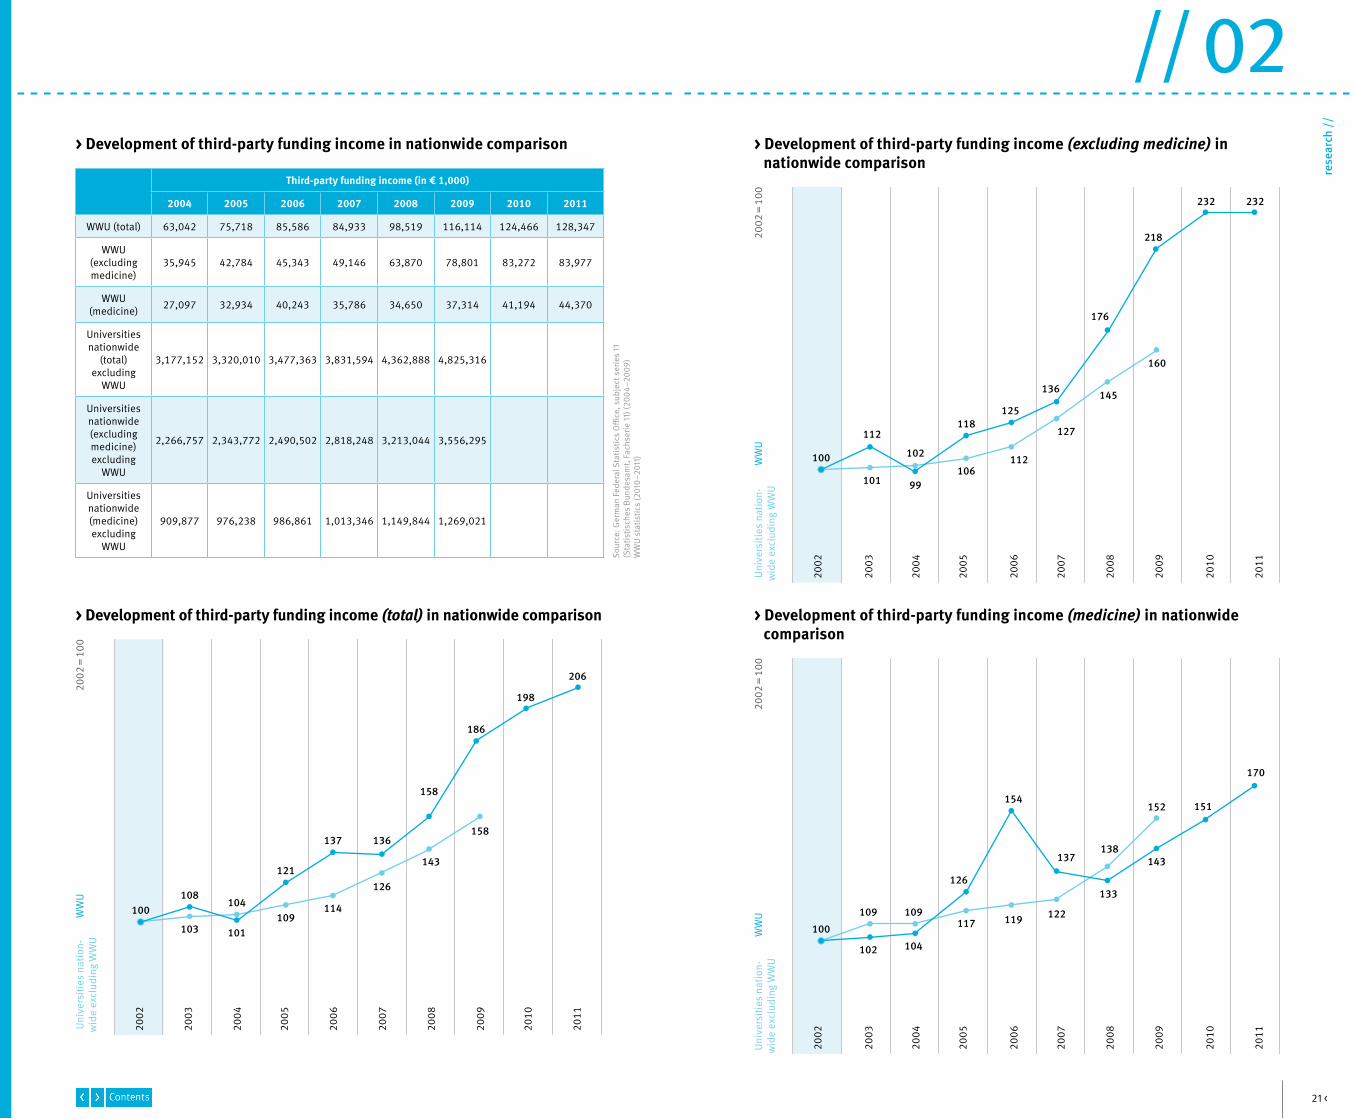
> Development of third-party funding income in nationwide comparison
> Development of third-party funding income (total) in nationwide comparison > Development of third-party funding income (medicine) in nationwide comparison
> Development of third-party funding income (excluding medicine) in nationwide comparison
Third-party funding income (in € 1,000)
2004 2005 2006 2007 2008 2009 2010 2011
WWU (total) 63,042 75,718 85,586 84,933 98,519 116,114 124,466 128,347
WWU(excludingmedicine)
35,945 42,784 45,343 49,146 63,870 78,801 83,272 83,977
WWU(medicine) 27,097 32,934 40,243 35,786 34,650 37,314 41,194 44,370
Universitiesnationwide
(total) excluding
WWU
3,177,152 3,320,010 3,477,363 3,831,594 4,362,888 4,825,316
Universitiesnationwide(excludingmedicine) excluding
WWU
2,266,757 2,343,772 2,490,502 2,818,248 3,213,044 3,556,295
Universitiesnationwide(medicine) excluding
WWU
909,877 976,238 986,861 1,013,346 1,149,844 1,269,021
100
100
112
109 109
101
102
106
117
112
119
127
122
99
104
102
118
126
125
154
137
176
133
218
143
136
2002
= 1
00U
nive
rsiti
es n
atio
n-w
ide
excl
udin
g W
WU
WW
U
2002
= 1
00U
nive
rsiti
es n
atio
n-w
ide
excl
udin
g W
WU
WW
U
Sour
ce: G
erm
an F
eder
al S
tatis
tics
Offi
ce, s
ubje
ct s
erie
s 11
(Sta
tistis
ches
Bun
desa
mt,
Fach
serie
11)
(200
4–20
09)
WW
U s
tatis
tics
(201
0–20
11)
198
143
145
232
151
138
206
158
232
170
160
152
1994
1996
1998
2000
2002
2004
2006
1995
1997
1999
2001
2003
2005
2007
2009
2008
2010
2011
82
36 33 30
95
81 86 91100
215235
248265
258
323
314
11097 104 107 110
118
66
95
239
352
313
1994
1996
1998
2000
2002
2004
2006
1995
1997
1999
2001
2003
2005
2007
2009
2008
1999
= 1
0019
99 =
100
Uni
vers
ities
in N
RW
excl
udin
g W
WU
Uni
vers
ities
in N
RWex
clud
ing
WW
UW
WU
W
WU
84
75 80 80 8593
84 89 91 98 100123
143158
175157
172
193207 243
303
114128 122 124
136147
108127
2010
354
331352
2011
355
23 <
// 02
rese
arch
//
Lesezeichen
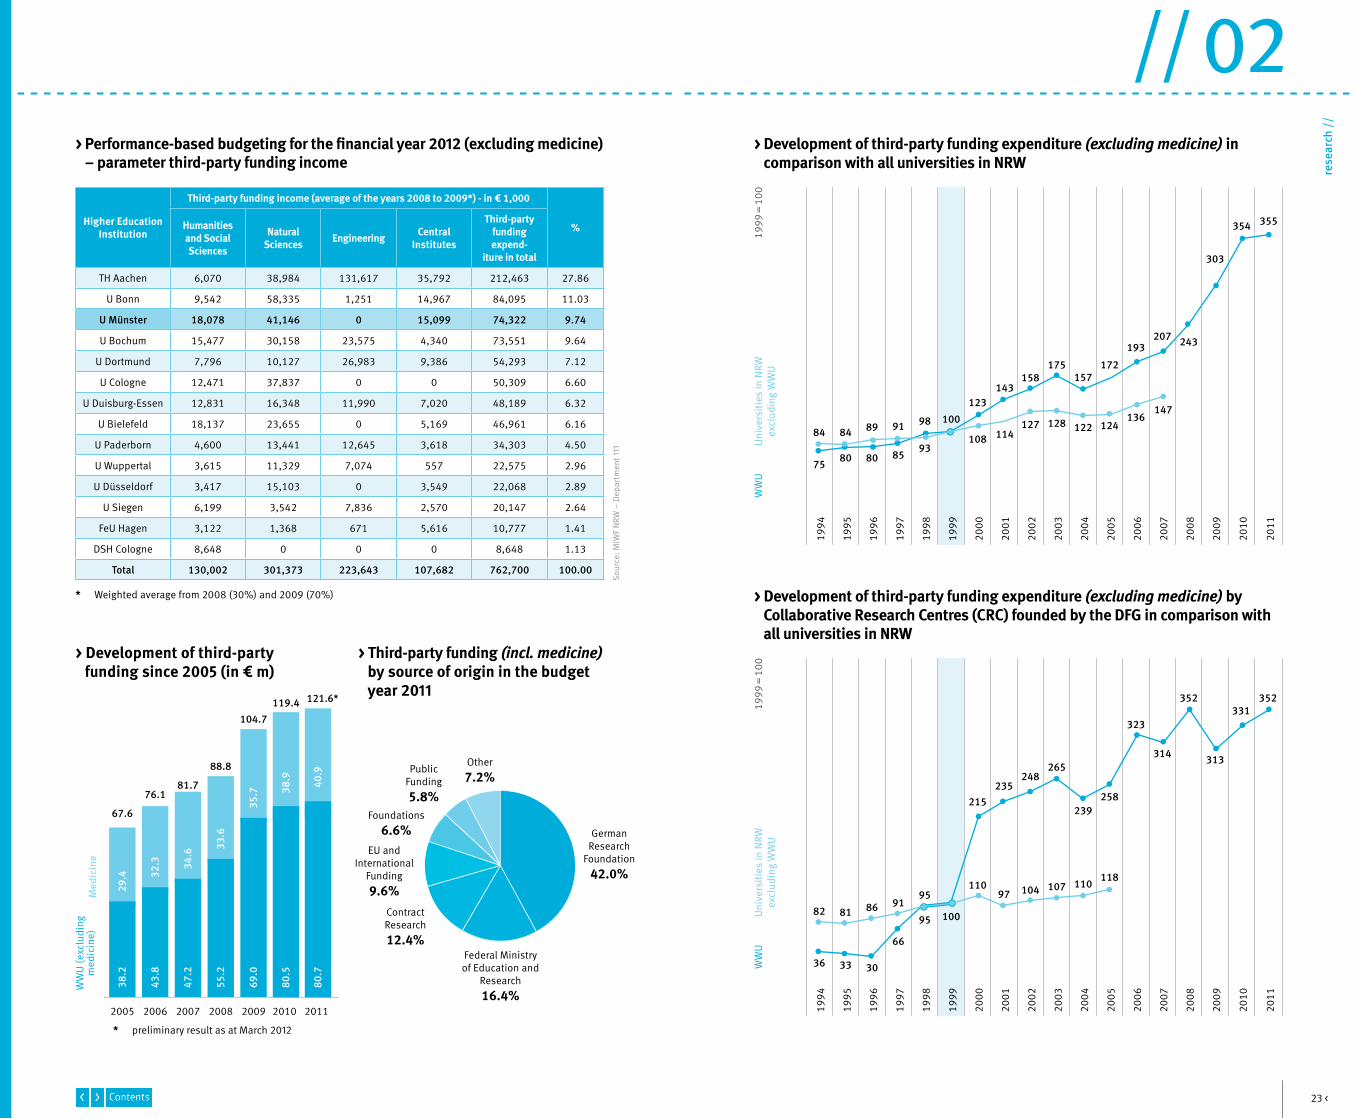
> Development of third-party funding expenditure (excluding medicine) in comparison with all universities in NRW
> Development of third-party funding expenditure (excluding medicine) by Collaborative Research Centres (CRC) founded by the DFG in comparison with
all universities in NRW
* Weighted average from 2008 (30%) and 2009 (70%)
Higher EducationInstitution
Third-party funding income (average of the years 2008 to 2009*) - in € 1,000
%Humanities and SocialSciences
NaturalSciences Engineering Central
Institutes
Third-partyfunding expend-
iture in total
TH Aachen 6,070 38,984 131,617 35,792 212,463 27.86
U Bonn 9,542 58,335 1,251 14,967 84,095 11.03
U Münster 18,078 41,146 0 15,099 74,322 9.74
U Bochum 15,477 30,158 23,575 4,340 73,551 9.64
U Dortmund 7,796 10,127 26,983 9,386 54,293 7.12
U Cologne 12,471 37,837 0 0 50,309 6.60
U Duisburg-Essen 12,831 16,348 11,990 7,020 48,189 6.32
U Bielefeld 18,137 23,655 0 5,169 46,961 6.16
U Paderborn 4,600 13,441 12,645 3,618 34,303 4.50
U Wuppertal 3,615 11,329 7,074 557 22,575 2.96
U Düsseldorf 3,417 15,103 0 3,549 22,068 2.89
U Siegen 6,199 3,542 7,836 2,570 20,147 2.64
FeU Hagen 3,122 1,368 671 5,616 10,777 1.41
DSH Cologne 8,648 0 0 0 8,648 1.13
Total 130,002 301,373 223,643 107,682 762,700 100.00
> Performance-based budgeting for the financial year 2012 (excluding medicine) – parameter third-party funding income
Sour
ce: M
IWF
NRW
– D
epar
tmen
t 111
Med
icin
e
2007
47.2
34.6
81.7
2008
55.2
33.6
88.8
2009
69.0
35.7
104.7
WW
U (e
xclu
ding
med
icin
e)
2005
38.2
29.4
67.6
2006
43.8
32.3
76.1
GermanResearch
Foundation42.0%
Federal Ministryof Education and
Research16.4%
PublicFunding 5.8%
Other7.2%
ContractResearch12.4%
Foundations6.6%
EU and International
Funding9.6%
* preliminary result as at March 2012
2010
80.5
38.9
119.4
> Development of third-party funding since 2005 (in € m)
> Third-party funding (incl. medicine) by source of origin in the budget year 2011
2011
80.7
40.9
121.6*
25 <
// 02
rese
arch
//
Lesezeichen
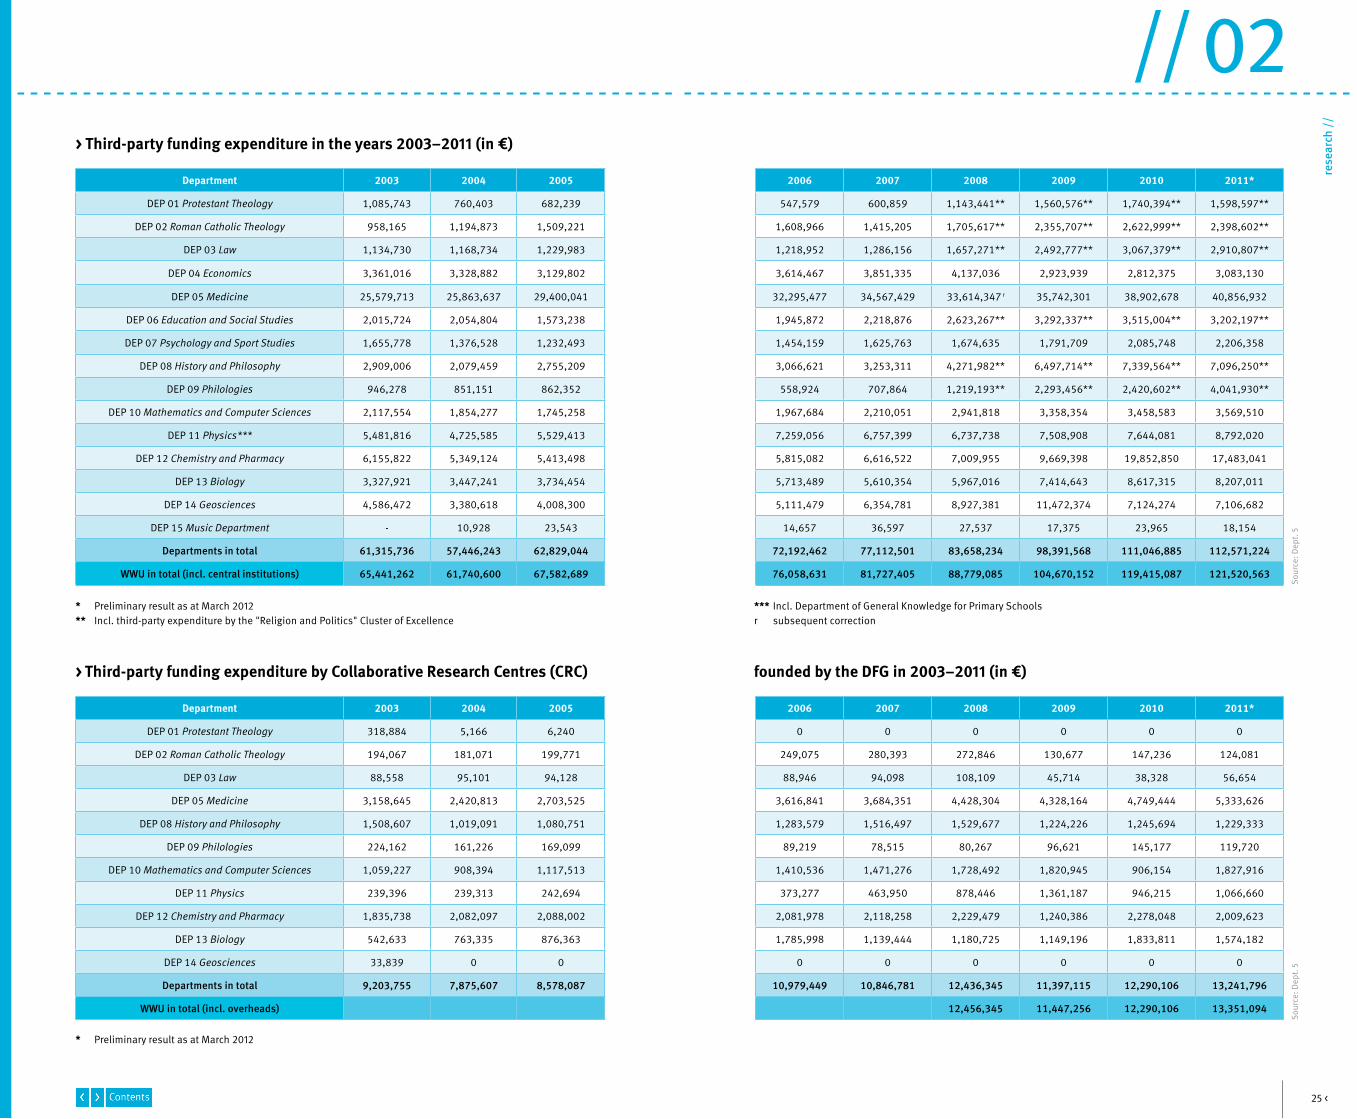
founded by the DFG in 2003–2011 (in €)
> Third-party funding expenditure in the years 2003–2011 (in €)
Department 2003 2004 2005 2006 2007 2008 2009 2010 2011*
DEP 01 Protestant Theology 318,884 5,166 6,240 0 0 0 0 0 0
DEP 02 Roman Catholic Theology 194,067 181,071 199,771 249,075 280,393 272,846 130,677 147,236 124,081
DEP 03 Law 88,558 95,101 94,128 88,946 94,098 108,109 45,714 38,328 56,654
DEP 05 Medicine 3,158,645 2,420,813 2,703,525 3,616,841 3,684,351 4,428,304 4,328,164 4,749,444 5,333,626
DEP 08 History and Philosophy 1,508,607 1,019,091 1,080,751 1,283,579 1,516,497 1,529,677 1,224,226 1,245,694 1,229,333
DEP 09 Philologies 224,162 161,226 169,099 89,219 78,515 80,267 96,621 145,177 119,720
DEP 10 Mathematics and Computer Sciences 1,059,227 908,394 1,117,513 1,410,536 1,471,276 1,728,492 1,820,945 906,154 1,827,916
DEP 11 Physics 239,396 239,313 242,694 373,277 463,950 878,446 1,361,187 946,215 1,066,660
DEP 12 Chemistry and Pharmacy 1,835,738 2,082,097 2,088,002 2,081,978 2,118,258 2,229,479 1,240,386 2,278,048 2,009,623
DEP 13 Biology 542,633 763,335 876,363 1,785,998 1,139,444 1,180,725 1,149,196 1,833,811 1,574,182
DEP 14 Geosciences 33,839 0 0 0 0 0 0 0 0
Departments in total 9,203,755 7,875,607 8,578,087 10,979,449 10,846,781 12,436,345 11,397,115 12,290,106 13,241,796
WWU in total (incl. overheads) 12,456,345 11,447,256 12,290,106 13,351,094
> Third-party funding expenditure by Collaborative Research Centres (CRC)
* Preliminary result as at March 2012** Incl. third-party expenditure by the "Religion and Politics" Cluster of Excellence
* Preliminary result as at March 2012
Sour
ce: D
ept.
5So
urce
: Dep
t. 5
Department 2003 2004 2005 2006 2007 2008 2009 2010 2011*
DEP 01 Protestant Theology 1,085,743 760,403 682,239 547,579 600,859 1,143,441** 1,560,576** 1,740,394** 1,598,597**
DEP 02 Roman Catholic Theology 958,165 1,194,873 1,509,221 1,608,966 1,415,205 1,705,617** 2,355,707** 2,622,999** 2,398,602**
DEP 03 Law 1,134,730 1,168,734 1,229,983 1,218,952 1,286,156 1,657,271** 2,492,777** 3,067,379** 2,910,807**
DEP 04 Economics 3,361,016 3,328,882 3,129,802 3,614,467 3,851,335 4,137,036 2,923,939 2,812,375 3,083,130
DEP 05 Medicine 25,579,713 25,863,637 29,400,041 32,295,477 34,567,429 33,614,347 r 35,742,301 38,902,678 40,856,932
DEP 06 Education and Social Studies 2,015,724 2,054,804 1,573,238 1,945,872 2,218,876 2,623,267** 3,292,337** 3,515,004** 3,202,197**
DEP 07 Psychology and Sport Studies 1,655,778 1,376,528 1,232,493 1,454,159 1,625,763 1,674,635 1,791,709 2,085,748 2,206,358
DEP 08 History and Philosophy 2,909,006 2,079,459 2,755,209 3,066,621 3,253,311 4,271,982** 6,497,714** 7,339,564** 7,096,250**
DEP 09 Philologies 946,278 851,151 862,352 558,924 707,864 1,219,193** 2,293,456** 2,420,602** 4,041,930**
DEP 10 Mathematics and Computer Sciences 2,117,554 1,854,277 1,745,258 1,967,684 2,210,051 2,941,818 3,358,354 3,458,583 3,569,510
DEP 11 Physics*** 5,481,816 4,725,585 5,529,413 7,259,056 6,757,399 6,737,738 7,508,908 7,644,081 8,792,020
DEP 12 Chemistry and Pharmacy 6,155,822 5,349,124 5,413,498 5,815,082 6,616,522 7,009,955 9,669,398 19,852,850 17,483,041
DEP 13 Biology 3,327,921 3,447,241 3,734,454 5,713,489 5,610,354 5,967,016 7,414,643 8,617,315 8,207,011
DEP 14 Geosciences 4,586,472 3,380,618 4,008,300 5,111,479 6,354,781 8,927,381 11,472,374 7,124,274 7,106,682
DEP 15 Music Department - 10,928 23,543 14,657 36,597 27,537 17,375 23,965 18,154
Departments in total 61,315,736 57,446,243 62,829,044 72,192,462 77,112,501 83,658,234 98,391,568 111,046,885 112,571,224
WWU in total (incl. central institutions) 65,441,262 61,740,600 67,582,689 76,058,631 81,727,405 88,779,085 104,670,152 119,415,087 121,520,563
*** Incl. Department of General Knowledge for Primary Schoolsr subsequent correction
27 <
// 02
rese
arch
//
Lesezeichen
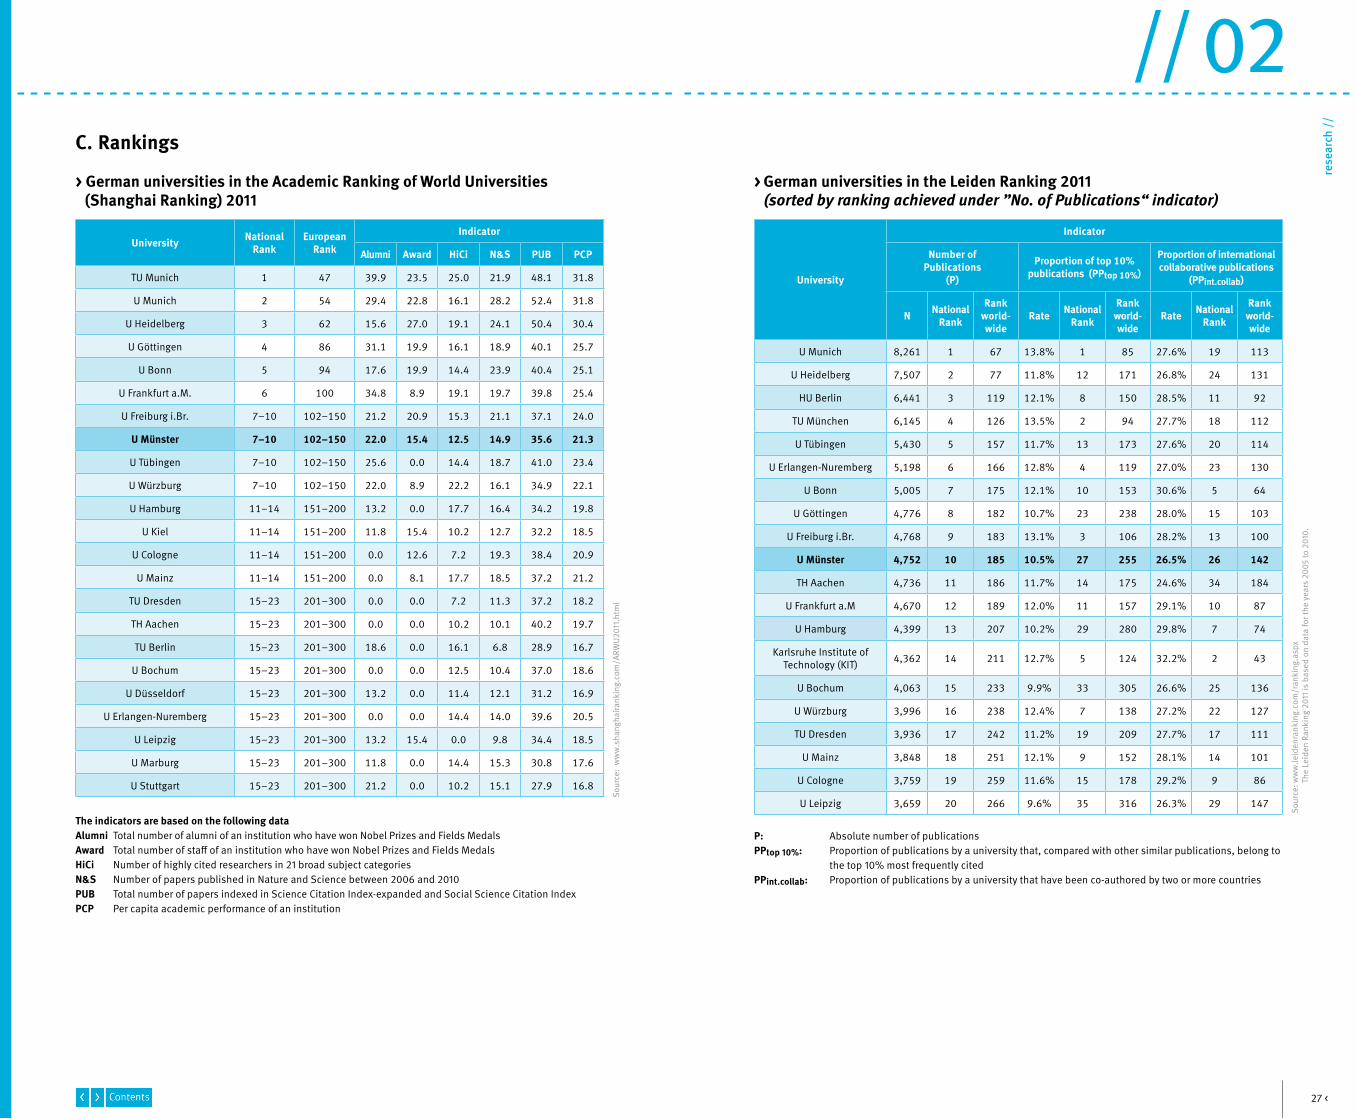
> German universities in the Leiden Ranking 2011 (sorted by ranking achieved under ”No. of Publications“ indicator)
> German universities in the Academic Ranking of World Universities (Shanghai Ranking) 2011
Sour
ce: w
ww
.leid
enra
nkin
g.co
m/r
anki
ng.a
spx
Th
e Le
iden
Ran
king
201
1 is
bas
ed o
n da
ta fo
r the
yea
rs 2
005
to 2
010.
Sour
ce:
ww
w.s
hang
haira
nkin
g.co
m/A
RWU
2011
.htm
l
P: Absolute number of publicationsPPtop 10%: Proportion of publications by a university that, compared with other similar publications, belong to the top 10% most frequently citedPPint.collab: Proportion of publications by a university that have been co-authored by two or more countries
The indicators are based on the following dataAlumni Total number of alumni of an institution who have won Nobel Prizes and Fields MedalsAward Total number of staff of an institution who have won Nobel Prizes and Fields MedalsHiCi Number of highly cited researchers in 21 broad subject categoriesN&S Number of papers published in Nature and Science between 2006 and 2010PUB Total number of papers indexed in Science Citation Index-expanded and Social Science Citation IndexPCP Per capita academic performance of an institution
C. Rankings
University NationalRank
EuropeanRank
Indicator
Alumni Award HiCi N&S PUB PCP
TU Munich 1 47 39.9 23.5 25.0 21.9 48.1 31.8
U Munich 2 54 29.4 22.8 16.1 28.2 52.4 31.8
U Heidelberg 3 62 15.6 27.0 19.1 24.1 50.4 30.4
U Göttingen 4 86 31.1 19.9 16.1 18.9 40.1 25.7
U Bonn 5 94 17.6 19.9 14.4 23.9 40.4 25.1
U Frankfurt a.M. 6 100 34.8 8.9 19.1 19.7 39.8 25.4
U Freiburg i.Br. 7–10 102–150 21.2 20.9 15.3 21.1 37.1 24.0
U Münster 7–10 102–150 22.0 15.4 12.5 14.9 35.6 21.3
U Tübingen 7–10 102–150 25.6 0.0 14.4 18.7 41.0 23.4
U Würzburg 7–10 102–150 22.0 8.9 22.2 16.1 34.9 22.1
U Hamburg 11–14 151–200 13.2 0.0 17.7 16.4 34.2 19.8
U Kiel 11–14 151–200 11.8 15.4 10.2 12.7 32.2 18.5
U Cologne 11–14 151–200 0.0 12.6 7.2 19.3 38.4 20.9
U Mainz 11–14 151–200 0.0 8.1 17.7 18.5 37.2 21.2
TU Dresden 15–23 201–300 0.0 0.0 7.2 11.3 37.2 18.2
TH Aachen 15–23 201–300 0.0 0.0 10.2 10.1 40.2 19.7
TU Berlin 15–23 201–300 18.6 0.0 16.1 6.8 28.9 16.7
U Bochum 15–23 201–300 0.0 0.0 12.5 10.4 37.0 18.6
U Düsseldorf 15–23 201–300 13.2 0.0 11.4 12.1 31.2 16.9
U Erlangen-Nuremberg 15–23 201–300 0.0 0.0 14.4 14.0 39.6 20.5
U Leipzig 15–23 201–300 13.2 15.4 0.0 9.8 34.4 18.5
U Marburg 15–23 201–300 11.8 0.0 14.4 15.3 30.8 17.6
U Stuttgart 15–23 201–300 21.2 0.0 10.2 15.1 27.9 16.8
University
Indicator
Number of Publications
(P)
Proportion of top 10% publications (PPtop 10%)
Proportion of international collaborative publications
(PPint.collab)
N NationalRank
Rank world-wide
Rate NationalRank
Rank world-wide
Rate NationalRank
Rank world-wide
U Munich 8,261 1 67 13.8% 1 85 27.6% 19 113
U Heidelberg 7,507 2 77 11.8% 12 171 26.8% 24 131
HU Berlin 6,441 3 119 12.1% 8 150 28.5% 11 92
TU München 6,145 4 126 13.5% 2 94 27.7% 18 112
U Tübingen 5,430 5 157 11.7% 13 173 27.6% 20 114
U Erlangen-Nuremberg 5,198 6 166 12.8% 4 119 27.0% 23 130
U Bonn 5,005 7 175 12.1% 10 153 30.6% 5 64
U Göttingen 4,776 8 182 10.7% 23 238 28.0% 15 103
U Freiburg i.Br. 4,768 9 183 13.1% 3 106 28.2% 13 100
U Münster 4,752 10 185 10.5% 27 255 26.5% 26 142
TH Aachen 4,736 11 186 11.7% 14 175 24.6% 34 184
U Frankfurt a.M 4,670 12 189 12.0% 11 157 29.1% 10 87
U Hamburg 4,399 13 207 10.2% 29 280 29.8% 7 74
Karlsruhe Institute of Technology (KIT) 4,362 14 211 12.7% 5 124 32.2% 2 43
U Bochum 4,063 15 233 9.9% 33 305 26.6% 25 136
U Würzburg 3,996 16 238 12.4% 7 138 27.2% 22 127
TU Dresden 3,936 17 242 11.2% 19 209 27.7% 17 111
U Mainz 3,848 18 251 12.1% 9 152 28.1% 14 101
U Cologne 3,759 19 259 11.6% 15 178 29.2% 9 86
U Leipzig 3,659 20 266 9.6% 35 316 26.3% 29 147

29 <
// 02
rese
arch
//
Lesezeichen
Higher Education InstitutionDFG awards in total
DFG awards in
Humanitiesand SocialSciences
LifeSciences
NaturalSciences
EngineeringSciences
Rank € m € m € m € m € m
TH Aachen 1 257.0 5.4 26.4 28.0 155.7
U Munich 2 249.0 35.1 112.8 58.3 2.9
U Heidelberg 3 215.4 39.5 89.5 39.0 6.2
TU Munich 4 200.4 1.8 55.8 48.7 62.6
FU Berlin 5 194.4 67.6 66.0 37.1 2.1
U Freiburg i.Br. 6 165.5 12.7 81.3 18.3 12.3
U Karlsruhe 7 159.4 2.9 6.9 36.9 67.6
U Erlangen-Nuremberg 8 157.6 10.0 54.6 33.2 59.8
U Göttingen 9 153.5 13.8 70.3 30.4 2.4
HU Berlin 10 153.4 45.9 71.9 31.0 4.5
U Cologne 11 126.4 23.2 69.6 31.3 2.3
U Frankfurt a.M. 12 124.8 34.3 60.2 28.8 1.6
U Bonn 13 122.6 16.4 43.3 57.9 5.0
U Tübingen 14 120.4 33.0 63.1 17.5 6.8
U Münster 15 119.9 41.7 41.0 34.8 2.4
U Konstanz 16 119.7 40.0 18.9 15.9 3.9
U Würzburg 17 110.4 7.6 76.8 22.6 3.5
TU Dresden 18 107.3 9.7 31.9 18.8 46.9
U Stuttgart 19 106.7 6.6 6.0 27.2 67.0
TU Darmstadt 20 106.1 6.1 6.1 23.2 70.7
HEIs in total 5,076.7 769.4 1,722.7 1,170.6 1,074.7
Higher Education Institution
Funding Ranking2009
(Awarding period2005–2007)
Funding Ranking2006
(Awarding period2002–2004)
Funding Ranking2003
(Awarding period1999–2001)
Funding Ranking2000
(Awarding period1996–1998)
Rank € m Rank € m Rank € m Rank € m
TH Aachen 1 257.0 2 126.2 1 119.2 2 96.2
U Munich 2 249.0 1 130.8 2 116.9 1 100.2
U Heidelberg 3 215.4 3 105.1 6 94.2 4 84.5
TU Munich 4 200.4 9 99.3 3 116.3 3 92.8
FU Berlin 5 194.4 10 96.6 13 76.6 13 71.7
U Freiburg i.Br. 6 165.5 11 91.1 11 85.2 15 68.5
U Karlsruhe 7 159.4 6 100.5 10 87.0 14 71.4
U Erlangen-Nuremberg 8 157.6 7 100.3 5 95.4 8 79.8
U Göttingen 9 153.5 12 85.1 15 74.0 11 75.6
HU Berlin 10 153.4 5 101.5 9 90.1 9 77.6
U Cologne 11 126.4 18 70.7 16 73.8 19 60.7
U Frankfurt a.M. 12 124.8 20 66.5 18 69.4 25 45.0
U Bonn 13 122.6 13 81.9 12 81.6 12 73,1
U Tübingen 14 120.4 8 99.7 4 100.2 6 80.9
U Münster 15 119.9 15 73.5 19 69.0 23 49.9
U Konstanz 16 119.7 34 43.7 29 43.2 30 37.2
U Würzburg 17 110.4 4 104.7 8 90.3 10 77.1
TU Dresden 18 107.3 20 66.5 24 57.2 24 47.4
U Stuttgart 19 106.7 14 79.1 7 93.2 5 83.8
TU Darmstadt 20 106.1 25 53.8 25 53.5 22 51.1
Top 20 in total 3,069.9 1,827.2 1,746.9 1,523.3
HEIs in total 5,076.7 3,241.1 3,095.4 3,093.3
> The 20 German universities with the highest DFG funding volume in the DFG Funding Ranking 2009 by scientific discipline
> The 20 German universities with the highest DFG funding volume – The DFG Funding Rankings
Rank 1 to 10 Rank 31 to 40
Rank 11 to 20 Rank 41 to 60
Rank 21 to 30 Rank 61 down
Sour
ce: G
erm
an R
esea
rch
Foun
datio
n (D
FG):
DFG
Fun
ding
Ran
king
200
9
Sour
ce: G
erm
an R
esea
rch
Foun
datio
n (D
FG):
DFG
Fun
ding
Ran
king
s 20
00, 2
003,
200
6 an
d 20
09
31 <
// 02
rese
arch
//
Lesezeichen
Higher EducationInstitution
Total Individual grants Collaborative ResearchCentres Clusters of Excellence Priority Programmes Research Training Groups Research Units
Rank € m Rank € m Rank € m Rank € m Rank € m Rank € m Rank € m
TH Aachen 1 257.0 2 67.1 2 56.0 1 56.5 1 17.9 10 8.9 21 6.0
U Munich 2 249.0 1 74.3 1 60.9 3 41.2 6 11.3 5 10.2 5 9.9
U Heidelberg 3 215.4 4 57.8 5 44.7 5 35.8 11 9.1 3 13.3 25 5.4
TU Munich 4 200.4 3 63.5 12 35.2 2 42.3 2 13.4 55 1.3 9 7.9
FU Berlin 5 194.4 8 48.8 3 47.6 6 35.1 9 10.0 18 6.5 2 11.7
U Freiburg i.Br. 6 165.5 6 53.1 19 29.0 16 17.2 32 5.3 4 10.4 23 5.8
U Karlsruhe 7 159.4 19 33.5 13 34.3 26 3.7 3 13.1 13 7.6 33 4.8
U Erlangen-Nuremberg 8 157.6 5 56.9 8 40.9 7 23.7 4 12.5 11 8.5 3 11.1
U Göttingen 9 153.5 7 49.6 29 19.8 28 3.0 21 6.4 2 14.0 1 12.3
HU Berlin 10 153.4 12 47.5 4 47.1 11 21.1 20 6.6 1 14.5 13 7.0
U Cologne 11 126.4 11 47.7 6 43.7 10 21.4 22 6.1 42 2.6 43 2.2
U Frankfurt a.M. 12 124.8 14 41.0 24 24.0 4 38.9 30 5.4 12 8.4 13 7.0
U Bonn 13 122.6 13 47.0 17 30.7 17 16.3 9 10.0 23 5.3 7 9.0
U Tübingen 14 120.4 9 48.7 16 31.3 20 14.8 15 7.2 6 9.6 8 8.8
U Münster 15 119.9 10 47.9 10 35.9 9 21.8 18 7.0 22 5.5 49 1.3
U Konstanz 16 119.7 39 20.8 23 24.6 15 17.3 52 2.4 26 5.0 27 5.3
U Würzburg 17 110.4 19 34.5 11 35.8 - - 19 6.7 8 9.1 15 6.9
TU Dresden 18 107.3 15 39.6 14 33.1 27 3.3 7 10.7 34 3.2 34 4.6
U Stuttgart 19 106.7 21 32.6 15 31.7 14 19.7 14 7.8 25 5.1 20 6.2
TU Darmstadt 20 106.1 18 35.3 25 22.7 12 20.4 11 9.1 6 9.6 30 5.0
HEIs in total 5,076.7 1,753.7 1,252.7 585.9 357.9 303.5 289.0
Number of reported HEIs 159 150 70 33 84 68 75
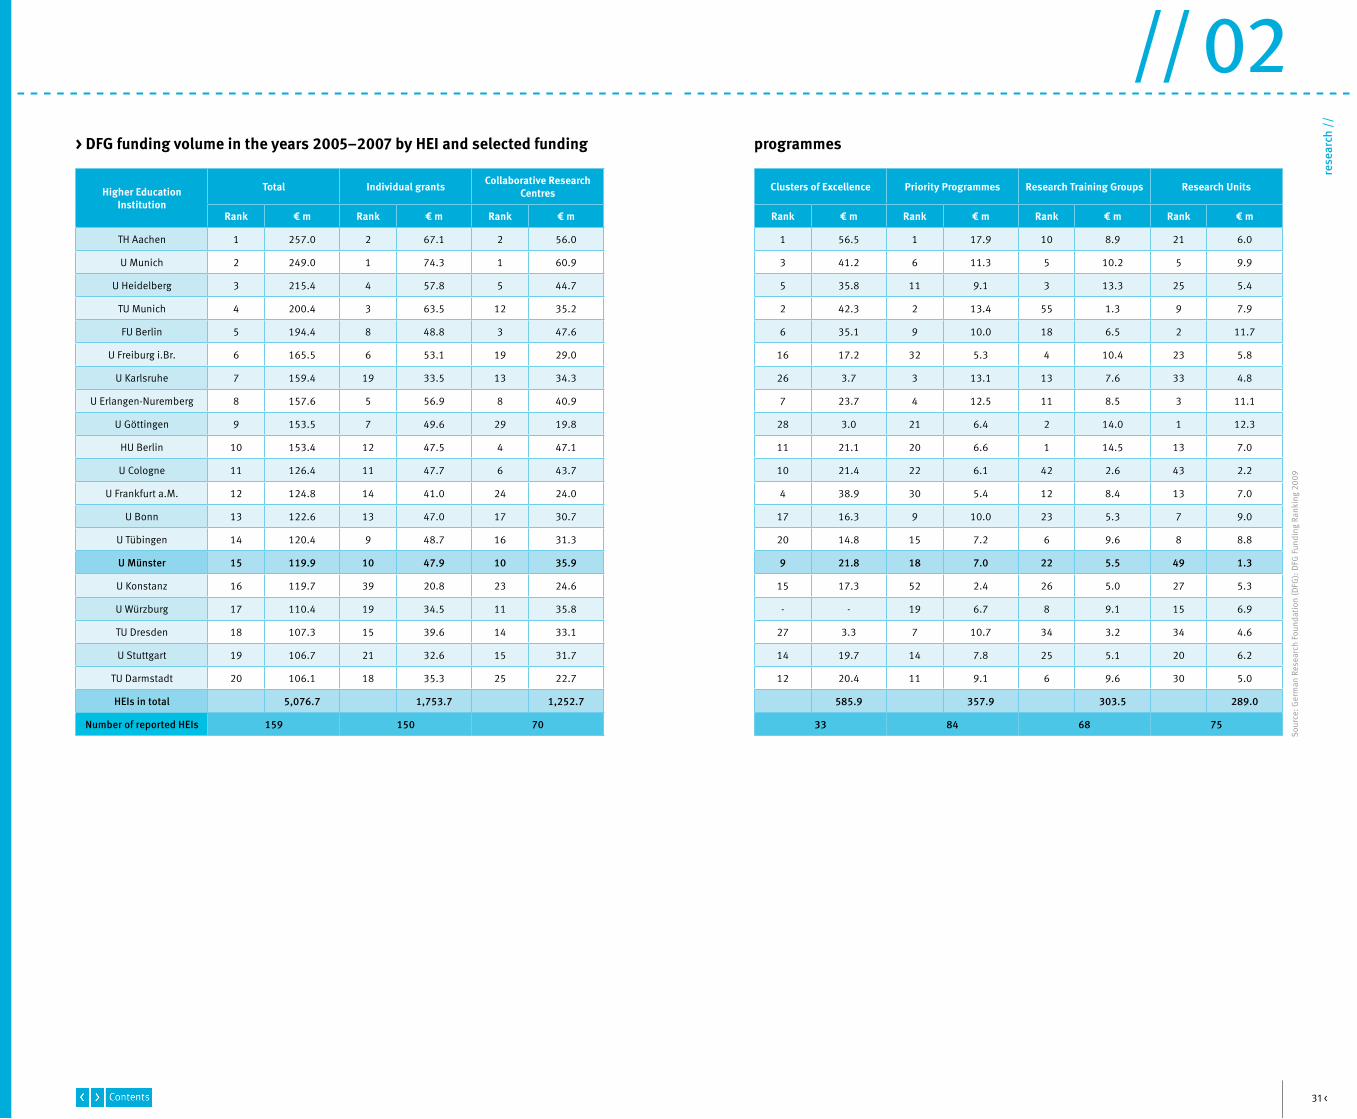
> DFG funding volume in the years 2005–2007 by HEI and selected funding programmes
Sour
ce: G
erm
an R
esea
rch
Foun
datio
n (D
FG):
DFG
Fun
ding
Ran
king
200
9
33 <
// 02
rese
arch
//
Lesezeichen
Sour
ce: G
erm
an F
eder
al S
tatis
tics
Offi
ce, s
ubje
ct s
erie
s 11
(Sta
tistis
ches
Bun
desa
mt,
Fach
serie
11)
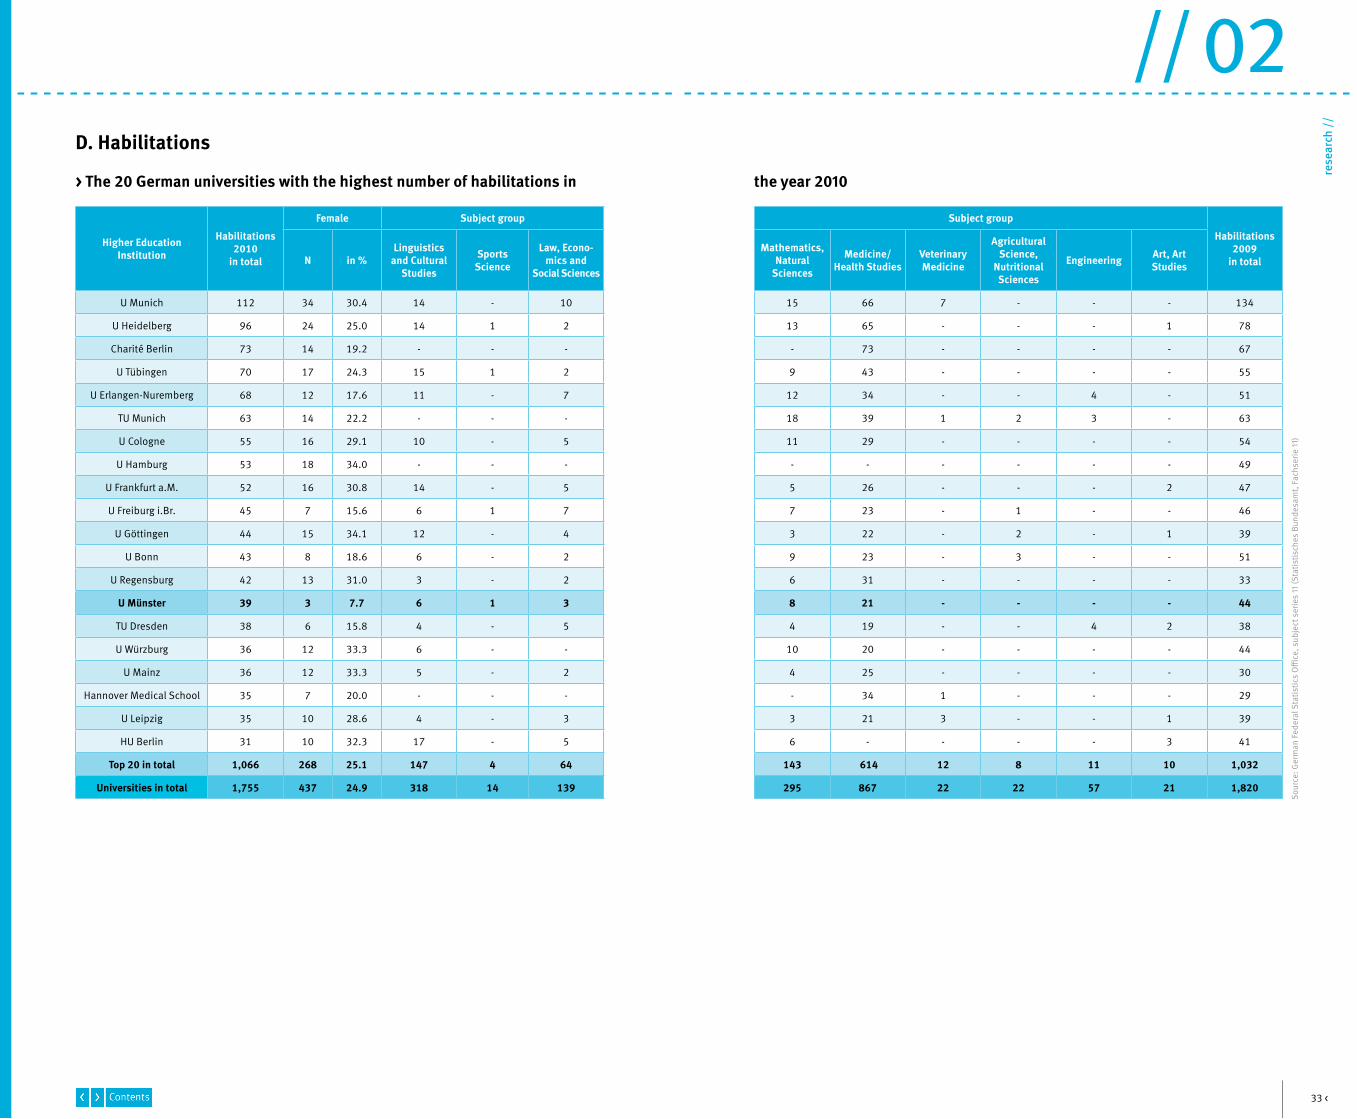
> The 20 German universities with the highest number of habilitations in the year 2010
D. Habilitations
Higher EducationInstitution
Habilitations2010
in total
Female Subject group Subject group
Habilitations2009
in totalN in %Linguistics
and CulturalStudies
SportsScience
Law, Econo-mics and
Social Sciences
Mathematics,Natural
Sciences
Medicine/Health Studies
VeterinaryMedicine
AgriculturalScience,
NutritionalSciences
Engineering Art, ArtStudies
U Munich 112 34 30.4 14 - 10 15 66 7 - - - 134
U Heidelberg 96 24 25.0 14 1 2 13 65 - - - 1 78
Charité Berlin 73 14 19.2 - - - - 73 - - - - 67
U Tübingen 70 17 24.3 15 1 2 9 43 - - - - 55
U Erlangen-Nuremberg 68 12 17.6 11 - 7 12 34 - - 4 - 51
TU Munich 63 14 22.2 - - - 18 39 1 2 3 - 63
U Cologne 55 16 29.1 10 - 5 11 29 - - - - 54
U Hamburg 53 18 34.0 - - - - - - - - - 49
U Frankfurt a.M. 52 16 30.8 14 - 5 5 26 - - - 2 47
U Freiburg i.Br. 45 7 15.6 6 1 7 7 23 - 1 - - 46
U Göttingen 44 15 34.1 12 - 4 3 22 - 2 - 1 39
U Bonn 43 8 18.6 6 - 2 9 23 - 3 - - 51
U Regensburg 42 13 31.0 3 - 2 6 31 - - - - 33
U Münster 39 3 7.7 6 1 3 8 21 - - - - 44
TU Dresden 38 6 15.8 4 - 5 4 19 - - 4 2 38
U Würzburg 36 12 33.3 6 - - 10 20 - - - - 44
U Mainz 36 12 33.3 5 - 2 4 25 - - - - 30
Hannover Medical School 35 7 20.0 - - - - 34 1 - - - 29
U Leipzig 35 10 28.6 4 - 3 3 21 3 - - 1 39
HU Berlin 31 10 32.3 17 - 5 6 - - - - 3 41
Top 20 in total 1,066 268 25.1 147 4 64 143 614 12 8 11 10 1,032
Universities in total 1,755 437 24.9 318 14 139 295 867 22 22 57 21 1,820
35 <
// 02
rese
arch
//
Lesezeichen
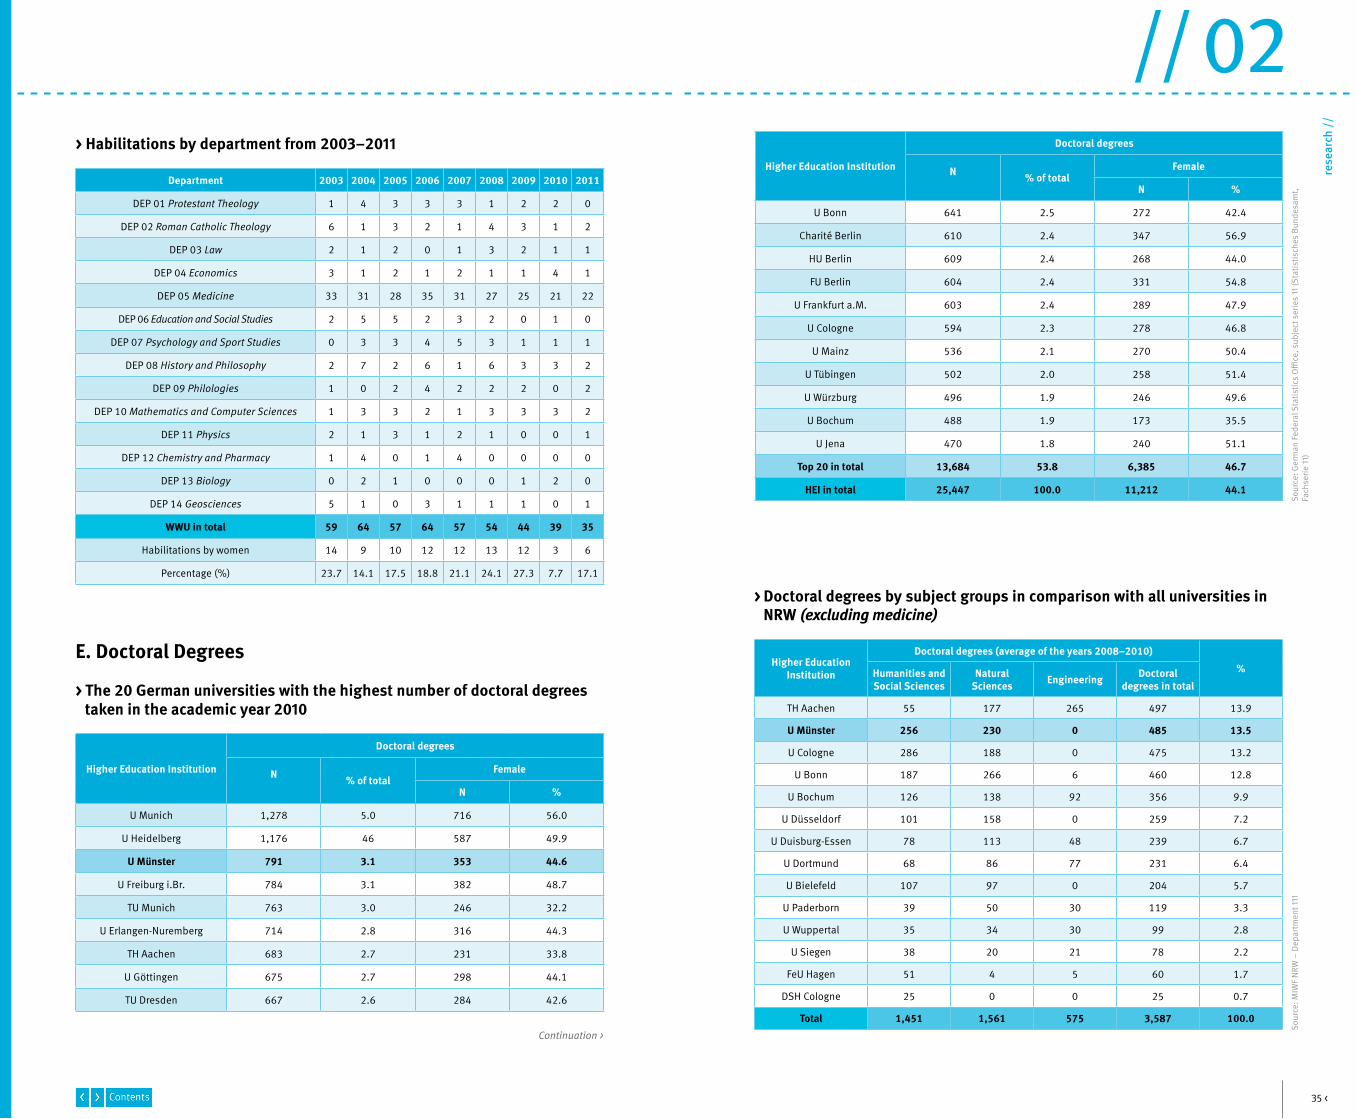
> Doctoral degrees by subject groups in comparison with all universities in NRW (excluding medicine)
Sour
ce: M
IWF
NRW
– D
epar
tmen
t 111
Sour
ce: G
erm
an F
eder
al S
tatis
tics
Offi
ce, s
ubje
ct s
erie
s 11
(Sta
tistis
ches
Bun
desa
mt,
Fach
serie
11)
> Habilitations by department from 2003–2011
> The 20 German universities with the highest number of doctoral degrees taken in the academic year 2010
E. Doctoral Degrees
Continuation >
Higher Education Institution
Doctoral degrees
N % of totalFemale
N %
U Munich 1,278 5.0 716 56.0
U Heidelberg 1,176 46 587 49.9
U Münster 791 3.1 353 44.6
U Freiburg i.Br. 784 3.1 382 48.7
TU Munich 763 3.0 246 32.2
U Erlangen-Nuremberg 714 2.8 316 44.3
TH Aachen 683 2.7 231 33.8
U Göttingen 675 2.7 298 44.1
TU Dresden 667 2.6 284 42.6
Higher Education Institution
Doctoral degrees
N % of totalFemale
N %
U Bonn 641 2.5 272 42.4
Charité Berlin 610 2.4 347 56.9
HU Berlin 609 2.4 268 44.0
FU Berlin 604 2.4 331 54.8
U Frankfurt a.M. 603 2.4 289 47.9
U Cologne 594 2.3 278 46.8
U Mainz 536 2.1 270 50.4
U Tübingen 502 2.0 258 51.4
U Würzburg 496 1.9 246 49.6
U Bochum 488 1.9 173 35.5
U Jena 470 1.8 240 51.1
Top 20 in total 13,684 53.8 6,385 46.7
HEI in total 25,447 100.0 11,212 44.1
Higher EducationInstitution
Doctoral degrees (average of the years 2008–2010)
%Humanities and Social Sciences
NaturalSciences Engineering Doctoral
degrees in total
TH Aachen 55 177 265 497 13.9
U Münster 256 230 0 485 13.5
U Cologne 286 188 0 475 13.2
U Bonn 187 266 6 460 12.8
U Bochum 126 138 92 356 9.9
U Düsseldorf 101 158 0 259 7.2
U Duisburg-Essen 78 113 48 239 6.7
U Dortmund 68 86 77 231 6.4
U Bielefeld 107 97 0 204 5.7
U Paderborn 39 50 30 119 3.3
U Wuppertal 35 34 30 99 2.8
U Siegen 38 20 21 78 2.2
FeU Hagen 51 4 5 60 1.7
DSH Cologne 25 0 0 25 0.7
Total 1,451 1,561 575 3,587 100.0
Department 2003 2004 2005 2006 2007 2008 2009 2010 2011
DEP 01 Protestant Theology 1 4 3 3 3 1 2 2 0
DEP 02 Roman Catholic Theology 6 1 3 2 1 4 3 1 2
DEP 03 Law 2 1 2 0 1 3 2 1 1
DEP 04 Economics 3 1 2 1 2 1 1 4 1
DEP 05 Medicine 33 31 28 35 31 27 25 21 22
DEP 06 Education and Social Studies 2 5 5 2 3 2 0 1 0
DEP 07 Psychology and Sport Studies 0 3 3 4 5 3 1 1 1
DEP 08 History and Philosophy 2 7 2 6 1 6 3 3 2
DEP 09 Philologies 1 0 2 4 2 2 2 0 2
DEP 10 Mathematics and Computer Sciences 1 3 3 2 1 3 3 3 2
DEP 11 Physics 2 1 3 1 2 1 0 0 1
DEP 12 Chemistry and Pharmacy 1 4 0 1 4 0 0 0 0
DEP 13 Biology 0 2 1 0 0 0 1 2 0
DEP 14 Geosciences 5 1 0 3 1 1 1 0 1
WWU in total 59 64 57 64 57 54 44 39 35
Habilitations by women 14 9 10 12 12 13 12 3 6
Percentage (%) 23.7 14.1 17.5 18.8 21.1 24.1 27.3 7.7 17.1
37 <
// 02
rese
arch
//
Lesezeichen
Department/Subject 2003 2004 2005 2006 2007 2008 2009 2010
Egyptology/Coptology 0 2 1 2 1 0 1 0
General Linguistics 1 2 4 0 1 0 1 0
English Philology (incl. Science of Books) 2 5 3 1 4 4 2 2
German Philology/Old and New German Literature 9 9 6 15 10 7 7 7
Indo-Germanic Linguistics 0 0 0 0 0 0 0 0
Indian Studies 0 0 0 0 0 0 0 0
Arabic and Islamic Studies 0 0 0 0 0 0 2 0
Sinology 0 0 2 0 0 0 0 1
Dutch Philology 0 0 1 1 2 0 1 1
Nordic Studies 0 0 0 0 0 1 0 0
Ancient Oriental Studies 0 1 1 2 0 1 1 0
Romance Language and Literature 3 3 1 2 1 1 2 1
Slavonic Studies 0 1 0 0 0 0 0 1
DEP 09 Philologies 15 23 19 23 19 14 17 13
DEP 10 Mathematics and Computer Science 16 15 19 11 22 17 10 29
Physics 15 27 11 15 16 16 23 31
Geophysics 0 1 1 4 6 0 0 0
DEP 11 Physics 15 28 12 19 22 16 23 31
Chemistry 54 78 73 72 49 70 82 80
Food Chemistry 6 2 3 3 5 3 0 20
Pharmacy 9 5 10 25 19 9 0 16
DEP 12 Chemistry and Pharmacy 69 85 86 100 73 82 82 116
DEP 13 Biology 49 36 54 50 43 48 66 81
Geography 11 8 3 7 5 6 17 11
Geology 1 4 0 7 7 1 3 8
Mineralogy 4 1 0 6 1 3 3 8
Planetology 0 0 0 0 0 2 3 1
DEP 14 Geosciences 16 13 3 20 13 12 26 28
Religious Studies 0 0 0 0 0 0 0 2
WWU in total 654 831 707 765 711 734 r 694 r 791
Doctoral degrees taken by female students 265 345 262 340 301 330 303 353
Percentage (%) 40.5 41.5 37.1 44.4 42.3 45.0 43.7 44.6
Doctoral degrees taken by foreign students 34 54 73 82 65 71 67 79
Percentage (%) 5.2 6.5 10.3 10.7 9.1 9.7 9.7 10.0
WWU in total (excluding medicine) 472 491 442 475 430 465 r 467 r 533
Doctoral degrees taken by female students 174 174 141 194 170 191 182 219
Percentage (%) 36.9 35.4 31.9 40.8 39.5 41.1 39.0 41.1
Doctoral degrees taken by foreign students 31 45 60 70 59 53 60 70
Percentage (%) 6.6 9.2 13.6 14.7 13.7 11.4 12.8 13.1
Sour
ce: I
nter
nal s
tatis
tics
of th
e W
WU
bas
ed o
n offi
cial
exa
min
atio
n st
atis
tics
> Doctoral degrees taken in the main subject in the academic years 2003–2010 by department/subject
Department/Subject 2003 2004 2005 2006 2007 2008 2009 2010
DEP 01 Protestant Theology 9 7 10 9 2 8 4 6
DEP 02 Roman Catholic Theology 8 14 13 10 17 13 0 12
DEP 03 Law 132 123 99 98 89 105 98 88
Business Administration 29 34 33 29 28 36 43 27
Economics 11 7 8 14 11 10 15 9
Information Systems 5 8 7 12 9 12 7 3
DEP 04 Economics 45 49 48 55 48 58 65 39
Medicine 158 274 216 235 209 209 170 207
Dentistry 24 66 49 55 72 60 57 51
DEP 05 Medicine 182 340 265 290 281 269 227 258
Education 10 8 10 15 7 9 12 14
Communication Studies 9 2 4 6 4 6 6 5
Political Sciences 14 20 12 10 13 14 12 19
Sociology 7 6 9 8 10 4 6 4
DEP 06 Education and Social Studies 40 36 35 39 34 33 36 42
Psychology 4 13 7 4 9 25 10 15
Sport Studies 0 3 2 2 3 4 1 0
DEP 07 Psychology and Sport Studies 4 16 9 6 12 29 11 15
Classical Philology 1 4 1 1 2 2 0 0
Archaeology 1 2 0 0 2 2 2 2
History 26 25 18 12 17 8 14 15
Art History 8 3 5 7 3 2 4 4
Medieval Latin Philology 1 1 1 1 1 0 1 1
Music Department 0 0 1 3 2 0 0 0
Musicology 5 1 1 2 2 3 2 2
Philosophy 3 4 2 4 4 2 3 4
Textile Design 0 0 0 2 0 0 0 0
Prehistory and Early History 0 2 0 0 3 8 2 1
Ethnology 1 2 1 2 0 1 0 2
Folklore and European Ethnology 8 2 5 1 0 2 1 0
DEP 08 History and Philosophy 54 46 35 35 36 30 29 31
Continuation >
r Internal correction based on 157 late registrations for the summer semester 2008 to the IT.NRW

// 03st
udyi
ng a
nd te
achi
ng /
/
41 <
// 03
stud
ying
and
teac
hing
//
Lesezeichen
> Female students at the 20 German universities with the highest number of students in the winter semester 2010/11
Sour
ce: G
erm
an F
eder
al S
tatis
tics
Offi
ce, s
ubje
ct s
erie
s 11
(Sta
tistis
ches
Bun
desa
mt,
Fach
serie
11)
, win
ter s
emes
ter 2
010/
11
Sour
ce: G
erm
an F
eder
al S
tatis
tics
Offi
ce, s
ubje
ct s
erie
s 11
(Sta
tistis
ches
Bun
desa
mt,
Fach
serie
11)
, win
ter s
emes
ter 2
010/
11
> The 20 German universities with the highest number of students in the winter semester 2010/11
A. Number of Students
Higher Education Institution
Students
Total German students Foreign students
Total
in their 1st … semester
Total
in their 1st … semester
Total
in their 1st … semester
univer-sity* subject* univer-
sity* subject* univer-sity* subject*
FeU Hagen 62,954 5,999 16,030 57,105 4,828 14,294 5,849 1,171 1,736
U Munich 43,807 7,669 10,838 37,613 6,101 8,917 6,194 1,568 1,921
U Cologne 42,127 4,707 7,330 37,170 3,700 6,093 4,957 1,007 1,237
U Frankfurt a.M. 38,244 5,029 8,246 31,925 4,044 6,784 6,319 985 1,462
U Hamburg 37,158 5,689 8,523 32,555 4,699 7,277 4,603 990 1,246
U Münster 36,286 4,717 7,808 33,417 4,073 7,060 2,869 644 748
U Mainz 35,596 4,411 5,907 31,677 3,762 5,311 3,919 649 596
U Duisburg-Essen 34,167 4,927 7,895 29,046 4,011 6,665 5,121 916 1,230
U Bochum 34,055 4,847 7,062 29,758 4,056 6,029 4,297 791 1,033
TU Dresden 33,230 5,351 8,269 29,913 4,425 7,182 3,317 926 1,087
TH Aachen 32,273 5,363 7,328 27,323 4,237 5,982 4,950 1,126 1,346
FU Berlin 32,043 4,795 8,009 26,001 2,816 6,015 6,042 1,979 1,994
HU Berlin 28,953 4,643 7,153 24,143 2,989 5,978 4,810 1,654 1,175
TU Berlin 28,893 3,536 5,741 23,128 2,508 4,435 5,765 1,028 1,306
U Erlangen-Nuremberg 27,745 5,369 7,629 25,304 4,727 6,826 2,441 642 803
U Heidelberg 27,166 3,983 5,220 22,489 2,911 4,440 4,677 1,072 780
U Leipzig 26,530 4,146 6,803 24,089 3,341 6,238 2,441 805 565
Baden Wuerttem-berg Cooperative State University
(FH)
26,098 8,326 8,678 25,510 8,175 8,523 588 151 155
U Bonn 26,023 3,765 5,576 22,553 2,979 4,636 3,470 786 940
TU Munich 26,000 5,791 7,696 21,487 4,287 6,076 4,513 1,504 1,620
Top 20 in total 679,348 103,063 157,741 592,206 82,669 134,761 87,142 20,394 22,980
Universities intotal 1,446,131 232,822 349,421 1,272,660 190,430 301,463 173,471 42,392 47,958
HEIs in total 2,217,294 386,921 543,096 1,965,262 326,407 476,189 252,032 60,514 66,907
Higher Education Institution
Students
Total German students Foreign students
Total
in their 1st … semester
Total
in their 1st … semester
Total
in their 1st … semester
univer-sity* subject* univer-
sity* subject* univer-sity* subject*
FeU Hagen 29,246 3,351 8,159 26,142 2,687 7,219 3,104 664 940
U Munich 27,254 4,926 6,709 23,062 3,878 5,432 4,192 1,048 1,277
U Cologne 23,925 2,969 4,387 20,745 2,302 3,582 3,180 667 805
U Frankfurt a.M. 22,254 3,037 4,880 18,252 2,442 3,980 4,002 595 900
U Hamburg 21,031 3,265 4,837 18,121 2,662 4,069 2,910 603 768
U Münster 19,279 2,691 4,515 17,621 2,299 4,057 1,658 392 458
U Mainz 20,887 2,902 3,731 18,303 2,437 3,304 2,584 465 427
U Duisburg-Essen 17,536 2,585 4,228 15,141 2,115 3,610 2,395 470 618
U Bochum 16,282 2,433 3,501 14,057 2,019 2,967 2,225 414 534
TU Dresden 14,386 2,355 3,754 12,807 1,905 3,201 1,579 450 553
TH Aachen 10,066 1,671 2,411 8,439 1,305 1,955 1,627 366 456
FU Berlin 18,884 2,950 4,836 15,071 1,676 3,591 3,813 1,274 1,245
HU Berlin 16,545 2,789 4,257 13,477 1,726 3,482 3,068 1,063 775
TU Berlin 9,501 1,182 2,049 7,296 764 1,512 2,205 418 537
U Erlangen-Nuremberg 14,389 2,789 3,903 13,036 2,426 3,462 1,353 363 441
U Heidelberg 15,448 2,307 2,968 12,506 1,645 2,475 2,942 662 493
U Leipzig 15,888 2,486 4,018 14,463 2,006 3,713 1,425 480 305
Baden Wuerttem-berg Cooperative State University
(FH)
11,755 3,767 3,900 11,467 3,698 3,830 288 69 70
U Bonn 14,009 2,228 3,195 12,026 1,763 2,647 1,983 465 548
TU Munich 8,614 1,788 2,564 7,068 1,320 2,030 1,546 468 534
Top 20 in total 347,179 54,471 82,802 299,100 43,075 70,118 48,079 11,396 12,684
Universities intotal 739,707 124,190 184,529 648,184 101,027 158,481 91,523 23,163 26,048
HEIs in total 1,059,809 191,330 266,582 934,176 159,694 231,819 125,633 31,636 34,763
* See definitions: university semester, subject semester * See definitions: university semester, subject semester

43 <
// 03
stud
ying
and
teac
hing
//
Lesezeichen
for each winter semester
Sour
ce: I
nter
nal W
WU
stu
dent
sta
tistic
s: w
inte
r sem
este
r 201
1/12
Reporting periodacademic year
(summer + wintersemester)
Starting point(previous winter
semester)
Developments in the reporting period Developments in the reportingperiod
Winter semesterNew enrolments (First-timeenrolments + students transferring
from another university = inflow)
Students transferring fromanother university 1831 Deregistrations (= outflow)
N
Change compared toprevious year
N
Change compared toprevious year
N
Change compared toprevious year
Semester TotalChange compared to previous year
Absolutenumber in % Absolute
number in % Absolutenumber in % Absolute
number in %
1981/82 38,979 8,331 - - 2,566 - - 6,510 - - 1981/82 40,800 - -
1982/83 40,800 8,703 372 4.5 2,719 153 6.0 6,701 191 2.9 1982/83 42,802 2,002 4.9
1983/84 42,802 8,578 - 125 - 1.4 2,690 - 29 - 1.1 7,142 441 6.6 1983/84 44,238 1,436 3.4
1984/85 44,238 8,018 - 560 - 6.5 2,899 209 7.8 7,807 665 9.3 1984/85 44,449 211 0.5
1985/86 44,449 7,911 - 107 - 1.3 2,985 86 3.0 7,911 104 1.3 1985/86 44,449 0 0.0
1986/87 44,449 7,664 - 247 - 3.1 2,746 - 239 - 8.0 8,173 262 3.3 1986/87 43,940 - 509 - 1.1
1987/88 43,940 8,186 522 6.8 2,630 - 116 - 4.2 7,649 - 524 - 6.4 1987/88 44,477 537 1.2
1988/89 44,477 8,354 168 2.1 2,639 9 0.3 7,680 31 0,4 1988/89 45,151 674 1.5
1989/90 45,151 7,814 - 540 - 6.5 2,375 - 264 -1 0.0 8,740 1,060 13.8 1989/90 44,225 - 926 - 2.1
1990/91 44,225 8,305 491 6.3 2,250 - 125 - 5.3 8,019 - 721 - 8.2 1990/91 44,511 286 0.6
1991/92 44,511 8,279 - 26 - 0.3 2,202 - 48 - 2.1 7,830 - 189 - 2.4 1991/92 44,960 449 1.0
1992/93 44,960 7,534 - 745 - 9.0 2,097 - 105 - 4.8 7,718 - 112 - 1.4 1992/93 44,776 - 184 - 0.4
1993/94 44,776 7,370 - 164 - 2.2 2,073 - 24 - 1.1 7,714 -4 -0.1 1993/94 44,432 - 344 - 0.8
1994/95 44,432 7,512 142 1.9 2,167 94 4.5 7,303 - 411 - 5.3 1994/95 44,641 209 0.5
1995/96 44,641 7,643 131 1.7 2,256 89 4.1 7,356 53 0.7 1995/96 44,928 287 0.6
1996/97 44,928 7,895 252 3.3 2,234 - 22 - 1.0 7,660 304 4.1 1996/97 45,163 235 0.5
1997/98 45,163 7,761 - 134 - 1.7 2,314 80 3.6 7,277 - 383 - 5.0 1997/98 45,647 484 1.1
1998/99 45,647 7,504 - 257 - 3.3 2,311 - 3 - 0.1 7,952 675 9.3 1998/99 45,199 - 448 - 1.0
1999/00 45,199 7,611 107 1.4 2,301 - 10 - 0.4 8,122 170 2.1 1999/00 44,688 - 511 - 1.1
2000/01 44,688 7,694 83 1.1 2,256 - 45 - 2.0 8,522 400 4.9 2000/01 43,860 - 828 - 1.9
2001/02 43,860 8,387 693 9.0 2,362 106 4.7 8,425 - 97 - 1.1 2001/02 43,822 - 38 - 0.1
2002/03 43,822 8,396 9 0.1 2,302 - 60 - 2.5 8,418 - 7 - 0.1 2002/03 43,800 - 22 - 0.1
2003/04 43,800 8,586 190 2.3 2,432 130 5.6 8,908 490 5.8 2003/04 43,478 - 322 - 0.7
2004/05 43,478 7,858 - 728 - 8.5 1,933 - 499 - 20.5 12,312 3,404 38.2 2004/05 39,227 - 4,251 - 9.8
2005/06 39,227 7,997 139 1.8 2,032 99 5.1 7,402 - 4,910 - 39.9 2005/06 39,822 595 1.5
2006/07 39,822 7,925 - 72 - 0.9 1,916 - 116 - 5.7 7,441 39 0.5 2006/07 40,306 484 1.2
2007/08 40,306 6,280 - 1,645 - 20.8 1,616 - 300 - 15.7 8,416 975 13.1 2007/08 38,170 - 2,136 - 5.3
2008/09 38,170 6,274 - 6 - 0.1 1,612 - 4 - 0.2 7,218 - 1,198 - 14.2 2008/09 37,226 -944 - 2.5
2009/10 37,226 6,779 505 8.0 1,863 251 15.6 7,242 24 0.3 2009/10 36,763 -463 - 1.2
2010/11 36,763 7,750 971 14.3 2,320 457 24.5 7,316 74 1.0 2010/11 37,197 434 1.2
2011/12 37,197 9,013 1,263 16.3 3,099 779 33.6 7,182 -134 -1.8 2011/12 39,028 1,831 4.9
> Development in the number of students, with a breakdown of figures,

45 <
// 03
stud
ying
and
teac
hing
//
Lesezeichen
Sour
ce: I
nter
nal W
WU
stu
dent
sta
tistic
s: w
inte
r sem
este
r 201
1/12
Sour
ce: I
nter
nal W
WU
stu
dent
sta
tistic
s
> WWU students by department in the winter semester 2011/12
> Number of students from 1909–2011 (average per year)
Male Female Total
5,000
10,000
15,000
20,000
25,000
30,000
35,000
40,000
45,000
01910 1915 1920 1925 1930 1935 1940 1945 1950 1955 1960 1965 1970 1975 1980 1985 1990 1995 2000 2005 2010
DepartmentStudents New enrolments Foreign students
Male Female Total Male Female Total Male Female Total
DEP 01 Protestant Theology 327 567 894 69 107 176 15 8 23
DEP 02 Roman Catholic Theology 638 743 1,381 83 147 230 32 26 58
DEP 03 Law 2,319 2,295 4,614 359 353 712 120 159 279
DEP 04 Economics 2,897 1,595 4,492 695 470 1,165 191 234 425
DEP 05 Medicine 1,195 1,741 2,936 99 181 280 144 153 297
DEP 06 Education and Social Studies 1,459 2,410 3,869 174 348 522 127 325 452
DEP 07 Psychology and Sport Studies 674 1,068 1,742 83 153 236 20 55 75
DEP 08 History and Philosophy 1,774 1,775 3,549 302 308 610 79 111 190
DEP 09 Philologies 1,448 3,730 5,178 260 799 1,059 155 349 504
DEP 10 Mathematics and Computer Sciences 1,422 1,014 2,436 302 147 449 71 35 106
DEP 11 Physics 962 377 1,339 291 136 427 50 22 72
DEP 12 Chemistry and Pharmacy 1,446 1,356 2,802 352 266 618 139 97 236
DEP 13 Biology 591 1,045 1,636 112 236 348 57 104 161
DEP 14 Geosciences 972 651 1,623 175 127 302 49 50 99
DEP 15 Music Department 96 149 245 21 30 51 52 89 141
Interdisciplinary Course of Studies 90 202 292 56 124 180 3 14 17
Total 18,310 20,718 39,028 3,433 3,932 7,365 1,304 1,831 3,135
47 <
// 03
stud
ying
and
teac
hing
//
Lesezeichen
Department/SubjectWinter semester
03/04 04/05 05/06 06/07 07/08 08/09 09/10 10/11 11/12
Protestant Theology 512 421 435 429 479 446 461 618 894
Jewish Studies 2 1 1 1 0 1 0 0 0
DEP 01 Protestant Theology 514 422 436 430 479 447 461 618 894
DEP 02 Roman Catholic Theology 1,006 822 802 779 855 842 852 1,013 1,370
DEP 03 Law 5,081 4,527 4,540 4,508 4,297 4,332 4,285 4,384 4,609
Household Economics 59 41 37 34 21 13 10 6 4
Information Systems 869 821 786 772 738 694 681 687 666
Business Administration/Economics 4,451 4,123 3,987 3,860 3,619 3,576 3,692 3,646 3,793
DEP 04 Economics 5,379 4,985 4,810 4,666 4,378 4,283 4,383 4,339 4,463
Medicine 2,461 2,299 2,195 2,200 2,171 2,157 2,113 2,121 2,195
Dentistry 727 712 719 728 713 717 731 748 741
DEP 05 Medicine 3,188 3,011 2,914 2,928 2,884 2,874 2,844 2,869 2,936
Communication Studies 935 933 940 945 901 897 769 678 632
Education 1,839 1,532 1,609 1,815 1,911 2,090 2,222 2,001 1,766
Social Sciences 2,458 2,213 2,201 2,101 1,904 1,760 1,621 1,507 1,485
of which Political Sciences 1,566 1,431 1,421 1,393 1,299 1,236 1,147 1,074 1,065
of which Sociology 624 544 561 509 440 385 354 330 309
of which Social Science(Teaching degree) 268 238 219 199 165 139 120 103 111
DEP 06 Education and SocialStudies 5,232 4,678 4,750 4,861 4,716 4,747 4,612 4,186 3,883
Psychology 869 840 878 934 949 966 1,016 1,027 1,025
Sport Studies 959 831 828 820 784 728 724 740 717
DEP 07 Psychology and SportStudies 1,828 1,671 1,706 1,754 1,733 1,694 1,740 1,767 1,742
Archaeology 197 168 153 123 108 111 113 109 122
Byzantine Studies 12 10 7 8 9 7 9 10 10
History 1,725 1,448 1,482 1,544 1,436 1,428 1,334 1,495 1,508
Classical Philology 223 205 228 269 272 285 298 334 356
Art History 450 433 426 407 361 356 334 404 372
Medieval Latin Philology 7 4 6 5 5 5 6 6 5
> Students at WWU by department/subject from 2003–2011
Continuation >
Target degreeWinter semester
03/04 04/05 05/06 06/07 07/08 08/09 09/10 10/11 11/12
Diploma 11,981 10,474 10,136 9,294 7,104 5,471 4,216 2,833 1,806
State examination 7,932 7,212 7,245 7,282 6,928 6,982 6,817 6,716 6,911
Ecclesiastical degree + Licentiate + Magister Theologiae 272 227 227 228 280 298 290 489 736
Magister Artium (M.A.) 7,068 5,935 5,732 4,560 3,495 2,850 2,186 1,582 1,153
PhD/MD (Doctoral degree) 3,699 4,389 4,238 4,294 4,381 4,413 4,487 4,805 4,906
Bachelor (BA, BSc) 355 537 1,115 2,129 3,592 4,897 5,955 6,458 7,470
Bachelor with two equalsubjects (BA 2-HF) (without
teaching degrees)*· · 217 645 825 989 1,099 1,385 1,679
Master (MA, MSc) 28 38 60 145 216 494 1,078 1,995 2,888
Master of Further Education** · · · · · · 46 134 161
others 1,154 419 482 495 601 893 1,173 983 942
Teaching degree for elementaryschool: LA Primarstufe/
LA GHR, G/BA KJ (G)2,198 1,995 2,118 2,048 1,762 1,461 1,059 1,049 1,049
Teaching degree for elementary,secondary and comprehensiveschools: LA Sekundarstufe I/LA
GHR, HRGe/BA KJ (HRGe)
1,513 1,200 1,342 1,422 1,361 1,235 1,101 1,153 1,161
Teaching degree for grammar/comprehensive schools:
LA Sekundarstufe II/I/LA Gym/Ges/BA–2 HF
5,953 5,014 5,259 6,024 5,790 5,404 4,673 4,541 5,018
Teaching degrees in total 9,664 8,209 8,719 9,494 8,913 8,100 6,833 6,743 7,228
Master of Education forelementary school (MEd, G) · · · · · 155 382 368 386
Master of Education forsecondary school (MEd, HRGe) · · · · · 61 197 209 237
Master of Education forsecondary school
(Med, GyGe/BAB/BK2F)· · · · · 178 794 1,196 1,351
Master of Education in total · · · · · 394 1.373 1,773 1,974
WWU in total 42,153 37,440 38,171 38,566 36,335 35,781 35,553 35,897 37,854
Bachelor of Music (BM) · 17 50 65 80 67 99 79 71
Master of Music · · · · · · · 40 49
Graduate Musician · 100 94 92 76 48 68 73 61
Graduate Music Teacher · 91 74 56 44 23 25 32 32
WWU + Music Department 42,153 37,648 38,389 38,779 36,535 35,919 35,745 36,121 38,067
> WWU students* by target degree (in their main subject)* regular students only (excluding students currently on leave, guest students, cross-registered students from
other universities and foreign students attending German language programmes)
· No possibility of studying for this particular type of degree at WWU.* On the basis of empirical analyses of students in the polyvalent Bachelor courses with two subjects, one-fifth of students of Protestant or Roman
Catholic Religious Studies, History, English Philology, German Philology and Romance Studies and Language were taken into account, as were all students of Religious Studies, Economics, Political Sciences, Sociology, Archaeology-History-Landscape, Classical and Early Christian Archeaology, Art History, Cultural and Social Anthropology, Musicology, Regional Studies Eastern Central Europe, Arabic and Islamic Studies, Ancient Cultures of Egypt and the Middle East, Dutch-German Studies, Scandinavian Studies, Communication Studies and Chinese Studies.
** Students taking a Master’s degree in further education were included in the WWU student statistics for the first time in the winter semester 2009/10.
Sour
ce: I
nter
nal W
WU
stu
dent
sta
tistic
s: w
inte
r sem
este
r 201
0/11
49 <
// 03
stud
ying
and
teac
hing
//
Lesezeichen
Department/SubjectWinter semester
03/04 04/05 05/06 06/07 07/08 08/09 09/10 10/11 11/12
Pharmacy 824 763 792 808 776 780 818 841 864
DEP 12 Chemistry and Pharmacy 2,352 2,210 2,356 2,494 2,425 2,394 2,416 2,511 2,802
DEP 13 Biology 1,620 1,536 1,548 1,506 1,414 1,424 1,478 1,523 1,636
Geography 1,539 1,406 1,453 1,469 1,400 1,317 1,300 1,329 1,267
Geosciences 338 254 301 269 255 278 289 351 349
Planetology 5 5 7 8 6 8 6 8 7
DEP 14 Geosciences 1,882 1,665 1,761 1,746 1,661 1,603 1,595 1,688 1,623
DEP 15 Music Department · 215 226 223 205 187 246 264 270
General Knowledge for PrimarySchool (Social Studies) 43 16 13 7 6 5 5 4 4
General Knowledge for PrimarySchool (Social Sciences) 1 3 9 10 11 12 15 15 16
General Knowledge for PrimarySchool (general) 511 426 338 228 92 43 27 21 17
General Knowledge for Primary School
(Natural Sciences/Technology)28 10 6 6 5 5 3 3 3
General Knowledge for PrimarySchool (Natural Sciences) 3 5 7 7 9 12 13 15 14
Dutch Studies 248 196 190 165 142 120 105 96 275
Regional Studies Latin America 19 12 6 1 1 0 . . .
Religious Studies 17 28 47 49 53 45 47 47 46
Courses of study not assignedto a particular department (incl. General Knowledge
for Primary School)
870 696 616 473 319 242 215 201 375
WWU in total 43,478 39,227 39,822 40,306 38,170 37,224 36,762 37,197 39,028
Female students 22,445 20,713 21,186 21,589 20,363 19,886 19,568 19,884 20,718
Percentage (%) 51.6 52.8 53.2 53.6 53.3 53.4 53.2 53.5 53.1
Foreign students 3,877 3,691 3,551 3,489 3,161 3,022 2,936 3,047 3,135
Percentage (%) 8.9 9.4 8.9 8.7 8.3 8.1 8.0 8.2 8.0
· No possibility of studying this particular course at WWU
Sour
ce: I
nter
nal W
WU
Stu
dent
Sta
tistic
s: w
inte
r sem
este
r 201
1/12
Department/SubjectWinter semester
03/04 04/05 05/06 06/07 07/08 08/09 09/10 10/11 11/12
Music 230 157 138 115 128 132 156 170 174
Musicology 140 89 74 78 79 72 72 95 128
Philosophy 614 353 327 335 305 315 324 399 407
Textile Design 53 30 22 7 7 0 0 0 0
Prehistory and Early History 138 139 143 133 116 119 116 122 140
Ethnology 199 208 204 193 216 221 207 208 216
Folklore and European Ethnology 101 95 115 103 87 84 84 84 86
DEP 08 History and Philosophy 4,089 3,339 3,325 3,320 3,129 3,135 3,053 3,436 3,524
Egyptology/Coptology 110 115 117 76 55 42 32 31 27
General Linguistics 140 115 128 105 88 64 51 40 39
English Philology 1,546 1,347 1,372 1,428 1,271 1,168 1,086 1,045 1,056
Baltic Studies 15 10 9 8 5 1 1 1 1
German Philology/Old and NewGerman Literature 3,672 3,499 3,743 3,996 3,611 3,171 2,736 2,547 2,553
Indo-Germanic Linguistics 10 24 25 16 13 11 8 7 5
Indian Studies 14 9 5 2 1 1 0 0 0
Arabic and Islamic Studies 85 107 111 129 126 138 139 156 209
Dutch Philology 146 105 111 109 112 108 130 138 134
Nordic Studies 99 86 107 98 83 86 88 106 128
Ancient Oriental Studies 33 29 27 23 37 40 50 52 85
Romance Language and Literature 887 663 664 748 685 716 738 734 733
Sinology 74 82 118 93 80 82 85 98 109
Slavonic Studies 109 76 61 45 38 29 40 51 64
DEP 09 Philologies 6,940 6,267 6,598 6,876 6,205 5,657 5,184 5,006 5,143
DEP 10 Mathematics andComputer Science 2,440 2,205 2,414 2,660 2,470 2,456 2,420 2,406 2,436
Astronomy 1 1 1 1 1 1 1 1 1
Physics 873 817 883 910 860 789 812 831 1,086
Geophysics 115 82 104 132 97 80 120 119 205
Technology 68 43 32 39 42 37 45 35 30
DEP 11 Physics 1,057 943 1,020 1,082 1,000 907 978 986 1,322
Chemistry 1,320 1,263 1,358 1,456 1,420 1,375 1,360 1,441 1,723
Food Chemistry 208 184 206 230 229 239 238 229 215
Continuation >
51 <
// 03
stud
ying
and
teac
hing
//
Lesezeichen
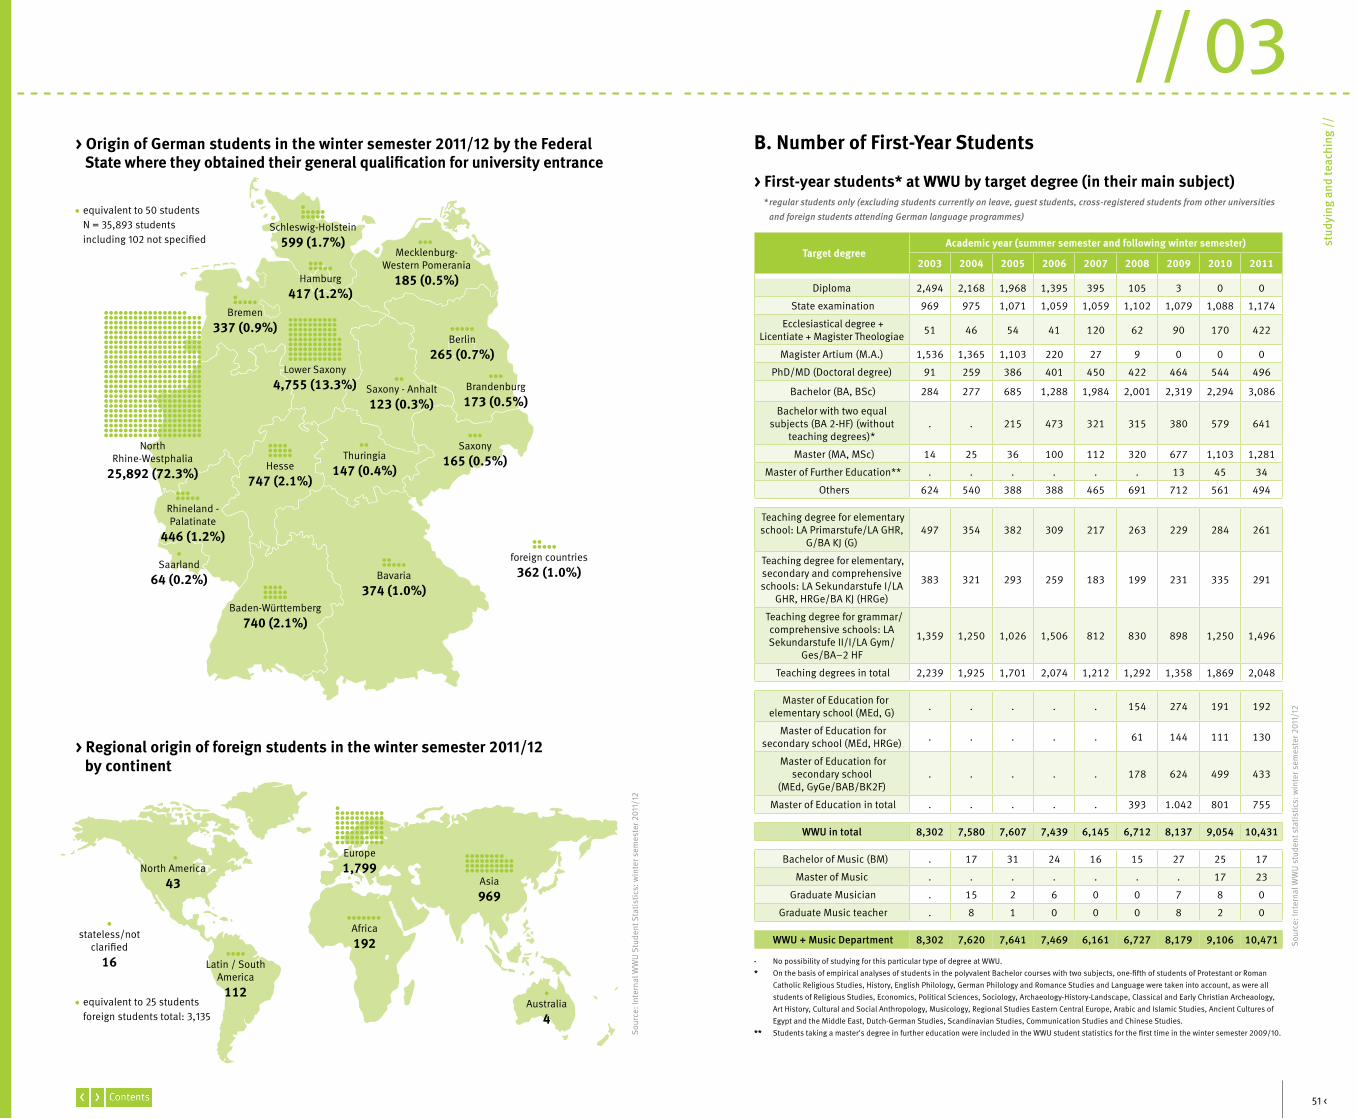
North Rhine-Westphalia
25,892 (72.3%)
Lower Saxony4,755 (13.3%)
Europe1,799
Asia969
Africa192
North America43
Australia4
stateless/notclarified
16 Latin / SouthAmerica
112
Bremen337 (0.9%)
Schleswig-Holstein599 (1.7%)
Hamburg417 (1.2%)
foreign countries362 (1.0%)
Mecklenburg-Western Pomerania
185 (0.5%)
Hesse747 (2.1%)
Rhineland -Palatinate
446 (1.2%)
Saarland64 (0.2%) Bavaria
374 (1.0%)Baden-Württemberg
740 (2.1%)
Thuringia147 (0.4%)
Saxony165 (0.5%)
Berlin265 (0.7%)
Saxony - Anhalt123 (0.3%)
Brandenburg173 (0.5%)
> Regional origin of foreign students in the winter semester 2011/12 by continent
equivalent to 50 studentsN = 35,893 students including 102 not specified
equivalent to 25 studentsforeign students total: 3,135
> First-year students* at WWU by target degree (in their main subject)* regular students only (excluding students currently on leave, guest students, cross-registered students from other universities and foreign students attending German language programmes)
· No possibility of studying for this particular type of degree at WWU.* On the basis of empirical analyses of students in the polyvalent Bachelor courses with two subjects, one-fifth of students of Protestant or Roman
Catholic Religious Studies, History, English Philology, German Philology and Romance Studies and Language were taken into account, as were all students of Religious Studies, Economics, Political Sciences, Sociology, Archaeology-History-Landscape, Classical and Early Christian Archeaology, Art History, Cultural and Social Anthropology, Musicology, Regional Studies Eastern Central Europe, Arabic and Islamic Studies, Ancient Cultures of Egypt and the Middle East, Dutch-German Studies, Scandinavian Studies, Communication Studies and Chinese Studies.
** Students taking a master's degree in further education were included in the WWU student statistics for the first time in the winter semester 2009/10.
Sour
ce: I
nter
nal W
WU
stu
dent
sta
tistic
s: w
inte
r sem
este
r 201
1/12
Sour
ce: I
nter
nal W
WU
Stu
dent
Sta
tistic
s: w
inte
r sem
este
r 201
1/12
B. Number of First-Year Students
Target degreeAcademic year (summer semester and following winter semester)
2003 2004 2005 2006 2007 2008 2009 2010 2011
Diploma 2,494 2,168 1,968 1,395 395 105 3 0 0
State examination 969 975 1,071 1,059 1,059 1,102 1,079 1,088 1,174
Ecclesiastical degree + Licentiate + Magister Theologiae 51 46 54 41 120 62 90 170 422
Magister Artium (M.A.) 1,536 1,365 1,103 220 27 9 0 0 0
PhD/MD (Doctoral degree) 91 259 386 401 450 422 464 544 496
Bachelor (BA, BSc) 284 277 685 1,288 1,984 2,001 2,319 2,294 3,086
Bachelor with two equalsubjects (BA 2-HF) (without
teaching degrees)*. . 215 473 321 315 380 579 641
Master (MA, MSc) 14 25 36 100 112 320 677 1,103 1,281
Master of Further Education** . . . . . . 13 45 34
Others 624 540 388 388 465 691 712 561 494
Teaching degree for elementaryschool: LA Primarstufe/LA GHR,
G/BA KJ (G)497 354 382 309 217 263 229 284 261
Teaching degree for elementary,secondary and comprehensiveschools: LA Sekundarstufe I/LA
GHR, HRGe/BA KJ (HRGe)
383 321 293 259 183 199 231 335 291
Teaching degree for grammar/comprehensive schools: LASekundarstufe II/I/LA Gym/
Ges/BA–2 HF
1,359 1,250 1,026 1,506 812 830 898 1,250 1,496
Teaching degrees in total 2,239 1,925 1,701 2,074 1,212 1,292 1,358 1,869 2,048
Master of Education forelementary school (MEd, G) . . . . . 154 274 191 192
Master of Education forsecondary school (MEd, HRGe) . . . . . 61 144 111 130
Master of Education for secondary school
(MEd, GyGe/BAB/BK2F). . . . . 178 624 499 433
Master of Education in total . . . . . 393 1.042 801 755
WWU in total 8,302 7,580 7,607 7,439 6,145 6,712 8,137 9,054 10,431
Bachelor of Music (BM) . 17 31 24 16 15 27 25 17
Master of Music . . . . . . . 17 23
Graduate Musician . 15 2 6 0 0 7 8 0
Graduate Music teacher . 8 1 0 0 0 8 2 0
WWU + Music Department 8,302 7,620 7,641 7,469 6,161 6,727 8,179 9,106 10,471
> Origin of German students in the winter semester 2011/12 by the Federal State where they obtained their general qualification for university entrance
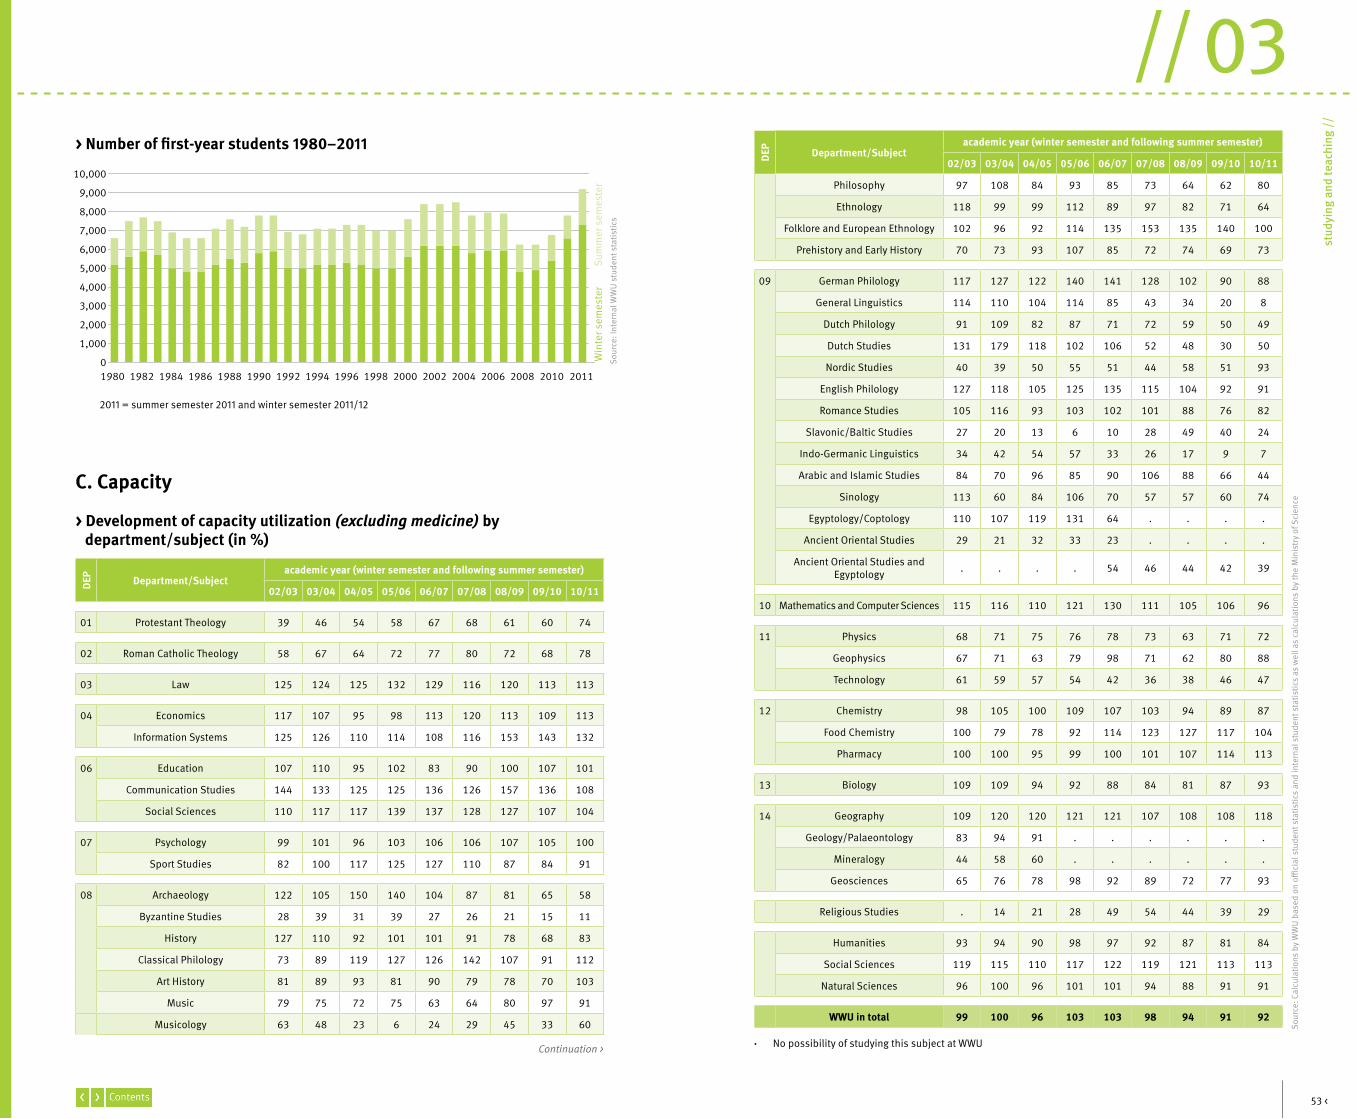
53 <
// 03
stud
ying
and
teac
hing
//
Lesezeichen
Sour
ce: C
alcu
latio
ns b
y W
WU
bas
ed o
n offi
cial
stu
dent
sta
tistic
s an
d in
tern
al s
tude
nt s
tatis
tics
as w
ell a
s ca
lcul
atio
ns b
y th
e M
inis
try
of S
cien
ce
Sour
ce: I
nter
nal W
WU
stu
dent
sta
tistic
s
· No possibility of studying this subject at WWU
> Development of capacity utilization (excluding medicine) by department/subject (in %)
C. Capacity
Continuation >
> Number of first-year students 1980–2011
1,000
19821980 1984 1986 1988 1990 1992 1994 1996 1998 2000 2002 2004 2006 2008
2,000
3,000
4,000
5,000
6,000
7,000
8,000
Win
ter s
emes
ter
Sum
mer
sem
este
r
0
2011 = summer semester 2011 and winter semester 2011/12
2010 2011
9,000
10,000
DEP
Department/Subjectacademic year (winter semester and following summer semester)
02/03 03/04 04/05 05/06 06/07 07/08 08/09 09/10 10/11
01 Protestant Theology 39 46 54 58 67 68 61 60 74
02 Roman Catholic Theology 58 67 64 72 77 80 72 68 78
03 Law 125 124 125 132 129 116 120 113 113
04 Economics 117 107 95 98 113 120 113 109 113
Information Systems 125 126 110 114 108 116 153 143 132
06 Education 107 110 95 102 83 90 100 107 101
Communication Studies 144 133 125 125 136 126 157 136 108
Social Sciences 110 117 117 139 137 128 127 107 104
07 Psychology 99 101 96 103 106 106 107 105 100
Sport Studies 82 100 117 125 127 110 87 84 91
08 Archaeology 122 105 150 140 104 87 81 65 58
Byzantine Studies 28 39 31 39 27 26 21 15 11
History 127 110 92 101 101 91 78 68 83
Classical Philology 73 89 119 127 126 142 107 91 112
Art History 81 89 93 81 90 79 78 70 103
Music 79 75 72 75 63 64 80 97 91
Musicology 63 48 23 6 24 29 45 33 60
DEP
Department/Subjectacademic year (winter semester and following summer semester)
02/03 03/04 04/05 05/06 06/07 07/08 08/09 09/10 10/11
Philosophy 97 108 84 93 85 73 64 62 80
Ethnology 118 99 99 112 89 97 82 71 64
Folklore and European Ethnology 102 96 92 114 135 153 135 140 100
Prehistory and Early History 70 73 93 107 85 72 74 69 73
09 German Philology 117 127 122 140 141 128 102 90 88
General Linguistics 114 110 104 114 85 43 34 20 8
Dutch Philology 91 109 82 87 71 72 59 50 49
Dutch Studies 131 179 118 102 106 52 48 30 50
Nordic Studies 40 39 50 55 51 44 58 51 93
English Philology 127 118 105 125 135 115 104 92 91
Romance Studies 105 116 93 103 102 101 88 76 82
Slavonic/Baltic Studies 27 20 13 6 10 28 49 40 24
Indo-Germanic Linguistics 34 42 54 57 33 26 17 9 7
Arabic and Islamic Studies 84 70 96 85 90 106 88 66 44
Sinology 113 60 84 106 70 57 57 60 74
Egyptology/Coptology 110 107 119 131 64 . . . .
Ancient Oriental Studies 29 21 32 33 23 . . . .
Ancient Oriental Studies andEgyptology . . . . 54 46 44 42 39
10 Mathematics and Computer Sciences 115 116 110 121 130 111 105 106 96
11 Physics 68 71 75 76 78 73 63 71 72
Geophysics 67 71 63 79 98 71 62 80 88
Technology 61 59 57 54 42 36 38 46 47
12 Chemistry 98 105 100 109 107 103 94 89 87
Food Chemistry 100 79 78 92 114 123 127 117 104
Pharmacy 100 100 95 99 100 101 107 114 113
13 Biology 109 109 94 92 88 84 81 87 93
14 Geography 109 120 120 121 121 107 108 108 118
Geology/Palaeontology 83 94 91 . . . . . .
Mineralogy 44 58 60 . . . . . .
Geosciences 65 76 78 98 92 89 72 77 93
Religious Studies . 14 21 28 49 54 44 39 29
Humanities 93 94 90 98 97 92 87 81 84
Social Sciences 119 115 110 117 122 119 121 113 113
Natural Sciences 96 100 96 101 101 94 88 91 91
WWU in total 99 100 96 103 103 98 94 91 92

55 <
// 03
stud
ying
and
teac
hing
//
Lesezeichen
passed (by type of degree) in the academic year 2010
Sour
ce: G
erm
an F
eder
al S
tatis
tics
Offi
ce, s
ubje
ct s
erie
s 11
(Sta
tistis
ches
Bun
desa
mt,
Fach
serie
11)
> The 20 German universities with the highest number of examinations
D. Examinations and Graduates
Higher Education InstitutionTotal Female
of which
Diploma (U) andequivalent degrees Teaching degrees Bachelor Master
Rang N N % Rank N Rank N Rank N Rank N
U Munich 1 8,041 5,003 62.2 1 4,138 6 1,036 8 1,239 10 350
U Münster 2 7,849 4,418 56.3 3 2,930 1 1,748 2 2,114 20 266
Baden Wuerttemberg Cooperative State University (FH) 3 6,739 2,967 44.0 171 0 99 0 1 6,739 271 0
TU Dresden 4 5,662 2,933 51.8 2 3,108 16 781 33 786 11 320
U Hamburg 5 5,451 3,356 61.6 6 2,635 10 875 10 1,179 12 311
U Cologne 6 5,431 3,304 60.8 5 2,731 4 1,385 63 629 102 92
U Leipzig 7 5,170 3,268 63.2 10 2,351 11 865 7 1,264 28 234
U Erlangen-Nuremberg 8 4,972 2,712 54.5 8 2,517 13 836 36 766 65 139
U Bochum 9 4,969 2,681 54.0 29 1,383 39 425 3 1,836 1 837
U Duisburg-Essen 10 4,917 2,732 55.6 20 1,844 5 1,112 14 1,101 9 400
FU Berlin 11 4,914 3,064 62.4 12 2,228 27 581 18 1,052 6 449
U Heidelberg 12 4,878 2,771 56.8 11 2,322 35 483 51 686 37 211
U Göttingen 13 4,834 2,609 54.0 17 1,952 47 275 5 1,529 8 403
TU Munich 14 4,815 1,650 34.3 15 2,028 59 178 11 1,165 2 679
HU Berlin 15 4,786 2,920 61.0 21 1,830 17 772 19 1,039 4 536
U Bonn 16 4,715 2,711 57.5 4 2,761 69 54 22 978 18 281
U Gießen 17 4,662 3,277 70.3 26 1,554 14 832 4 1,549 14 300
U Frankfurt a.M. 18 4,604 2,739 59.5 9 2,516 18 742 52 685 136 58
TH Aachen 19 4,409 1,785 40.5 13 2,155 54 231 17 1,057 17 283
U Mainz 20 4,295 2,623 61.1 7 2,541 21 689 118 372 56 157
Top 20 in total 106,113 59,523 56.1 45,524 13,900 27,765 6,306
Universities in total 226,897 124,938 55.1 98,038 33,426 53,320 16,029
HEIs in total 361,697 185,769 51.4 103,413 37,577 112,108 26,722
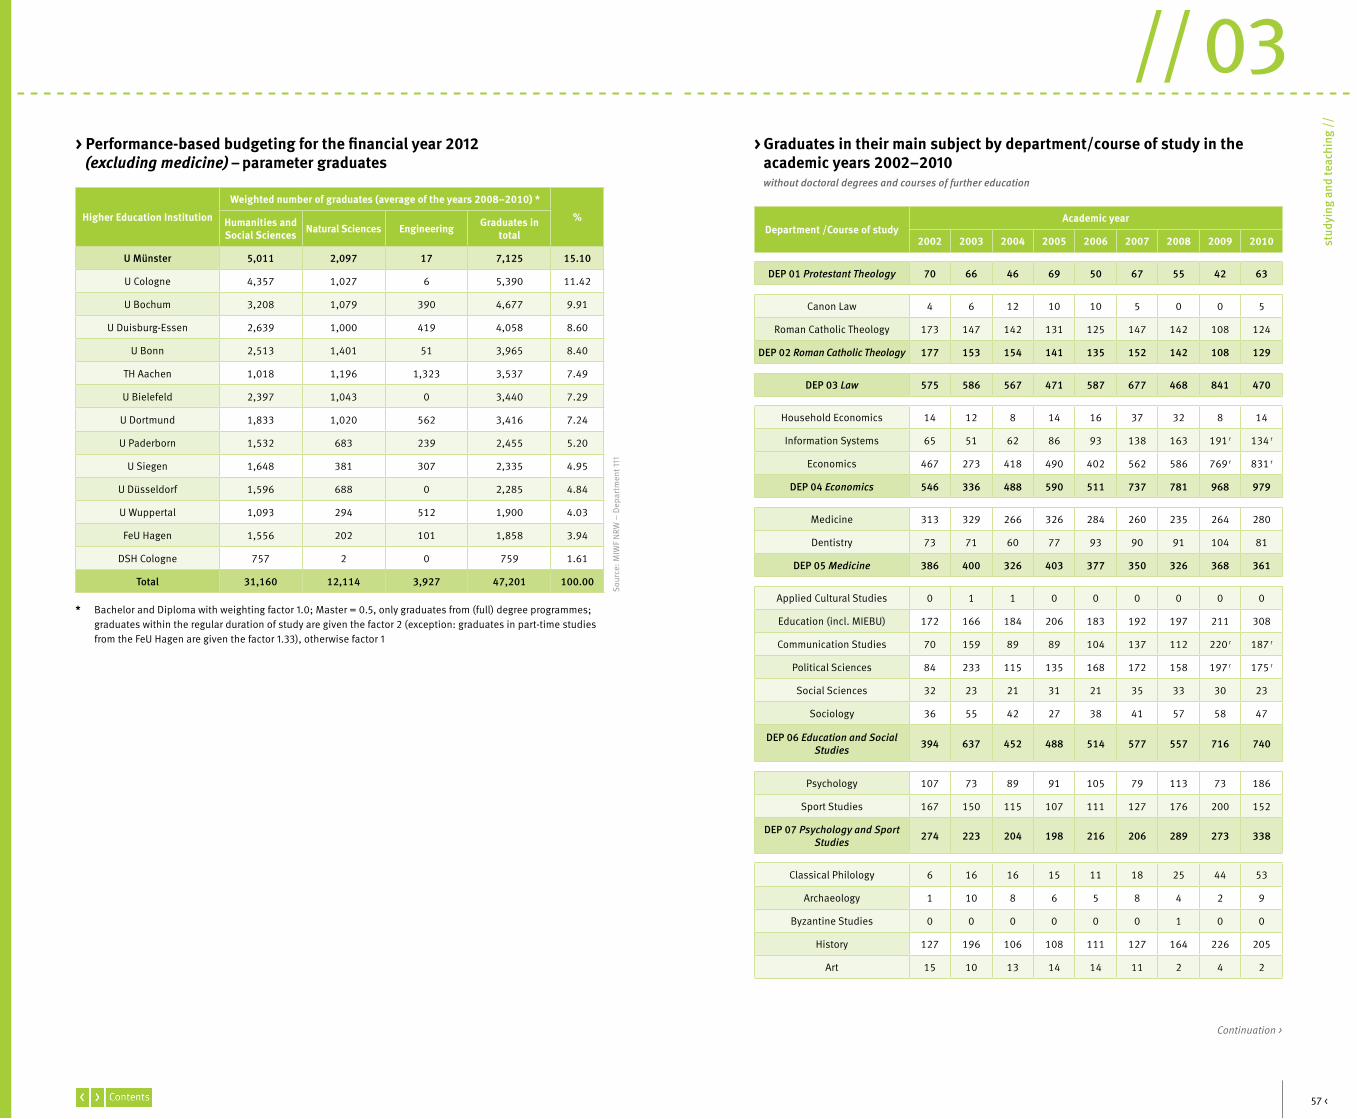
57 <
// 03
stud
ying
and
teac
hing
//
Lesezeichen
Department /Course of studyAcademic year
2002 2003 2004 2005 2006 2007 2008 2009 2010
DEP 01 Protestant Theology 70 66 46 69 50 67 55 42 63
Canon Law 4 6 12 10 10 5 0 0 5
Roman Catholic Theology 173 147 142 131 125 147 142 108 124
DEP 02 Roman Catholic Theology 177 153 154 141 135 152 142 108 129
DEP 03 Law 575 586 567 471 587 677 468 841 470
Household Economics 14 12 8 14 16 37 32 8 14
Information Systems 65 51 62 86 93 138 163 191 r 134 r
Economics 467 273 418 490 402 562 586 769 r 831 r
DEP 04 Economics 546 336 488 590 511 737 781 968 979
Medicine 313 329 266 326 284 260 235 264 280
Dentistry 73 71 60 77 93 90 91 104 81
DEP 05 Medicine 386 400 326 403 377 350 326 368 361
Applied Cultural Studies 0 1 1 0 0 0 0 0 0
Education (incl. MIEBU) 172 166 184 206 183 192 197 211 308
Communication Studies 70 159 89 89 104 137 112 220 r 187 r
Political Sciences 84 233 115 135 168 172 158 197 r 175 r
Social Sciences 32 23 21 31 21 35 33 30 23
Sociology 36 55 42 27 38 41 57 58 47
DEP 06 Education and SocialStudies 394 637 452 488 514 577 557 716 740
Psychology 107 73 89 91 105 79 113 73 186
Sport Studies 167 150 115 107 111 127 176 200 152
DEP 07 Psychology and SportStudies 274 223 204 198 216 206 289 273 338
Classical Philology 6 16 16 15 11 18 25 44 53
Archaeology 1 10 8 6 5 8 4 2 9
Byzantine Studies 0 0 0 0 0 0 1 0 0
History 127 196 106 108 111 127 164 226 205
Art 15 10 13 14 14 11 2 4 2
> Graduates in their main subject by department/course of study in the academic years 2002–2010
without doctoral degrees and courses of further education
Continuation >
* Bachelor and Diploma with weighting factor 1.0; Master = 0.5, only graduates from (full) degree programmes; graduates within the regular duration of study are given the factor 2 (exception: graduates in part-time studies from the FeU Hagen are given the factor 1.33), otherwise factor 1
Sour
ce: M
IWF
NRW
– D
epar
tmen
t 111
> Performance-based budgeting for the financial year 2012 (excluding medicine) – parameter graduates
Higher Education Institution
Weighted number of graduates (average of the years 2008–2010) *
%Humanities andSocial Sciences Natural Sciences Engineering Graduates in
total
U Münster 5,011 2,097 17 7,125 15.10
U Cologne 4,357 1,027 6 5,390 11.42
U Bochum 3,208 1,079 390 4,677 9.91
U Duisburg-Essen 2,639 1,000 419 4,058 8.60
U Bonn 2,513 1,401 51 3,965 8.40
TH Aachen 1,018 1,196 1,323 3,537 7.49
U Bielefeld 2,397 1,043 0 3,440 7.29
U Dortmund 1,833 1,020 562 3,416 7.24
U Paderborn 1,532 683 239 2,455 5.20
U Siegen 1,648 381 307 2,335 4.95
U Düsseldorf 1,596 688 0 2,285 4.84
U Wuppertal 1,093 294 512 1,900 4.03
FeU Hagen 1,556 202 101 1,858 3.94
DSH Cologne 757 2 0 759 1.61
Total 31,160 12,114 3,927 47,201 100.00
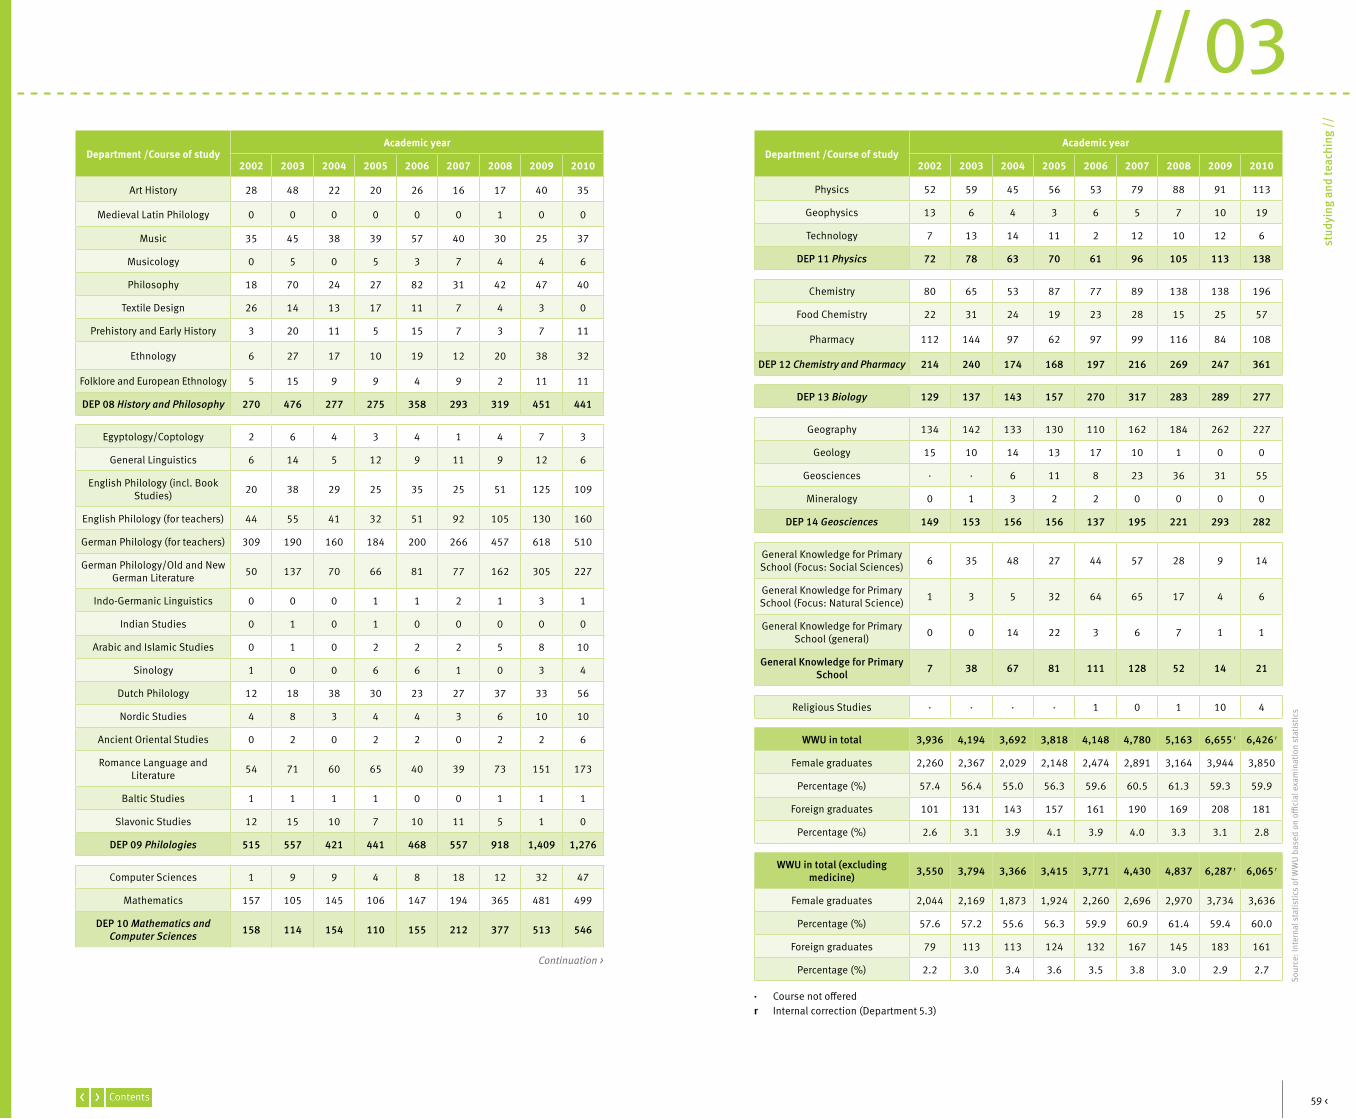
59 <
// 03
stud
ying
and
teac
hing
//
Lesezeichen
Department /Course of studyAcademic year
2002 2003 2004 2005 2006 2007 2008 2009 2010
Physics 52 59 45 56 53 79 88 91 113
Geophysics 13 6 4 3 6 5 7 10 19
Technology 7 13 14 11 2 12 10 12 6
DEP 11 Physics 72 78 63 70 61 96 105 113 138
Chemistry 80 65 53 87 77 89 138 138 196
Food Chemistry 22 31 24 19 23 28 15 25 57
Pharmacy 112 144 97 62 97 99 116 84 108
DEP 12 Chemistry and Pharmacy 214 240 174 168 197 216 269 247 361
DEP 13 Biology 129 137 143 157 270 317 283 289 277
Geography 134 142 133 130 110 162 184 262 227
Geology 15 10 14 13 17 10 1 0 0
Geosciences · · 6 11 8 23 36 31 55
Mineralogy 0 1 3 2 2 0 0 0 0
DEP 14 Geosciences 149 153 156 156 137 195 221 293 282
General Knowledge for PrimarySchool (Focus: Social Sciences) 6 35 48 27 44 57 28 9 14
General Knowledge for PrimarySchool (Focus: Natural Science) 1 3 5 32 64 65 17 4 6
General Knowledge for PrimarySchool (general) 0 0 14 22 3 6 7 1 1
General Knowledge for PrimarySchool 7 38 67 81 111 128 52 14 21
Religious Studies · · · · 1 0 1 10 4
WWU in total 3,936 4,194 3,692 3,818 4,148 4,780 5,163 6,655 r 6,426 r
Female graduates 2,260 2,367 2,029 2,148 2,474 2,891 3,164 3,944 3,850
Percentage (%) 57.4 56.4 55.0 56.3 59.6 60.5 61.3 59.3 59.9
Foreign graduates 101 131 143 157 161 190 169 208 181
Percentage (%) 2.6 3.1 3.9 4.1 3.9 4.0 3.3 3.1 2.8
WWU in total (excludingmedicine) 3,550 3,794 3,366 3,415 3,771 4,430 4,837 6,287 r 6,065 r
Female graduates 2,044 2,169 1,873 1,924 2,260 2,696 2,970 3,734 3,636
Percentage (%) 57.6 57.2 55.6 56.3 59.9 60.9 61.4 59.4 60.0
Foreign graduates 79 113 113 124 132 167 145 183 161
Percentage (%) 2.2 3.0 3.4 3.6 3.5 3.8 3.0 2.9 2.7
· Course not offeredr Internal correction (Department 5.3)
Department /Course of studyAcademic year
2002 2003 2004 2005 2006 2007 2008 2009 2010
Art History 28 48 22 20 26 16 17 40 35
Medieval Latin Philology 0 0 0 0 0 0 1 0 0
Music 35 45 38 39 57 40 30 25 37
Musicology 0 5 0 5 3 7 4 4 6
Philosophy 18 70 24 27 82 31 42 47 40
Textile Design 26 14 13 17 11 7 4 3 0
Prehistory and Early History 3 20 11 5 15 7 3 7 11
Ethnology 6 27 17 10 19 12 20 38 32
Folklore and European Ethnology 5 15 9 9 4 9 2 11 11
DEP 08 History and Philosophy 270 476 277 275 358 293 319 451 441
Egyptology/Coptology 2 6 4 3 4 1 4 7 3
General Linguistics 6 14 5 12 9 11 9 12 6
English Philology (incl. BookStudies) 20 38 29 25 35 25 51 125 109
English Philology (for teachers) 44 55 41 32 51 92 105 130 160
German Philology (for teachers) 309 190 160 184 200 266 457 618 510
German Philology/Old and NewGerman Literature 50 137 70 66 81 77 162 305 227
Indo-Germanic Linguistics 0 0 0 1 1 2 1 3 1
Indian Studies 0 1 0 1 0 0 0 0 0
Arabic and Islamic Studies 0 1 0 2 2 2 5 8 10
Sinology 1 0 0 6 6 1 0 3 4
Dutch Philology 12 18 38 30 23 27 37 33 56
Nordic Studies 4 8 3 4 4 3 6 10 10
Ancient Oriental Studies 0 2 0 2 2 0 2 2 6
Romance Language andLiterature 54 71 60 65 40 39 73 151 173
Baltic Studies 1 1 1 1 0 0 1 1 1
Slavonic Studies 12 15 10 7 10 11 5 1 0
DEP 09 Philologies 515 557 421 441 468 557 918 1,409 1,276
Computer Sciences 1 9 9 4 8 18 12 32 47
Mathematics 157 105 145 106 147 194 365 481 499
DEP 10 Mathematics andComputer Sciences 158 114 154 110 155 212 377 513 546
Continuation >
Sour
ce: I
nter
nal s
tatis
tics
of W
WU
bas
ed o
n offi
cial
exa
min
atio
n st
atis
tics
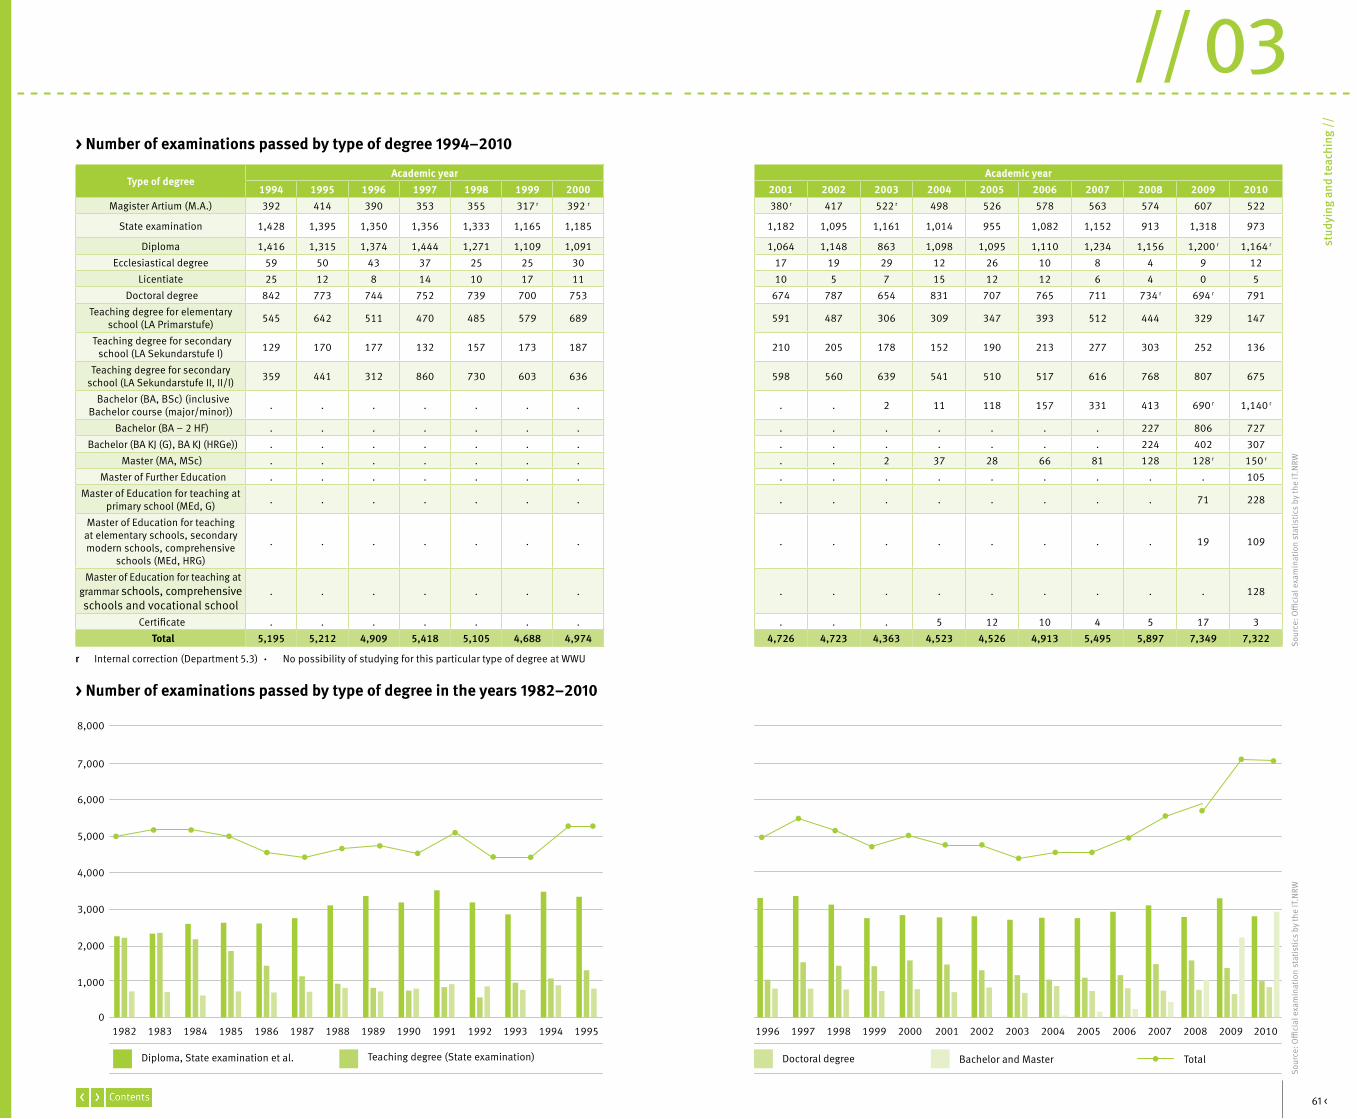
61 <
// 03
stud
ying
and
teac
hing
//
Lesezeichen
Sour
ce: O
ffici
al e
xam
inat
ion
stat
istic
s by
the
IT.N
RWSo
urce
: Offi
cial
exa
min
atio
n st
atis
tics
by th
e IT
.NRW
> Number of examinations passed by type of degree 1994–2010
r Internal correction (Department 5.3) · No possibility of studying for this particular type of degree at WWU
1,000
2,000
3,000
4,000
5,000
6,000
0
7,000
8,000
20091996 1997 1998 1999 2000 2001 2002 2003 2004 2005 2006 2007 20081982 1983 1984 1985 1986 1987 1988 1989 1990 1991 1992 1993 1994 1995 2010
> Number of examinations passed by type of degree in the years 1982–2010
Diploma, State examination et al. Teaching degree (State examination) Bachelor and MasterDoctoral degree Total
Type of degreeAcademic year Academic year
1994 1995 1996 1997 1998 1999 2000 2001 2002 2003 2004 2005 2006 2007 2008 2009 2010Magister Artium (M.A.) 392 414 390 353 355 317 r 392 r 380 r 417 522 r 498 526 578 563 574 607 522
State examination 1,428 1,395 1,350 1,356 1,333 1,165 1,185 1,182 1,095 1,161 1,014 955 1,082 1,152 913 1,318 973
Diploma 1,416 1,315 1,374 1,444 1,271 1,109 1,091 1,064 1,148 863 1,098 1,095 1,110 1,234 1,156 1,200 r 1,164 r
Ecclesiastical degree 59 50 43 37 25 25 30 17 19 29 12 26 10 8 4 9 12Licentiate 25 12 8 14 10 17 11 10 5 7 15 12 12 6 4 0 5
Doctoral degree 842 773 744 752 739 700 753 674 787 654 831 707 765 711 734 r 694 r 791Teaching degree for elementary
school (LA Primarstufe) 545 642 511 470 485 579 689 591 487 306 309 347 393 512 444 329 147
Teaching degree for secondaryschool (LA Sekundarstufe I) 129 170 177 132 157 173 187 210 205 178 152 190 213 277 303 252 136
Teaching degree for secondaryschool (LA Sekundarstufe II, II/I) 359 441 312 860 730 603 636 598 560 639 541 510 517 616 768 807 675
Bachelor (BA, BSc) (inclusive Bachelor course (major/minor)) . . . . . . . . . 2 11 118 157 331 413 690 r 1,140 r
Bachelor (BA – 2 HF) . . . . . . . . . . . . . . 227 806 727 Bachelor (BA KJ (G), BA KJ (HRGe)) . . . . . . . . . . . . . . 224 402 307
Master (MA, MSc) . . . . . . . . . 2 37 28 66 81 128 128 r 150 r
Master of Further Education . . . . . . . . . . . . . . . . 105Master of Education for teaching at
primary school (MEd, G) . . . . . . . . . . . . . . . 71 228
Master of Education for teaching at elementary schools, secondary modern schools, comprehensive
schools (MEd, HRG)
. . . . . . . . . . . . . . . 19 109
Master of Education for teaching at grammar schools, comprehensive schools and vocational school
. . . . . . . . . . . . . . . . 128
Certificate . . . . . . . . . . 5 12 10 4 5 17 3 Total 5,195 5,212 4,909 5,418 5,105 4,688 4,974 4,726 4,723 4,363 4,523 4,526 4,913 5,495 5,897 7,349 7,322
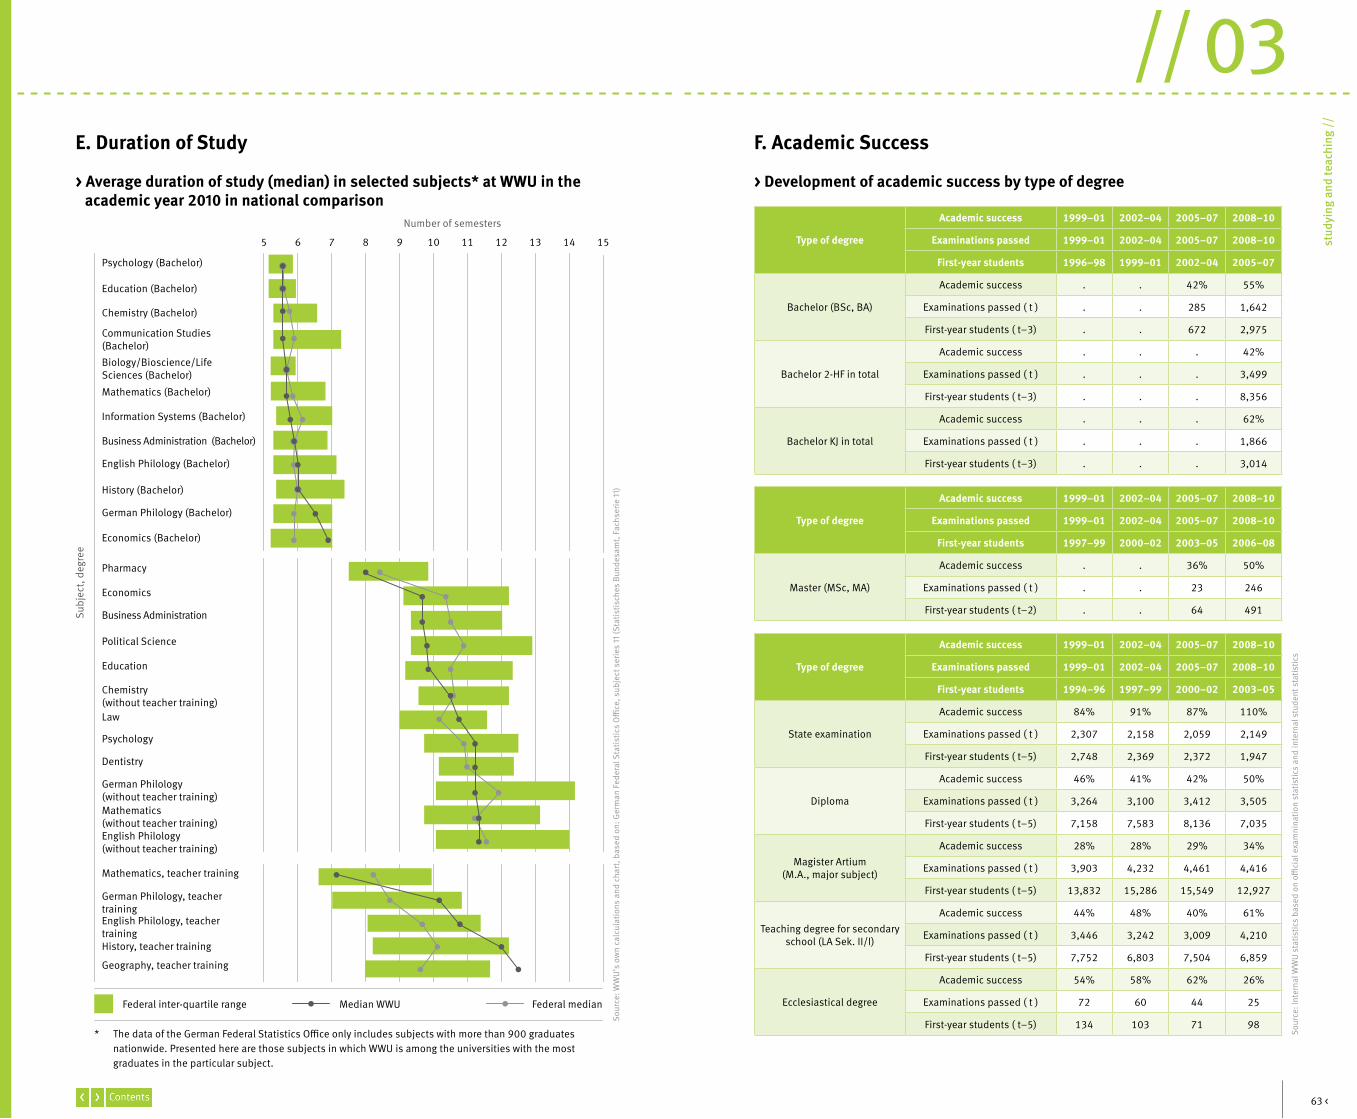
7 9 11 1365 8 10 12 14 15
Median WWU
Sour
ce: W
WU
’s o
wn
calc
ulat
ions
and
cha
rt, b
ased
on:
Ger
man
Fed
eral
Sta
tistic
s O
ffice
, sub
ject
ser
ies
11 (S
tatis
tisch
es B
unde
sam
t, Fa
chse
rie 1
1)
Subj
ect,
degr
ee
Number of semesters
Federal inter-quartile range Federal median
Psychology (Bachelor)
Education (Bachelor)
Communication Studies(Bachelor)
Business Administration (Bachelor)
Economics (Bachelor)
Law
Mathematics (Bachelor)
History (Bachelor)
Economics
Education
Dentistry
Chemistry (Bachelor)
Biology/Bioscience/LifeSciences (Bachelor)
English Philology (Bachelor)
Pharmacy
Political Science
Psychology
Information Systems (Bachelor)
German Philology (Bachelor)
Business Administration
Chemistry (without teacher training)
German Philology (without teacher training)Mathematics (without teacher training)English Philology(without teacher training)
Mathematics, teacher training
German Philology, teachertrainingEnglish Philology, teachertrainingHistory, teacher training
Geography, teacher training
63 <
// 03
stud
ying
and
teac
hing
//
Lesezeichen
> Development of academic success by type of degree
Sour
ce: I
nter
nal W
WU
sta
tistic
s ba
sed
on o
ffici
al e
xam
nina
tion
stat
istic
s an
d in
tern
al s
tude
nt s
tatis
tics
F. Academic SuccessE. Duration of Study
> Average duration of study (median) in selected subjects* at WWU in the academic year 2010 in national comparison
* The data of the German Federal Statistics Office only includes subjects with more than 900 graduates nationwide. Presented here are those subjects in which WWU is among the universities with the most graduates in the particular subject.
Type of degree
Academic success 1999–01 2002–04 2005–07 2008–10
Examinations passed 1999–01 2002–04 2005–07 2008–10
First-year students 1996–98 1999–01 2002–04 2005–07
Bachelor (BSc, BA)
Academic success . . 42% 55%
Examinations passed ( t ) . . 285 1,642
First-year students ( t–3) . . 672 2,975
Bachelor 2-HF in total
Academic success . . . 42%
Examinations passed ( t ) . . . 3,499
First-year students ( t–3) . . . 8,356
Bachelor KJ in total
Academic success . . . 62%
Examinations passed ( t ) . . . 1,866
First-year students ( t–3) . . . 3,014
Type of degree
Academic success 1999–01 2002–04 2005–07 2008–10
Examinations passed 1999–01 2002–04 2005–07 2008–10
First-year students 1997–99 2000–02 2003–05 2006–08
Master (MSc, MA)
Academic success . . 36% 50%
Examinations passed ( t ) . . 23 246
First-year students ( t–2) . . 64 491
Type of degree
Academic success 1999–01 2002–04 2005–07 2008–10
Examinations passed 1999–01 2002–04 2005–07 2008–10
First-year students 1994–96 1997–99 2000–02 2003–05
State examination
Academic success 84% 91% 87% 110%
Examinations passed ( t ) 2,307 2,158 2,059 2,149
First-year students ( t–5) 2,748 2,369 2,372 1,947
Diploma
Academic success 46% 41% 42% 50%
Examinations passed ( t ) 3,264 3,100 3,412 3,505
First-year students ( t–5) 7,158 7,583 8,136 7,035
Magister Artium (M.A., major subject)
Academic success 28% 28% 29% 34%
Examinations passed ( t ) 3,903 4,232 4,461 4,416
First-year students ( t–5) 13,832 15,286 15,549 12,927
Teaching degree for secondaryschool (LA Sek. II/I)
Academic success 44% 48% 40% 61%
Examinations passed ( t ) 3,446 3,242 3,009 4,210
First-year students ( t–5) 7,752 6,803 7,504 6,859
Ecclesiastical degree
Academic success 54% 58% 62% 26%
Examinations passed ( t ) 72 60 44 25
First-year students ( t–5) 134 103 71 98
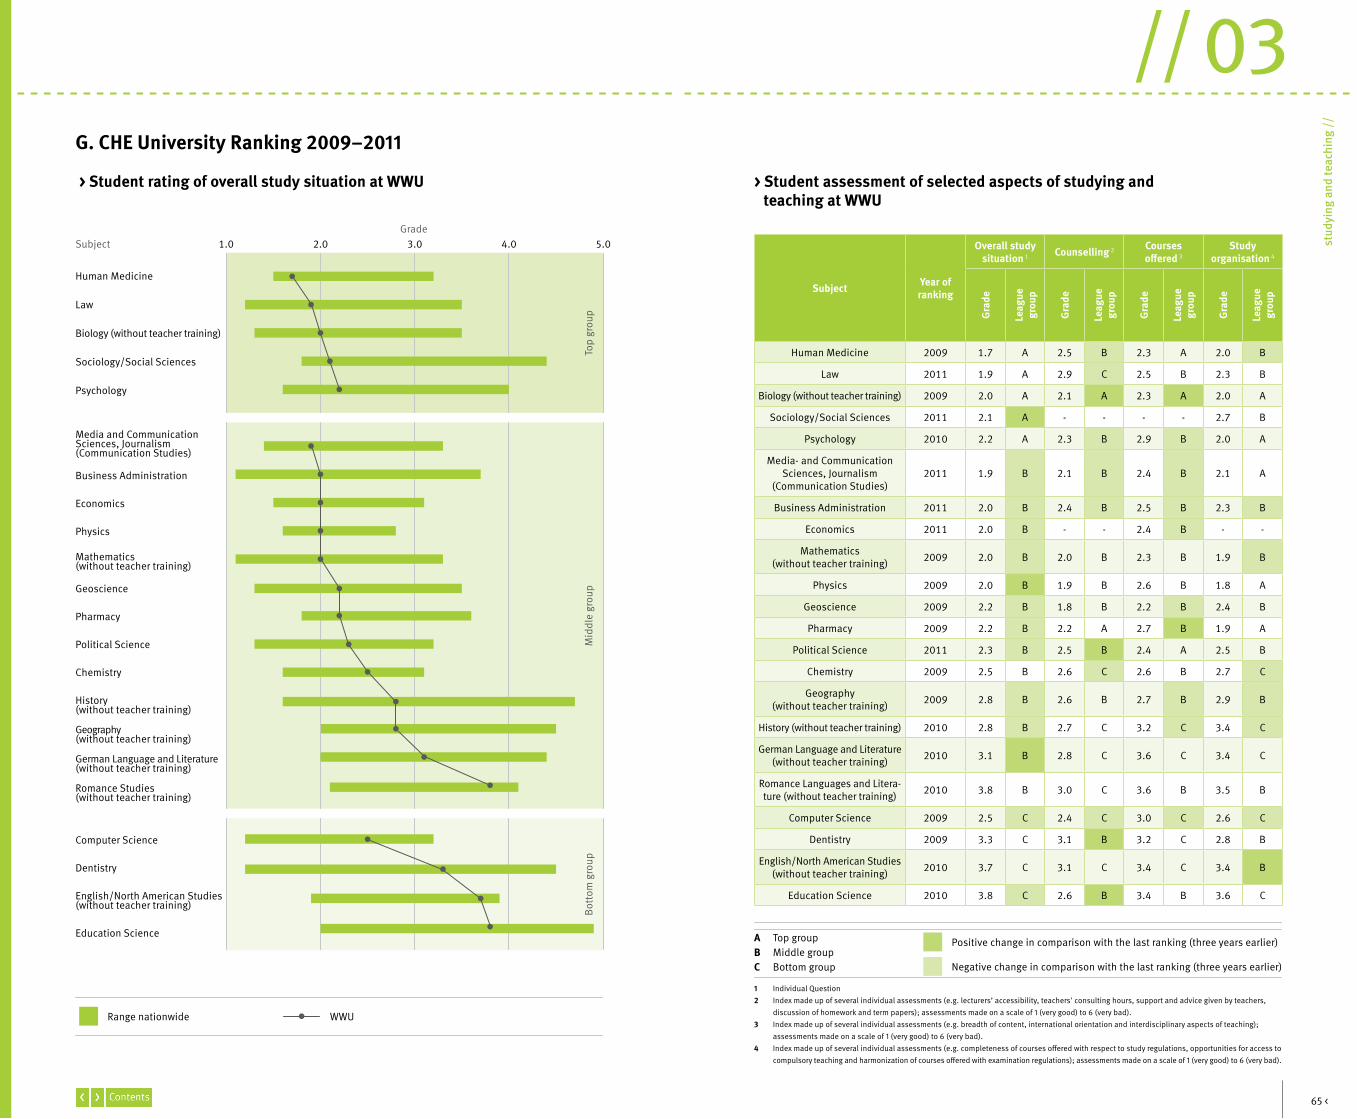
65 <
// 03
stud
ying
and
teac
hing
//
Lesezeichen
G. CHE University Ranking 2009–2011
> Student rating of overall study situation at WWU > Student assessment of selected aspects of studying and teaching at WWU
1.0SubjectGrade
3.02.0 4.0 5.0
Bott
om g
roup
Mid
dle
grou
pTo
p gr
oup
Range nationwide WWU
Subject Year ofranking
Overall studysituation 1 Counselling 2 Courses
offered 3Study
organisation 4
Gra
de
Leag
uegr
oup
Gra
de
Leag
uegr
oup
Gra
de
Leag
uegr
oup
Gra
de
Leag
uegr
oup
Human Medicine 2009 1.7 A 2.5 B 2.3 A 2.0 B
Law 2011 1.9 A 2.9 C 2.5 B 2.3 B
Biology (without teacher training) 2009 2.0 A 2.1 A 2.3 A 2.0 A
Sociology/Social Sciences 2011 2.1 A - - - - 2.7 B
Psychology 2010 2.2 A 2.3 B 2.9 B 2.0 A
Media- and CommunicationSciences, Journalism
(Communication Studies)2011 1.9 B 2.1 B 2.4 B 2.1 A
Business Administration 2011 2.0 B 2.4 B 2.5 B 2.3 B
Economics 2011 2.0 B - - 2.4 B - -
Mathematics(without teacher training) 2009 2.0 B 2.0 B 2.3 B 1.9 B
Physics 2009 2.0 B 1.9 B 2.6 B 1.8 A
Geoscience 2009 2.2 B 1.8 B 2.2 B 2.4 B
Pharmacy 2009 2.2 B 2.2 A 2.7 B 1.9 A
Political Science 2011 2.3 B 2.5 B 2.4 A 2.5 B
Chemistry 2009 2.5 B 2.6 C 2.6 B 2.7 C
Geography (without teacher training) 2009 2.8 B 2.6 B 2.7 B 2.9 B
History (without teacher training) 2010 2.8 B 2.7 C 3.2 C 3.4 C
German Language and Literature(without teacher training) 2010 3.1 B 2.8 C 3.6 C 3.4 C
Romance Languages and Litera-ture (without teacher training) 2010 3.8 B 3.0 C 3.6 B 3.5 B
Computer Science 2009 2.5 C 2.4 C 3.0 C 2.6 C
Dentistry 2009 3.3 C 3.1 B 3.2 C 2.8 B
English/North American Studies(without teacher training) 2010 3.7 C 3.1 C 3.4 C 3.4 B
Education Science 2010 3.8 C 2.6 B 3.4 B 3.6 C
Positive change in comparison with the last ranking (three years earlier)
Negative change in comparison with the last ranking (three years earlier)
A Top groupB Middle groupC Bottom group
1 Individual Question2 Index made up of several individual assessments (e.g. lecturers’ accessibility, teachers' consulting hours, support and advice given by teachers,
discussion of homework and term papers); assessments made on a scale of 1 (very good) to 6 (very bad).3 Index made up of several individual assessments (e.g. breadth of content, international orientation and interdisciplinary aspects of teaching);
assessments made on a scale of 1 (very good) to 6 (very bad).4 Index made up of several individual assessments (e.g. completeness of courses offered with respect to study regulations, opportunities for access to
compulsory teaching and harmonization of courses offered with examination regulations); assessments made on a scale of 1 (very good) to 6 (very bad).
Human Medicine
Law
Biology (without teacher training)
Sociology/Social Sciences
Psychology
Media and Communication Sciences, Journalism (Communication Studies)
Business Administration
Economics
Physics
Mathematics(without teacher training)
Geoscience
Pharmacy
Political Science
Chemistry
History (without teacher training)
Geography (without teacher training)
German Language and Literature(without teacher training)
Romance Studies(without teacher training)
Computer Science
Dentistry
English/North American Studies(without teacher training)
Education Science
// 04bu
dget
and
per
sonn
el /
/
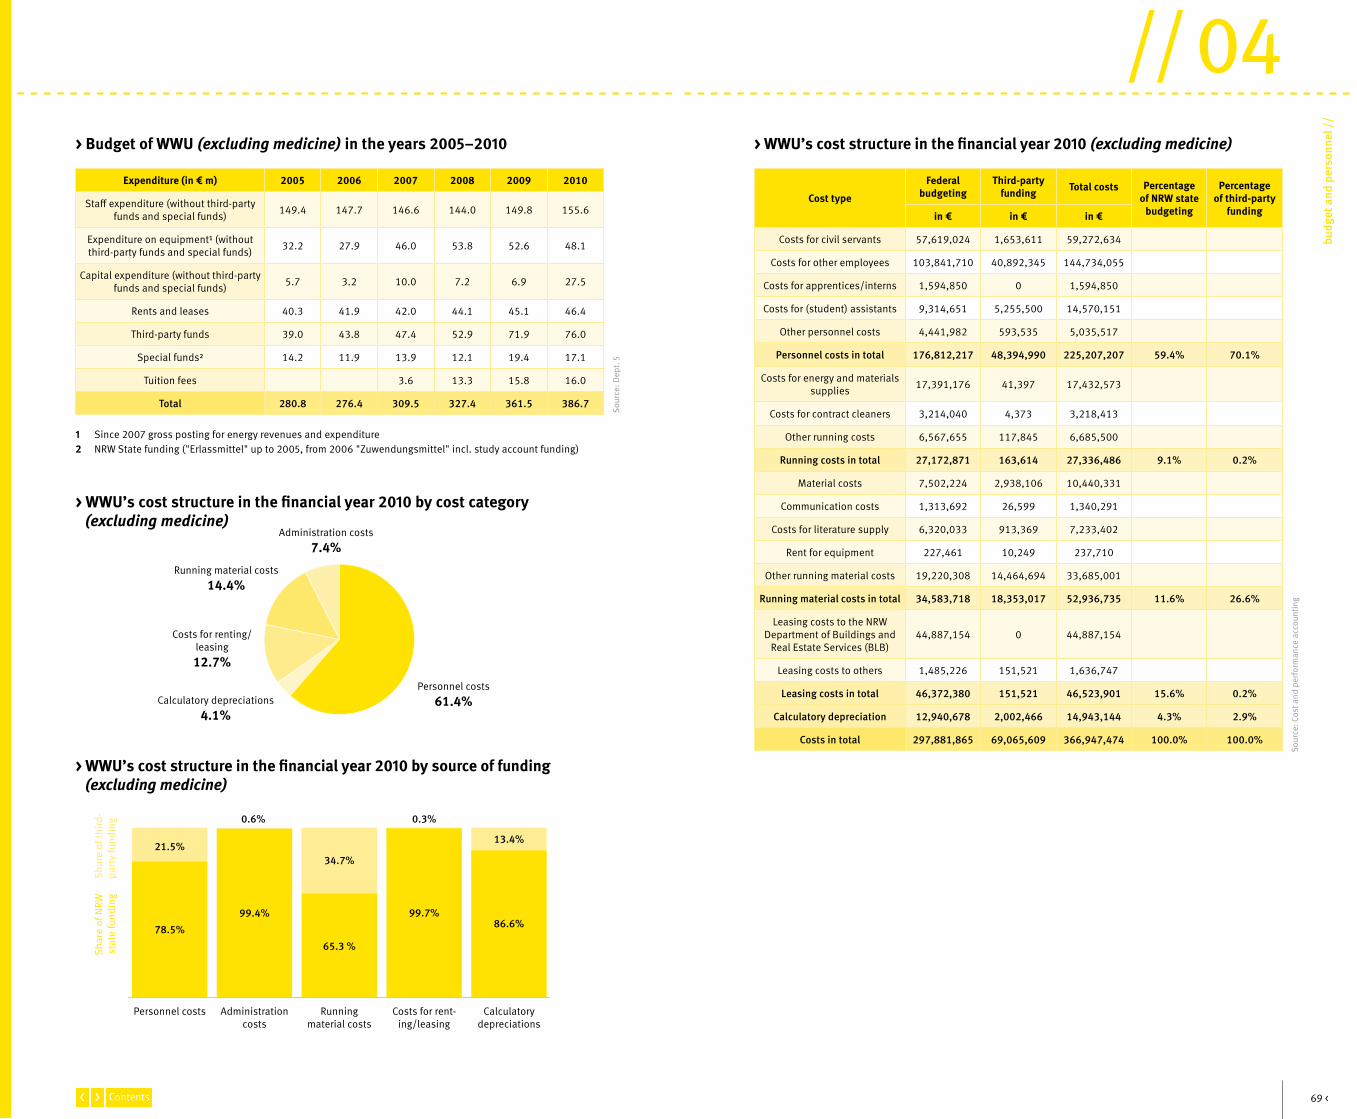
Personnel costs61.4%
Costs for renting/leasing12.7%
Running material costs14.4%
Administration costs7.4%
Calculatory depreciations4.1%
Shar
e of
third
-pa
rty
fund
ing
Personnel costs Administrationcosts
Runningmaterial costs
Costs for rent-ing/leasing
Calculatorydepreciations
Shar
e of
NRW
stat
e fu
ndin
g
21.5%
0.6%
78.5%99.4%
65.3 %
99.7%86.6%
34.7%
0.3%
13.4%
69 <
budg
et a
nd p
erso
nnel
//
// 04Lesezeichen
> WWU’s cost structure in the financial year 2010 (excluding medicine)
Expenditure (in € m) 2005 2006 2007 2008 2009 2010
Staff expenditure (without third-partyfunds and special funds) 149.4 147.7 146.6 144.0 149.8 155.6
Expenditure on equipment1 (without third-party funds and special funds) 32.2 27.9 46.0 53.8 52.6 48.1
Capital expenditure (without third-partyfunds and special funds) 5.7 3.2 10.0 7.2 6.9 27.5
Rents and leases 40.3 41.9 42.0 44.1 45.1 46.4
Third-party funds 39.0 43.8 47.4 52.9 71.9 76.0
Special funds2 14.2 11.9 13.9 12.1 19.4 17.1
Tuition fees 3.6 13.3 15.8 16.0
Total 280.8 276.4 309.5 327.4 361.5 386.7
> Budget of WWU (excluding medicine) in the years 2005–2010
> WWU’s cost structure in the financial year 2010 by cost category (excluding medicine)
1 Since 2007 gross posting for energy revenues and expenditure2 NRW State funding ("Erlassmittel" up to 2005, from 2006 "Zuwendungsmittel" incl. study account funding)
Sour
ce: D
ept.
5
Sour
ce: C
ost a
nd p
erfo
rman
ce a
ccou
ntin
g
> WWU’s cost structure in the financial year 2010 by source of funding (excluding medicine)
Cost type
Federal budgeting
Third-partyfunding Total costs Percentage
of NRW statebudgeting
Percentageof third-party
fundingin € in € in €
Costs for civil servants 57,619,024 1,653,611 59,272,634
Costs for other employees 103,841,710 40,892,345 144,734,055
Costs for apprentices/interns 1,594,850 0 1,594,850
Costs for (student) assistants 9,314,651 5,255,500 14,570,151
Other personnel costs 4,441,982 593,535 5,035,517
Personnel costs in total 176,812,217 48,394,990 225,207,207 59.4% 70.1%
Costs for energy and materialssupplies 17,391,176 41,397 17,432,573
Costs for contract cleaners 3,214,040 4,373 3,218,413
Other running costs 6,567,655 117,845 6,685,500
Running costs in total 27,172,871 163,614 27,336,486 9.1% 0.2%
Material costs 7,502,224 2,938,106 10,440,331
Communication costs 1,313,692 26,599 1,340,291
Costs for literature supply 6,320,033 913,369 7,233,402
Rent for equipment 227,461 10,249 237,710
Other running material costs 19,220,308 14,464,694 33,685,001
Running material costs in total 34,583,718 18,353,017 52,936,735 11.6% 26.6%
Leasing costs to the NRWDepartment of Buildings and
Real Estate Services (BLB)44,887,154 0 44,887,154
Leasing costs to others 1,485,226 151,521 1,636,747
Leasing costs in total 46,372,380 151,521 46,523,901 15.6% 0.2%
Calculatory depreciation 12,940,678 2,002,466 14,943,144 4.3% 2.9%
Costs in total 297,881,865 69,065,609 366,947,474 100.0% 100.0%
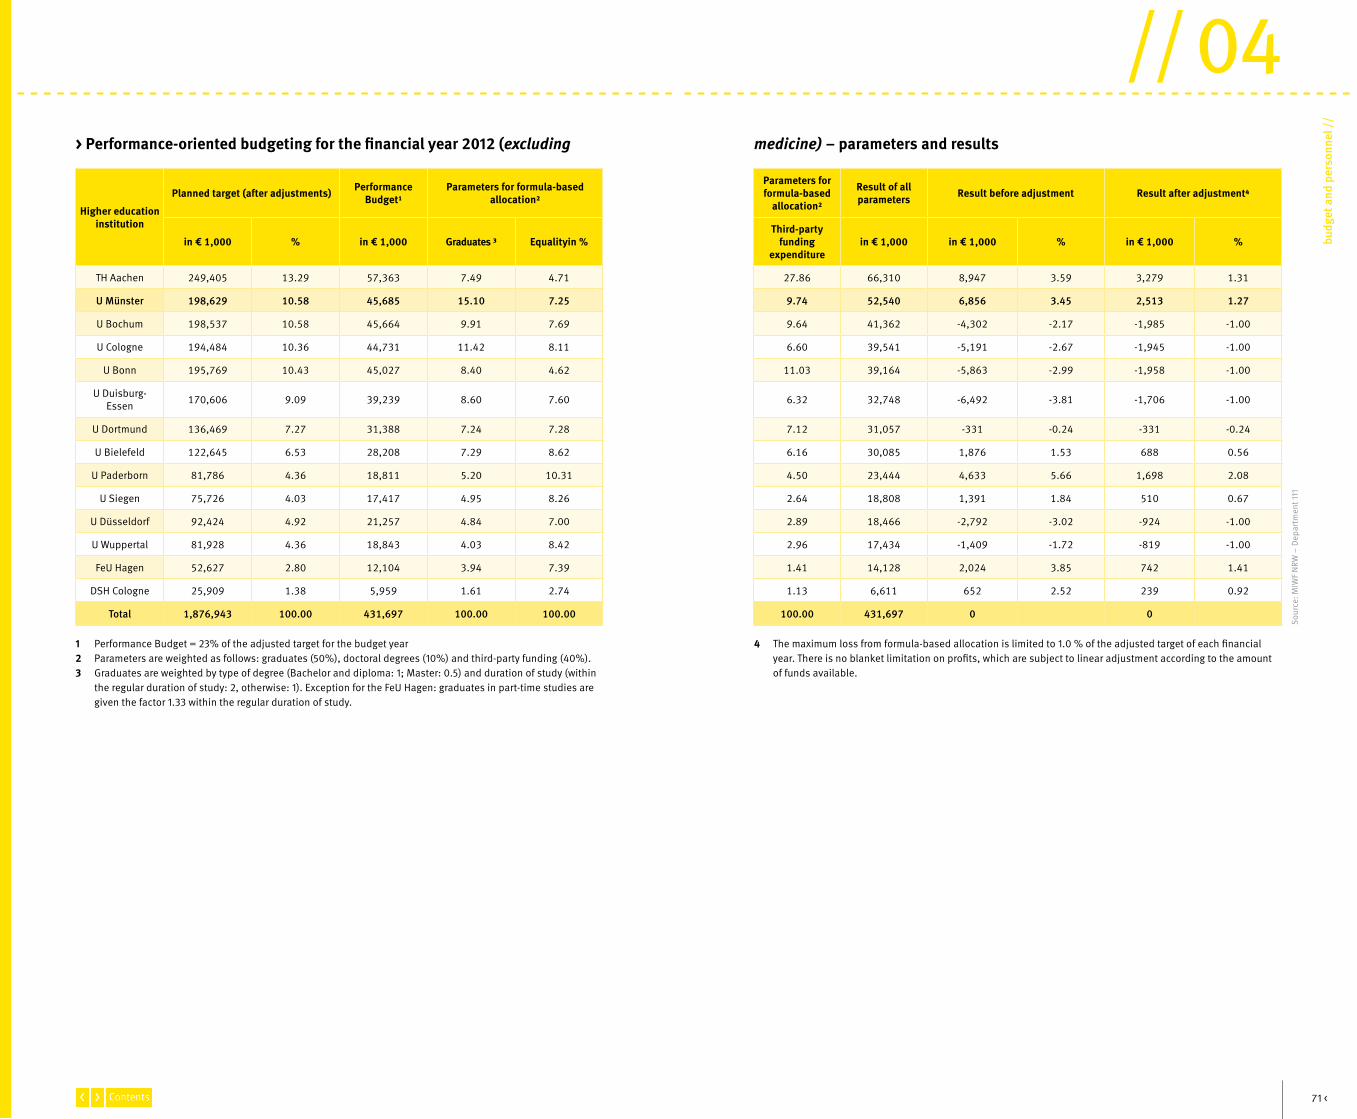
71 <
budg
et a
nd p
erso
nnel
//
// 04Lesezeichen
Sour
ce: M
IWF
NRW
– D
epar
tmen
t 111
1 Performance Budget = 23% of the adjusted target for the budget year2 Parameters are weighted as follows: graduates (50%), doctoral degrees (10%) and third-party funding (40%).3 Graduates are weighted by type of degree (Bachelor and diploma: 1; Master: 0.5) and duration of study (within
the regular duration of study: 2, otherwise: 1). Exception for the FeU Hagen: graduates in part-time studies are given the factor 1.33 within the regular duration of study.
4 The maximum loss from formula-based allocation is limited to 1.0 % of the adjusted target of each financial year. There is no blanket limitation on profits, which are subject to linear adjustment according to the amount of funds available.
> Performance-oriented budgeting for the financial year 2012 (excluding medicine) – parameters and results
Higher educationinstitution
Planned target (after adjustments) PerformanceBudget1
Parameters for formula-basedallocation2
Parameters forformula-based
allocation2
Result of all parameters Result before adjustment Result after adjustment4
in € 1,000 % in € 1,000 Graduates 3 Equalityin %Third-party
fundingexpenditure
in € 1,000 in € 1,000 % in € 1,000 %
TH Aachen 249,405 13.29 57,363 7.49 4.71 27.86 66,310 8,947 3.59 3,279 1.31
U Münster 198,629 10.58 45,685 15.10 7.25 9.74 52,540 6,856 3.45 2,513 1.27
U Bochum 198,537 10.58 45,664 9.91 7.69 9.64 41,362 -4,302 -2.17 -1,985 -1.00
U Cologne 194,484 10.36 44,731 11.42 8.11 6.60 39,541 -5,191 -2.67 -1,945 -1.00
U Bonn 195,769 10.43 45,027 8.40 4.62 11.03 39,164 -5,863 -2.99 -1,958 -1.00
U Duisburg-Essen 170,606 9.09 39,239 8.60 7.60 6.32 32,748 -6,492 -3.81 -1,706 -1.00
U Dortmund 136,469 7.27 31,388 7.24 7.28 7.12 31,057 -331 -0.24 -331 -0.24
U Bielefeld 122,645 6.53 28,208 7.29 8.62 6.16 30,085 1,876 1.53 688 0.56
U Paderborn 81,786 4.36 18,811 5.20 10.31 4.50 23,444 4,633 5.66 1,698 2.08
U Siegen 75,726 4.03 17,417 4.95 8.26 2.64 18,808 1,391 1.84 510 0.67
U Düsseldorf 92,424 4.92 21,257 4.84 7.00 2.89 18,466 -2,792 -3.02 -924 -1.00
U Wuppertal 81,928 4.36 18,843 4.03 8.42 2.96 17,434 -1,409 -1.72 -819 -1.00
FeU Hagen 52,627 2.80 12,104 3.94 7.39 1.41 14,128 2,024 3.85 742 1.41
DSH Cologne 25,909 1.38 5,959 1.61 2.74 1.13 6,611 652 2.52 239 0.92
Total 1,876,943 100.00 431,697 100.00 100.00 100.00 431,697 0 0
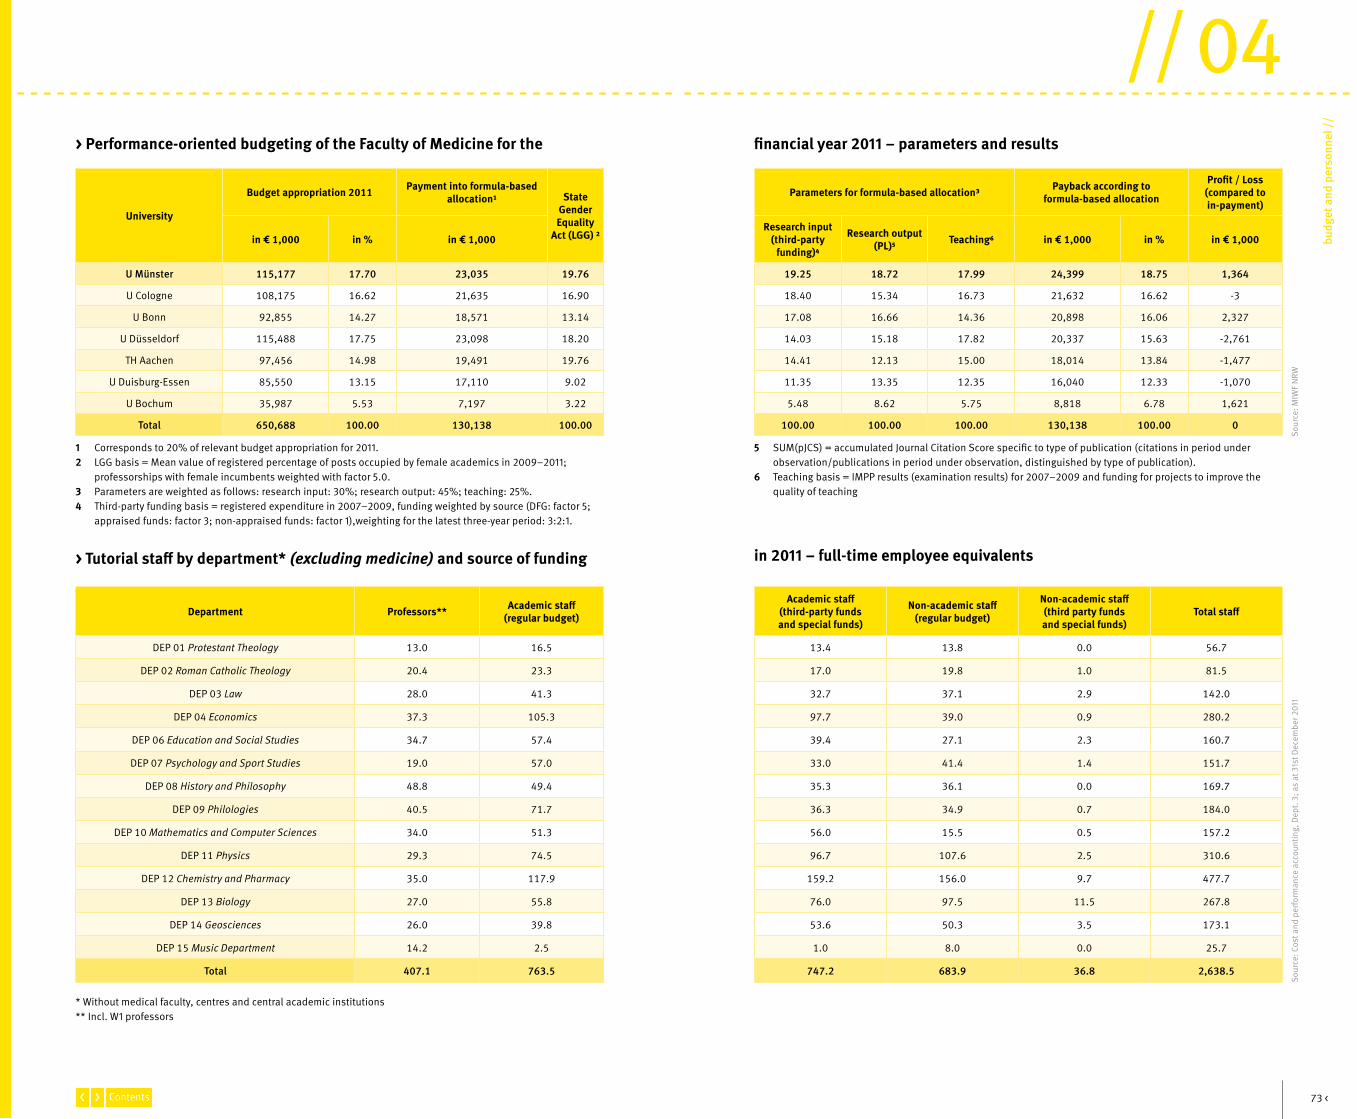
73 <
budg
et a
nd p
erso
nnel
//
// 04Lesezeichen
> Performance-oriented budgeting of the Faculty of Medicine for the financial year 2011 – parameters and results
1 Corresponds to 20% of relevant budget appropriation for 2011.2 LGG basis = Mean value of registered percentage of posts occupied by female academics in 2009–2011; professorships with female incumbents weighted with factor 5.0.3 Parameters are weighted as follows: research input: 30%; research output: 45%; teaching: 25%.4 Third-party funding basis = registered expenditure in 2007–2009, funding weighted by source (DFG: factor 5;
appraised funds: factor 3; non-appraised funds: factor 1),weighting for the latest three-year period: 3:2:1.
5 SUM(pJCS) = accumulated Journal Citation Score specific to type of publication (citations in period under observation/publications in period under observation, distinguished by type of publication).6 Teaching basis = IMPP results (examination results) for 2007–2009 and funding for projects to improve the
quality of teaching
Sour
ce: C
ost a
nd p
erfo
rman
ce a
ccou
ntin
g, D
ept.
3; a
s at
31s
t Dec
embe
r 201
1
> Tutorial staff by department* (excluding medicine) and source of funding in 2011 – full-time employee equivalents
* Without medical faculty, centres and central academic institutions** Incl. W1 professors
Sour
ce: M
IWF
NRW
University
Budget appropriation 2011 Payment into formula-basedallocation1 State
GenderEquality
Act (LGG) 2
Parameters for formula-based allocation3 Payback according toformula-based allocation
Profit / Loss(compared toin-payment)
in € 1,000 in % in € 1,000Research input
(third-partyfunding)4
Research output(PL)5 Teaching6 in € 1,000 in % in € 1,000
U Münster 115,177 17.70 23,035 19.76 19.25 18.72 17.99 24,399 18.75 1,364
U Cologne 108,175 16.62 21,635 16.90 18.40 15.34 16.73 21,632 16.62 -3
U Bonn 92,855 14.27 18,571 13.14 17.08 16.66 14.36 20,898 16.06 2,327
U Düsseldorf 115,488 17.75 23,098 18.20 14.03 15.18 17.82 20,337 15.63 -2,761
TH Aachen 97,456 14.98 19,491 19.76 14.41 12.13 15.00 18,014 13.84 -1,477
U Duisburg-Essen 85,550 13.15 17,110 9.02 11.35 13.35 12.35 16,040 12.33 -1,070
U Bochum 35,987 5.53 7,197 3.22 5.48 8.62 5.75 8,818 6.78 1,621
Total 650,688 100.00 130,138 100.00 100.00 100.00 100.00 130,138 100.00 0
Department Professors** Academic staff(regular budget)
Academic staff(third-party fundsand special funds)
Non-academic staff(regular budget)
Non-academic staff(third party fundsand special funds)
Total staff
DEP 01 Protestant Theology 13.0 16.5 13.4 13.8 0.0 56.7
DEP 02 Roman Catholic Theology 20.4 23.3 17.0 19.8 1.0 81.5
DEP 03 Law 28.0 41.3 32.7 37.1 2.9 142.0
DEP 04 Economics 37.3 105.3 97.7 39.0 0.9 280.2
DEP 06 Education and Social Studies 34.7 57.4 39.4 27.1 2.3 160.7
DEP 07 Psychology and Sport Studies 19.0 57.0 33.0 41.4 1.4 151.7
DEP 08 History and Philosophy 48.8 49.4 35.3 36.1 0.0 169.7
DEP 09 Philologies 40.5 71.7 36.3 34.9 0.7 184.0
DEP 10 Mathematics and Computer Sciences 34.0 51.3 56.0 15.5 0.5 157.2
DEP 11 Physics 29.3 74.5 96.7 107.6 2.5 310.6
DEP 12 Chemistry and Pharmacy 35.0 117.9 159.2 156.0 9.7 477.7
DEP 13 Biology 27.0 55.8 76.0 97.5 11.5 267.8
DEP 14 Geosciences 26.0 39.8 53.6 50.3 3.5 173.1
DEP 15 Music Department 14.2 2.5 1.0 8.0 0.0 25.7
Total 407.1 763.5 747.2 683.9 36.8 2,638.5

75 <
budg
et a
nd p
erso
nnel
//
// 04Lesezeichen
Higher educationinstitution
Junior professorships Professorships1
Junior- professorships and
Professorships Women in %
2010 in total female 2010
in total female 2010 in total female HEI NRW in
total
U Paderborn 14 5 186 53 200 58 29.00 10.31
U Bielefeld 18 8 242 55 260 63 24.23 8.62
U Wuppertal 13 3 232 55 245 58 23.67 8.42
U Siegen 8 2 233 54 241 56 23.24 8.26
U Cologne 21 6 413 93 434 99 22.81 8.11
U Bochum 48 19 368 71 416 90 21.63 7.69
U Duisburg-Essen 14 5 337 70 351 75 21.37 7.60
FeU Hagen 1 0 76 16 77 16 20.78 7.39
U Dortmund 13 5 280 55 293 60 20.48 7.28
U Münster 30 9 387 76 417 85 20.38 7.25
U Düsseldorf 11 3 177 34 188 37 19.68 7.00
TH Aachen 29 12 326 35 355 47 13.24 4.71
U Bonn 18 3 390 50 408 53 12.99 4.62
DSH Cologne 1 0 25 2 26 2 7.69 2.74
Total 239 80 3,672 719 3,911 799 20.43 100.00
> Performance-oriented budgeting for the financial year 2012 (excluding medicine) – parameter gender equality
1 Professorships = full-time university professorships and professors at research universities
Sour
ce: M
IWF
NRW
– D
epar
tmen
t 111
10%
20%
30%
40%
50%
60%
0%
70%
80%
90%
100%
students PhDs research staff habilitations professorships
> Diagram showing the ’leaky pipeline’ relating to percentages of women and men in their academic careers at WWU Münster
percentage of men percentage of women
Indicator Rank
Women in % Indicators (relative)
WWURange of all universities examined
percentage of women
in relation to the propor-tion of female
students
Range of all universities examined
Students leading group 53.1 15.0 – 70.01 2 2
PhDs middle group 43.7 11.3 – 100.0 0.822 0.409 – 1.429
Research Staff middle group 37.3 0.0 – 63.3 0.702 0.000 – 1.925
Habilitations middle group 23.9 0.0 – 75.0 0.450 0.000 – 1.212
Professorships middle group 17.2 0.0 – 44.2 0.325 0.000 – 0.932
Indicator Rank
WWURange of all universities examined
Womenin % (2004)
Womenin % (2009)
increase in %-Points
Increase in proportion ofwomen among academic staff from 2004 to 2009
leading group 31.1 37.3 +6.1 -9.1 – +23.1
Increase in proportionof women holding pro-fessorships from 2004
to 2009
middle group 13.2 17.2 +4.1 -11.1 – +18.5
> WWU Münster in the 2011 CEWS higher education ranking, based on gender equality
1 Flat-rate values were set for cases below 15% or above 70%2 The indicator measures the equal distribution of male and female students by subject groups, proportional to
the German average. WWU Münster attains a score of 1.008 in a range from 0.742 to 1.340.
Sour
ce: G
ESIS
/CEW
S (w
ww
.ges
is.o
rg/c
ews/
filea
dmin
/cew
s/w
ww
/dow
nloa
d/ce
ws-
publ
ik16
)So
urce
: WW
U g
raph
ic b
ased
on
gend
er e
qual
ity ra
nkin
g in
hig
her e
duca
tion
2011
by C
EWS
Lesezeichen

77 <
budg
et a
nd p
erso
nnel
//
// 04Lesezeichen
> Appointment procedures completed in 2011
Sour
ce: D
ept.
3
Department
Appointments to WWU
Totalnumber of
appointments
of which
Type of professorship
FemaleW3 W2 W1
DEP 01 Protestant Theology 0 0 0 0 0
DEP 02 Roman Catholic Theology 2 1 1 0 0
DEP 03 Law 2 2 0 0 1
DEP 04 Economics 2 0 0 2 2
DEP 05 Medicine 3 3 0 0 0
DEP 06 Education and Social Studies 3 0 3 0 1
DEP 07 Psychology and Sport Studies 1 0 1 0 1
DEP 08 History and Philosophy 4 3 1 0 1
DEP 09 Philologies 8 4 2 2 4
DEP 10 Mathematics and Computer Sciences 6 1 4 1 0
DEP 11 Physics 2 0 2 0 1
DEP 12 Chemistry and Pharmacy 0 0 0 0 0
DEP 13 Biology 1 0 1 0 0
DEP 14 Geosciences 3 1 2 0 0
DEP 15 Music Department 0 0 0 0 0
Not assigned to a department 0 0 0 0 0
Total 37 15 17 5 11
Appointments to WWU Negotiations with WWU professors on their remaining in office
of which
Total numberof procedures
of which
Foreignnationality
Appointedfrom abroad
Outcome:staying at
WWU
Outcome:leaving for
anotheruniversity
Type ofprofessorship Female
W3 W2
0 0 1 0 1 1 0 0
0 0 1 0 1 1 0 0
0 0 1 1 0 1 0 0
0 0 1 1 0 0 1 0
0 0 1 1 0 0 1 1
0 2 3 2 1 2 1 0
0 1 1 0 1 0 1 1
0 1 0 0 0 0 0 0
1 1 0 0 0 0 0 0
0 2 0 0 0 0 0 0
1 2 1 0 1 1 0 1
0 0 4 3 1 3 1 1
0 0 2 2 0 0 2 0
1 2 0 0 0 0 0 0
0 0 0 0 0 0 0 0
0 0 0 0 0 0 0 0
3 11 16 10 6 9 7 4
Lesezeichen
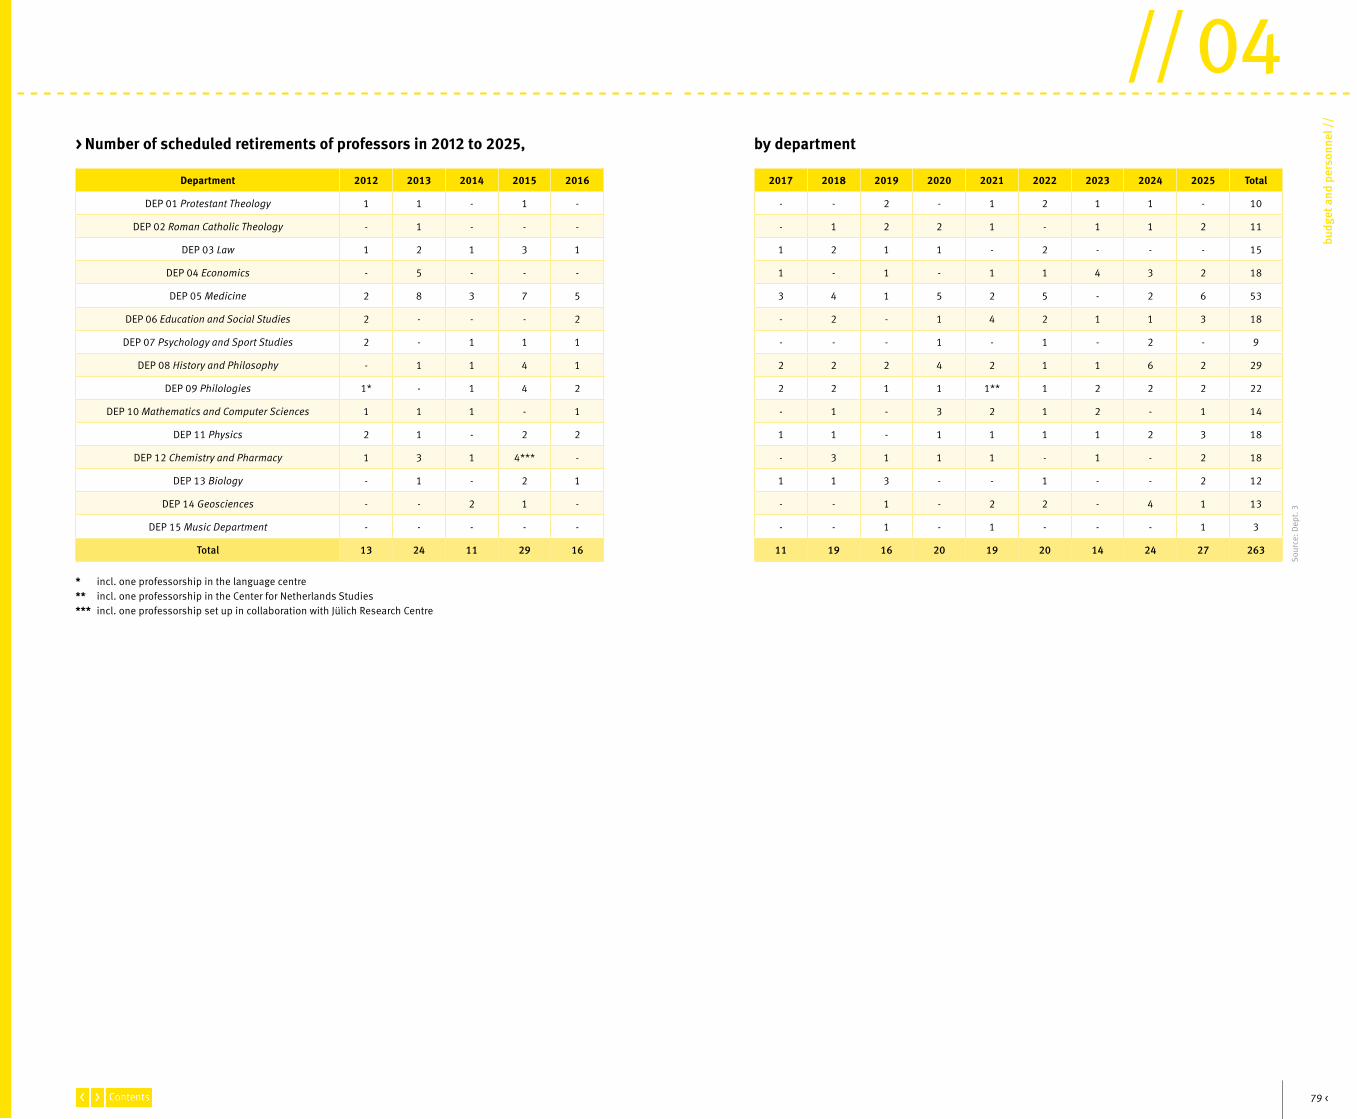
79 <
budg
et a
nd p
erso
nnel
//
// 04Lesezeichen
> Number of scheduled retirements of professors in 2012 to 2025, by department
* incl. one professorship in the language centre** incl. one professorship in the Center for Netherlands Studies*** incl. one professorship set up in collaboration with Jülich Research Centre
Sour
ce: D
ept.
3
Department 2012 2013 2014 2015 2016 2017 2018 2019 2020 2021 2022 2023 2024 2025 Total
DEP 01 Protestant Theology 1 1 - 1 - - - 2 - 1 2 1 1 - 10
DEP 02 Roman Catholic Theology - 1 - - - - 1 2 2 1 - 1 1 2 11
DEP 03 Law 1 2 1 3 1 1 2 1 1 - 2 - - - 15
DEP 04 Economics - 5 - - - 1 - 1 - 1 1 4 3 2 18
DEP 05 Medicine 2 8 3 7 5 3 4 1 5 2 5 - 2 6 53
DEP 06 Education and Social Studies 2 - - - 2 - 2 - 1 4 2 1 1 3 18
DEP 07 Psychology and Sport Studies 2 - 1 1 1 - - - 1 - 1 - 2 - 9
DEP 08 History and Philosophy - 1 1 4 1 2 2 2 4 2 1 1 6 2 29
DEP 09 Philologies 1* - 1 4 2 2 2 1 1 1** 1 2 2 2 22
DEP 10 Mathematics and Computer Sciences 1 1 1 - 1 - 1 - 3 2 1 2 - 1 14
DEP 11 Physics 2 1 - 2 2 1 1 - 1 1 1 1 2 3 18
DEP 12 Chemistry and Pharmacy 1 3 1 4*** - - 3 1 1 1 - 1 - 2 18
DEP 13 Biology - 1 - 2 1 1 1 3 - - 1 - - 2 12
DEP 14 Geosciences - - 2 1 - - - 1 - 2 2 - 4 1 13
DEP 15 Music Department - - - - - - - 1 - 1 - - - 1 3
Total 13 24 11 29 16 11 19 16 20 19 20 14 24 27 263
Lesezeichen

// 05in
fras
truc
ture
//
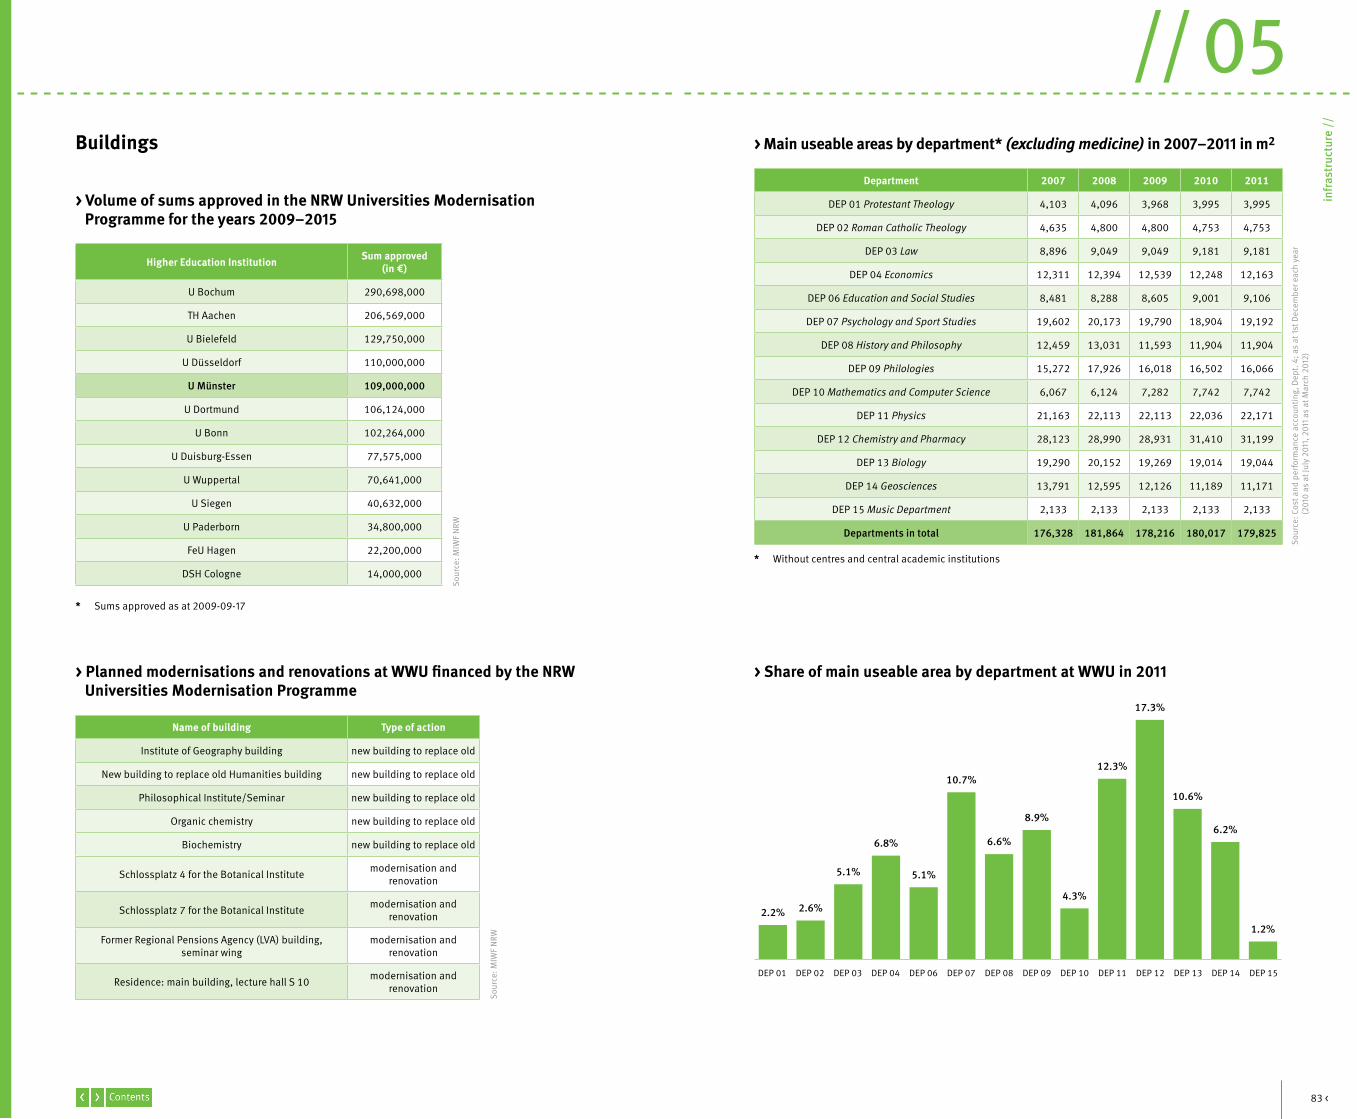
2.2%
5.1%
4.3%
6.8%
8.9%
10.6%
1.2%
2.6%
10.7%12.3%
5.1%
6.6%
17.3%
6.2%
DEP 01 DEP 06 DEP 10DEP 04 DEP 09 DEP 13 DEP 15DEP 02 DEP 07 DEP 11DEP 03 DEP 08 DEP 12 DEP 14
83 <
infr
astr
uctu
re /
/
// 05Lesezeichen
> Share of main useable area by department at WWU in 2011
> Main useable areas by department* (excluding medicine) in 2007–2011 in m2
> Volume of sums approved in the NRW Universities Modernisation Programme for the years 2009–2015
> Planned modernisations and renovations at WWU financed by the NRW Universities Modernisation Programme
Department 2007 2008 2009 2010 2011
DEP 01 Protestant Theology 4,103 4,096 3,968 3,995 3,995
DEP 02 Roman Catholic Theology 4,635 4,800 4,800 4,753 4,753
DEP 03 Law 8,896 9,049 9,049 9,181 9,181
DEP 04 Economics 12,311 12,394 12,539 12,248 12,163
DEP 06 Education and Social Studies 8,481 8,288 8,605 9,001 9,106
DEP 07 Psychology and Sport Studies 19,602 20,173 19,790 18,904 19,192
DEP 08 History and Philosophy 12,459 13,031 11,593 11,904 11,904
DEP 09 Philologies 15,272 17,926 16,018 16,502 16,066
DEP 10 Mathematics and Computer Science 6,067 6,124 7,282 7,742 7,742
DEP 11 Physics 21,163 22,113 22,113 22,036 22,171
DEP 12 Chemistry and Pharmacy 28,123 28,990 28,931 31,410 31,199
DEP 13 Biology 19,290 20,152 19,269 19,014 19,044
DEP 14 Geosciences 13,791 12,595 12,126 11,189 11,171
DEP 15 Music Department 2,133 2,133 2,133 2,133 2,133
Departments in total 176,328 181,864 178,216 180,017 179,825
Higher Education Institution Sum approved(in €)
U Bochum 290,698,000
TH Aachen 206,569,000
U Bielefeld 129,750,000
U Düsseldorf 110,000,000
U Münster 109,000,000
U Dortmund 106,124,000
U Bonn 102,264,000
U Duisburg-Essen 77,575,000
U Wuppertal 70,641,000
U Siegen 40,632,000
U Paderborn 34,800,000
FeU Hagen 22,200,000
DSH Cologne 14,000,000
Name of building Type of action
Institute of Geography building new building to replace old
New building to replace old Humanities building new building to replace old
Philosophical Institute/Seminar new building to replace old
Organic chemistry new building to replace old
Biochemistry new building to replace old
Schlossplatz 4 for the Botanical Institute modernisation andrenovation
Schlossplatz 7 for the Botanical Institute modernisation andrenovation
Former Regional Pensions Agency (LVA) building,seminar wing
modernisation andrenovation
Residence: main building, lecture hall S 10 modernisation andrenovation
* Without centres and central academic institutions
* Sums approved as at 2009-09-17
Sour
ce: C
ost a
nd p
erfo
rman
ce a
ccou
ntin
g, D
ept.
4; a
s at
1st
Dec
embe
r eac
h ye
ar
(201
0 as
at J
uly
2011
, 201
1 as
at M
arch
201
2)
Sour
ce: M
IWF
NRW
Sour
ce: M
IWF
NRW
Buildings
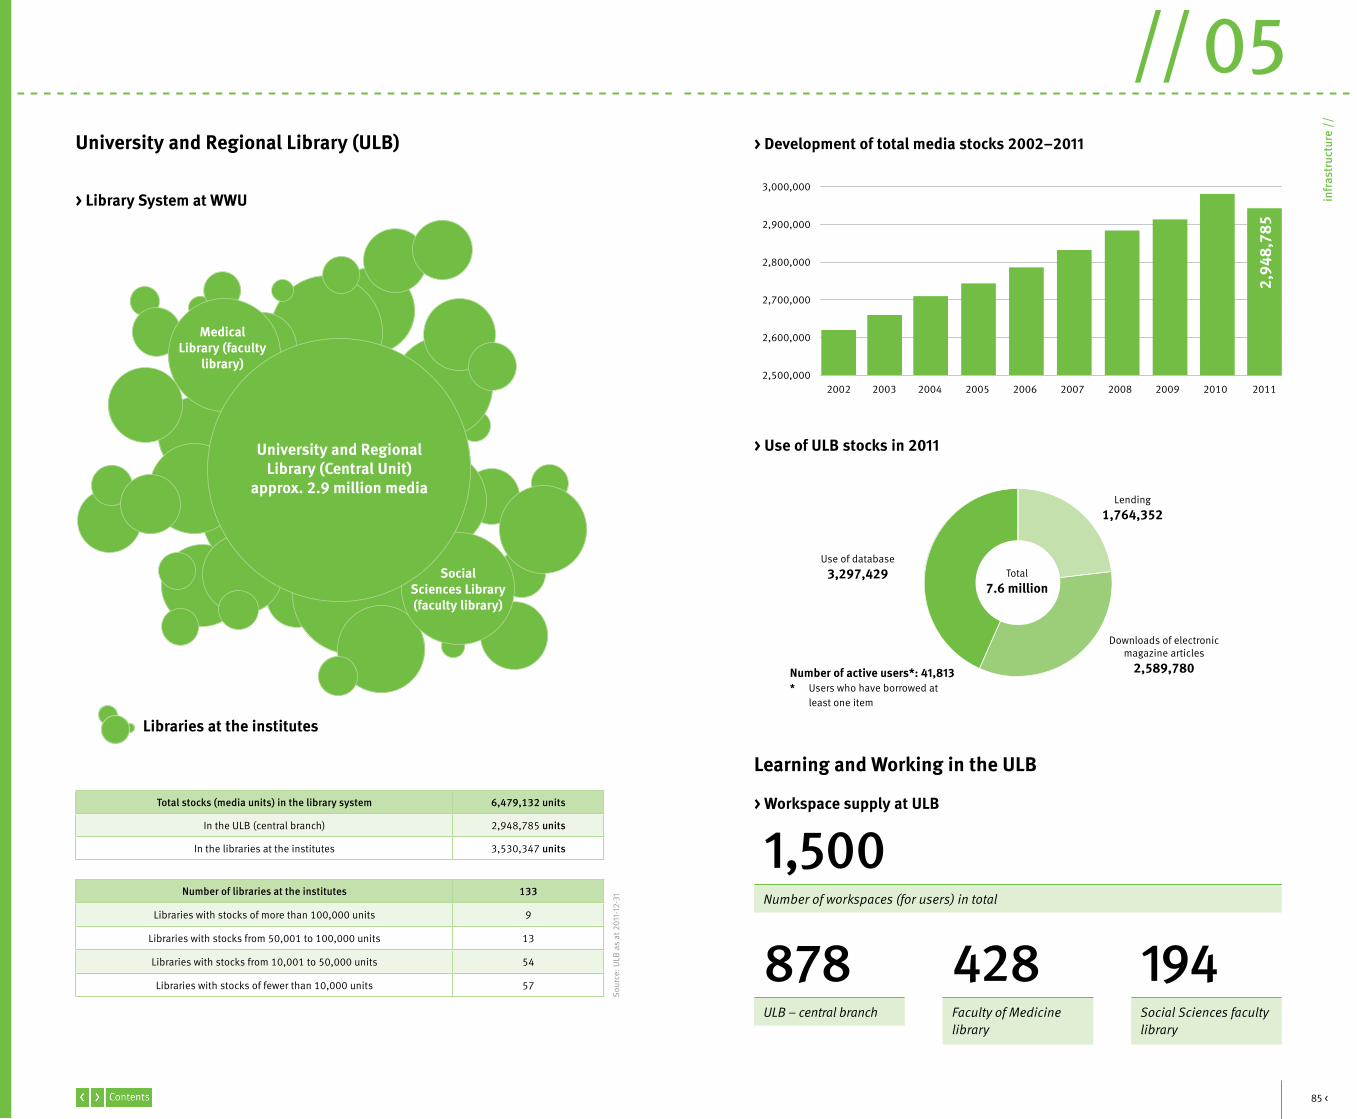
2002 2003 2004 2005 2006 2007 2008 2009
2,600,000
2,700,000
2,800,000
2,500,000
2,900,000
3,000,000
MedicalLibrary (faculty
library)
SocialSciences Library(faculty library)
Libraries at the institutes
University and RegionalLibrary (Central Unit)
approx. 2.9 million media
2010 2011
2,94
8,78
5
85 <
infr
astr
uctu
re /
/
// 05Lesezeichen
> Development of total media stocks 2002–2011
Total7.6 million
Lending1,764,352
Use of database3,297,429
Downloads of electronicmagazine articles
2,589,780Number of active users*: 41,813* Users who have borrowed at least one item
> Use of ULB stocks in 2011
> Workspace supply at ULB
Learning and Working in the ULB
1,500
878 428 194Number of workspaces (for users) in total
ULB – central branch Faculty of Medicinelibrary
Social Sciences facultylibrary
Total stocks (media units) in the library system 6,479,132 units
In the ULB (central branch) 2,948,785 units
In the libraries at the institutes 3,530,347 units
Number of libraries at the institutes 133
Libraries with stocks of more than 100,000 units 9
Libraries with stocks from 50,001 to 100,000 units 13
Libraries with stocks from 10,001 to 50,000 units 54
Libraries with stocks of fewer than 10,000 units 57
University and Regional Library (ULB)
> Library System at WWU
Sour
ce: U
LB a
s at
201
1-12
-31
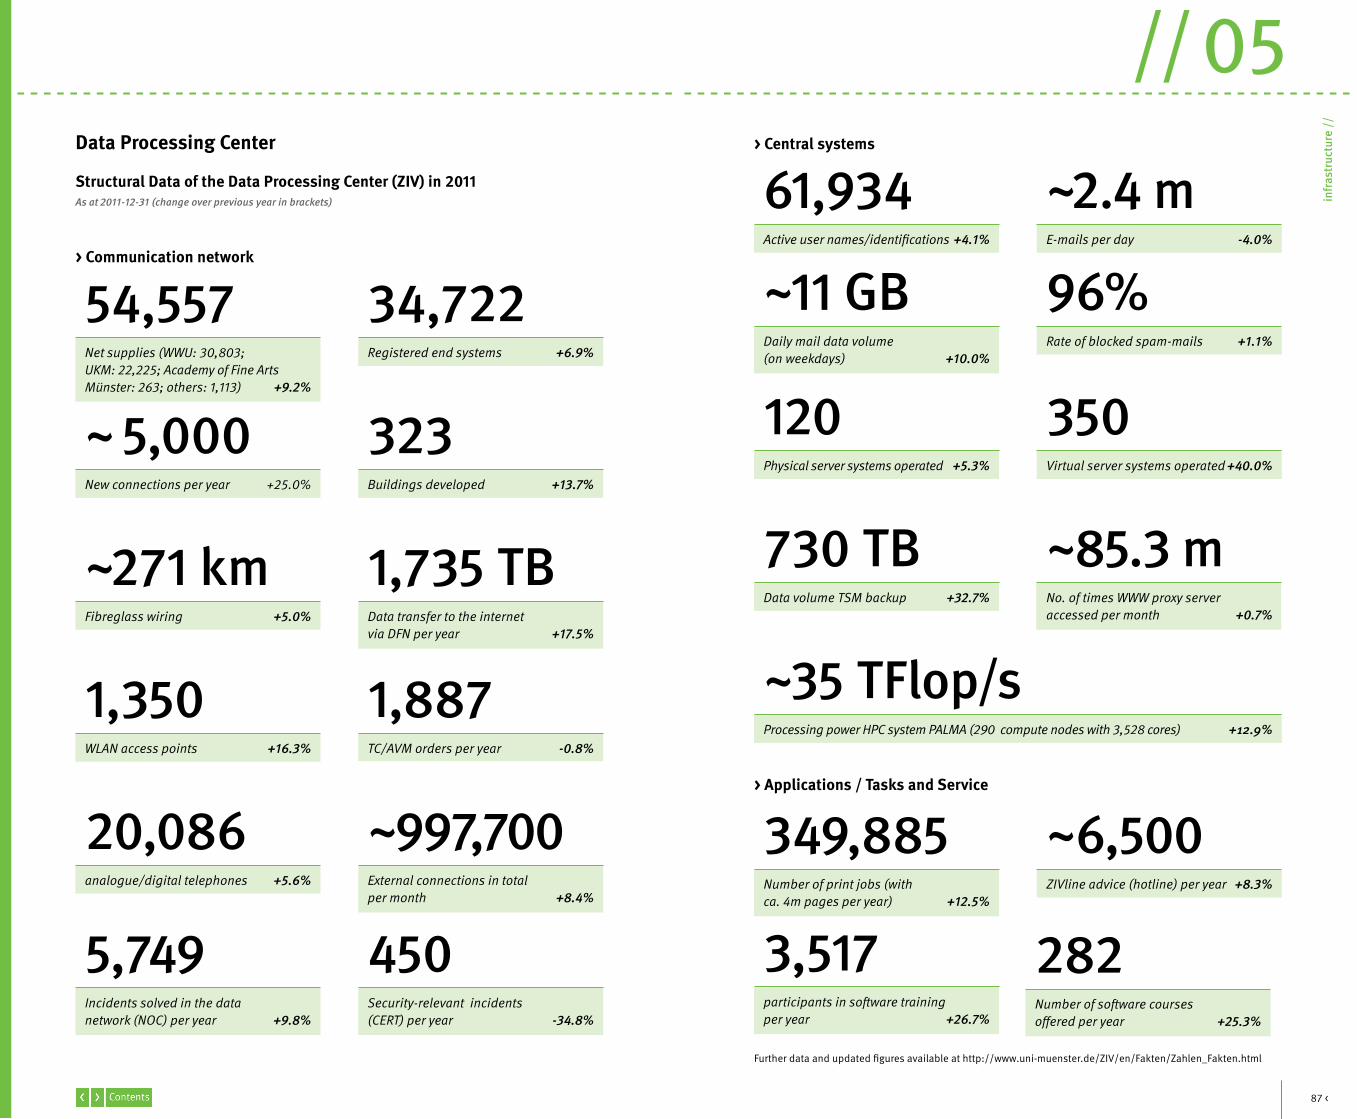
87 <
infr
astr
uctu
re /
/
// 05Lesezeichen
> Communication network
> Central systems
54,557
61,934
~271 km 730 TB
~ 5,000
~11 GB
120 350
1,350 ~35 TFlop/s
20,086
34,722
~2.4 m
1,735 TB ~85.3 m
323
96%
1,887
~997,700
Net supplies (WWU: 30,803; UKM: 22,225; Academy of Fine Arts Münster: 263; others: 1,113) +9.2%
Active user names/identifications +4.1%
Fibreglass wiring +5.0%Data volume TSM backup +32.7%
New connections per year +25.0%
Daily mail data volume(on weekdays) +10.0%
Physical server systems operated +5.3% Virtual server systems operated +40.0%
WLAN access points +16.3%Processing power HPC system PALMA (290 compute nodes with 3,528 cores) +12.9%
analogue/digital telephones +5.6%
Registered end systems +6.9%
E-mails per day -4.0%
Data transfer to the internetvia DFN per year +17.5%
No. of times WWW proxy serveraccessed per month +0.7%
Buildings developed +13.7%
Rate of blocked spam-mails +1.1%
TC/AVM orders per year -0.8%
External connections in totalper month +8.4%
Data Processing Center
Structural Data of the Data Processing Center (ZIV) in 2011As at 2011-12-31 (change over previous year in brackets)
5,749 450Incidents solved in the datanetwork (NOC) per year +9.8%
Security-relevant incidents(CERT) per year -34.8%
> Applications / Tasks and Service
349,885 ~6,500Number of print jobs (withca. 4m pages per year) +12.5%
ZIVline advice (hotline) per year +8.3%
Further data and updated figures available at http://www.uni-muenster.de/ZIV/en/Fakten/Zahlen_Fakten.html
3,517participants in software training per year +26.7%
282Number of software courses offered per year +25.3%
GRK
KLR
UKM
// 06gl
ossa
ry
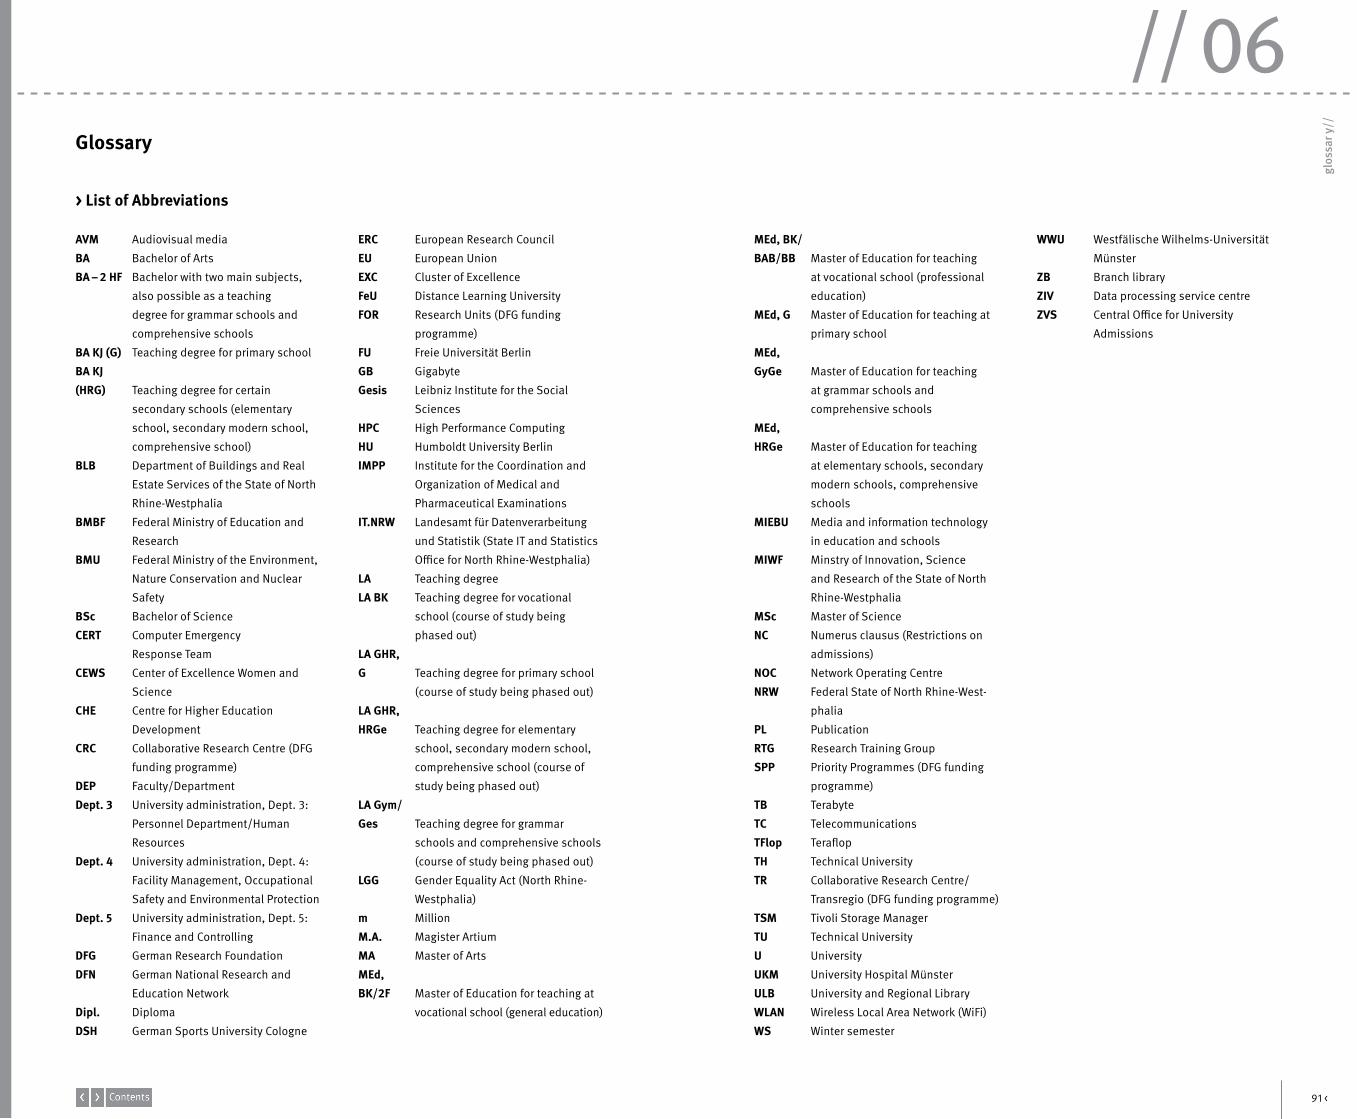
91 <
glos
sar y
//
// 06Lesezeichen
MEd, BK/BAB/BB Master of Education for teaching
at vocational school (professional
education)
MEd, G Master of Education for teaching at
primary school
MEd, GyGe Master of Education for teaching
at grammar schools and
comprehensive schools
MEd, HRGe Master of Education for teaching
at elementary schools, secondary
modern schools, comprehensive
schools
MIEBU Media and information technology
in education and schools
MIWF Minstry of Innovation, Science
and Research of the State of North
Rhine-Westphalia
MSc Master of Science
NC Numerus clausus (Restrictions on
admissions)
NOC Network Operating Centre
NRW Federal State of North Rhine-West-
phalia
PL Publication
RTG Research Training Group
SPP Priority Programmes (DFG funding
programme)
TB Terabyte
TC Telecommunications
TFlop Teraflop
TH Technical University
TR Collaborative Research Centre/
Transregio (DFG funding programme)
TSM Tivoli Storage Manager
TU Technical University
U University
UKM University Hospital Münster
ULB University and Regional Library
WLAN Wireless Local Area Network (WiFi)
WS Winter semester
WWU Westfälische Wilhelms-Universität
Münster
ZB Branch library
ZIV Data processing service centre
ZVS Central Office for University
Admissions
AVM Audiovisual media
BA Bachelor of Arts
BA – 2 HF Bachelor with two main subjects,
also possible as a teaching
degree for grammar schools and
comprehensive schools
BA KJ (G) Teaching degree for primary school
BA KJ (HRG) Teaching degree for certain
secondary schools (elementary
school, secondary modern school,
comprehensive school)
BLB Department of Buildings and Real
Estate Services of the State of North
Rhine-Westphalia
BMBF Federal Ministry of Education and
Research
BMU Federal Ministry of the Environment,
Nature Conservation and Nuclear
Safety
BSc Bachelor of Science
CERT Computer Emergency
Response Team
CEWS Center of Excellence Women and
Science
CHE Centre for Higher Education
Development
CRC Collaborative Research Centre (DFG
funding programme)
DEP Faculty/Department
Dept. 3 University administration, Dept. 3:
Personnel Department/Human
Resources
Dept. 4 University administration, Dept. 4:
Facility Management, Occupational
Safety and Environmental Protection
Dept. 5 University administration, Dept. 5:
Finance and Controlling
DFG German Research Foundation
DFN German National Research and
Education Network
Dipl. Diploma
DSH German Sports University Cologne
ERC European Research Council
EU European Union
EXC Cluster of Excellence
FeU Distance Learning University
FOR Research Units (DFG funding
programme)
FU Freie Universität Berlin
GB Gigabyte
Gesis Leibniz Institute for the Social
Sciences
HPC High Performance Computing
HU Humboldt University Berlin
IMPP Institute for the Coordination and
Organization of Medical and
Pharmaceutical Examinations
IT.NRW Landesamt für Datenverarbeitung
und Statistik (State IT and Statistics
Office for North Rhine-Westphalia)
LA Teaching degree
LA BK Teaching degree for vocational
school (course of study being
phased out)
LA GHR, G Teaching degree for primary school
(course of study being phased out)
LA GHR,HRGe Teaching degree for elementary
school, secondary modern school,
comprehensive school (course of
study being phased out)
LA Gym/Ges Teaching degree for grammar
schools and comprehensive schools
(course of study being phased out)
LGG Gender Equality Act (North Rhine-
Westphalia)
m Million
M.A. Magister Artium
MA Master of Arts
MEd, BK/2F Master of Education for teaching at
vocational school (general education)
Glossary
> List of Abbreviations
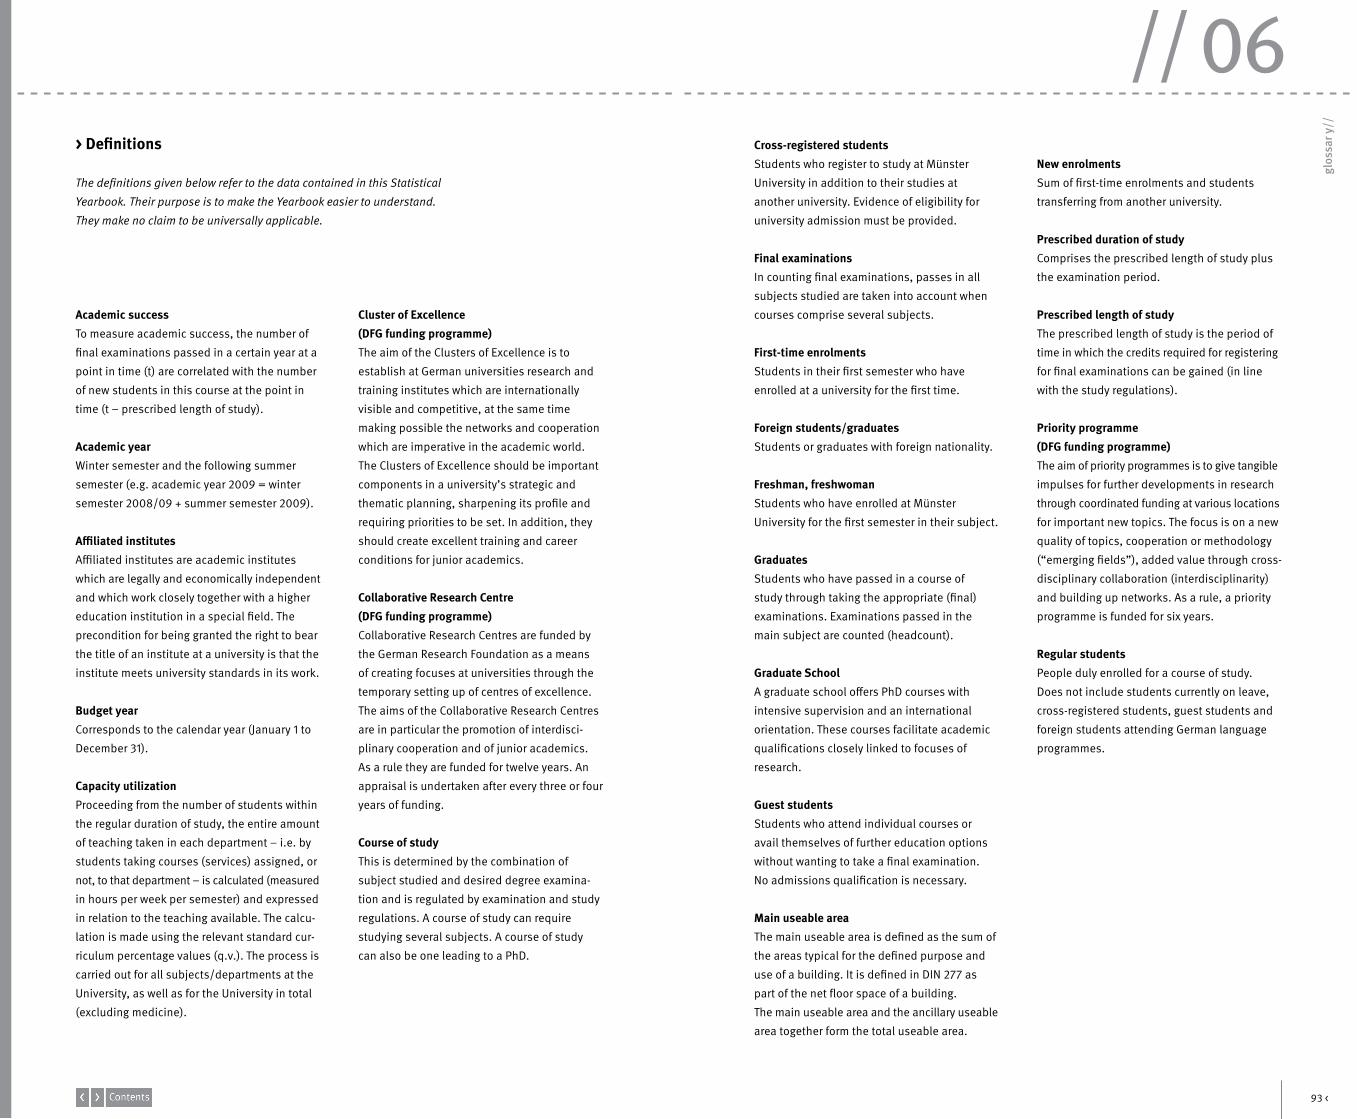
93 <
glos
sar y
//
// 06Lesezeichen
Cross-registered studentsStudents who register to study at Münster
University in addition to their studies at
another university. Evidence of eligibility for
university admission must be provided.
Final examinationsIn counting final examinations, passes in all
subjects studied are taken into account when
courses comprise several subjects.
First-time enrolmentsStudents in their first semester who have
enrolled at a university for the first time.
Foreign students/graduatesStudents or graduates with foreign nationality.
Freshman, freshwomanStudents who have enrolled at Münster
University for the first semester in their subject.
GraduatesStudents who have passed in a course of
study through taking the appropriate (final)
examinations. Examinations passed in the
main subject are counted (headcount).
Graduate SchoolA graduate school offers PhD courses with
intensive supervision and an international
orientation. These courses facilitate academic
qualifications closely linked to focuses of
research.
Guest studentsStudents who attend individual courses or
avail themselves of further education options
without wanting to take a final examination.
No admissions qualification is necessary.
Main useable areaThe main useable area is defined as the sum of
the areas typical for the defined purpose and
use of a building. It is defined in DIN 277 as
part of the net floor space of a building.
The main useable area and the ancillary useable
area together form the total useable area.
New enrolmentsSum of first-time enrolments and students
transferring from another university.
Prescribed duration of studyComprises the prescribed length of study plus
the examination period.
Prescribed length of studyThe prescribed length of study is the period of
time in which the credits required for registering
for final examinations can be gained (in line
with the study regulations).
Priority programme(DFG funding programme)The aim of priority programmes is to give tangible
impulses for further developments in research
through coordinated funding at various locations
for important new topics. The focus is on a new
quality of topics, cooperation or methodology
(“emerging fields”), added value through cross-
disciplinary collaboration (interdisciplinarity)
and building up networks. As a rule, a priority
programme is funded for six years.
Regular studentsPeople duly enrolled for a course of study.
Does not include students currently on leave,
cross-registered students, guest students and
foreign students attending German language
programmes.
Academic successTo measure academic success, the number of
final examinations passed in a certain year at a
point in time (t) are correlated with the number
of new students in this course at the point in
time (t – prescribed length of study).
Academic yearWinter semester and the following summer
semester (e.g. academic year 2009 = winter
semester 2008/09 + summer semester 2009).
Affiliated institutesAffiliated institutes are academic institutes
which are legally and economically independent
and which work closely together with a higher
education institution in a special field. The
precondition for being granted the right to bear
the title of an institute at a university is that the
institute meets university standards in its work.
Budget yearCorresponds to the calendar year (January 1 to
December 31).
Capacity utilizationProceeding from the number of students within
the regular duration of study, the entire amount
of teaching taken in each department – i.e. by
students taking courses (services) assigned, or
not, to that department – is calculated (measured
in hours per week per semester) and expressed
in relation to the teaching available. The calcu-
lation is made using the relevant standard cur-
riculum percentage values (q.v.). The process is
carried out for all subjects/departments at the
University, as well as for the University in total
(excluding medicine).
Cluster of Excellence(DFG funding programme)The aim of the Clusters of Excellence is to
establish at German universities research and
training institutes which are internationally
visible and competitive, at the same time
making possible the networks and cooperation
which are imperative in the academic world.
The Clusters of Excellence should be important
components in a university’s strategic and
thematic planning, sharpening its profile and
requiring priorities to be set. In addition, they
should create excellent training and career
conditions for junior academics.
Collaborative Research Centre(DFG funding programme)Collaborative Research Centres are funded by
the German Research Foundation as a means
of creating focuses at universities through the
temporary setting up of centres of excellence.
The aims of the Collaborative Research Centres
are in particular the promotion of interdisci-
plinary cooperation and of junior academics.
As a rule they are funded for twelve years. An
appraisal is undertaken after every three or four
years of funding.
Course of studyThis is determined by the combination of
subject studied and desired degree examina-
tion and is regulated by examination and study
regulations. A course of study can require
studying several subjects. A course of study
can also be one leading to a PhD.
> Definitions
The definitions given below refer to the data contained in this Statistical
Yearbook. Their purpose is to make the Yearbook easier to understand.
They make no claim to be universally applicable.
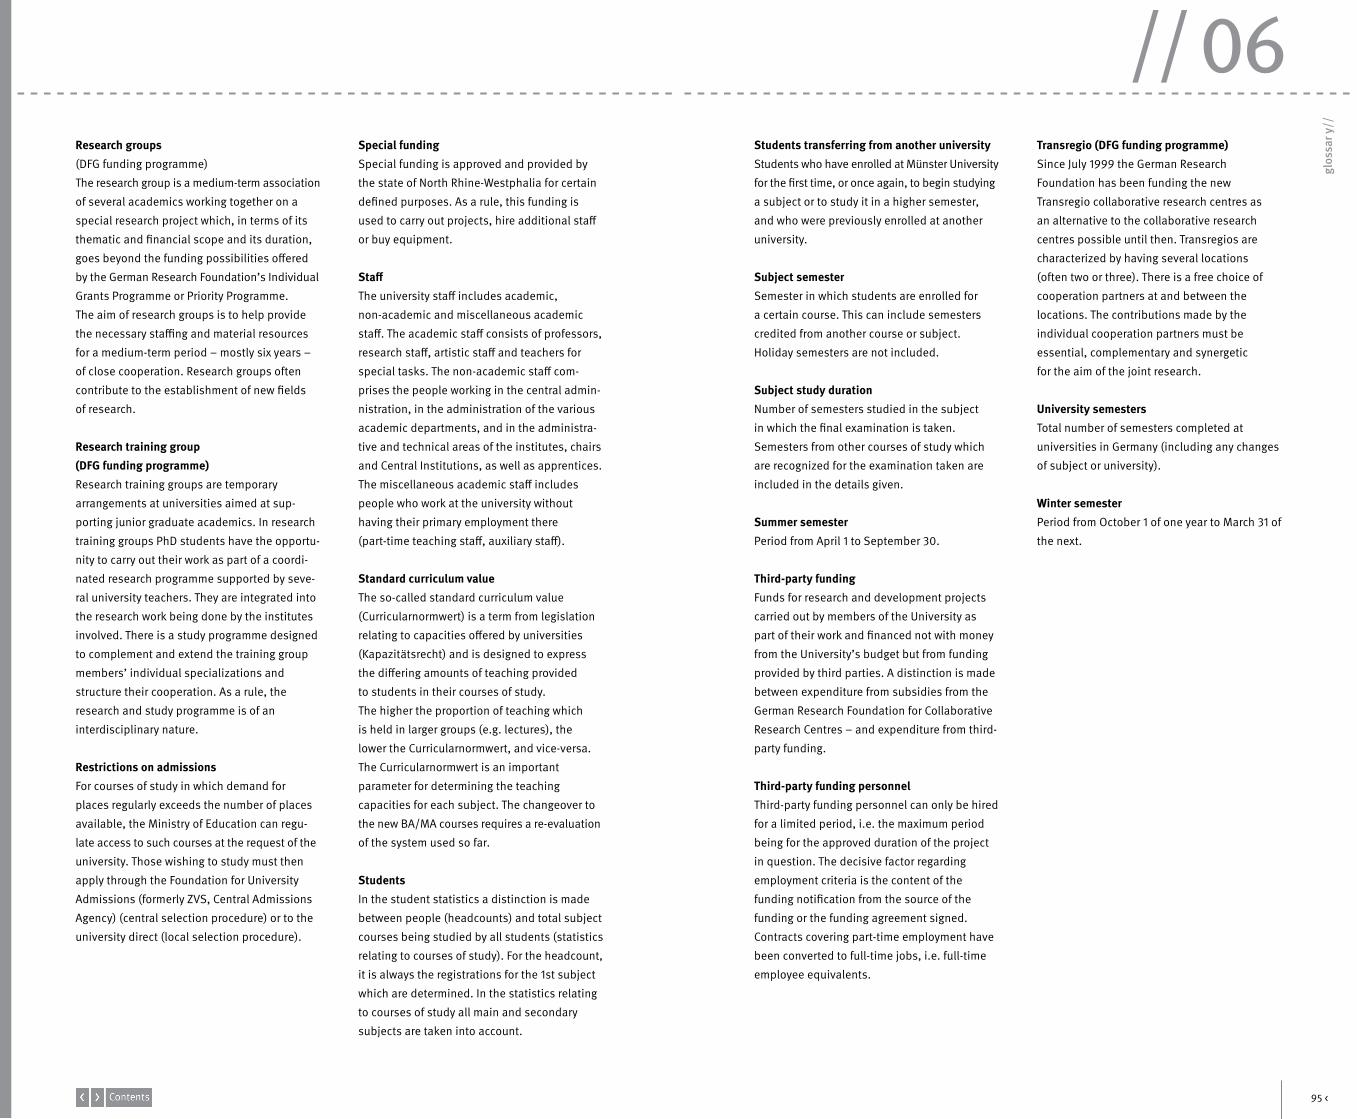
95 <
glos
sar y
//
// 06Lesezeichen
Students transferring from another universityStudents who have enrolled at Münster University
for the first time, or once again, to begin studying
a subject or to study it in a higher semester,
and who were previously enrolled at another
university.
Subject semesterSemester in which students are enrolled for
a certain course. This can include semesters
credited from another course or subject.
Holiday semesters are not included.
Subject study durationNumber of semesters studied in the subject
in which the final examination is taken.
Semesters from other courses of study which
are recognized for the examination taken are
included in the details given.
Summer semesterPeriod from April 1 to September 30.
Third-party fundingFunds for research and development projects
carried out by members of the University as
part of their work and financed not with money
from the University’s budget but from funding
provided by third parties. A distinction is made
between expenditure from subsidies from the
German Research Foundation for Collaborative
Research Centres – and expenditure from third-
party funding.
Third-party funding personnelThird-party funding personnel can only be hired
for a limited period, i.e. the maximum period
being for the approved duration of the project
in question. The decisive factor regarding
employment criteria is the content of the
funding notification from the source of the
funding or the funding agreement signed.
Contracts covering part-time employment have
been converted to full-time jobs, i.e. full-time
employee equivalents.
Transregio (DFG funding programme)Since July 1999 the German Research
Foundation has been funding the new
Transregio collaborative research centres as
an alternative to the collaborative research
centres possible until then. Transregios are
characterized by having several locations
(often two or three). There is a free choice of
cooperation partners at and between the
locations. The contributions made by the
individual cooperation partners must be
essential, complementary and synergetic
for the aim of the joint research.
University semestersTotal number of semesters completed at
universities in Germany (including any changes
of subject or university).
Winter semesterPeriod from October 1 of one year to March 31 of
the next.
Research groups(DFG funding programme)
The research group is a medium-term association
of several academics working together on a
special research project which, in terms of its
thematic and financial scope and its duration,
goes beyond the funding possibilities offered
by the German Research Foundation’s Individual
Grants Programme or Priority Programme.
The aim of research groups is to help provide
the necessary staffing and material resources
for a medium-term period – mostly six years –
of close cooperation. Research groups often
contribute to the establishment of new fields
of research.
Research training group(DFG funding programme)Research training groups are temporary
arrangements at universities aimed at sup-
porting junior graduate academics. In research
training groups PhD students have the opportu-
nity to carry out their work as part of a coordi-
nated research programme supported by seve-
ral university teachers. They are integrated into
the research work being done by the institutes
involved. There is a study programme designed
to complement and extend the training group
members’ individual specializations and
structure their cooperation. As a rule, the
research and study programme is of an
interdisciplinary nature.
Restrictions on admissionsFor courses of study in which demand for
places regularly exceeds the number of places
available, the Ministry of Education can regu-
late access to such courses at the request of the
university. Those wishing to study must then
apply through the Foundation for University
Admissions (formerly ZVS, Central Admissions
Agency) (central selection procedure) or to the
university direct (local selection procedure).
Special fundingSpecial funding is approved and provided by
the state of North Rhine-Westphalia for certain
defined purposes. As a rule, this funding is
used to carry out projects, hire additional staff
or buy equipment.
StaffThe university staff includes academic,
non-academic and miscellaneous academic
staff. The academic staff consists of professors,
research staff, artistic staff and teachers for
special tasks. The non-academic staff com-
prises the people working in the central admin-
nistration, in the administration of the various
academic departments, and in the administra-
tive and technical areas of the institutes, chairs
and Central Institutions, as well as apprentices.
The miscellaneous academic staff includes
people who work at the university without
having their primary employment there
(part-time teaching staff, auxiliary staff).
Standard curriculum valueThe so-called standard curriculum value
(Curricularnormwert) is a term from legislation
relating to capacities offered by universities
(Kapazitätsrecht) and is designed to express
the differing amounts of teaching provided
to students in their courses of study.
The higher the proportion of teaching which
is held in larger groups (e.g. lectures), the
lower the Curricularnormwert, and vice-versa.
The Curricularnormwert is an important
parameter for determining the teaching
capacities for each subject. The changeover to
the new BA/MA courses requires a re-evaluation
of the system used so far.
StudentsIn the student statistics a distinction is made
between people (headcounts) and total subject
courses being studied by all students (statistics
relating to courses of study). For the headcount,
it is always the registrations for the 1st subject
which are determined. In the statistics relating
to courses of study all main and secondary
subjects are taken into account.
Publisher:Rector of the WestfälischeWilhelms-Universität MünsterSchlossplatz 248149 Münster
Provision of content:Planning, Development & Controlling Dept.
Editorial work:Britta Pohlmann, M.A.Christian Tusch, M.A.Dipl.-Volksw. Hermann Schmitz (responsible)
Design:goldmarie design
Translation:Ken Ashton
Printed by:Wentker Druck GmbH
Print run:1,000
Münster, 2012
Lesezeichen