a stochastic frontier model for measuring online bank
TRANSCRIPT

S.Afr.J.Bus.Manage.2011,42(3) 49
A stochastic frontier model for measuring online bank profit efficiency
M.A. Baten*
Department of Statistics, School of Physical Sciences
Shahjalal University of Science and Technology, Sylhet-32114, Bangladesh
[email protected]; [email protected]
A.A. Kamil Mathematics Section, School of Distance Education,
Universiti Sains Malaysia, 11800 USM, Penang, Malaysia
Received July 2010
This study revisited an alternative profit efficiency function specified by Berger & Mester, (1997) and we applied Battese
& Coelli, (1995) inefficiency model as a unified and consistent framework in exploring the determinants of important
factors causing profit efficiency differential on banking industry in Bangladesh. Using stochastic frontier technique we
estimated bank specific profit efficiency for the period 2000 to 2007. This study attempted to examine the changes in the
profit efficiency in accordance with NBs (Nationalized Commercial Banks), ISBs (Islamic Banks), FBs (Foreign Banks)
and PBs (Private Banks) and significant variations of efficiencies across different kinds of banks in time periods. We
found that the profit inefficiency has declined over the reference period and Translog Production Function is more
preferable than Cobb-Douglas Production Function. Our results showed that Nationalized Commercial Banks were
significantly inefficient and on the contrary ISBs, FBs, and PBs were efficient in producing profit and noteworthy. The
estimated year wise average efficiencies of the sample banks from the profit efficiency model was 0.664 while group
wise average profit efficiency was 0,639. Dhaka Bank is highly efficient with score 0.89 and AB Bank was found lowest
efficient with score 0,35 according to the sample data.
Introduction
Bank efficiency studies are of crucial importance for
operational and academic proposes (Berger & Humphrey,
1997). So far, there is quite a fair amount of research that
studied banking efficiency in less developed countries, for
example Saudi (Al-Faraj, Alidi & Bu-Bshait, 1993),
Bangladesh (Sarker, 1999; Raihan, 1998; Hasan & Kabir
1999; Choudhury, 2000; Choudhury & Raihan, 2002;
Rahman, 2003; Hasan & Baten, 2005; Nadim, Shubhankar
& Haque, 2007), Kuwait (Limam, 2002), Turkey (Isik &
Hassan, 2002a; 2002b), Jordan (Isik & Hassan, 2003),
Bahrain (Hassan, Samad & Islam, 2003), Malaysia (Sufian
& Ibrahim, 2005); Pakistan (Limi, 2004), and U.A.E. (Rao,
2005).
Profit efficiency indicates how well a bank is predicted to
perform in terms of profit relative to other banks in the same
period for producing the same set of outputs. Despite the
wide agreement on the relevance of profit efficiency
analysis, the technical difficulties with the measurement and
decomposition of profit inefficiency were the main reasons
for the small number of empirical studies on banking profit
efficiency. Both parametric and non-parametric techniques
have been employed to compute efficiency scores (Berger &
Humphrey, 1997; Manthos & Fotios, 2008). Nevertheless,
the majority of these studies limit their efficiency analysis to
the cost side (e.g. Berger, Hunter & Timme, 1993; Resti,
1997), recent studies have given more attention to profit
efficiency. Indeed, among the 130 studies surveyed by
Berger and Humphrey (1997), only fourteen of those studies
employ a profit efficiency perspective. Some studies (e.g.,
Guevara & Maudos, 2002) provide banking profit efficiency
scores for several European countries, including Portugal.
Studies that applied the profit efficiency found some
evidence of improved profit efficiency. (see Berger &
Humphrey 1992; Berger, Hancock, & Humphrey 1993;
Kaparakis, Miller & Noulas, 1994; Kwan & Eisenbeis,
1996; Berger & Mester, 1997; Bikker, 2001; Oludele et al.,
2010; Tahir, AbuBaka & Haron, 2010). The majority of
studies investigating banking profit efficiency adopt a
parametric approach following the prominent works of
Berger and Mester (1997), DeYoung and Nolle (1996) and
DeYoung and Hasan (1998). The few available studies that
estimate profit frontier functions report efficiency levels that
are much lower than cost efficiency levels, implying that the
most important inefficiencies are on the revenue side
(Maudos et al., 2002). Maudos and Pastor (2003), and Joana
and Elvira (2007) studied an alternative profit efficiency
scores with a non-parametric approach.
To our knowledge, there is no study that has focused
exclusively on the profit efficiency of Bangladesh banking
sector using stochastic frontier analysis. Therefore this study
intends to reveal the overall performance of commercial
banks with loan default and measuring bank efficiency in
Bangladesh in the context to both productivity and
profitability. The present paper utilize the concept of
alternative profit efficiency and apply Battesse and Coelli
50 S.Afr.J.Bus.Manage.2011,42(3)
(1995) model, which is assumed to behave in a manner
consistent with the stochastic frontier concept and it is used
to examine the profit efficiency level of banks in
Bangladesh. The main focus of our study is to measure the
bank profit efficiency in accordance with NBs (Nationalized
Commercial Banks), ISs (Islamic Banks), FBs (Foreign
Banks) and PBs (Private Banks) in Bangladesh. To
determine the important factors causing profit efficiency
differential on banking industry in Bangladesh is also of our
interest.
Background of Bangladesh banking industry and its importance
The banking system of Bangladesh consists of four
nationalized commercial Banks, around forty private
commercial banks, nine foreign multinational banks and
some specialized banks. Grameen Bank is a specialized
micro-finance institution, which revolutionized the concept
of micro-credit and contributed greatly towards poverty
reduction and the empowerment of women in Bangladesh.
Banks are the main vehicles for mobilizing invisible funds
and channeling those funds to faster the growth of the
productive sectors of the economy. Question arises how
successfully the nationalized private commercial banks are
serving the country, how far they have achieved their
desired goals? The nationalized commercial banks are
overcome with the vicious problem of corruption,
inefficiency, loan default etc. although the private
commercial banks are efficient in their commercial activities
and solving the problem of loan default.
The Bangladesh banking sector relative to the size of its
economy is comparatively larger than many economies of
similar level of development and per capita income. Private
Banks are the highest growth sector due to the dismal
performances of national/government banks. Foreign Banks
are also the growth sector due to the performances of
national commercial banks. They tend to offer services
providing disbursed loan and defaulted loan as well as are
playing a pioneer role in introducing modern financial
products and services. Out of the specialized banks, two
(Bangladesh Krishi Bank and Rajshahi Krishi Unnayan
Bank) were created to meet the credit needs of the
agricultural sector while the other two (Bangladesh Shilpa
Bank (BSB) and Bangladesh Shilpa Rin Sangtha (BSRS))
are for extending term loans to the industrial sector. The
total size of the banking sector at 26.54% of GDP dominates
the financial system, which is proportionately large for a
country with a per capita income of only about US$540. The
non-bank financial sector, including capital market
institutions is only 3.22% of GDP, which is much smaller
than the banking sector. Access to banking services for the
population has improved during the last three decades.
While population per branch was 57,700 in 1972, it was
19,800 in 1991. In 2001 it again rose to 21,300, due to
winding up of a number of branches and growth in
population. Compared to India’s 15,000 persons per branch
in 2000, this indicates that the banking system in
Bangladesh is a significant problem.
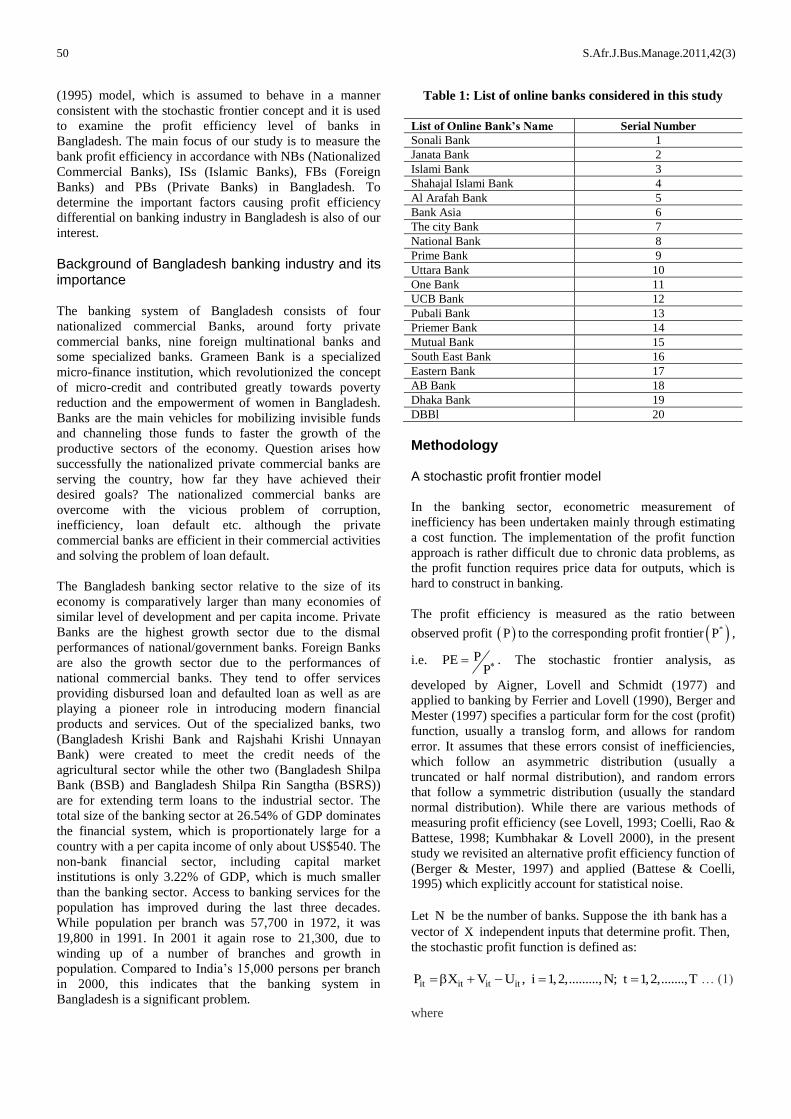
Table 1: List of online banks considered in this study
List of Online Bank’s Name Serial Number
Sonali Bank 1
Janata Bank 2
Islami Bank 3
Shahajal Islami Bank 4
Al Arafah Bank 5
Bank Asia 6
The city Bank 7
National Bank 8
Prime Bank 9
Uttara Bank 10
One Bank 11
UCB Bank 12
Pubali Bank 13
Priemer Bank 14
Mutual Bank 15
South East Bank 16
Eastern Bank 17
AB Bank 18
Dhaka Bank 19
DBBl 20
Methodology
A stochastic profit frontier model
In the banking sector, econometric measurement of
inefficiency has been undertaken mainly through estimating
a cost function. The implementation of the profit function
approach is rather difficult due to chronic data problems, as
the profit function requires price data for outputs, which is
hard to construct in banking.
The profit efficiency is measured as the ratio between
observed profit P to the corresponding profit frontier *P ,
i.e. PPE .P The stochastic frontier analysis, as
developed by Aigner, Lovell and Schmidt (1977) and
applied to banking by Ferrier and Lovell (1990), Berger and
Mester (1997) specifies a particular form for the cost (profit)
function, usually a translog form, and allows for random
error. It assumes that these errors consist of inefficiencies,
which follow an asymmetric distribution (usually a
truncated or half normal distribution), and random errors
that follow a symmetric distribution (usually the standard
normal distribution). While there are various methods of
measuring profit efficiency (see Lovell, 1993; Coelli, Rao &
Battese, 1998; Kumbhakar & Lovell 2000), in the present
study we revisited an alternative profit efficiency function of
(Berger & Mester, 1997) and applied (Battese & Coelli,
1995) which explicitly account for statistical noise.
Let N be the number of banks. Suppose the ith bank has a
vector of X independent inputs that determine profit. Then,
the stochastic profit function is defined as:
it it it itP X V U , i 1,2,........., N; t 1,2,.......,T … (1)
where
S.Afr.J.Bus.Manage.2011,42(3) 51
itP is the logarithm of profit of the ith
bank in tth
period; itX
is a vector of input quantities; i ’s are unknown parameters
to be estimated; itV ’s corresponds to the random
fluctuations, and is assumed to follow a symmetric normal
distribution around the frontier i.e., 2
vN(0, ) and
independent of itU ; for profit function, itU 0 (0 for
highest profit) accounts for bank’s inefficiency and is
assumed here to follow a truncated normal distribution i.e.,
2uN , ; where
it itU Z ; where; itZ is a 1 p
vector of variables which may influence the inefficiency of
bank industry and is a p 1 vector of parameters to be
estimated. The parameterization from Battese and Corra
(1977) are used replacing 2
u and 2v with 2 2 2
v u .
The inefficiency effect itU in the stochastic frontier model is
specified as follows:
it it itU Z W … (2)
where,
the random variable, itW follows truncated normal
distribution with mean zero and variance 2 , such that the
point of truncation is itZ . Parameters of the stochastic
frontier given by equation (1) and inefficiency model given
by equation (2) are simultaneously estimated by using
maximum likelihood estimation; the methodology was
advanced by Battese and Coelli (1993; 1995), and the
software, Front41, was produced by Coelli (1996). After
obtaining the estimates of itU the profit efficiency of i-th
bank industry at t-th time period is given by:
it it it itPPE exp U exp Z W
P … (3)
An empirical stochastic frontier model of profit inefficiency
We used an alternative profit function specification, where
the dependent variable is given by ln P indicates the value
of profit P over all banks in the sample, and is added to
every firm’s dependent variable in the profit function. This
transformation allows us to take the natural log of profits,
given that profits can obtain negative values.
The functional form of the profit Translog stochastic frontier
production model is defined as:
it 0 1 1it 2 2it 3 3it
2 2 211 1it 22 2it 33 3it
12 1it 2it 13 1it 3it
23 2it 3it it it
ln(P ) ln X ln X ln X
1 ln X ln X ln X2
ln X *ln X ln X *ln X
ln X *ln X V U
…. (4)
where
the subscripts i and t represent the i-th bank industry and the
t-th year of observation, respectively;
i 1, 2,...,20 ; t 1, 2,...,7 ;
itP denotes the profit of the ith bank industry in the t-th
period in values (taka);
1itX denotes prices of physical capital of i-th bank industry
in the t-th period;
2itX represents materials prices of i-th bank industry in the
t-th period;
3itX represents prices of labor of i-th bank industry in the t-
th period;
“ln” refers to the natural logarithm.
Further, the bank industry specific inefficiency is considered
as a function of some explanatory variables and the
inefficiency effects model is defined as:
it 0 1 1 2 2 3 3 4 5
6 7 it
U Z Z Z NB ISB
FB PB W
… (5)
where
0 is the intercept term and j j 1, 2, 3, 4, 5, 6,7 is
the parameter for the j-th explanatory variable, 1Z =Time,
2Z =Total Assets, 3Z = Herfindahl-Hirschman Index, NB is
the dummy variable for Nationalized Commercial Banks:
NB=1 if an observation involves a Nationalized Commercial
Bank, zero otherwise; ISB is the dummy variable for Islamic
banks: ISB=1 if an observation involves an Islamic bank,
zero otherwise; FB is dummy variable for Foreign Banks:
FB=1 if an observation involves a Foreign Bank, zero
otherwise; PB is dummy variable for Private Banks: PB=1 if
an observation involves a Private Bank, zero otherwise;
Measurement of variables
One of the crucial debated issues in the banking literature is
output measurement. Under production approach output is
measured by the number and type of transactions or
accounts and inputs used are only physical units such as
labor and capital, since, only physical inputs are needed to
provide financial services. Under intermediation approach,
financial institutions are thought of as primarily
intermediating funds between savers and investors. Under
this approach, the inputs of the bank are essentially financial
capital, and outputs are measured by the volume of loans
and investments outstanding. The present study adopts
production approach to specify outputs and inputs of
commercial banks. All nominal values are converted to real
by deflating with GDP deflator and all values are in their
natural logarithms.
52 S.Afr.J.Bus.Manage.2011,42(3)
Data set
We have used data for the period of 2001-2007 from 20
commercial banks of Bangladesh. Banks are grouped into
four categories (i) National Banks (NBs), (ii) Islamic Banks
(ISBs), (iii) Foreign Banks (FBs), (iv) Private Banks (PBs).
Most of the data are collected from the annual reports of the
specific banks of Bangladesh and rest of them are collected
from annual accounts of Scheduled Commercial Banks
published by Bangladesh Bank, the central bank of
Bangladesh.
Dependent variable
Profit (Y): Banks and other financial institutions are simply
businesses organized to maximize the profitability and that
is why the performance of a commercial bank is measured
by its profit efficiency. In this study we have used profit is
equal to the pre-tax profit for all commercial banks. The
dependent variable is now minln P | P | 1 , where,
min| P | is the absolute value of the minimum value of profits
in the appropriate sample. In practice, the constant term min| P | 1 is added to every bank's profit so that the natural
log is taken of a positive number. This adjustment is
necessary since a number of banks in the sample exhibit
negative profits in the sample period. The dependent
variable is ln(l)=0 for the bank with the lowest value of P .
The nominal profit values are deflated by respective
consumer price index.
Independent variables
( 1X ): the price of physical capital which is equal to
depreciation over fixed capital and investment in leasing. It
is the input variable representing the fixed assets of a bank
in a year which also adds premises, furniture and fixture and
the figures are deflated by capital price index.
( 2X ): For the banking sector, price of material has been
used as the sum of expenditure on printing and stationeries
and postage, telegrams and telephones etc. Material prices
are deflated by non-food price index.
( 3X ): the price of labor and is calculated as total salaries
and staff expenses over full time number of staff.
Time ( 4X ): To find the productive efficiency of a bank
over time we have used time as the input variable. In this
study we have collected data of seven years from 2001 to
2007 and used 1 for year 2001, 2 for 2002 and so on.
Explanatory variables
( 1Z ): Total asset of bank used as the influencing variable
and is the sum of all assets and their book value.
( 2Z ): The Herfindahl-Hirschman index takes into accounts
both the relative size and number of banks in the banking
sector. Mathematically, HHI is described as follow:
N2
i
i 1
HHI S
where N is the number of banks and iS
is share of the ith
bank. HHI is known as measure of
competition which is measured as the sum of squared of the
output share of each bank in the output of considered total
banks in Bangladesh.
NB, ISB, FB, and PB are bank group specific dummies for
National Bank, Islamic Bank, Foreign Bank, and Private
Bank respectively. The dummy variables can take either 1 or
0 depending on data availability or not respectively.
Likelihood ratio tests and hypothesis
The following hypotheses requires testing with the
generalized likelihood ratio test statistic is defined by
0 1
0 1
2 ln L H / L H
2 ln L H ln L H
… (7)
where
0L H and 1L H are the value of the likelihood function
for the profit frontier model under the null and alternative
hypothesis. Under the null hypothesis , this test statistic is
assumed to be asymptotically distributed as mixture of chi-
square distribution with degree of freedom equal to the
number of restrictions involved. The restrictions imposed by
the null hypothesis are rejected when exceeds the critical
value (Taymaz & Saatci, 1997). These are obtained by using
the values of the log–likelihood functions for the banking
industries and the stochastic frontier production function.
The following null hypotheses will be tested:
0 ijH : 0,
the null hypothesis that identifies an
appropriate functional form either the restrictive Cobb-
Douglas or Translog production function. It specifies that
the second-order coefficients of the stochastic frontier
production function are simultaneously zero.
0H : 0, the null hypothesis specifies that the technical
inefficiency effects in banks are zero. This is rejected in
favor of the presence of inefficiency effects. Here
is the
variance ratio, explaining the total variation in output from
the frontier level of output attributed to technical efficiency
and defined by 2 2 2u u v
. This is done with the
calculation of the maximum likelihood estimates for the
parameters of the stochastic frontier models by using the
computer program frontier version 4.1 developed by Coelli
(1996). If the null hypothesis is accepted this would indicate
that 2u
is zero and hence that the itU
term should be
removed from the model, leaving a specification with
parameters that can be consistently estimated using ordinary
least square (OLS).
S.Afr.J.Bus.Manage.2011,42(3) 53
Further 0H : 0, the null hypothesis that the technical
inefficiency effects are time invariant i.e., there is no change
in the technical inefficiency effects over time. If the null
hypothesis is true, the generalized likelihood ratio statistic
is asymptotically distributed as a chi-square (or mixed
chi-square) random variable.
Results and discussion
In this section Ordinary Least Square Estimates (OLS) and
Maximum Likelihood Estimates (MLE) of the parameters
reported in the context of bank specific profit efficiency of
Bangladesh followed by Translog stochastic frontier model.
The ordinary least square estimates of parameters were
obtained by grid search in the first step and then these
estimates were used to estimate the maximum likelihood
estimates of the parameters treated as the profit frontier
estimates of Translog stochastic frontier production model.
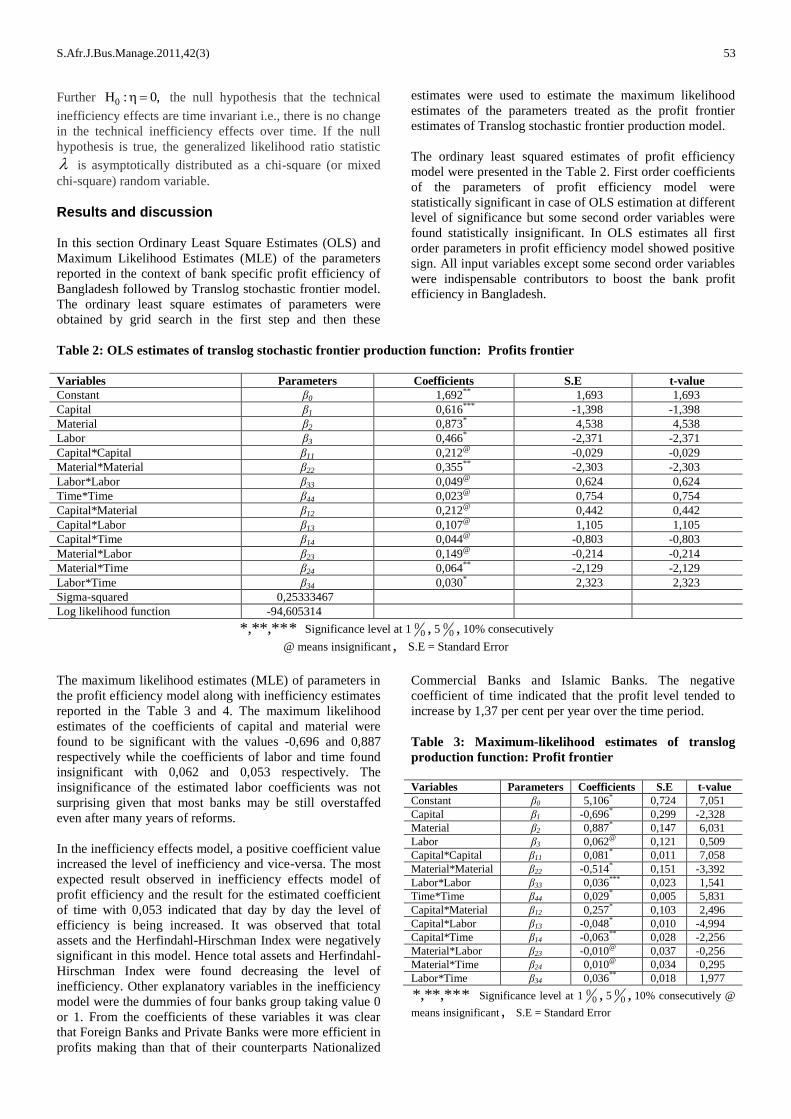
The ordinary least squared estimates of profit efficiency
model were presented in the Table 2. First order coefficients
of the parameters of profit efficiency model were
statistically significant in case of OLS estimation at different
level of significance but some second order variables were
found statistically insignificant. In OLS estimates all first
order parameters in profit efficiency model showed positive
sign. All input variables except some second order variables
were indispensable contributors to boost the bank profit
efficiency in Bangladesh.
Table 2: OLS estimates of translog stochastic frontier production function: Profits frontier
Variables Parameters Coefficients S.E t-value
Constant β0 1,692** 1,693 1,693
Capital β1 0,616*** -1,398 -1,398
Material β2 0,873* 4,538 4,538
Labor β3 0,466* -2,371 -2,371
Capital*Capital β11 0,212@ -0,029 -0,029
Material*Material β22 0,355** -2,303 -2,303
Labor*Labor β33 0,049@ 0,624 0,624
Time*Time β44 0,023@ 0,754 0,754
Capital*Material β12 0,212@ 0,442 0,442
Capital*Labor β13 0,107@ 1,105 1,105
Capital*Time β14 0,044@ -0,803 -0,803
Material*Labor β23 0,149@ -0,214 -0,214
Material*Time β24 0,064** -2,129 -2,129
Labor*Time β34 0,030* 2,323 2,323
Sigma-squared 0,25333467
Log likelihood function -94,605314
***,**,* Significance level at 1 ,00 5 ,0
0 10% consecutively
@ means insignificant , S.E = Standard Error
The maximum likelihood estimates (MLE) of parameters in
the profit efficiency model along with inefficiency estimates
reported in the Table 3 and 4. The maximum likelihood
estimates of the coefficients of capital and material were
found to be significant with the values -0,696 and 0,887
respectively while the coefficients of labor and time found
insignificant with 0,062 and 0,053 respectively. The
insignificance of the estimated labor coefficients was not
surprising given that most banks may be still overstaffed
even after many years of reforms.
In the inefficiency effects model, a positive coefficient value
increased the level of inefficiency and vice-versa. The most
expected result observed in inefficiency effects model of
profit efficiency and the result for the estimated coefficient
of time with 0,053 indicated that day by day the level of
efficiency is being increased. It was observed that total
assets and the Herfindahl-Hirschman Index were negatively
significant in this model. Hence total assets and Herfindahl-
Hirschman Index were found decreasing the level of
inefficiency. Other explanatory variables in the inefficiency
model were the dummies of four banks group taking value 0
or 1. From the coefficients of these variables it was clear
that Foreign Banks and Private Banks were more efficient in
profits making than that of their counterparts Nationalized
Commercial Banks and Islamic Banks. The negative
coefficient of time indicated that the profit level tended to
increase by 1,37 per cent per year over the time period.
Table 3: Maximum-likelihood estimates of translog
production function: Profit frontier
Variables Parameters Coefficients S.E t-value
Constant β0 5,106*
0,724 7,051
Capital β1 -0,696*
0,299 -2,328
Material β2 0,887*
0,147 6,031
Labor β3 0,062@
0,121 0,509
Capital*Capital β11 0,081*
0,011 7,058
Material*Material β22 -0,514*
0,151 -3,392
Labor*Labor β33 0,036***
0,023 1,541
Time*Time β44 0,029*
0,005 5,831
Capital*Material β12 0,257*
0,103 2,496
Capital*Labor β13 -0,048*
0,010 -4,994
Capital*Time β14 -0,063**
0,028 -2,256
Material*Labor β23 -0,010@
0,037 -0,256
Material*Time β24 0,010@
0,034 0,295
Labor*Time β34 0,036**
0,018 1,977
***,**,* Significance level at 1 ,00 5 ,0
0 10% consecutively @
means insignificant , S.E = Standard Error
54 S.Afr.J.Bus.Manage.2011,42(3)
Table 4: Maximum likelihood estimates of the
parameters of inefficiency effects model
Variables Parameters Coefficients S.E t-value
Constant 0 2,493
* 0,967 2,578
Time 1
0,053@
0,084 0,633
Total
Assets 2 -0,192
*** 0,120 -1,604
Herfindahl-
Hirschman
Index
3 -0,058
@ 0,213 -0,272
NB
Dummy 4 1,404
** 0,788 1,782
ISB
Dummy 5 1,687
* 0,509 3,311
FB Dummy 6 -0,440
@ 0,829 -0,530
PB Dummy 7 -0,158
@ 0,513 -0,308
Sigma-
squared
0,860*
0,103 8,312
Gamma 0,99999*
0,00021 28454,734
***,**,* Significance level at 1 ,00 5 ,0
0 10% consecutively
@ means insignificant , S.E = Standard Error
The estimated results of the profit efficiency model were
reported in the Figures 1, 2 and 3 according to group wise,
year wise and bank wise respectively. It was observed that
on an average, Bangladeshi banks were 66,4 per cent
efficient in profits making services relative to the best
performing bank during the study period. In case of profit
efficiency, foreign banks were most efficient (68,8 per cent)
along with private banks (68,7 per cent). These findings are
in line with the argument that foreign banks are superior as
they normally have advanced technology and skills;
sophisticated services and broader international networks
(Levine, 1996; Unite & Sullivan, 2003). National banks and
Private banks were relatively less efficient than foreign
banks, these results contradicted with the finding of (Iza,
Nor & Mazlina, 2009) but supported with the result of
(Tahir et al., 2010). From this study it was revealed that
Government owned banks were least efficient that increase
profits level with 58,4 per cent. However, the implication of
the result of (Raulin, 2008) is that foreign banks are not
always more efficient than domestic banks in developing
countries, and even in a country with low income level.
During the period 2001 to 2004, profit efficiency of
nationalized commercial banks were almost stable and it
was around 45,8 per cent but in the following year
efficiency scores increased dramatically and it became
almost doubled with 87,5 per cent. The findings of this
study suggest that foreign banks are more profit efficient
than domestic banks and it was supported by (Kiyota, 2009).
Again the efficiency of NBs decreased in the years 2006 and
2007. On the other hand private banks were very consistent
over time. These results were supported by Mahesh and
Meenakshi (2006).
Table 5: Yea-wise average profit efficiency of banks in
Bangladesh
Year Mean
2001 0,584
2002 0,586
2003 0,609
2004 0,661
2005 0,765
2006 0,705
2007 0,738
Mean 0,664
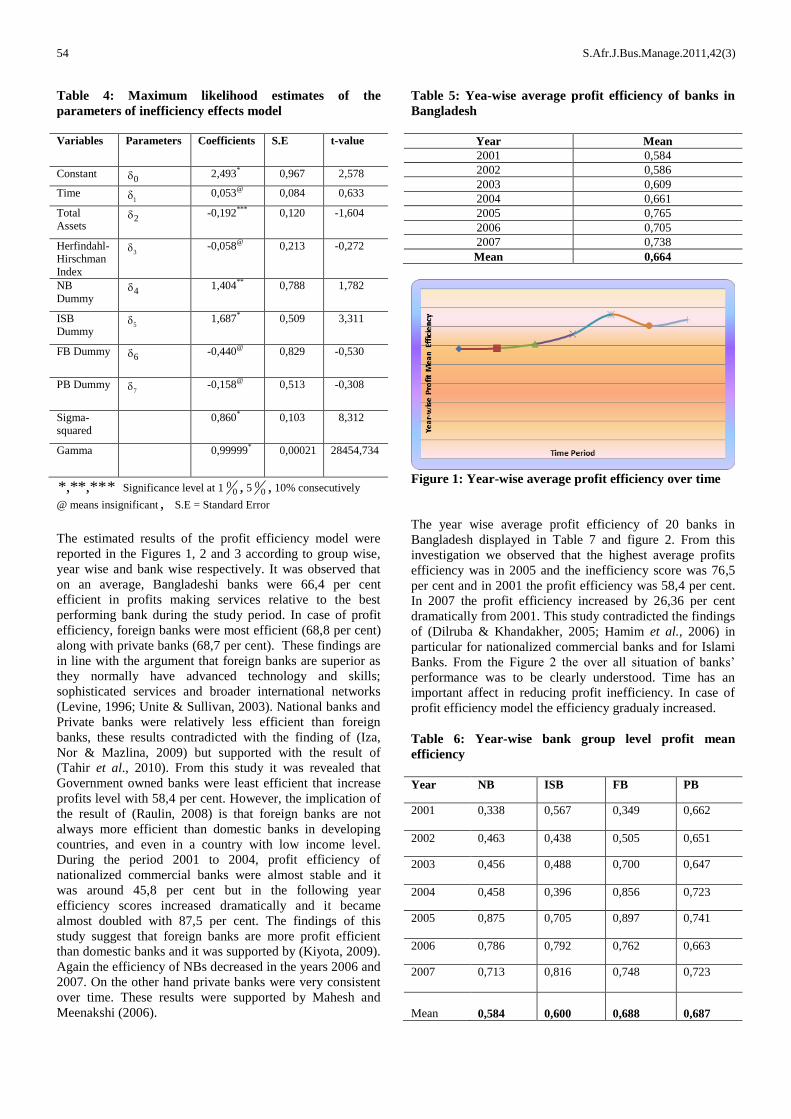
Figure 1: Year-wise average profit efficiency over time
The year wise average profit efficiency of 20 banks in
Bangladesh displayed in Table 7 and figure 2. From this
investigation we observed that the highest average profits
efficiency was in 2005 and the inefficiency score was 76,5
per cent and in 2001 the profit efficiency was 58,4 per cent.
In 2007 the profit efficiency increased by 26,36 per cent
dramatically from 2001. This study contradicted the findings
of (Dilruba & Khandakher, 2005; Hamim et al., 2006) in
particular for nationalized commercial banks and for Islami
Banks. From the Figure 2 the over all situation of banks’
performance was to be clearly understood. Time has an
important affect in reducing profit inefficiency. In case of
profit efficiency model the efficiency gradualy increased.
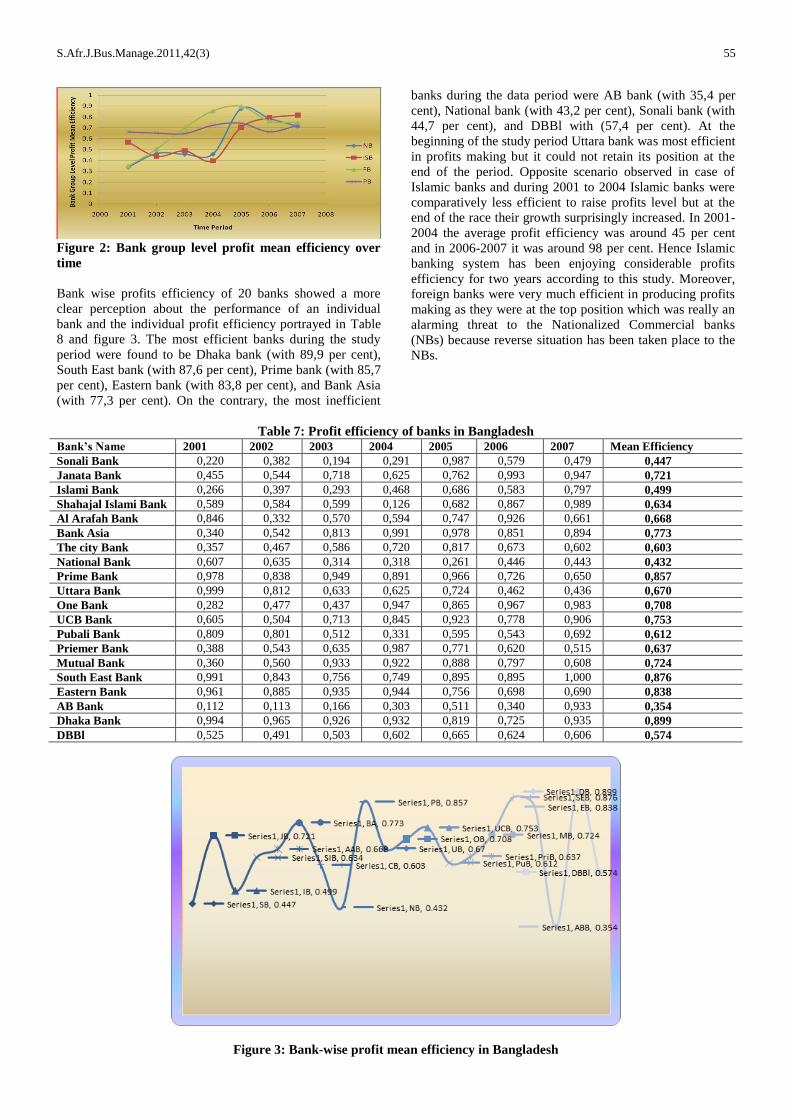
Table 6: Year-wise bank group level profit mean
efficiency
Year NB ISB FB PB
2001 0,338 0,567 0,349 0,662
2002 0,463 0,438 0,505 0,651
2003 0,456 0,488 0,700 0,647
2004 0,458 0,396 0,856 0,723
2005 0,875 0,705 0,897 0,741
2006 0,786 0,792 0,762 0,663
2007 0,713 0,816 0,748 0,723
Mean 0,584 0,600 0,688 0,687
S.Afr.J.Bus.Manage.2011,42(3) 55
Figure 2: Bank group level profit mean efficiency over
time
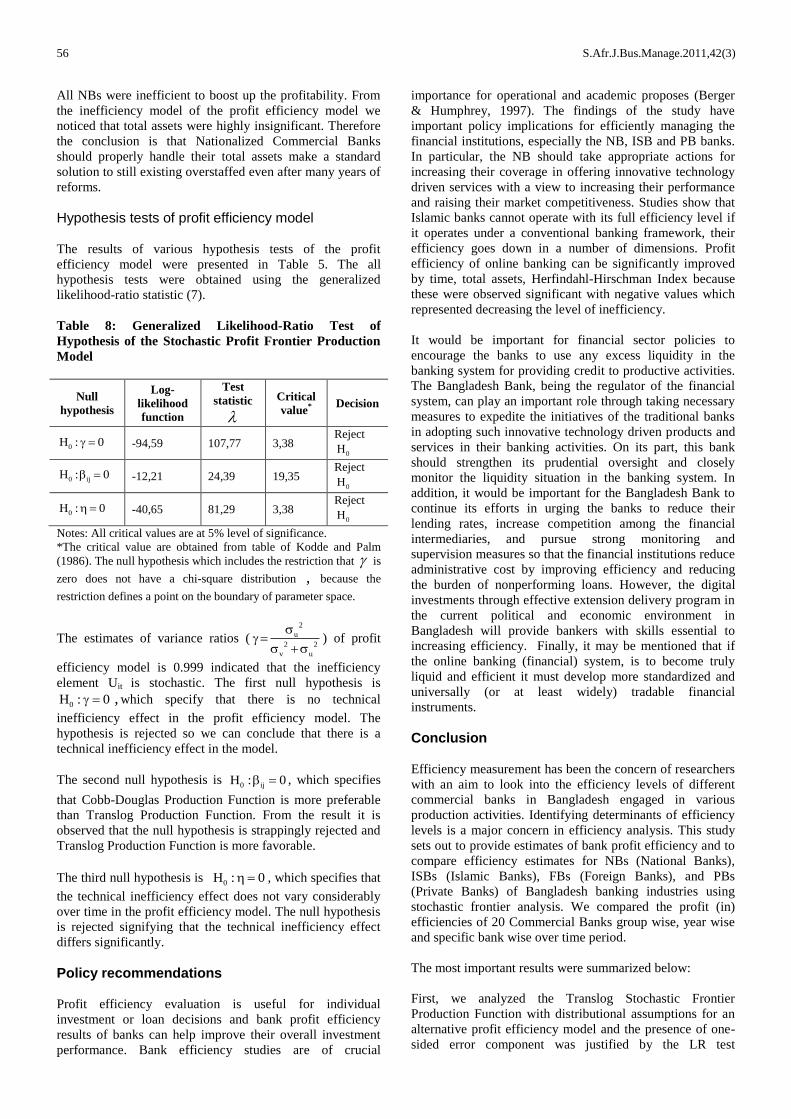
Bank wise profits efficiency of 20 banks showed a more
clear perception about the performance of an individual
bank and the individual profit efficiency portrayed in Table
8 and figure 3. The most efficient banks during the study
period were found to be Dhaka bank (with 89,9 per cent),
South East bank (with 87,6 per cent), Prime bank (with 85,7
per cent), Eastern bank (with 83,8 per cent), and Bank Asia
(with 77,3 per cent). On the contrary, the most inefficient
banks during the data period were AB bank (with 35,4 per
cent), National bank (with 43,2 per cent), Sonali bank (with
44,7 per cent), and DBBl with (57,4 per cent). At the
beginning of the study period Uttara bank was most efficient
in profits making but it could not retain its position at the
end of the period. Opposite scenario observed in case of
Islamic banks and during 2001 to 2004 Islamic banks were
comparatively less efficient to raise profits level but at the
end of the race their growth surprisingly increased. In 2001-
2004 the average profit efficiency was around 45 per cent
and in 2006-2007 it was around 98 per cent. Hence Islamic
banking system has been enjoying considerable profits
efficiency for two years according to this study. Moreover,
foreign banks were very much efficient in producing profits
making as they were at the top position which was really an
alarming threat to the Nationalized Commercial banks
(NBs) because reverse situation has been taken place to the
NBs.
Table 7: Profit efficiency of banks in Bangladesh
Bank’s Name 2001 2002 2003 2004 2005 2006 2007 Mean Efficiency
Sonali Bank 0,220 0,382 0,194 0,291 0,987 0,579 0,479 0,447
Janata Bank 0,455 0,544 0,718 0,625 0,762 0,993 0,947 0,721
Islami Bank 0,266 0,397 0,293 0,468 0,686 0,583 0,797 0,499
Shahajal Islami Bank 0,589 0,584 0,599 0,126 0,682 0,867 0,989 0,634
Al Arafah Bank 0,846 0,332 0,570 0,594 0,747 0,926 0,661 0,668
Bank Asia 0,340 0,542 0,813 0,991 0,978 0,851 0,894 0,773
The city Bank 0,357 0,467 0,586 0,720 0,817 0,673 0,602 0,603
National Bank 0,607 0,635 0,314 0,318 0,261 0,446 0,443 0,432
Prime Bank 0,978 0,838 0,949 0,891 0,966 0,726 0,650 0,857
Uttara Bank 0,999 0,812 0,633 0,625 0,724 0,462 0,436 0,670
One Bank 0,282 0,477 0,437 0,947 0,865 0,967 0,983 0,708
UCB Bank 0,605 0,504 0,713 0,845 0,923 0,778 0,906 0,753
Pubali Bank 0,809 0,801 0,512 0,331 0,595 0,543 0,692 0,612
Priemer Bank 0,388 0,543 0,635 0,987 0,771 0,620 0,515 0,637
Mutual Bank 0,360 0,560 0,933 0,922 0,888 0,797 0,608 0,724
South East Bank 0,991 0,843 0,756 0,749 0,895 0,895 1,000 0,876
Eastern Bank 0,961 0,885 0,935 0,944 0,756 0,698 0,690 0,838
AB Bank 0,112 0,113 0,166 0,303 0,511 0,340 0,933 0,354
Dhaka Bank 0,994 0,965 0,926 0,932 0,819 0,725 0,935 0,899
DBBl 0,525 0,491 0,503 0,602 0,665 0,624 0,606 0,574
Figure 3: Bank-wise profit mean efficiency in Bangladesh
56 S.Afr.J.Bus.Manage.2011,42(3)
All NBs were inefficient to boost up the profitability. From
the inefficiency model of the profit efficiency model we
noticed that total assets were highly insignificant. Therefore
the conclusion is that Nationalized Commercial Banks
should properly handle their total assets make a standard
solution to still existing overstaffed even after many years of
reforms.
Hypothesis tests of profit efficiency model
The results of various hypothesis tests of the profit
efficiency model were presented in Table 5. The all
hypothesis tests were obtained using the generalized
likelihood-ratio statistic (7).
Table 8: Generalized Likelihood-Ratio Test of
Hypothesis of the Stochastic Profit Frontier Production
Model
Null
hypothesis
Log-
likelihood
function
Test
statistic
Critical
value* Decision
0H : 0 -94,59 107,77 3,38 Reject
0H
0 ijH : 0 -12,21 24,39 19,35 Reject
0H
0H : 0 -40,65 81,29 3,38 Reject
0H
Notes: All critical values are at 5% level of significance.
*The critical value are obtained from table of Kodde and Palm
(1986). The null hypothesis which includes the restriction that is
zero does not have a chi-square distribution , because the
restriction defines a point on the boundary of parameter space.
The estimates of variance ratios (2
u
2 2
v u
) of profit
efficiency model is 0.999 indicated that the inefficiency
element Uit is stochastic. The first null hypothesis is
0H : 0 , which specify that there is no technical
inefficiency effect in the profit efficiency model. The
hypothesis is rejected so we can conclude that there is a
technical inefficiency effect in the model.
The second null hypothesis is 0 ijH : 0 , which specifies
that Cobb-Douglas Production Function is more preferable
than Translog Production Function. From the result it is
observed that the null hypothesis is strappingly rejected and
Translog Production Function is more favorable.
The third null hypothesis is 0H : 0 , which specifies that
the technical inefficiency effect does not vary considerably
over time in the profit efficiency model. The null hypothesis
is rejected signifying that the technical inefficiency effect
differs significantly.
Policy recommendations
Profit efficiency evaluation is useful for individual
investment or loan decisions and bank profit efficiency
results of banks can help improve their overall investment
performance. Bank efficiency studies are of crucial
importance for operational and academic proposes (Berger
& Humphrey, 1997). The findings of the study have
important policy implications for efficiently managing the
financial institutions, especially the NB, ISB and PB banks.
In particular, the NB should take appropriate actions for
increasing their coverage in offering innovative technology
driven services with a view to increasing their performance
and raising their market competitiveness. Studies show that
Islamic banks cannot operate with its full efficiency level if
it operates under a conventional banking framework, their
efficiency goes down in a number of dimensions. Profit
efficiency of online banking can be significantly improved
by time, total assets, Herfindahl-Hirschman Index because
these were observed significant with negative values which
represented decreasing the level of inefficiency.
It would be important for financial sector policies to
encourage the banks to use any excess liquidity in the
banking system for providing credit to productive activities.
The Bangladesh Bank, being the regulator of the financial
system, can play an important role through taking necessary
measures to expedite the initiatives of the traditional banks
in adopting such innovative technology driven products and
services in their banking activities. On its part, this bank
should strengthen its prudential oversight and closely
monitor the liquidity situation in the banking system. In
addition, it would be important for the Bangladesh Bank to
continue its efforts in urging the banks to reduce their
lending rates, increase competition among the financial
intermediaries, and pursue strong monitoring and
supervision measures so that the financial institutions reduce
administrative cost by improving efficiency and reducing
the burden of nonperforming loans. However, the digital
investments through effective extension delivery program in
the current political and economic environment in
Bangladesh will provide bankers with skills essential to
increasing efficiency. Finally, it may be mentioned that if
the online banking (financial) system, is to become truly
liquid and efficient it must develop more standardized and
universally (or at least widely) tradable financial
instruments.
Conclusion
Efficiency measurement has been the concern of researchers
with an aim to look into the efficiency levels of different
commercial banks in Bangladesh engaged in various
production activities. Identifying determinants of efficiency
levels is a major concern in efficiency analysis. This study
sets out to provide estimates of bank profit efficiency and to
compare efficiency estimates for NBs (National Banks),
ISBs (Islamic Banks), FBs (Foreign Banks), and PBs
(Private Banks) of Bangladesh banking industries using
stochastic frontier analysis. We compared the profit (in)
efficiencies of 20 Commercial Banks group wise, year wise
and specific bank wise over time period.
The most important results were summarized below:
First, we analyzed the Translog Stochastic Frontier
Production Function with distributional assumptions for an
alternative profit efficiency model and the presence of one-
sided error component was justified by the LR test
S.Afr.J.Bus.Manage.2011,42(3) 57
individually, which was highly significant for this model.
We found that the profit inefficiency has declined over the
reference period and Translog Production Function is more
preferable than Cobb-Douglas Production Function.
Second, the most expected result observed in inefficiency
model of profit function and the estimated coefficient of
time with -0.370 indicated that day by day the level of
efficiency was being increased. From the estimated
coefficients of inefficiency model it was seen that time, total
assets, Herfindahl-Hirschman Index were found significant
with negative values represented decreasing the level of
inefficiency.
Third, the estimated year wise average efficiencies of the
sample banks from the profit model was 0,664 while group
wise average technical efficiencies was 0,639. In case of
profit efficiency, foreign banks were most efficient (68,8 per
cent) along with private banks (68,7 per cent). From this
study it was revealed that Government owned banks were
least efficient that increase profit level with 58,4 per cent.
During the years 2001 to 2004 profits efficiency of
nationalized commercial banks were almost stable and it
was around 45,8 per cent but in the following year
efficiency scores increased dramatically and it became
doubled with 87,5 per cent. Again the efficiency of NBs
decreased in the years 2006 and 2007. On the other hand
private banks were very consistent in this regard. In terms of
profit model, Dhaka Bank is highly efficient with score 0.89
and AB Bank was lowest efficient with score 0.35 according
to the sample data. These findings have important policy
implications in improving profit efficiency among online
banks in Bangladesh.
Acknowledgements:
The authors wish to acknowledge the support provided by
Research University Grant Scheme, No.
1001/PJJAUH/811130, Universiti Sains Malaysia, Penang,
Malaysia for conducting this research.
References
Aigner, D., Lovell, C. & Schmidt, P. 1977. ‘Formulation
and estimation of stochastic frontier production function
models,’ Journal of Econometrics, 6: 21-37.
Al-Faraj, T.N., Alidi, A.S. & Bu-Bshait, K.A. 1993.
‘Evaluation of bank branches by means of data envelopment
analysis’, International Journal of Operation and
Production Management, 13(8): 45–52.
Battese, G.E. & Coelli, T.J. 1995. ‘A model for technical
inefficiency effects in a stochastic frontier production
function for panel data’, Empirical Economics, 20: 325-332.
Battese, G.E. & Coelli, T.J. 1993. ‘A stochastic production
function incorporating a model for technical inefficiency
effects’. Working paper in Econometrics and Applied
Statistics, Department of Econometrics, No.69. Armidale:
University of New England.
Battese, G.E., & Corra, G.S. 1977. ‘Estimation of a
production frontier model with application to the pastoral
zone of eastern Australia’, Australian Journal of
Agricultural Economics, 21: 169-179.
Berger, A.N., Hancock, D. & Humphrey, D.B. 1993.
‘Banking efficiency derived from the profit function’,
Journal of Banking and Finance, 17(2-3): 317-347.
Berger, A. & Humphrey, D. 1997. ‘Efficiency of financial
institutions: international survey and directions for future
research’, European Journal of Operation Research, 98:
175-212.
Berger, A. & Mester, L. 1997. ‘Inside the black box: what
explains differences in the efficiencies of financial
institutions?’, Journal of Banking and Finance, 21: 895-947.
Berger, A.N., Hunter, W.C. & Timme, S.G. 1993. ‘The
efficiency of financial institutions: Review and preview of
research, post, present and future’, Journal of Banking and
Finance, 17(2-3):221-249.
Berger, A.N. & Humphrey, D.B. 1992. ‘Measurement and
efficiency in banking, In Griliches, Z. (ed.). Output
measurement in the service sectors. Chicago: University of
Chicago Press, pp. 245–279.
Bikker, J. 2001. ‘Efficiency in the European banking
industry: An exploratory analysis to rank countries’, Cahiers
Economiques de Bruxelles, 172: 3-28.
Choudhury, T.A. & Raihan, A. 2000. ‘Structural Adjustment
Policy Review Initiative: Implications of Financial Sector
Reforms’, under Structural Adjustment Policy Review
Initiative [SAPRI] of the World Bank, GOB and the Civil
Society, May 25, 1-132, Dhaka, Bangladesh.
Choudhury, A. 2002. ‘Politics, society and financial sector
reform in Bangladesh, International Journal Social
Economics, 29(12): 963-988.
Coelli, T.J., Rao, D.S.P. & Battese, G.E. 1998. An
introduction to efficiency and productivity analysis. Boston:
Kluwer Academic Publishers.
Coelli, T.J. 1996. A guide to FRONTIER version 4.1: A
computer program for stochastic frontier production and
cost function estimation. Mimeo, Department of
Econometrics, University of New England, Armidale.
DeYoung, R. & Hasan, I. 1998. ‘The performance of De
Novo commercial banks: A profit efficiency approach’,
Journal of Banking and Finance, 22: 565-587.
DeYoung, R. & Nolle, D.E. 1996. ‘Foreign-owned banks in
the United States: Earning market share or buying it?’,
Journal of Money, Credit and Banking, 28: 622-636.
Dilruba, K. & Khandoker, SH. 2005. ‘X-efficiency analysis
of problem banks in Bangladesh, Pakistan Journal of Social
Science, 3(3): 521-525.
58 S.Afr.J.Bus.Manage.2011,42(3)
Ferrier, G. & Lovell, C.A.K. 1990. ‘Measuring cost
efficiency in banking: Econometric and linear programming
evidence’, Journal of Econometrics, 46, 229-245.
Guevara, J.F. & Maudos, J. 2002. ‘Inequalities in the
efficiency of the banking sectors of the European Union’,
Applied Economic Letters, 9: 541-544.
Hamim, S.A.M. Abdullah, N. & Al-Habshi, SM. 2006.
‘Efficiency of Islamic banking in Malaysia: A stochastic
frontier approach, Journal of Economic Cooperation, 27(2):
37-70.
Hassan, M.K. 1999. ‘Islamic banking in theory and practice:
the experience of Bangladesh, Managerial Finance, 5: 60-
113.
Hassan, M.K., Samad, M. & Islam, M.M. 2003. ‘The
performance evaluation of the Bahraini banking system’.
Working Paper University of New Orleans.
Hasan, S. & Baten, A. 2005. ‘Performance of nationalized
and private commercial banks in Bangladesh’, Journal of
Applied Science, 5: 1814-1818
Isik, I. & Hassan, M.K. 2002a. ‘Technical scale and
allocative efficiencies of Turkish banking industry’, Journal
of Banking and Finance, 26: 719-766.
Isik, I. & Hassan, M.K. 2002b. ‘Cost and profit efficiency of
the Turkish banking industry: An empirical investigation’,
The Financial Review, 37(2): 257-280.
Isik, I. & Hassan, M.K. 2003. ‘Efficiency, ownership and
market structure, corporate control and governance in the
Turkish banking industry’, Journal of Business Finance and
Accounting, 30(9/10): 1363-1421.
Iza, M.T., Nor Mazlina, A.B. & Haron, S. 2009. ‘Evaluating
efficiency of Malaysian banks using data envelopment
analysis’, International Journal of Business Management,
4(8): 96-106.
Joana, R. & Elvira, S. 2007. ‘A profit efficiency perspective
on the future strategic positioning of the Portuguese banks’,
Faculdade de Economia, Universidade do Porto.
[online]URL:
http://www.fep.up.pt /investigacao/cete/papers/dp0702.pdf.
Kaparakis, E.I., Miller, S.M. & Noulas, A.G. 1994. ‘Short-
run cost inefficiency of commercial banks: A flexible
stochastic frontier approach’, Journal of Money, Credit and
Banking, 26(4): 875-893.
Kiyota, H. 2009. ‘Efficiency of commercial banks in Sub-
Saharan Africa: A comparative analysis of domestic and
foreign banks’. Paper presented at the CSAE conference
2009 on Economic Development in Africa held at the
University of Oxford from 22nd
to 24th
March 2009.
Kumbhaker, S.C. & Lovell, C.A.K. 2000. Stochastic frontier
analysis. Cambridge: Cambridge University Press.
Kodde, D.A. & Palm, F.C. 1986. Wald criteria for jointly
testing equality and inequality restrictions, Econometrica,
54(5): 1234–1248.
Kwan, S.H. & Eisenbeis, R.A. 1996. ‘An analysis of
inefficiencies in banking: A stochastic cost frontier
approach’, Federal Reserve Bank of San Francisco
Economic Review, No. 2.
Levine, R. 1996. ‘Foreign banks, financial development and
economic growth’. In Berfied, C. (ed.). International
financial markets. Washington, DC: AEI Press.
Limam, I. 2002. Measuring technical efficiency of Kuwaiti
banks. Kuwait: Arab Planning Institute.
Limi, A. 2004. ‘Banking sector reforms in Pakistan:
Economies of scale and scope, and cost complementaries’,
Journal of Asian Economic Review, 15: 507-528.
Lovell, C.A.K. 1993. ‘Production frontiers and productive
efficiency’. In Fried, H.O., Lovell, C.A.K & Schmidt, S.S.
(eds.). The measurement of productive efficiency. New
York: Oxford University Press.
Mahesh, H.P. & Meenakshi, R. 2006. ‘Liberalization and
productive efficiency of Indian commercial banks: A
stochastic frontier analysis’. Manik Personal RePEc
Archive, Paper No. 827, posted. November 2007 / 01:19.
[online] URL: http://mpra.ub.uni-muenchen.de/827/ MPRA
07.
Delis, M.D. Koutsomanoli-Filippaki, A.S.C. &
Gerogiannaki, K. 2008. ‘Evaluating cost and profit
efficiency: a comparison of parametric and nonparametric
methodologies. [online]
http://mpra.ub.uni-muenchen.de/14039/ MPRA Paper No.
14039, posted 12. March 2009.
Manthos, D.D. Philip, M. & Fotios, P. 2008. ‘Regulations
and productivity growth in banking’, University of Bath
School of Management Working Paper Series 2008.06.
Maudos, J., Pastor, J., Perez, F. & Quesada, J. 2002. ‘Cost
and profit efficiency in European banks’, Journal of
International Finance Markets Institution and Money, 12:
33-58.
Maudos, J. & Pastor, J.M. 2003. ‘Cost and profit efficiency
in the Spanish banking sector (1985-1996): A non-
parametric approach’, Applied Financial Economics, 13: 1-
12.
Nadim, J., Shubhankar, S. & Haque, M.A.J. 2007.
‘Examination of profitability in the context of Bangladesh
banking industry’, ABAC Journal, 27(2): 36-46.
Oludele, A., Emilie, C. K., Mandisa, P. M. & Wolassa, L. K.
2010. ‘Estimating profit efficiency in the South African
mining sector using stochastic frontier approach’, Problems
and Perspectives in Management, 8(1): 136-142.
S.Afr.J.Bus.Manage.2011,42(3) 59
Raihan, A. 1998. ‘Status of banking technology in
Bangladesh: Problems and prospects’. Keynote paper
presented in the round table on Status of Information
Technology in Bangladesh held in BIBM, July 29, 1998.
Rahman, S. 2003. ‘Profit efficiency among Bangladeshi rice
farmers’, Food Policy, 28: 487-503.
Rao, A. 2005. ‘Cost frontier efficiency and risk-return
analysis in an emerging market’, International Review of
Financial Analysis, 14: 283-303.
Raulin, L.C. 2008. ‘Cost and profit efficiency of banks in
Haiti: Do domestic banks perform better than foreign banks?
Paper No 11953. [online]URL: http://mpra.ub.uni-
muenchen.de/11953/MPRA.
Resti, A. 1997. ‘Evaluating the cost efficiency of the Italian
banking system: What can be learned from the joint
application of parametric and non-parametric techniques’,
Journal of Banking and Finance, 21: 221-250.
Sarker, M.A. 1999. ‘Islamic banking in Bangladesh:
Performance, problems, and prospects’, International
Journal of Islamic Finance Service, 1(3): 15-35.
Sufian, F. & Ibrahim, S. 2005. ‘An analysis of the relevance
of off-balance sheet items in explaining productivity change
in post-merger bank performance: Evidence from Malaysia’,
Management Research News, 28: 74-92.
Tahir, I.M., AbuBaka, N.M. & Haron, S. 2010. ‘Cost and
profit efficiency of the Malaysian commercial banks: A
comparison between domestic and foreign banks’,
International Journal of Economic and Finance, 2(1): 186-
197.
Taymaz,
E. & Saatci, G. 1997. ‘Technical change and
efficiency in Turkish manufacturing industries’, Journal
Productivity Analysis, 8(4): 461-474.
Unite, A.A. & Sullivan, M.J. 2003. ‘The effect of foreign
entry and ownership structure on the Philippine domestic
banking market’, Journal of Banking and Finance, 27(12):
2323-2345.

60 S.Afr.J.Bus.Manage.2011,42(3)