agricultural commissioners’ crop reports santa clara county clara 1950-1957.pdf · california...
TRANSCRIPT

California Department of Food and Agriculture
Agricultural Commissioners’ Crop Reports
Santa Clara County
1950-1957
California County Agricultural Commissioners' Reports from the California Department of Food and Agriculture. This collection consists of annual crop and livestock data from each of the 58 California Counties. The collection covers 1915-1981; digitization of the rest of the collection is forthcoming. This digitization project was funded by the Giannini Foundation of Agricultural Economics, http://giannini.ucop.edu/ . The work was completed by the staff of the Giannini Foundation Library, University of California, Berkeley, http://are.berkeley.edu/library/ . Please contact the Library to consult the originals.

SANTA CLARA COUNTY DEP~ATr!~ENT OF AGRICIfLTURE
SAN JOSE, C~IFOPd~IA
DAVID T. RAYNER
AGRICULTUR.~L CO~ISSIONER
ANNUAL CROP REPORT
For the Year EndingDecember 3!, ]-950
BOARD
William Pfeifle, Chai1~an
Arthur Br o’~
W. O. ’gool
J. H. klcKinnon
E. C. Camobell
Richard Olson
OF SUPERVISORS
District 2
District i
District 3
District h
District 5
Clerk of the Board

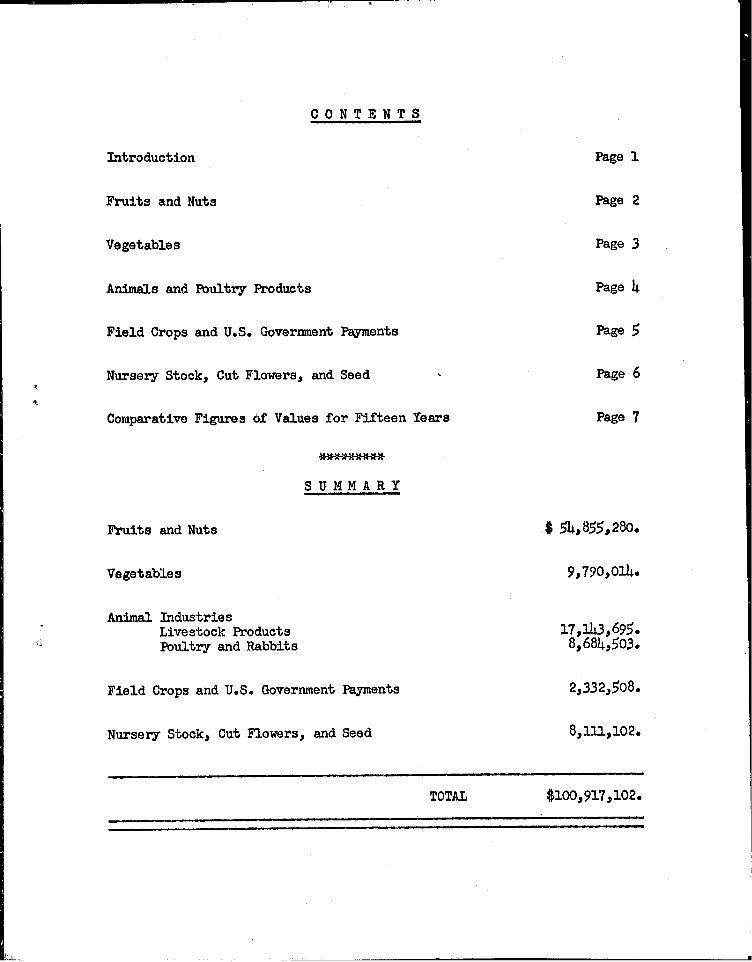
CONTENTS
Introduction
Fruits and Nuts
Vegetables
Animal Industry and Poultry
Field Crops and Bees
Nursery Stock and Seed
U. S. Goverr~nent Payments
Summary
Comparative Data 1943-1950
Page 1
Page 2
Page 3
Page
Page 5
Page 6
Page 6
Fage 6
Page 7
PERSONNEL
David T. RaynerAlbert N. FosterTheodore J. MonizArthur W. ~ppelH~bart ~. RoyceGeorge F. ProleI,loyd PlesseBill E. AbsherDed!ey F. ZollerGordon SpencerL. E. ~’:orris, Jr.Stanley C. CheadleJames ~. CottieAlbert LeonBerry Evans
(Gilroy Office)(Gilroy Office)
Agricultural Co~nissionerAssistant Agricultural Commissioner
Deputy Agricultural Commissioner(Oilroy Office) Deputy Agricultural Commissioner
Deputy Agricultural CommissionerAgricultural InspectorAgricultural InspectorAgricultural InsoectorAgricultural InsnectorAgricultural InspectorAgricultural Insoector
Rodent InsoectorRodent InspectorRodent Inspector
Stenographer-Clerk
OFFICES
Hall of JusticeCity Hall
San Jose, CaliforniaGilroy, California
TELEPHONE
CYpress ..... 5-1050 Ext. 12
N U M B E R S
Oi].roy ...... ¯ . . 217
Compiled By
ALBERT M. FOSTER
Assistant Agricultural Commissioner

Page I
COUNTY OF SANTA CLARA
DEPARTMENT OF AGRICULTURE
Hall. of JusticeSan Jose~ California~Jarch i, 1951
Mr. A. A. Brock,State Director of Agriculture
And
The Honorable Board of 8ucervisors
Gentlemen:
This Agricultural Report shows production and valueof all crops gro~’~m in the Cotulty for the year 19~0. Itis issued in compliance with Section 6~.5 of the StateAgricultural Code.
The productiou is reported in ~nits commonly used inthe marketing of croDs con~ercia!l~: in this C,~unby. Theincome given is ];ased on the price received b?f fa!~lers atroadside. It does not include costs of p~cking or ship-ping. To ~et a true net the far,]ier must ~Joduct his costof production.
I wish to express my simccre appreciation to eaohindividual who has assisted in the comnilation of thereoort.
Respect~ullv submitted,
,f) ..DAVID T. RAI.q~ERAGRICVLTURAL CO~.~ISSIONER
DTR: bpe

FRUITS AND N[~S - 1950 Page 2
CROP BEARING PRODUCTION IiOTES L~!T V~,um^~’’’~ TOTAL VAL[~ACREAG~
Almonds 175 .~2 Tons ~.~480. O0 ..,~" 24,960.
Apples 144 i,I00 Tons 85.00 °3~ 500.
Apricots 16,048 77~ 430 Tons Total52,680 Tons Fresh 75.00 3~ 951,O00.5,068 "~i, no Dried 620. GO 3~ 142 ~ 160.4,300 Tons Pits 50.00 215~ 000.
Cherries 2,.562 8,175 Tons Shipoed 320.00 2,6!6~ 000.6,640 Tons C~med & Bbld. 210,O0 i~394,400.
Citrus 43 10,400 Boxes 2.25 23~hO0.
Figs 6 4,500 Boxes 2.25 i0~ 125.
Grapes 5,150 9,785 Tons 80.00 782,800.
Olives 21 lO0.
Peaches 2~I !. 686 $7.50 147~ 525.
Pears 6,490 63~ 250 Tons Canned 70.00 4~ 427,500.5’,050 Tons Shipped 75.00 378~ 750.
6 h5 Tons 200.00 9~ 000.
201 750 Tons 265.00 198~ 750.
45, O12 68, O00 Tons Dried 242. O0 16,456, O00.
8,194 3,866 Tons 415.OO i, 6Oh, 390.
Per simmons
PI~s
Prune s
Walnuts
S?.~LL FRUITS:
Strawberries 1,560 1,750 Cts/ac 2,730,000 cts. 2.40 6,552,000.
Raspberries 95 I,i00 Cts/ac lOh,500 cts. 2.35 245,575.
Other Bush Fruits 27 1~700 Cts/ac 45,900 cts. 1.20 55,080.
TOTALS 86,015 $42,328~015.

VEGETABLE CROPS - 1950
Page 3
CROP ACRES AV. YIELD TOT~J~
PER AC.~E PRODUCTIONUNITVALUE
GROSS VALUETO PRODUCEIqS
Anise 150
Beans, 5nao and 1,417C~mned
Limas forFreezer 3,865
Beets~ Sugar 4,787
Brocno!i 3,350
Carrots 700
Cauliflower 650
Celery 1,135
Corn 175
Cuc1~bers 480
Endive 55
Garlic 838
Lettuce 2,142
Onions 165
Peas, Fall 850Spring 450
Peppers, Bell 250Wax 65
Sninach 678
Tomatoes 875
General Tr~ck ()roDs 3,200
Home Gardens
Nushrooms
TOTALS 26,277
500 Crates 75,000
7 Tons 9,919
l.h Tons 5,411
17.2 Tons 82,461
2 Tons 6,700
25 Tons 17,500
2.5 Tons 1,625
!,I00 Crates 1,248,500
185 Crates 32,375
9 Tons 4,320
200 Crates ii,0OO
7,900 Lbs. 6,620,200
145 Crates 330,590
350 Bags 5’7,750
135 HampeTs 114,750
1,700 Lbs. 765,000
250 Crates 62,5008 Tons 520
6 Tons 4,068
ll Tons 9,625
18,000 Lbs.
.9O
91. O0
15o.oo
lO.5O
120.00
17.5o
120.00
1.20
1.80
48.00
3.oo
.o85
.40
.90
2.20.05
2.001.40
22.50
22.50
475.00
.50
$ 67~500,
902,629,
811,650.
8~5.225.
804,000.
306 250~
195,000,
1,498.200.
58,275.
207,360.
33~o00.
562,717
132,236.
51,975.
252,450.38,250.
125,000.72,800.
91,53o.
216,563.
I~520,000.
50~000.
9~000.
8,851,610.

ANI]L~ I~ZOUSTRIES -1950 Page 4
LIVE STCCK
Milk Cows 19,725 HeadM~rket Milk 6,C6!,0qO !bs. @ $ 1.12 $ 6,788,320.
Mfg. ~i].k I12~O00 Ibs. @ .J5 95,200.
Steers 20,500 @ 275.q0 5,637,500.
Cows 17,500 @ 180.OO 3,150,O00.
Calves 14,250 @ 70.00 997,500.
Heifers 6,200 @ 210.00 1,302,OOO.
}logs 9,995 2,499,8OD Ibs. @ .215 537,242.
Horse, Race 35~000.
Saddle iO~,600.
Lambs 750 @ 30.00 22,500.
’~ool 6,750 Lbs. @ .85 5,537.
Manure 600,000 Yards @ 1.75 I~O50,OO0.
STIB TOTAl, $19,725,399.
POULTRY& RABBITS
Laying Hens 660,000 33%000 cases eggs @ $14.50 $ 4,785~000.
Heavy Fryers 1,0OO,OOO 3,000,000 Ibs. @ .29 870,000.
Leghorn, Broilers 3 ,OOO 529,OOO Ibs. @ .27 141,750.
Fowl, Cull Hens 500,000 1,750,000 ibs. @ .22 385~000.
Turkeys 75,000 1,350,000 ibs. @ .47 634, 500.
Turkey Eggs 150,000 @ ¯ 32 48,000.
Turkey Pou!ts 75,000 @ .75 56,250.
B~y Chicks 5,000,000 @ .22 I~IO0~OOO.
S~labs 22,500 22,000 ibs. @ I.OO 22,000.
Rabbits IOO, O00 20%000 Ibs. @ .58 116,OOO.Pelts IO0~O00 pelts @ .20 2,000.
Slm TOTAL $ 8,160,500.
TO h:m 827,885~899.

Page5
FinD CROPS AND BEES - 1950
CROP
Alfalfa
Volunteer Hay
Grain Hay
Barley
Wheat
Oats
ACRES TOTAl,PRODUCTION
UNIT GROSS VALUEV.gLUE TO PRODUCER5
915 6,405 Tons
1,117 1,117 Tons
7~!30 10,695 Tons
6,400 ].O8~800 Sacks
850 iI~050 Sacks
450 9,000 Sacks
$2~,.5o @ 156,923.
19.00 21,223.
21~.00 256,680.
2.25 2hb,800.
3.40 37,57,:,
2.90 26,100.
SUB TOTAL
Rental Bees & Honey
8 743,296
TOTAL
3,000 Colonies 4,500.
747,796.

Page 6
NURSERY STOCK & SEED - 1950
O:rnamental~ Fruit Trees~d Cut Flowers $3,625,000.
Seed Crops (631 Acres) 258,165.
TOT.~ ~3,883,165.
*Sugar Beet Pa~uents
A.C.P. Payme~bs
UNITED STATES GOVER~H~{EITr PA~NTS
TO GRO~,:~RS
$225,133.
217,195.
TOTAL $442,328.
*Wet soil has delayed sugar beet digging. Some adjustment has been made toinclude beets still unharvested. Further pa~neuts will be made by the U. S.Government.
Fruits & Nuts .......................
Vegetables ........................
Animal Industries
Live Stock ......................
Poultry & Rabbits ..................
Field Crops & Bees .....................
Nursery Stock & Seed ....................
U. S. Government Payments To Growers ............
$42,328,015.
8,851~61o.
19,725,399.
8,160,500.
747,796.
3,883,165.
~42,328.
TOTAL $84, ].38,8].3.

Page 7
TOTAL BEARING ACREAGE pR[~TEPRODUCTION TOTM~ VALUE
Fruits PrL~nes Dried Tons Fruits Agricultural
& ~uts & Nuts Products
I~43
l’%h
1945
!9h6
1947
].Qh8
i()4o
"1950
101.~606 56,5h6 76,600 ~25, 988, 766. $46,334,508.
101,039 56,115 71~400 37,092,6!35. 61,061,172.
1OO,770 56,115 95,000 39,870~ 475. 65,25.5,971.
lOl,030 55,665 85,000 50,686,450. 82,664,h53.
99,203 5h~[I14 89~000 31, 36].,198. 69, 3.36,459~
9Q,198 54.170 85~450 33,684,737. 73,579,805.
96, o,~I 5].> 59o 70, 0o0 26~ 933~ 350. 66, hl3,561.
68,000 42~ 328~015. 84,138,813.
The acreage figures are still Jn the process o~. bc].ng checked in the field.
There is a substantial reduction in both total acrea3e, and in the pmme
~crea~o,
/


\
I I

SANTA CLARA CO[~TY DEPARTMEh~f OF AGRICULTURE
SAN JOSE, CALIFORNIA
DAV I D T. RAYN ER
AGRICULTURAL CO~ISSIONER
ANNUAL CROP REPORT
For the Year EndingDecember 31, 1951
BOARD OF
William Pfeifle, Chairman
Arthur Brown
E. O. Wool
J. M. McKinnon
E. C. Campbell
Richard Olson
SUPERVISORS
District 2
District I
District 3
District 4
District 5
Clerk of the Board

CONTENTS
Introduct ion
Fruits and Nuts
Vegetables
Animal Industry and Poultry
Field Crops and Bees
Nursery Stock and Seed
U. S. Government Payments
Summary
Comparative Data 1943-1951
Page i
Page 2
Page 3
Page 4
Page 5
Page 6
Page 6
Page 6
Page 7
PERSONNEL
David T. RaynerAlbert M. FosterT. J. MonizArthur W. AppelHobart M. RoyceGeorge F. ProleLloyd PlesseDudley F. ZollerGordon SpencerRichard F. WilkeyRobert DenobleEric C. WinklerGil BordenaveStanley C. CheadleAlfred LeonJames M. CottleEdward RatzakBerry Evans
Hall of JusticeCityHall
Agricultural CommissionerAssistant Agricultural Commissioner
Deputy Agricultural Commissioner(Gilroy Office) Deputy Agricultural Commissioner
Deputy Agricultural CommissionerAgricultural InspectorAgricultural InspectorAgricultural InspectorAgricultural InspectorAgricultural InspectorAgricultural InspectorAgricultural Inspector
(Gilroy Office) Agricultural Inspector(Gilroy Office) Rodent Inspector
Rodent InspectorRodent InspectorRodent Inspector
Stenographer-Clerk
6FFICES
San Jose, CaliforniaGilroy, California
T EL E-PH ONE NUMBERS
San Jose - CYpress 5-1050 Ext. 12 Gilroy 217
Compiled By
ALBERT M. FOST~
Assistant Agricultural Commissioner

Page I
COUNTY OF SANTA CLARADEPARTMENT OF AGRICULTURE
Hall of JusticeSan Jose, CaliforniaFebruary 27, 1952
Mr. A. A. Brock,State Director of Agriculture
And
The Honorable Board of Supervisors
Gentlemen:
I am pleased to present the 1951 Agricultural CropReport for the year 1951. It is issued in compliancewith Section 65.5 of the State Agricultural Code.
The production is reported in units commonly~usedin the marketing of crops commercially in this County.The income given is based on the price received byfarmers at roadside. It does not include costs ofpacking or shipping. To get a true net the farmer mustdeduct his cost of production.
I wish to express my sincere appreciation to eachindividual who has so willingly assisted in the compi-lation of this report.
Respectfully submitted,/~_)
DAVID T. RAYNERAGRICULTURAL COMMISSIONER
DTR: bp e

FRUITS AND NUTS - 1951
Page 2
CROP BEARINGACREAGE
PRODUCTION NOT~. ~JNIT VALUE TOTAL VALUE
Almonds
Apples
Apricots
Cherries
Citrus
Figs
Graoes
Olives
Peaches
Pears
Persimmons
Plums
Pmmes
Walnuts
SMALL FRUITS:
Strawberries
Raspberries
Other Bush Berries
188
147
15,725
2,611
25 Tons $470.00 $ 11,750.
1,200 Tons 75.00 90,000.
63,500 Tons Total50,500 Tons Fresh 115.O0 5,807,500.
2,360 Tons Dried 600.00 1,416,000.4,100 Tons Pits 35.00 143,500.
3,055 Tons Shipped 600.00 1,833,000.3,510 Tons Canned &Bbld. 370.00 1,298,700.
43 ll,900 Boxes 2.00 23,800.
6 4,675 Flats 2.25 10,519.
5,034 8,325 Tons 50.00 416,250.
21 I00.
289 1,288 Tons 85.00 109,480.
6,394 71,570 Tons Total64,750 Tons Canned 88.50 5,730,375.6,820 Tons Shipped 60.00 409,200.
6 36,000 Lbs. .05 1,800.
206 960 Tons 85.00 82,080.
44,255 82,900 Tons 155.00 12,849,500.
8,235 4,097 Tons 470.00 1,925,590.
1,787 1,800 Cts/ac 3,216,600 Cts. 2.35 7,559,010.(272 Acres Non-Bearing)
90 I,i00 Cts/ac 99,000 Cts. 2.40 237,600.
25 1,500 Cts/ac 37,500 Cts. 1.30 48,750.
TOTAL8 85,062 $40,004,504.
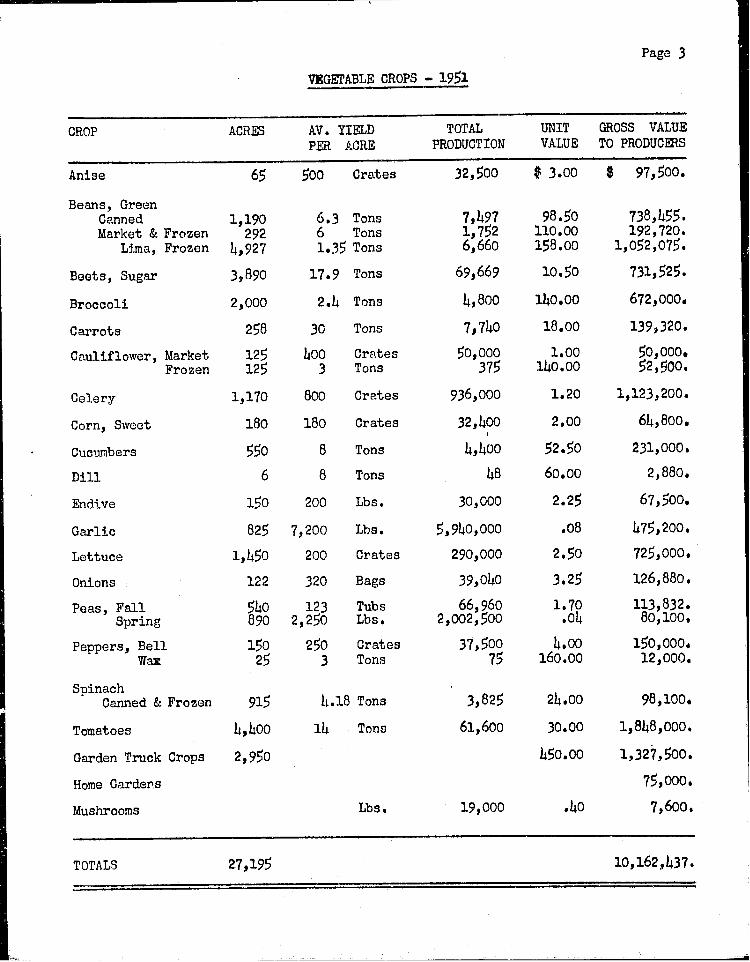
VEGETABLE CROPS - 1951
Page 3
CROP ACRES AV. YIELD TOTALPER ACRE PRODUCTION
UNIT GROSS VALUEVALUE TO PRODUC~qS
Anise 65
Beans, GreenCanned 1,190Market & Frozen 292
L~ma, Frozen 4,927
Beets, Sugar 3,890
Broccoli 2,000
Carrots 258
Cauliflower, Market 125Frozen 125
Celery 1,170
Corn, Sweet 180
Cucumbers 550
Dill 6
Endive 150
Garlic 825
Lettuce 1,450
Onions 122
Peas, Fall 540Spring 890
Peppers, Bell 150wax 25
SpinachCanned & Frozen 915
Tomatoes 4,400
Garden Truck Crops 2,950
Home Gardens
Mushrooms
500 Crates 32,500
6.3 Tons 7,4976 Tons 1,7521.35 Tons 6,660
17.9 Tons 69,669
2.4 Tons 4,800
30 Tons 7,740
400 Crates 50,0003 Tons 375
800 Crates 936,000
180 Crates 32,400
8 Tons 4,400
8 Tons 48
200 Lbs. 30,000
7,200 Lbs. 5,940,000
200 Crates 290,000
320 Bags 39,040
123 Tubs 66,9602,250 Lbs. 2,002,500
250 Crates 37,5003 Tons 75
4.18 Tons 3,825
14 Tons 61,600
Lbs. 19,O00
$ 3.00 $ 97,500.
98.5o 738,455.II0.00 192,720.158.oo 1,o52,o75.
10.50 731,525.
140.OO 672,000.
18.00 139,320.
l.OO 50,000,14o.oo 52,900.
1.20 1,123,200.
2.00 64,800.
52.50 231,000.
60.00 2,880.
2.25 67,5oo.
.08 475,200.
2.50 725,000.
3.25 126,880.
1.70 113,832.¯ 04 80,100,
4.00 15o,ooo,160.00 12,000.
24.00 98,100.
30.00 1,848,000.
45o.~ 1,327,5oo.
75,000.
.40 7,600.
TOTALS 27,195 10,162,437.

ANI~AL INDUSTRIES - 1951
Page 4
LIVE STOCK
Milk Cows 20,196 HeadMarket Milk 115,232,690 Ibs. @ $ 5.29 $6,095,809.
Mfg. Milk191,000 ~bs. @ .97 185,270.
Steers 21,000@ 310.00 6,510,000.
Cows 18,O50 @ 215.00 3,880,750.
Calves 15,000 @ 75.00 1,125,000.
Heifers 6,350@ 260.00 1,651,000.
Hogs (Feeders 80%) II,000 2,310,000 Ibs. @ .2075 479,325.
35,000.Horses, Race 75,000.
Saddle
Lnmbs 1,100@ 30.00 33,000,
Wool i0,000 Lbs.@ .85 8,500.
Manure 240,000 Yards@ 1.75 420,000.
$20,498,654.SUB TOTAL
POULTRY &RABBITS
Laying Hens 6009000 300,000 cases eggs @ $15..00 $4,500,000.
Heavy Fryers 1,400,000 4,700,000 ibs. @ .29 1,092,000.
Leghorn, Broilers 300,000 475,000 Ibs. @ .24 114,000.
Fowl, Cull Hens 450,000 1,575,000 ibs. @ .20 315,000.
Turkeys 75,000 1,350,000 lbs. @ .50 675,000.
Turkey Eggs 180,000@ .28 50,400.
Turkey Poults 75,000 @ .75 56,250.
B~oy Chicks 7,000,000@ .18 1,260,000.
Squabs 31,500 23,625 Ibs. @ .90 21,262
Rabbits 50,000 225,000 Ibs. @ .30 67~500.
$8,151,412.SIR TOTAL ’"
°.
$28,650,066.TOTAL
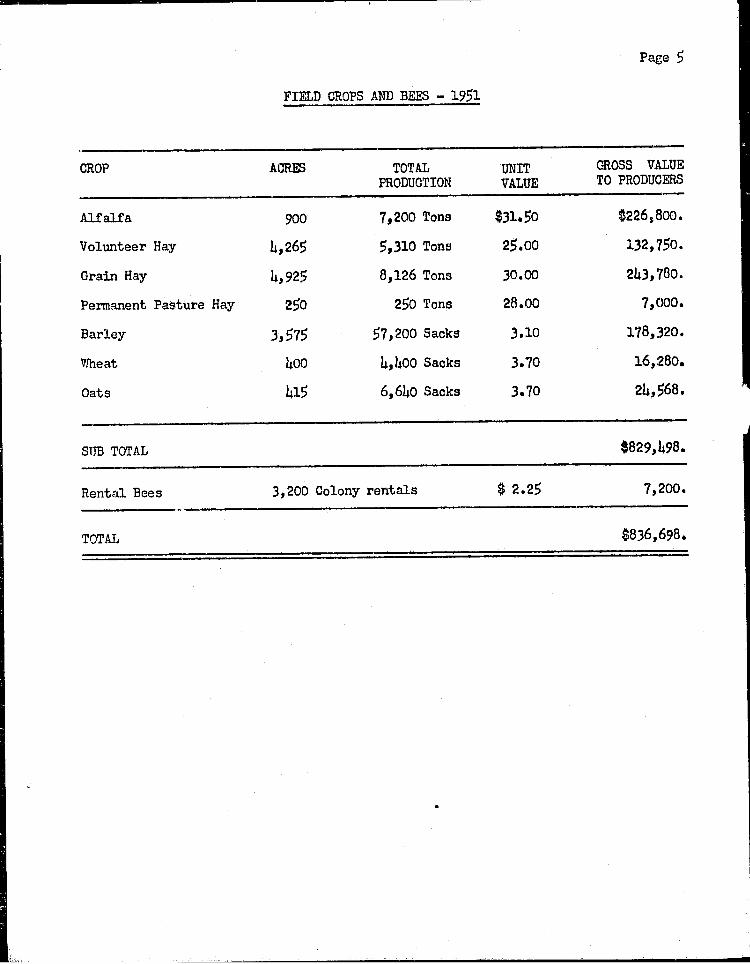
FIELD CROPS AND BEES - 1951
Page 5
CROP ACRES TOTAL UNIT GROSS VALUEPRODUCTION VALUE TO PRODUCERS
Alfalfa 900 7,200 Tons $31.50 $226,800.
Volunteer Hay 4,265 5,310 Tons 25.00 132,750.
Grain Hay 4,925 8,126 Tons 30.00 243,780.
Permanent Pasture Hay 250 250 Tons 28.00 7,000.
Barley 3,575 57,200 Sacks 3.10 178,320.
V~eat 400 4,400 Sacks 3.70 16,280.
Oats 415 6,640 Sacks 3.70 24,568.
Stm TOTAL $829,498.
Rental Bees 3,200 Colony rentals $ 2.25 7,200.
TOTAL $836,698.

Page 6
NURSERY STOCK - CUT FLOWERS - SEED
Nursery StockLicensed Nurseries - 244
Cut FlowersGreenhouses - 505,780 sq. ft.Cut Flowers - field and lath - 18 acres
Seed Crops - 1,018 acres 751,815 lbs. @ $.28
$2,537,500.
509,268.187,100.
214,267.
TOTAL $3,448,135.
UNITED STATES GOVERNmeNT PAYMENTS
TO GROWERS
Sugar BeetsA.C.P. (Agricultural Conservation Program)
$172,826,203,485.
TOTAL $376,311.
SUMMARY
Fruits & Nuts ........................ ¯ ¯ ¯ ¯
Vegetable ..............................
Animal IndustriesLive Stock .........................Poultry& Rabbits .....................
Field Crops & Bees ....................... ¯
Nursery Stocks & Seed .......................
U. S. Government Payments To Growers ...............
$4o,oo4,5o4.
10,162,437.
20,498,654.8,151,412.
836,698.
3,448,135.
376,311.
TOTAL $83,478,151.

Page 7
YEAR TOTALBEARING ACREAGE PRUNE PRODUCTION TOTAL VALUE
Fruits Prunes Dried Tons Fruits Agricultural
& Nuts &Nuts Products
1943
1944
1945
1946
1947
1948
1949
195o
1951
101,696 56,546 76,600 $25,988,766. $46,334,508.
101,O39 56,115 71,400 37,092,685. 61,061,172.
100,770 56,115 95,000 39,8703475. 65,255,971.
101,030 55,665 85,000 50,686,450. 82,664,453.
99,203 54,414 89~000 31,361,198. 69,336,459.
99,198 54,170 85,450 33,684,737. 73,579,805.
96,971 51,590 70,000 26,933,350. 66,413,561.
86,015 50,O12 68,000 42,328,015. 84,138,813.
85,062 44,255 82,900 40,004,504. 83,478,151.


5RIi- I CLPIRFIcO nTy
IZIAVII] T.HFILL OF JUSTICE" spin JOSE.CFILIFORnlFI
UNIVER511 Y or CALIFORNIADAglS

SANTA CLARA COUNTY DEPARTI~ENT OF AGRICULTb~E
SAN JOSE, CALIFORNIA
DAV I D T. RA YNERAGRICULTURAL CO~,~ISSIONER
ANNUAL CROP REPORT
For the Year EndingDecember 31~ 1952
FRANK H. THILL, COUNTY EXECUTIVE
BOARD
A. W. Brown
Sam P. Della Maggiore
Ed R. Levin
J o M. McKinnon, Chairman
Walter S. Gaspar
Richard Olson
OF SUPERVISORS
District i
District 2
District 3
District 4
District 5
Clerk of the Board

CONTENTS
Introduction
Fruits and Nuts
Vegetables
Animal Industry and Poultry
Field Crops, Bees and U. S~ Government Payments
Nursery Stock, Cut Flowers and Summary
Comparative Data 1943-1952
Supplementary Data
Page I
Page 2
Page 3
Page 4
Page 5
Page 6
Page 7
Page 8
David To RaynerAlbert Mo FosterTo Jo MonizArthur Wo AppelHobart. Mo RoyceGeorge Fo ProleLloyd Fo PlesseGordon SpencerEric WinklerArthur MutzenbergChester HoweFrank OdellGill BordenaveStanley Co CheadleAlfred LeonJames M. CottleEdward RatzakBerry Evans
PERSONNEL
Agricultural CommissionerAssistant Agricultural Commissioner
Deputy Agricultural Co~nissioner(Gilroy Office) Deputy Agricultural Commissioner
Deputy Agricultural CommissionerSenior Agricultural InspectorSenior Agricultural InspectorSenior Agricultural Inspector
Agricultural Inspector, Grade IIAgricultural Inspector, Grade IIAgricultural Inspector, Grade IIAgricultural Inspector, Grade II
(Gilroy Office) Agricultural Inspector, Grade ~
(Gilroy Office) Agricultural Inspector, Grade Agricultural Inspector, Grade IAgricultural Inspector~ Grade IAgricultural Inspector, Grade I
intermediate Stenographer Clerk
Hall of JusticeCity Hall
OFFICES
TELEPHONE
San Jose - CYpress 5--,1050 Ext. 461
NUMBERS
San Jose, CaliforniaGilroy, California
Gilroy 217
Compiled By
ALBERT M. FOSTER
Assistant Agricultural Commissioner
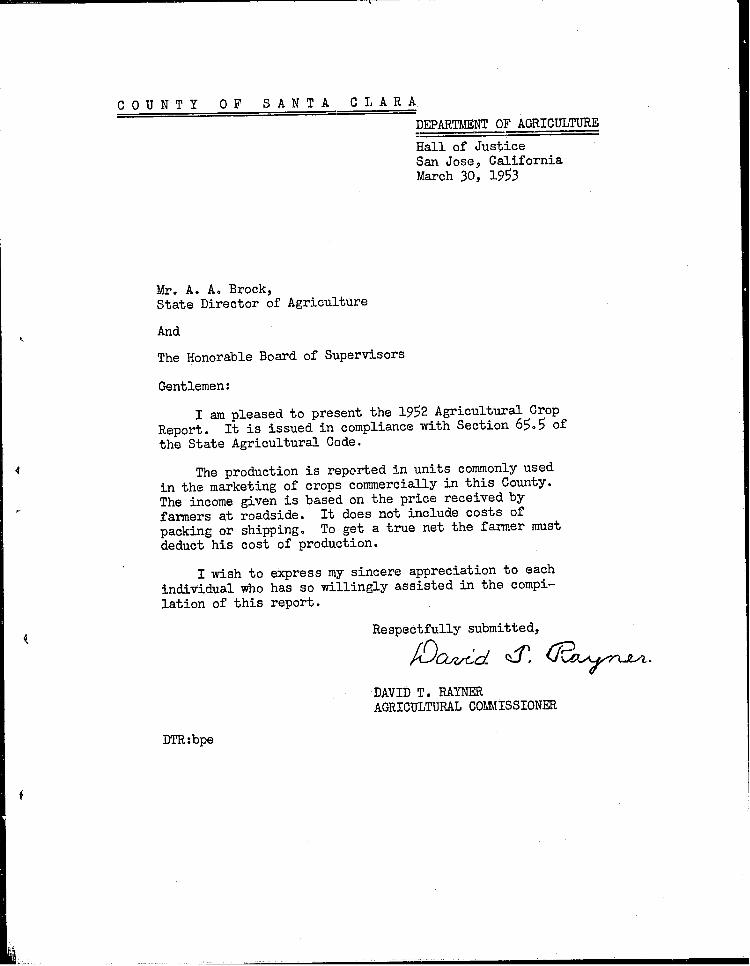
COUNTY OF SANTA CLARA
DEPARTMENT OF AGRICULTURE
Hall of JusticeSan Jose~ CaliforniaMarch 30, 1953
Mr. A. A. Brock,State Director of Agriculture
And
The Honorable Board of Supervisors
Gentlemen:
I am pleased to present the 1952 Agricultural CropReport. It is issued in compliance with Section 65°5 ofthe State Agricultural Code.
The production is reported in units commonly usedin the marketing of crops commercially in this County.The income given is based on the price received byfarmers at roadside. It does not include costs ofpacking or shipping° To get a true net the farmer mustdeduct his cost of production.
I wish to express my sincere appreciation to eachindividual who has so willingly assisted in the compi-lation of this report.
Respectfully submitted,
DAVID T. RAYNERAGRICULTURAL CO~ISSIONER
DTR :bpe

FRUITS AND NUTS - 1952
CROP BEARINGACREAGE
PRODUCTION NOTES UNIT VALUE TOTAL VALUE
Almonds 181 32.5 Tons
Apples 164 1,395 Tons
Apricots 15,465 55,600 Tons39,650 Tons
2,900 Tons3,480 Tons
Avocadoes 2 3,000 Lbs.
Cherries 2,615 13,957 Tons7,553 Tons6,404 Tons
Citrus 32 6,600 Boxes
Figs 6 4,150 Flats
Grapes 5,026 lO,O00 Tons
Peaches 308 1,390 Tons
Pears 6,357 65,650 Tons61,700 Tons3,950 Tons
Prickly Pears 40 12,000 Flats
Persimmons 6 1,650 Lugs
Plums 193 212 Tons
Prunes 43,385 53,000 Tons
Walnuts 8,265 4,475 Tons
SMALL FRUITS:
Strawberries 1,737 3,300,300 Crates(523 Acres
Raspberries 115 138,000 Crates
Other Bush Berries 40 12,000 Flats
TotalCanned & ShippedDriedPits
TotalShippedCanned & Bbld.
TotalCannedShipped Fresh
1,900 Cts/acNon-Bearing)
1,200 Cts/ac
$465.00 $ 15,112.
85°oo I18,575.
IOO.O0 3,965,000.850.00 2,465,000o
30°00 104,400o
.25 750.
440~00 3,323,320.210.00 1,344,840o
1o60 10~560o
1o90 7,885.
35.oo 35o~OOOo
85.o0 118,15oo
40.00 2,468,000.70.00 276,500.
I~50 18~O00n
1o5O 2~475.
200.00 42,400.
230°00 12,190,000.
440°00 1,969~000.
2°00 6,600~600.
2°60 358,800.
1o50 18,000.
TOTALS 83,937 $35,767,367°
-2-

VEGETABLE CROPS - 1952
CROP ACRES AVo YIELD TOTAL UNIT GROSS VALUEPER ACRE PRODUCTION VALUE TO PRODUCERS
Sweet Anise 95 390 Crates 37~050 $ 3.10 $ 1149855°
Beans, GreenCanned 763 6 Tons 4,578 112o50 515o025o~arket & Frozen 154 6°5 Tons 1,001 115o00 115,115o
l,ima, Frozen 6,000 1o75 Tons 10,500 158o50 1,664,25Oo
Broccoli 2,500 2.5 Tons 6~250 140o00 875,000°
Carrots 185 26 Tons 4,800 20°00 969000°
Cauliflower 820 4 Tons 3,280 14Oo00 "4599200.
Celery~ Fresh 1,500 800 Crates 1,200~000 2°75 3,3009000.Canned 6 8o7 Tons 52 75°00 3,900.
Sweet Corn 400 145 Crates 58~000 1.75 I01~500o
Cucumbers 600 8°8 Tons 59280 54°00 285~12Oo
Dill 7 8 Tons 56 55.00 3~000o
Endive 150 200 Crates 30,000 2o15 64,500.
Garlic 575 63600 Lbso 3,795~000 o12 455,400°
Lettuce 1,O75 183 Crates 196,725 loO0 196,725o
Onions~ Dry 140 790 50# Bags 110:,600 1o75 193~55OoGreen Bunched 42 3~500 Bunches 147,000 °55 80,850.
Peas9 Spring 650 Io16 Tons 754 91o40 68,916.~ Fall 450 122 Tubs 54,900 3°20 175,680.
Peppers, Bell 150 250 Crates 37,500 1.50 56,250°Wax 50 5 Tons 250 14Oo00 35,000.
Spinach 200 6 Tons 1,200 25°00 30,000°
Tomatoes 2,725 16o8 Tons 45~780 25°00 1,144,500o
Commercial TruckGardens 3~000 Various 475°00 1,425,000o
Home Gardens 6,000 120,000.
~ushrooms Lbso 19,000 °40 7,600.
TOTALS 28,237 $i1~587,016o

ANIMAL INDUSTRIES - 1952
LIVESTOCK
~Ik Cows 20,000 HeadMarket Milk 6,160,OOO Ibs. @ $ 1o48 $9,116,800o~fgo Milk 1529000 Ibso @ 1.14 173,280.
Steers 24,150 @ 250~O0 6,O37~500.
Cows 209750 @ 200°00 4,1509000.
Calves 17,200 @ 78°00 193769000.
Heifers 7~300 @ 185o00 1,3503500o
Hogs and Feeders 79500 i~5009000 Ibso @ o19 285,000°
Horses9 Race 93,850.Saddle 55~000.
Lambs 1~280 115~200 lbso @ °25 28,800.
Wool 12,000 Lbso @ °80 99600.
Manure 250,000 Yards @ 1o75 437~5OO.
SUB TOTAL $23,113~830.
POD~TRY &RABBITS
Laving Hens 650;000
Heavy Fryers 19400,000
Broilers 325,000
Fowl9 Cull HensLeghorns 275,000Heavy Breeds 45,000
Turkeys 52,250
Turkey Pou~Ss 2~500
Baby Chicks 6,194,300
Squabs 33,000
Rabbits 40~000
325,O00 cases eggs @ $14o50 $4~712~500o
4,2009000 ibs. @ °29 19218,000°
650,000 Ibso @ .28 182,O00.
825,0oo lbs. @ °23½ 193,875o190,OOO Ibso @ o31 58,900.
1,123,375 ibso @ .45 505,518.
@ .65 1,625.
@ .18½ 1,145,946o
299700 ibso @ °90 26,730.
170,000 Ibso @ °29 49~300o
SUB TOTAL $8,O94~394o
TOTAL $31,2089224.
-4-

FIELD CROPS~ U o So GOVERNMENT PAYMENTS AND BEES
FIELD CROPS ACRES TOTAL UNIT GROSS VALUEPRODUCTION VALUE TO PRODUCERS
Alf alf a I, 000
Volunteer Hay 65400
Grain Hay %600
Permanent Pasture Hay 15750
Barley 4,400
Whe at I ~ 050
Oats 460
Sugar Beets 3,850
6,350 Tons $35°50 $225,425°
9,600 Tons 24°50 235,200°
15,6OO Tons 32°00 4865400°
Value reflected in live stock sales
81,400 Sacks 3°35 272,690.
17,1OO Sacks 3°85 65,835.
7,000 Sacks 3°95 27,650.
68,145 Tons 11o35 773,446.
SUB TOTAL $%0865646°
U. So GOVERNMENT PAYMENTS
Sugar Beets (Government Payments)
A.CoP. (Agricultural Conservation Program)
$1379583.
144,757o
SUB TOTAL $282,340°
BEES
Rental Bees 3,500 Colony rentals 2 o 25 7,875°
TOTAL $39376,861.
-5-

¯
NURSERY STOCK, CUT FLOWERS~ SEED AND SUN~L~Y
NURSERY STOCKLicensed Nurseries - 246Gross Sales
CUT FLOWERS: ~olesale GrowersField (F), Lath (L), Greenhouses (G), and Cloth
Asters (F)Carnations (C) & (G):
(c)(G)
Chrysanthemums (L)
Gladiolus (F)
Roses (G)Snapdragons (G)
Stephanotis (G)
Miscellaneous Cut Flowers
36 acres
305,800 square feet297,850 square feet
74 acres25 acres
230,000 square feet
25,000 square feet
53000 square feet
$3,447,500-
$ 99,000-
152~900.327,635~666~000.
56,250.
230~000-20~000.18,500.
7,500.$ ,57 ,785.
SEED CROPS 368~452 lbs. $ 64,110.
TOTAL$5,o89,395.
SUMMARY
Fruits & Nuts ........................
ooo~oooeoOVegetabl,es ............
Animal IndustriesLivestock ......................Poultry & Rabbits ..................
Field Crops & Bees ....................
Uo S. Government Payments ..................
Nursery Stock, Cut Flowers & Seed ...............
TOTAL
6-
¯ $35,767,367-
II,587,O16.
23,113~830.8,094,394.
2,094,521.
282,340.
5,089,395.
$86~028~863.
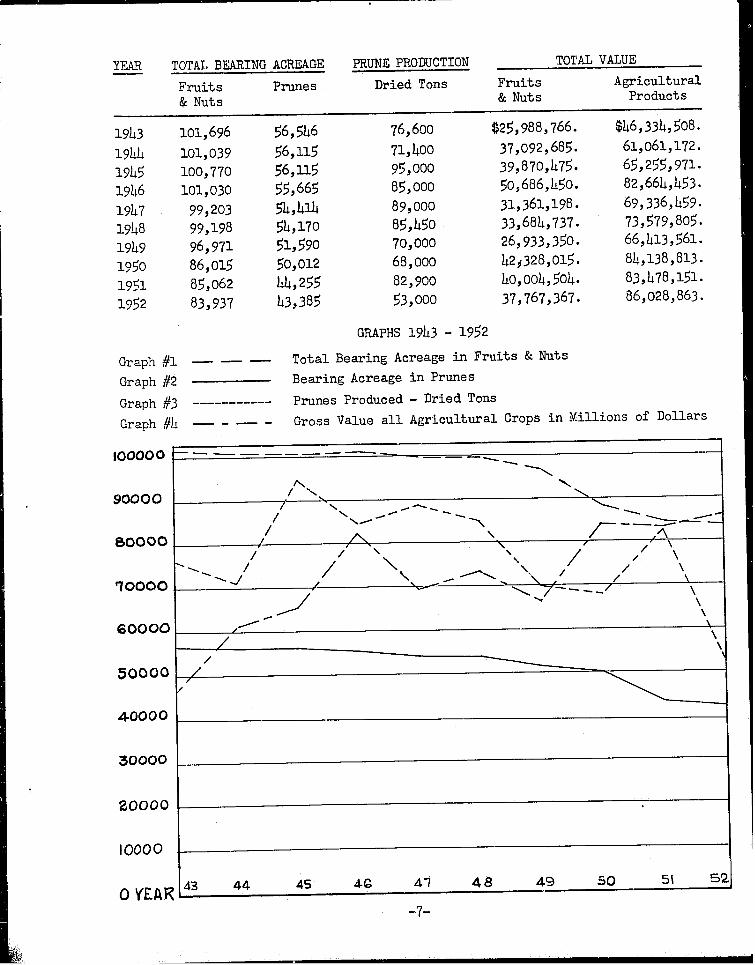
TOTAL BEARING ACREAGE
Fruits Prunes& Nuts
PRUNE PRODUCTION TOTAL VALUE
Dried Tons Fruits Agricultural& Nuts Products
1943 101,696 56,546
1944 i01,039 56,115
1945 100,770 56,115
1946 i01,030 55,665
1947 99,203 54,414
1948 99,198 54,170
1949 96,971 51,590
1950 86,015 50,012
1951 85,062 44,255
1952 83,937 43,385
Graph #1Graph #2
Graph #3
Graph #4
I00000
90000
BOO00
qOOOO
60000
50000
4-0000
~0000
ZOO00
I0000
76,600 $25,988,766. $46,334,508.
71,400 37,092,685. 61,061,172.
95,000 39,870,475. 65,255,971.
85,000 50,686,450. 82,664,453.
89,000 31,361,198. 69,336,459.
85,450 33,684,737. 73,579,805.
70,000 26,933,350. 66,413,561.
68,000 42~328,015. 84,138,813.
82,900 40,004,504. 83,478,151.
53,000 37,767,367. 86,028,863.
GRAPHS 1943 - 1952
Total Bearing Acreage in Fruits & Nuts
Bearing Acreage in Prunes
Prunes Produced - Dried Tons
Gross Value all Agricultural Crops in Millions of Dollars
/ \\i "I ,, /-- /~\
I /~. ~ , // I \,,\ / / \
- ~ i / \\ ~ \ i \
" 7--
\
//
/
/ \\
43 44 45 4-@ AU 4 8 A9 50 51 5Q
-,7-

SUPPLEMENTARY DATA FOR 1952 ~NUAL REPORT
Information furnished by: Mr. Walter G. Hunt, EngineerSanta Clara County Water Conservation Office
AREA
Anderson Reservoir I~450 acres
Coyote Reservoir 688 acres
Lexington Reservoir 450 acres
Stevens Creek Reservoir 95 acres
Guadalupe Reservoir 75 acres
Calero Reservoir 329 acres
Almaden Percolation Pond 20 acres
Vasona Percolation Pond 79 acres
MAX. CAPACITY AREA OF WATER SHED
75,000 ac. ft. 195 sq. miles
25,000 ac. ft. 120 sq. miles
25,000 ac. ft. 38 sq. miles
4,000 ac. ft. 16.86 sq. miles
3,500 ac. ft. 6.28 sq. miles
9,500 ac. ft. 7°08 sq. miles
400 ac. ft.
3,186 acres 142,400 ac. ft. 383.22 sq. miles
Information furnished by: Mr. LloydWeber, Research & Publicity ManagerSan Jose Chamber of CommerceTaken from 1950 Censu~
Number of farms
Total acres in County
Crop land harvested
Acres in hay crops
Acres in irrigated pasture
Total pasture including range land and irrigated pasture
Wood land total
5,282
835,000172,508
22,133
6,149
317,345
123,066
Compared~ith i00 leading counties Santa Clara County rated 23rd in nation
1st in Strawberries - Quantity produced
1st in Prunes - Total value and acreage
3rd in Pears - Acreage and yield
6th in Fruits, Berries, Small fruits and Nuts - By dollar value
Cherries - 6th in quantity and 8th in acreage
Vegetables - 8th in dollar value and 13th in acreage
15th in Grapes - Number of vines


HflLL OF JLISTICE SAIl jOSE.CRLIFOP, nIfl

SANTA CLARA COUNTY DEPARTMENT OF AGRICULTURE
SAN JOSE, CALIFORNIA
DAVID T. RAYNER
AGRICULTURALCO~SSIONER
ANNUAL CROP REPORT
For the Year EndingDecember 31, 1953
FRANK H. THILL, COUNTY EXECUTIVE
B’OARD
A. W. Brown
Sam P. Della Maggiore
Ed R. Levin
J. M. McKinnon, Chairman
Walter So Gasper
Richard Olson
OF SUPERVISORS
District I
District 2
District 3
District 4
District 5
Clerk of the Board
CONTENTS
Introduction
Fruits and Nuts
Vegetables
Animal Industry and Poultry
Field Crops, Bees and U. S. Government Payments
Nursery Stock, Cut Flowers and Summary
Comparative Data 1943-1953
County Water Development
¯ ¯ tD . °~ .-44P-4mID~ ¯ ~ ¯
Page 1
Page 2
Page 3
Page 4
Page 5
Page 6
Page 7
Page 8
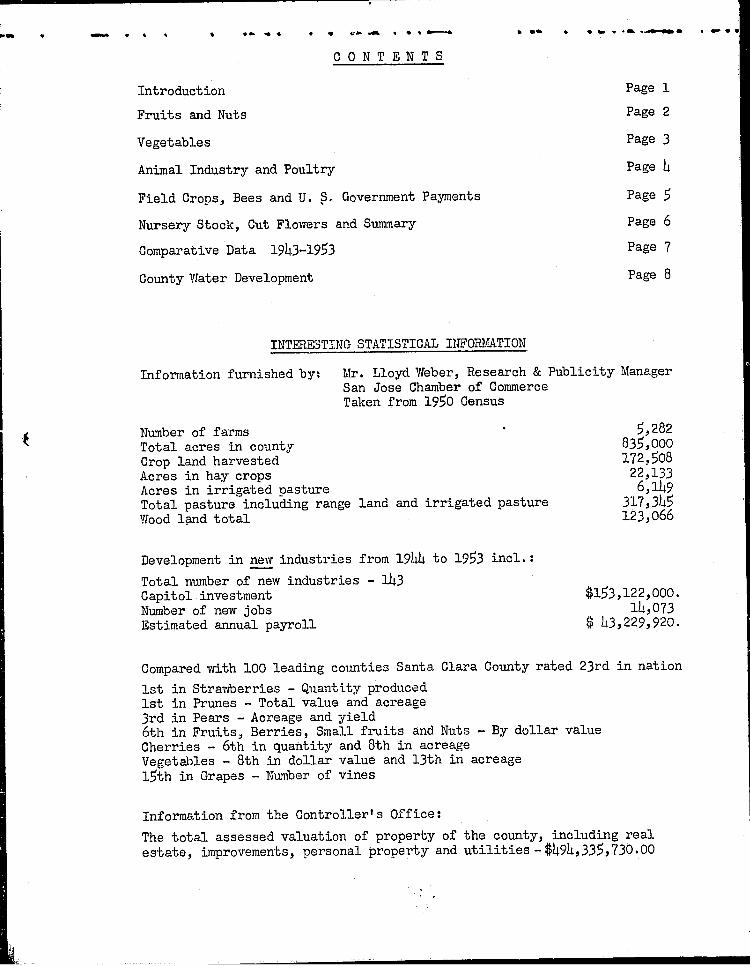
INT~ESTING STATISTICAL I~FOPI~ATION
InfoEnation furnished by~ Mr. Lloyd Weber, Research & Publicity ManagerSan Jose Chamber of CommerceTaken from 1950 Census
N~mber of farms ’Total acres in countyCrop land harvestedAcres in hay cropsAcres in irrigated pastureTotal pasture including range land and irrigated pastureWood land total
5,282835~ooo172,508
22,1336,149
317,345123,066
Development in new industries from 1944 to 1953 incl.:
Total number of new industries - 143Capitol investmentNumber of new jobsEstimated annual payroll
$153,122,000.14,073
$ 43,229,920.
Compared with i00 leading colmties Santa Clara County rated 23rd in nation
1st in StraWoerries - Qua~bity produced1st in Prunes - Total value and acreage3rd in Pears - Acreage and yield6th in Fruits, Berries, Small flulits and Nuts - By dollar valueCherries - 6th in quantity and 8th in acreageVegetables - 8th in dollar value and 13th in acreage15th in Grapes - Number of vines
Information from the Controller’s Office:
The total assessed valuation of property of the county, including realestate, improvements, personal property and utilities - $494,335,730.00

¯ g~q~k m, qo ¯~ ¯ ~ ,4 qb
~ay 17, 1954
Lh’o V/0 Co Jacobsen, ActingState Director of Agricu’~ture
and
The Honorable Board of Supervisors
Gentlemen:
I am pleased to submit the Agricultural Crop Report forthe year 1953. The report is compiled as required by Section65°5 of the State Agricultural Code.
As has been our custom in the past, the figures are thegross returns to producers of Agricultural products. The unitsof production are tho ones commonly used for the commodityreported. In some instances various sizes of containers usedin packaging will have to be taken into account when arrivingat the average unit value.
The total gross receipts show a substantial gain over the1952 report and favorably expresses the strong position ofAgriculture in the County.
I wish to express my sincere appreciation to all theindividuals who furnish information that makes the reportpossible.
Respectfully submitted,
DAVID T. RAYNERAGRICULTURAL CO~ISSION~’~
DTR :bpe
I

¯ ¯ ¯ ¯ ¯ 4 ~- ¯ ¯ ¯ ~ ¯ Q ¯
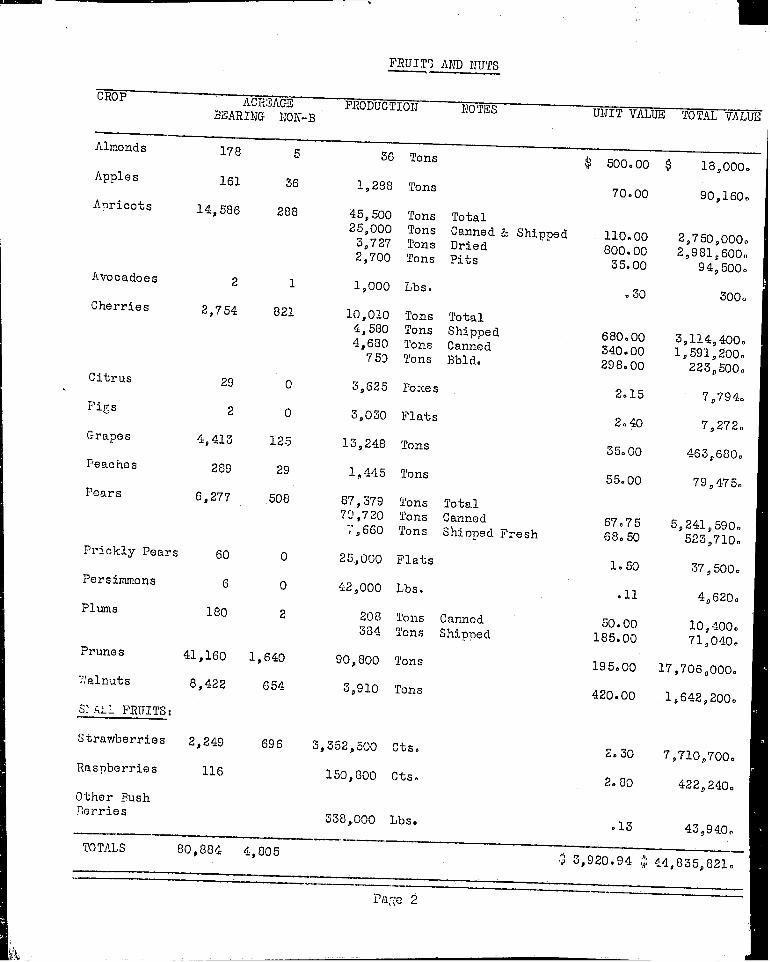
FRUITS AND NUTS
CROP ACP~GE PRODUCTION NOTES UNIT VALUE TOTAL VALUEBEARING NON-B,
Almonds 179 7 43 Tons
Apples 160 33 1,760 Tons
Apricots 14,949 299 84,000 Tons41,100 Tons
7,800 Tons5,000 Tons
Avocadoes 2 - 300 Lbs.
Cherries 2,672 896 II,!~7 Tons5,402 Tons5,035 Tons
710 Tons
Citrus 27 - 4,800 Boxes
Figs 5 - 3,000 Flats
Grapes 4,974 176 7,250 Tons
Peaches 274 15 750 Tons
Pears 6,276 634 75,125 Tons68,543 Tons
6,582 Tons
Prickly Pears 40 - 20,000 Flats
Persiu~ons 6 - iO,O00 Lbs.
Plums 178 4 33 Tons28,825 Cts.
Prunes 42,262 1,678 82,000 Tons
Walnuts 8,280 908 3,650 Tons
SI~ALL FRUITS:
Strawberries 1,745 522 3,141,000 Ors.
Raspberries 127 - 177,800 Cts.
Other Bush 18 - 239,400 Lbs.Berries
$435.00 $ 18,705~
62.50 II0~000.
TotalCanned & Shipped 98.00 4,O27,8OO.Dried 71Oo00 5,538,000.Pits 30.00 150,000.
TotalShippedCannedBbld.
TotalCannedShipped Fresh
CannedShipped
1,8OO Cts/ac
¯ 35 io5.
660.00260.00240.00
1.75
1.80
35.0o
56.oo
67.005o.oo
i.5o
.18
55.oo3.65
205.00
400.00
2.25
2°90
.I4
3,565,320.1,309,100.
170,400.
8,400.
5,400.
253,750.
42,000.
4,592,381.329~100
30,000.
1,800.
1,815.105,211.
16,810,000.
1,460,0OO.
7,067,250.
515,620.
33,516.
TOTALS 82,174 5,172 $46,145,673.
-2-

VEGETABLE CROPS - 1953
CROP ACRES AV. YIELD TOTAL UNIT
PER ACRE PRODUCTION VALUE
Asparagus
Sweet Anise
Beans, GreenCannedMarket & Frozen
Lima, Frozen
Broccoli
Carrots
Cauliflower
Celery, FreshCanned
Sweet Corn
Cucumbers
Dill
Endive
Garlic
Lettuce
Onions, Dry
Peas, SpringFall
Peppers, BellWaxHot
Spinach
Tomatoes
CommercialTruck Gardens
Mushrooms
70 400 Lbso 28,000 $ oi0
95 250 Crates 23,750 2.00
640 6°5 Tons 4,160 128.00
228 6o6 Tons 1,505 140o00
5,860 1.6 Tons ~ 9,376 150.00
2,600 2 Tons 5,200 130.00
236 16 Tons" 3,428 18.00
800 4 Tons 3,200 140.00
1,500 900 Crates 1,350,000 1.35
7 26 Tons 182 70.00
493 225 Crates 110,925 1.25
650 9 Tons 5,850 53°50
8 I0 Tons 80 40.00
ZOO 175 Crates 35,000 1.O0
480 8,600 Lbs. 4,128,000 .145
1,360 227 Crates 308,720 1.40
340 313 IO0# Bags 106,300 1.88
600 1.25 Tons 750 80.00
420 123 Tubs 51,660 3°50
160 ?00 Crates 32,000 1.50
42 5 Tons 210 1.40
7 6 Tons 42 1.60
614 7 Tons 4,298 25.00
I~700 21 Tons 37,380 22.50
3,150 460°00
48,200 Sq. Ft. Beds 48,200 .50
532,480.210,700.
1,406,400.
676,000.
61,704.
448,000°
1,822,500.12,740.
138,656.
312,975.
3,200.
35,000.
598,560.
432,208.
199,844.60,000.
180,810.
48,000.29,400.
6,720.
107,450.
861,200.
1,449,000o
24,100.
TOTALS 22,259 $9,707,947.
-3-

AN~AAL INDUSTRIES - 1953
LIVESTOCK ¯
Milk CowsMarket Milk 5,840,000 Ibs. @ $ 1.42 $8,293,800.Nfg. Milk 219,000 ibs. @ .98 215,000o
Steers 24,500 @ 225.00 5,512,500.
Cows 21,270 @ 160.00 3,403,200°
Calves 16,800 @ 61.00 1,024,800.
Heifers 7,100 @ 165.00 1,171,500.
Hogs and Feeders 4,250 956,250 Ibs. @ .21 200,813.
Horses, Race 45,000.Saddle 25,000.
Lambs 1,500 135,000 Ibs. @ .21 28,350.
Wool 15,ooo lbs. @ .55 8,250.Manure 250,000 yards @ 1.75 437,500°
SUB TOTAL $20,365,713.
POULTRY & RABBITS
Laying Hens 675,000
Heavy Fryers 1,750,000
Broilers 375,000
Fowl, Cull HensLeghorns 280,000Heavy Breeds 50,000
Turkeys 64,000
Baby Chicks 5,750,000
Squabs 35,000
Rabbits 80,080
335,000 cases eggs @ $15.50 5,192,500.
7,000,000 Ibs. @ .29 2,030,000.
750,000 lbs. @ .25 187,500.
840,000 ibs. @ .23 273,200.200,000 ibs. @ .32 64,000°
1,408,OO0 Ibs. @ .47 661,760.
@ .20 1,121,250.
34,000 Ibs. @ .95 32,728.
340,340 Ibs. @ .24½ 83,383.
SUB TOTAL $9,646,321.
TOTAL $30,O12,O34.
-4-

FIELD CROPS, U o S. GOVER~T PAYN~NTS AND BEES
FIELD CROPS ACRES TOTAL UNIT GROSS VALUEPRODUCTION VALUE TO PRODUC~S
Alfalfa 600
Volunteer Hay 6,500
Grain Hay 7,300
Permanent Pasture Hay 2,250
Barley 4,900
~eat 1,300
Oats 750
Sugar Beets 4,035
3,750 Tons $30°00 $I12~500.
9,500 Tons 20°00 190,0OO.
14,600 Tons 28°00 409,800.
Value reflected in livestock sales
78,400 Sacks 2°75 215,60Oo
15,600 Sacks 3°60 56,160.
10,5OO Sacks 3.50 36,750.
82,718 Tons 11.50 950,257.
SUB TOTAL $1,971,067o
U. S. GOVERNNKNT PAY~NTS
Sugar Beets (Government Payments)
A.C.P. (Agricultural Conservation Program)
$173,688o
140,000o
SUB TOTAL $313,688o
BEES
Rental Bees 4,250 Colony rentals $2.25 9,563°
TOTAL $2,294,318o
-5-

NURSERY STOCK, CUT FLOI~RS, SEED AND S~UNNARY
NURSERY STOCK
Licensed Nurs ~ies - 261 Branches 23Gross.Sales $4,068,050.
CUT FLOWERS : V~olesale GrowersField (f), Lath (L), Greenhouse (G), and Cloth
Asters (F)Carnations (C) & (G)Chrysanthemums (L)Gladiolus (F)~oses (G)Snapdragons (G)Stephanotis (G)Miscellaneous Cut Flowers -
- - Total sales $1,893,325.
SEED CROPS $ 38,470°
TOTAL $5,998,845.
SUMMARY
Fruits & Nuts .......................
Vegetables ......................
Animal IndustriesLivestock .....................Poultry & Rabbits ................
Field Crops & Bees ....................
U. S. Government Payments ...............
Nursery Stock, Cut Flowers & Seed .............
$46,145,673.
9,707,947.
203365,713.9,646,321.
1,980,630.
313,688.
5,998,845.
TOTAL$94,158,817.
-6-

YEAR TOTALBEARING ACREAGEFruits Prunes& Nuts
PRUNEPRODUCTION TOTAL VALUE
Dried Tons Fruits Agricultural& Nuts Products
1943 101,696 56,5461944 I01~039 56,1151945 100,770 56,1151946 101,O30 55~6651947 99,203 54,4141948 99,198 54,1701949 96,971 51,5901950 86,015 50,0121951 85,062 44,2551952 83,99, 43,3851953 82,174 42,262
76,600 $25,988,766. $46,334,508.71,400 37,092,685. 61,O61,172.95~000 39,870~475. 65,255~971.85,000 50,686,450. 82,664,453.89,000 31,361,198. 69,336~459.
85,450 33,684,737. 73,579,805.70,000 26,933~350. 66,413~561.68,000 42,328,015. 84,138~813.
82,900 40,004,504° 83,478,151.
53,000 37,767,367. 86,O28~863.
82,000 46,145~673. 94~158~817o
Graph #IGraph #2
Gra~h #3Graph #4
GRAPHS 1943 - 1953
Total Bearing Acreage in Fruits & NutsBearing Acreage in Prunes
Prunes Produced - Dried TonsGross Value all Agricultural Crops in Millions of Dollars
100,000
90,000
80,000
70,OOO
60°000
r.~O, O00
40,000
30,000
20,000
10,000
YEAR
f
/
II
I/
/
JI
//
//
%
%
/\/ \
\/
/
J\ ,\ jr
\
\ / ¯
\ / /" \ /,, \ /
/\ / / \" /
T-__!, \ i\ /
/
\ \ \

COUNTY WATER DEVELOPI,~NT
Data furnished by: ~. J o Robert Roll, EngineerSanta Clara Valley Water Conservation District
STORAGE RESERVOIRS :
Leroy Anderson ~eservoir
Coyote Reservoir
Lexington Reservoir
Calero Reservoir
Stevens Creek Reservoir
Guadalupe Reservoir
Almaden Reservoir
AREA
1,450 acres
688 acres
450 acres
329 acres
95 acres
75 acres
62 acres
3,149 acres
MAX. CAPACITY
75,000 ac° fto
24,560 ac. ft°
25,000 ac. fto
9,200 ac° ft.
4,000 aCo ft.
3,500 aco ft.
2,000 ac. ft.143,260 ac. ft.
AREA OF WATER SHED
195 sq. ml.
120 sq. ml.
38 sq° ml.
7.08 sq. ml.
16.86 sq. ml.
6.28 sq. ml.
i1.88 sq. ml.395.14 sq. mi°
PERCOLATION RES~VOIRS :
Alamitos Percolation Pond
Coyote Percolation Reservoir
Vasona Percolation Reservoir
17 acres
32 acres
59 acres
Penitencia Percolation Ponds 4.1 acres
Page Ditch Percolation Ponds 3 acres
CANALS:
Coyote Canal
Coyote Canal Extension
Coyote Alamitos Canal
Evergreen Canal (under construction)
Almaden Calero Canal
Vasona Canal
Vasona Canal Extension (pipeline)
Upper Page Ditch
LENGTH
8 miles
5½ miles
9 miles
lO miles
4½ miles
o! miles~2
2 miles
2 miles
MAX° CAPACITY
i00 cu. ft. per seco
60/10 cu° fro per sec.
50 cu. fro per SeCo
lO CUo ft. per sec.
lO0 cuo ft= per sec°
75 OUo fro per sec.
15 CUo ft° per sec.
40 CUo ft. per sec.
-8-

i,4
I GRICULTU RIlLCROP REPORT
LIBRARYUNIVERSITY OF C~LIFORNIA
DAV25
DAVID T RAYNERAGRICULTURAL COMMI SSIONER
¯Hall of Justice-S, N JOSE, CALIFORN IA
.... II

SAK~A CL~H~A COUNTY DEPART.~NT OF AGRICULTURE
SAN JOSE, CALIFORNIA
DAVID T. RAYN ERAGRICULTURAL COL~:~SSION~R
ANNUAL CROP REPORT
For the Yes~" EndingDecember 31, 195h
Compiled byALB~T ~[. FOSTER
Assistant Agric1~ltural Comm.issioner
FRA~\~ H. T~LL, CO~TNTY ~ECUTIVE
BOARD OF
Walter S. Gasper, Chairman
A. W. Brorm
Sam P. Della 1~aggiore
Ed R. Levin
J. ~. McKinnon
Richard Olson
SUPERVISORS
District
District
District
District
District
5
1
2
3
4
Clerkof the Board

CONTENTS
Introduction
Fruits and Nuts
Vegetables
Animal Industry and Poultry
Field Crops, Bees and U.S. Government Payments
N~rsery Stock and Cut Flowers
Comparative Data 1943-1954
County D’ater Development
Summa~y
STATISTICAL DATA
Page I
Page 2
Page 3
Page 4
Page 5
Page 6
Page 7
Page 8
Page 9
Information furnished by ~.~. Lloyd Weber and I~. Sal ~ilan of the SanJose Chamber of Commerce, and from the County Controller.s office.
Information tsJ~en from the 1950 Census:
Number of farmsTotal acres in CountyCrop land harvestedAcres in hay cropsAcres in irrigated pastureTotal pasture including range land and irrigated pastureWood land total
Development in new industries from 1944 to 1954 incl. :
Total number of new industries - 179Capitol investmentNt~nber of new jobs createdEstimated annual payroll
5,282835,o0o172,508
22,1336,149
317,345123,066
$167,700,00016,612
$ 53~385,920Compared with I00 leading counties Santa Clara County raffles 20th in nation
let in Strawberries - Quantity producedlet in Prunes - Total value and acreage3rd in Pears - Acreage and yield6th in Fruits, Berries, Small fruits and Nuts - By dollar valueCherries - 6th in quantity and 8th in acreageVegetables - 8th in dollar value and 13th in acreage15th in Grapes - Number of vines
infm~gion from Controllerls office:
The total assessed valuation of property of the County, including realestate, improvements, personal property and utilities - $552,18h,985.

COUNTY OF SANTA CLARA-- DEPART~ OF AGRICULTIhqE
Hall of JusticeSan Jose, Califolmia1’~ay i0, 1955
1{r. %V. C. Jacobsen, DirectorState Department of Agriculture
and
Board of Supervisors ofSanta Clara County
Gentlemen:
The following report is hereby submitted, and is incompliance with Section 65°5 of the State AgriculturalCode.
The report covers acreage, production, sz~d value ofall fruit, nut, vegetable, and seed crops; also, livestockand livestock products~ and bees.
The total returns for 1954 are somewhat less than in1953. The difference is largely centered in poultry andlivestock returns, and in the very light crop of apricots,which is our second largest fruit crop.
The figures were compiled from reports received frompersons familiar with the produce concerned. I believ~.they fairly well reflect the gross value to producers.
I wish to take this opportunity to express my thanksto each individual who made this report, possible.
Very truly yours,
DAVID T. RAYNERAGRICULTURAL CO~ESSIONER
DTR :kb
!
Page I
I ........... I llll[lll
CROP
Almonds
ACRZAGE’’BEARING I©K-B
FRUITS AI~D }~UTS
PRODUC TION NO TES UNIT VALUE
178 5 38 Tons
TOTAL VALU]~
500°00 $ 18,000oApples
A0ricots
Avocadoes
Cherries
Citrus
Figs
Grapes
Peaches
Pears
Prickly Pears
Persimmons
Plums
Prunes
VJalnuts
Sf .<tL FRUITS:
Strawberries
Raspberries
Other Push~erries
161
14,586
2
2,754
29
2
4,413
289
8,277
6O
6
180
41,160
8,422
2,249
I!6
36
288
1
821
0
0
125
29
5O8
0
0
2
1,640
654
696
1,288 Tons
25,500 Tons Total25,000 Tons Canned ~ Shipped3,727 Tons Dried2,700 Tons Pits
1,O00 Lbs.
10,O10 Tons Total4,580 Tons Shipped4,680 Tons Canned
759 Tons Bbld@
3,625 ~o:ces
3,030 Flats
13,248 Tons
1,445 Tons
87,379 Tons Total79,720 Tons CannedV,660 Tons Shioned Fresh
25,000 Flats
42,000 Lbs.
208 Tons Canned384 Tons Shipped
90,800 Tons
3,910 Tons
3,352,500 Ctso
150,800 Cts.
338,000 Lbs.
70.00 909160°
ii0.00 2,750,000.800.00 2,981,600..35.00 94~500o
°30 300°
680°00 3,114,400o340°00 1,591,200o298. O0 223~500o
2.15 7,794-0
2.40 7,272.
35. O0 463,680.
55.00 79 ~ 4-75o
67°75 5,241,590o68.50 523~710o
1.50 37~500o
¯ 11 4~620o
50.00 10,400.185.00 71,040.
195o00 17,706,000o
420.00 1,842,200o
Zo30 7,710~700o
2.80 422~240o
.13 43~940oTO TALS 80,884 4,805
’3 3,920.94 ~ ~-4,835,821o
Pa2e 2

VEGETABLE CROPS - 1954
CROP ACRES AVo YIELD TOTAL UNIT GROSS VALUE
PER ACRE PRODUCTION VALUE TO PRODUCERS
Asparagus 150 330 Lbso 49,500 $ o i0 $ 4, 9 50.
Sweet Anise 80 350 Crates 28,000 1@75 49,000.
~eans, GreenCanned 1,866 7.66 Tons 149283 125.00 1,785~ 375o
Market & Frozen 270 6°0 Tons 1,620 167.50 271,350o
Lima, Frozen 5,600 i. 127 5Tons 4,059 152o00 616,968.
~roccoli 560,000.Quick-Frozen 2,000 2°0 Tons 4,000 140.00
Carrots 206 24.5 Tons 5,047 18.00 90,846u
Cauliflower 700 3.5 Tons 2,450 145.00 355,250°
Celery~ Fresh 1,500 800 Crates 12,000,000 io!0 1,320,000.
Sweet Corn 460 270 Crates 124,200 1.70 211,140o
Cucumbers 600 l0 Tons 6,000 55.00 330,000°
Dill i0 9 Tons 90 40°00 3,600°
Endive 150 175 Crates 26,250 .75 19,687o
Garlic 760 7,400 Lbs° 5,624,000 .12 674~880.
Lottuce 1,640 240 Crates 393,600 2.75 1,082,400°
Onions, Dry 230 455 10~L Pags 104,650 1.75 183,137.
Peas, Spring 280 2,050 Lbs. 574,000 ,045 25~ 830.
Fall 300 155 Tubs d6,500 3o 40 158,100 o
peppers, Bell 165 215 Crates 35,475 1.65 58,534.
~’ax 37 4 Tons 148 140. O0 20,7 20.
IIot 6 6 Tons 36 165.00 5,940.
S~inach 256 5o25 Tons 1,344 23.50 31,584o
Tomatoes 1,070 18 Tons 19,260 20.85 401,571o
C om2e ro ial 600 ° O0 1,440,000.Truck Gardens 2,400 per acre
i~ushrooms II0,000 sq. ft~ Beds 100,00G~ .80 50,000.
S 18,736~0 TAL9,7 50~862.
Page 3

ANI~LL INDUSTRIZ8 - 1954
LIVESTOCK
Milk Cows (20,000)?[aA~ket Nilk, grade A?;Tfg. Milk, grade B
Steers
Covgs
Calve s
Heifers
Hogs and Feeders
Horses, RaceSaddle
Butterfat- 5,520,000 lbs." 294, O00 lbs.
Lambs
25,000 head
19,600 head
15,6OO head
7,500 head
4,500 head - 990,000 Ibs.
1,35Ohead - 121~500 lbs.(Note. There are 162 boys andgirls who are menders of the ~HClub owning one or more lambs)
Wool 13,500 lbso
!~anurc 3OO,O00yds.
@ $ 1.28 $ 7,065,600~@ .84 246,960°
@ 180.OO 4,500,000.
@ 142.00 2,783,200.
@ 45.00 702,000.
@ 150°00 1,125~000o
@ .24 237~600o
37,600°i0,000o
@ .20 24,300~
@ .50 6,750~
@ 2.00 600~000.
Sub Total $ 17,339~010o
POI~,TRY AND R/L BITS
Laying Hens 650,O00 305,O00 cases eggs
Heavy Fryers 1,330,000 4,987,500 lbs.
Broilers 383,000 861,750 lbso
Fowl, Cull HensLeghorns 325, 0OO l, 056,250 lbs.Heavy Breeds 40,000 160,000 lbs.
Turkeys 19,800 396, O00 lbs.
Baby Chicks 5,793,000
Squabs 32,000 32 ~ 000 ibs.
Rabbits 35,000 157,500 Ibso
8 <;13.25
@ .26
c~ .255
@ .15© .23
@ .27
@ .18
@ 1,00
@ .235
4,041,250.
1,296,750.
219,746o
158,437.36,800.
106,920.
1,042,740o
32,000.
37,013.
Sub Total $ 6~971~656o
TOTAL $ 24,310~666o

FIELD CROPS
FIELD CROFS~ U.S. GOVERNMENT PAYMENTS AND BEES
ACRES TOTAL UNITPRODUCTION VALUE
GROSS VALUETO PRODUCERS
Alfalfa
Volunteer Hay
Grain Hay
Permanent Pasture
Barley
V~eat
Oats
Sugmz Beets
500 3,000Tons
6,750 6,750 Tons
7,020 10,530 Tons
(Fed to Producers’ Livestock)
4,600 89,260 Sacks
600 9,000 Sacks
400 7,040 Sacks
4,545 86,175 Tons
$24.00
20.00
21.00
2.40
3.60
3.70
10.90
$ 72,000°
135,000o
221,130.
214,224.
32,400.
26,048.
939,307.
SUB TOTAL$1,640,109-
U.S. GOVERIW.~NT PAD~NTS
Sugar Beets
A.O.P. (Agricultural Conservation Program)
SUB TOTAL$ 269,579.
BEES
Rental Bees 5,000 Colonies for Rental Purposes $ 11,25o.
TOTAL$1,920,938.
Page 5
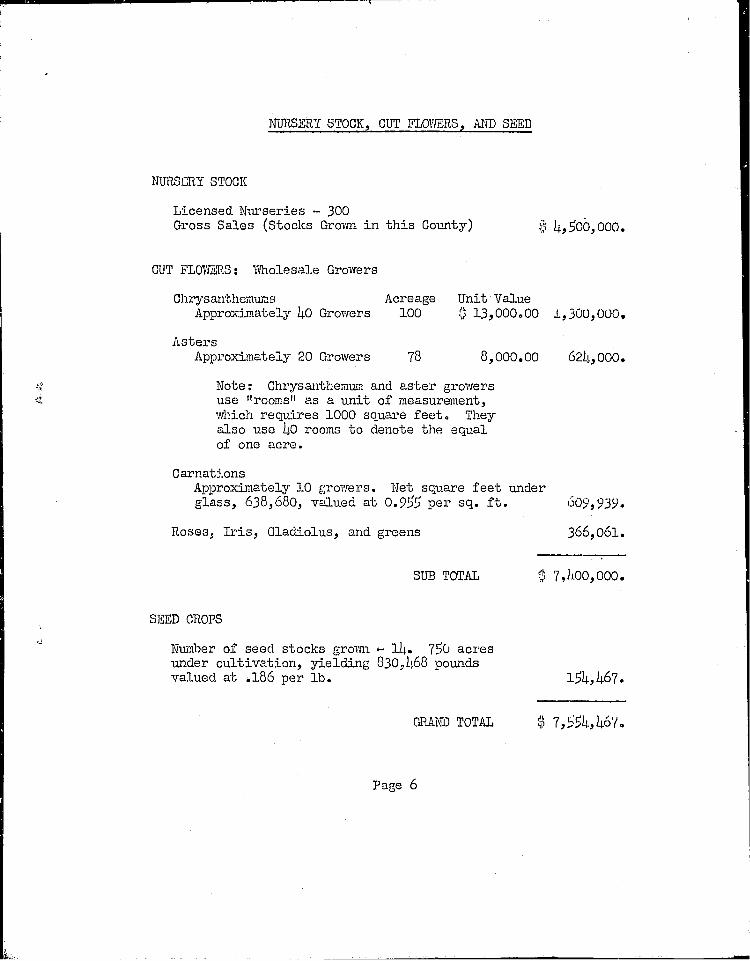
NURSERY STOCK,~ CUT FLOI:~RS~ AND SEED
~/~$’ZRY STOCK
Licensed N1~rseries .- 300Gross Sales (Stocks Grova~ in this County) 4,50o, ooo.
CUT FLO~S: Vfnolesa].e Growers
Chl~. -santhcm~s AcreageApproximately 40 Growers 100
Unit Value13,000.00 ±,300,000.
AstersApproximately 20 Growers 78 8,000.00 62~,, 000.
Note: Chrysanthemum and aster growersuse "rooms" as a unit of measurement,v~ich requires 1000 s~are feet. Theyalso use 40 rooms to denote the equalof one acre.
CarnationsApproximately I0 growers. Net square feet underglass, 638,680, valued at 0.955 per sq. ft. 609,93~.
Roses~ Iris, Gladiolus, and greens 366,061.
SUB TOTAL 7,1.,.00,000.
SEED CROPS
N~mber of seed stocks grova~ - 14. 750 acresunder cultivation, yielding 830~[~68 poundsvalued at .186 per lb. 154,467.
GRA~ TOTAL 7,554,467°
Pa~e 6

YEAR TOTAL BEARING ACREAGEFruits Prunes& Nuts
1943 lOl,696 56.54G19[~ 101,039 56,1151945 iOO~770 56,1151946 101,O30 55,6651947 99,203 54,4141948 99,198 54,1701949 96,971 51,5901950 86,O15 50,O121951 85,062 44,2551952 83,937 43,3851953 82,174 42,2621954 80,884 41,160
/
PRIME PRODUCTION TOTAL VALUE~riedTons Fruits Ag~
& Nuts Products
76,606 $25,988,766. $46,3~ 508.71,400 37,092,685- 61,061,172.
95,000 39,870,475. 65,255~971.85,000 50,686,450. 82,664,453.
89,000 31,361,198. 69,336,459.
85,450 33,684,737. 73,579,805-
70,000 26,933,350. 66,413,561.68,000 42,328,O15. 84,138,813.
82,900 40,004,504. 83,478,151.
53,000 37,767,367. 86,028,863.
82,000 46,145,673. 94,158~817o90,800 ~4,835,821. 88,372,754-
GP~PHS 19~b~ - 1954Graph #i Total Bearin~Acreage ~--~s and Nuts
Graph #2 ...... Bearing Acreage in Prunes
Graph #3 Prunes Produced - Dried Tons
Graph #4 Gross Value all Agricultural Crops in ~iLlions of Dollars
100o000 ~ ---.
60,000
/ "",. ,..%90,000 , .. . o .. -.. ..... .,LF
%% ¯
eo.oooII// "\,,, ""
/ "" ",, / ; ",
70,000 ,/ "~ ~" ~" "~ "" \/
t
50,000~ _
ztO, O00
.I.t" ..Z~"
ss~’
l
I
/o
#
/I
/
3O,000
20,000
10,000
Page 7

SANTA CLAI~I COUNTY WATER CONSERVATION
Data furnished by:
NORTHEP~ PART OF TI~ COUNTY
Nr. J. Robert Roll, EngineerSanta @lara Valley Water Conservation District
STORAGE RESERVOIRS - 7Year
Completed
Leroy Anderson Reservoir 1950
Coyote Reservoir 1935
LexinE~on Reservoir 1952
Calero Reservoir 1935
Stevens Creek Reservoir 1935
Guadalupe Reservoir 1935
A~uaden Reservoir 1935
PERCOLATION RESSRVOIRS- 6
Maximum Area of
Area Capacity Watershed
1,450 Aco 75,000 Ac. Fto 195 Sq. Nio
688 Aco 24,560 Aco Ft. 120 Sqo Nio
450 Aco 25,000 Ac. Ft. 38 Sq. Mio
329 Ac. 9,200 Ac. Ft° 7.08 Sqo Mio
95 Ac. 4,000 Ac. Fto 16.86 Sqo Nio
75 Ac. 3,500 Aco Fro 6.28 Sq° ~io
62 Ac. 2,000 Aco Ft. 11.88 Sqo }~.
3,149 Ac. 143,260 Ac. Ft. 395.14 Sq° Ni°
Alamitos Percolation PondVasona Percolation ReservoirPage Ditch Percolation Ponds
CANALS AI~PIPELINES - lO
17 Acres59 Acres3 Acres
Coyote Percolation ReservoirPenitencia Percolation PondsMain Avenue Percolation Pond
Length
Coyote C~lal 8 ~iles
Coyote Canal Extension 5½ ~lesCoyote Alamitos Canal 9 NilesEvergreen Canal i0 Niles
Almaden Calero Canal 4!Niles
Vasona Canal 2~ MilesVasona Canal Extension (pipeline) 2 Niles
Upper Page Ditch 2 Eiles
Lower Page Ditch and Pipeline 2 Niles
Nain Ave. Percolation Pond Pipeline 1 Nile
32 Acres4oi Acres
IO Acres
~axim~m CapaCityI00 Cubic Feet per Second
60~0 Cubic Feet per Second50 Cubic Feet per SecondlO Cubic Feet per Second
lO0 Cubic Feet per Second75 Cubic Feet per Second15 Cubic Feet per Second40 Cubic Feet per Second10 Cubic Feet per Second25 Cubic Feet per Second
SOUTHERN PART OF THE COUNTY
Elmer J. Chesbro ReservoirProposed Uvas Reservoir on Uvas Creek
Total estimated capacity of the reservoirswhen completed is approximately 17,500 Aco Ft.
Information furnished by Harry Mitchell, Director of P~M,A, office:
Private InstallationsStock Uater Reservoirs - 329 Capacity, 1272 Ac. ~°
Irrigation Reservoirs - 65 CapaciSy, I102 A~coFt.
Page 8

SUmmARY
Fruits and Nuts ¯ ¯ o ¯ ¯ ¯ ¯ ¯ ¯ ¯ ¯ ¯ ¯ o ¯ ¯ o $ 44,835,821
Vegetables . . . ....... . . . . . ¯ . . o 9,750,862
Animal IndustriesLivestock ........... ¯ ¯ ¯ ¯ ¯Poultry and Rabbits ¯ ¯ ¯ ¯ ¯ ¯ o ¯ ¯ ¯ ¯
17,339,0106,971,656
Field Crops ~dBees ..... . . . . . . ¯ ¯ o
U+S. Govermuent Payments ¯ ¯ ¯ ¯ ¯ o ¯ ¯ ¯ ¯ ¯ ®
1,651,359
269,579
Nurser3, Stock, Cut Flowers and Seed <+ ~ . ¯ ¯ ¯ ¯ 7,554,467
TOTAL $ 88,372,754
Page 9
¯ I + I

I

IIGRICULTU RII’LCROP RE i::!ORT
D AV t D T. RAYN EAGRICULTURAL COMM! $SIONEII
’Hall of" Jus:tice ̄SAN JOSE, CALIFORN IA

SANTA CLARA COUNTY DEPARTMenT OF AGRICULTURE
SAN JOSE, CAL~ORNIA
DAV ID T. RAYN ERAgricultural Commissioner
ANNUAL CROP REPORT
For the Year EndingDecember 31, 1955
Compiled byAssistant Agricultural Commissioner
T. J. Moniz
FRANK H. THILL, COUNTY EXECUTIVE
BOARDYear 1956
A. W. Brown
Sam P. Della Maggiore, Chairman
Ed. R. Levin
J. M. McKinnon
Walter S. Gasper
Richard Olson
OF SUPERVISORS
District I
District 2
District 3
District 4
District 5
Clerk of the Board

T. J. Moniz
Arthur W. Appel
Hobart M. Royce
Lloyd F. Piesse
George F. Prole
Gordon Spencer
Eric C. Winkler
Arthur C® Mutzenberg
Chester O. Howe
Mitchell Soso
Edward H. Hetzer
Rex E. Marsh
Donald W. Jack
James M. Cottle
Alfred M. Leon
Edward Ratzak
Thomas H. Auzer
Kathryn I. B~rmingham
Patricia C. Tralongo
DEPAR~ENT PERSONNEL
DAVID T. RAYNERAGRICULTURAL CO~IISSIONER
Chief Deputy Commissioner
Deputy Agri. Commissioner
Deputy Agri. Commissioner
Deputy Agri. Commissioner
Senior Agri. Inspector
Senior Agri. Inspector
Agri. Inspector, Grade II
Agri. Inspector, Grade II
Agri. Inspector, Grade II
Agri. Inspector, Grade II
Agri® Inspector, Grade II
Agri. Inspector, Grade II
Agri~ Inspector, Grade II
Agri. Inspector, Grade I
Agri. Inspector, Grade !
Agri. Inspector, Grade I
Agri. Inspector, Grade I
In Charge Gilroy Branch
In Charge of Standardization
In Charge of Weed, Rodentand Bird Control
In Charge of PlantQuarantine and NurseryInspection
Standardization and InCharge of Seed Inspection
Plant Quarantine andNursery Inspection
Plant Quarantines Nurseryand Apiary Inspection
Plant Quarantine~ andNursery InsF~ction
Plant Quarantine~ andNursery Inspection
Standardization
I~_ant Quarantine andNursery Inspection
Plant Quarantine andNurse~r Inspection
Weed and Rodent Control
Weed and Rodent Control
Weed and Rodent Control
Weed and Rodent Control
St. Stenographer Clerk
Intermediate Typist Clerk
CONTENTS
Introduction
Fruits and Nuts
Vegetables
Animals and Poultry Products
Field Crops and U.S. Government Payments
Nursery Stock, Cut Flowers, and Seed
Comparative Figures of Values for Fifteen Years
SUMMARY
Fruits and Nuts
Vegetables
Animal IndustriesLivestock ProductsPoultry and Rabbits
Field Crops and U.S. Government Payments
Nursery Stock, Cut Flowers, and Seed
Page I
Page 2
Page 3
Page 4
Page 5
Page 6
Page 7
$ 54, 85~, 28o.
9,790,014.
17,143,695.8,684,503.
2,332,508.
8,111,102.
TOTAL $I00,917,102.

COUNTY OF SANTA CLARA
.... "~- .... ...... ;~=~IL DEPARTMENT OF AGRICULTUREDAVID T. RAYNER
HALL OF JUClTIC£ABRII~ULTURAL COMMIf~SIONI~R AND¢tTATI.r PLANT QUARANTIN[ ~]Ff-IO£R SAN dOSE 13~ CALIFORNIA
PHON[ CYImRKBII S’IOSO
April l8, 1956
Mr. W. C. Jacobson, DirectorState Department of AgricultureandBoard of Supervisors ofSanta Clara County
Gentlemen:
In compliance with Section 65.5 of the CaliforniaAgricultural Code, I am submitting the annual cropreport for the calendar year 1955.
This report covers acreage, production, and valuesof fruits, nuts, truck crops, field crops, animal in-dustry, nursery, and miscellaneous crops.
The total agricultural income for 1955 is the P~ghestin history for Santa Clara County, principally due tolarger crops and increased prices for many of the com-modities. The value shown in this report is predicatedon the price paid the producer for roadside delivery, orfirst point of delivery. The figures do not representthe net income to the producer, but do represent thegross valuation.
I wish to express my appreciation and sincere thanksto the many individuals, companies, and organizationsfor their cooperation and assistance in submitting datato make this report possible.
Very truly yours,
DAVID T. RAYNERAGRICULTURAL CO~ISSIONER
DTR:kb
I

FRUITS AND NUTS - 1955
CROPACREAGE
BEARING NON-B PRODUCTION~ITVALUE TOTAL VALUE
Almonds
Apples
Apricots
78 4
134 43
13,347 770
Avocadoes 2 2
Cherries 3,008 1,490
Citrus
Figs
Grapes
Peaches
Pears
34 0
2 0
4,858 162
249 33
6,622 681
Prickly Pears 60 O
Persimmons 6 0
Plums 126 18
15 Tons $700.00
930 Tons-Canned and Shipped 65.00
90,60049,000
I, I005,5oo
10,2505,000
Tons TotalTons Canned 90.00Tons Shipped 130.00"Dried(30,250 Tons Gre~a)66GO0Tons By-Prod. and Frozen 70°00Tons Pits 40.00
375 Flats 3.00
15,2107,2507,080
88O
8,300
3,000
15,786
i,~5
77,82070,5207,300
28,500
2,000
10,500.
60,450.
4,410,000-143,000.
3,630,000.717,000.200,000.
1,125.
Tons TotalTons Canned 280.00 2,030,000.
Tons Shipped 500.00 3,540,000.
Tons Barreled 210.00 184,800o
Boxes 2.75 22,825°
Flats 2.35 7,050.
Tons 42~00 663,012.
Tons 65.00 80,925.
Tons TotalTons CannedTons Shipped
Flats
Lbs. (Crop Failure)
543 Tons Total175 Tons Canned368 Tons Shipped
Prunes 38,308 2,661 68,500
Walnuts 8,512 1,990 3,875
Strawberries 2,297 710 1,010,68060,640,800
67.0060.00
1.55
.12
145
48
Raspberries
OtherBush Berries
Tons Dry
Tons
Crates ShippedLbs. Frozen
60.0024o.oo
26O.00
580.oo
2.68.17
Crates, Frozen and Shipped 3.00217,500
TOTALS
57,600 Crates, Frozen and Shipped 2.10
77,826 8,564
4, 724,840.438,000.
44,175.
240.
10,500.88,320.
17~810,000.
2,247,500.
2,708,622.10,308,936.
652,500.
.... m

VEGETABLE CROPS - 1955
NO.CROP ACRES
AV. YIELD TOTALPER ACRE PRODUCTION
UNITVALUE
GROSS VALUETO PRODUCERS
Asparagus 180
Sweet Anise 129
Beans, GreenCanned 750
25 Crates 4,500
325 Crates 41,925
Mkt. & Frozen600L~m, Frozen 3460
Beets, Canned 57
BroccoliQuick Frozen 2740 2 Tons 5,480
Cabbage 200 350 Crates 70,000
Carrots 69 37 Crates 2,553
Cauliflower 1195 3.25 Crates 3,884
Celery, Fresh 1245 900 Crates 1,120,500
Sweet Cora 356 265 Crates 94,340
Cucumbers 638 I0 Tons 6,380
Dill 7 iO Tons 70
Endive 80 285 Crates 22,800
Garlic 1120 7,800 Lbs. 8,736,000
Lett ace 2178 240 Crates 522,720
Onions, Dry 310 1,000 - 50# Bags 310,O00
Peas 365 I Ton 365
Peppers, Bell 112 600 Crates 67,200Wax 32 7 Tons 224Hot 14 7 Tons 98
Spinach 731 7 Tons 5,117
Tomatoes 3340 21 Tons 70,140
$ 4.00
1.85
$ 18,000.
77,561.
8 Tons 6,000 120.00 720,000.8 Tons 4,800 120.00 576,000.1.5 Tons 5,190 160.00 830,400.
iO Tons 570 25°00
140.00
1.5o
20.00
135.00
I.I0
1.05
54.00
40.00
1.35
.I0
1.75
1.25
8O.OO
2.00147.oo168.00
22.50
22.50CommercialTruck Crops 2400 Value per Acre 1,000.00
Mushrooms 83000 Sq. Ft. Beds 165,250 Lbs. .45
14,250.
767,200.
105,000.
51,060.
524,340.
1,232,550.
99,057.
3h4,520.
2,800.
30,780.
873,60o.
914,760.
387,500.
29,200.
134,400.32,928.16,464.
115,132.
1,578,150.
240,000.
74,362.
TOTALS 22,310$9,790,014.

ANIMAL INDUSTR~S - 1955
LIVESTOCK PRODUCTS
Milk Cows (21,000)Grade A - Market Milk - ButterfatGrade B - Mfg. Milk
Steers 23,500 Head
Cows 20,000 Head
Calves 16,000 Head
Heifers
Hogs
Lambs
Wool
Manure
8,000 Head
4,300 Head - 967,500 Ibs.
2,000 Head - 2000,000 Ibs°
lh,O00 Ibs.
350,000 yards
6,120,OOO ibs. @ $ 1.22 $ 7,466,400.288,000 Ibs. @ .84 241,920.
@ 180.00 4,230,000.
@ 125~00 2,500,000.
@ 64.00 1,024,000.
@ 98.00 784,000.
.25 241, 875.
@ .18 36,000.
@ .50 7,000.
1.75 612,5oo.
Sub Total $17,143,695.
POULTRY AND RABBITS
Laying Hens 781,700
Heavy Fryers 1,402,250
Broilers 407,000
Cull HensLeghorns 353,650Heavy Breeds 50,000
Turkeys Ii,000
Baby Chicks 5,850,900
Squabs 36,500
Rabbits 34,800
441,479 cases ~ggs @ $ 12.89
4,907,875 Ibs. @ .26
i~017,500 ibs° @ .26
1,414,600 Ibs. @ .15250,000 ibs. @ .24
220~000 Ibs. @ .35
.175
36,500 Ibs° @ 1.03
170,200 Ibs. @ .25
$ 5,690,664.
13 276,047.
264,550.
212,190.60,000.
77,000.
1,023,907.
37,595°
42,55o.
Sub Total $ 8,684,503.
TOTAL $25,828,198.
4

F~LD CROPS
F~LD CROPS~ U.S. GOVERNMENT PAkq~NTS " 1955
ACRES TOTAL PRODUCTIONUNIT VALUE GROSS VALUE
TO PRODUCERS
Alfalfa 1,930 11,580 Tons$ 28.00
Grain Hay 10,360 12,950 Tons23.00
Permanent Pasture 5,800 Value Per Acre125.00
Barley 2,550 2,290 Tons2.20 Cwt.
Wheat 75 45 Tons3.50 ~t.
130 135 Tons 2.75 Cwt.
Oats
Sugar Beets 3,350 65,325 Tons10.50
$ 324,24o.
297,850.
725,000.
100,760-
3,150.
7,425.
685,912.
Sub Total $2,144,337.
U.S. GOVERNMENT pAYMENTS
Sugar Beets (Sugar Act Payment)
A. C. P. (Agricultural Conservation Program)
$ 150,126-
38,045.
Sub Total
GRAND TOTAL
$ 188,171-
$2,332,508-
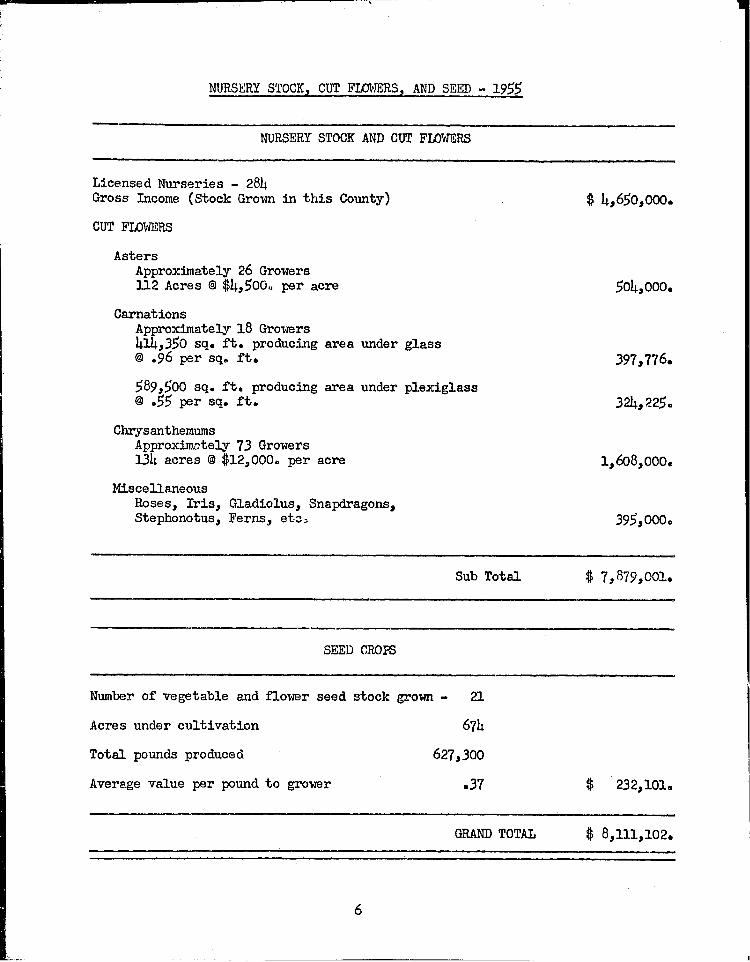
NURSERY STOCK, CUT FLOWgRS, AND SEED - 1955
NURSERY STOCK AND CUT FLOWERS
Licensed Nurseries - 284Gross Income (Stock Gro~n in this County)
CUT FLO~/~S
AstersApproximately 26 Growers112 Acres @ $4,500. per acre
CarnationsApproximately l8 Gro~rs414,350 sq. ft. producing area under glass@ .96 per sq. ft.
589,500 sq. ft. producing area under plexiglass@ .55 per sq. ft.
ChrysanthemumsApproximately 73 Growers134 acres @ $12,000. per acre
MiscellaneousRoses, Iris, Gladiolus, Snapdragons~Stephonotus, Ferns, et3~
$ 4,65o,ooo.
504,000.
397,776.
225.
1,608,000,
395,000.
Sub Total $ 7,879,001.
SEED CROPS
Number of vegetable and flo~r seed stock grown - 21
Acres under cultivation 674
Total pounds produced 627~300
Average value per pound to gro~r .37 $ 232, I01,
GRAND TOTAL $ 8,111,102.

iI ,!oH
,,:¢
0
r..)~
0"J
-’4
I

I I

’I, °~ ¯ ,
e
tJUN 13 1957
LIBRARY
D~VID T. ~AYNF=.RAGRICULTURAL COMMISSIONER
¯ ,,227 N. First Street"SAN JOSE, CALII:’ORN I A

COUNTY OF SANTA CLARA
DAVID r. RAYNER DEPARTMENT OF AGRICULTURE
AGRICULTURAL I~-OMMISSION£R AND,~27 NORTH FIRgT STREET
STATE: PLANT [OUARANTINI~ I’IFF’ICER SAN dOSE 13, CALIFORNIA
PHON£ CYPR£SS 5"1050
April 18, 1957
Mr. W. C. Jacobson~ DirectorState Department of AgricultureandThe Honorable Board of Supervisors ofSanta Clara County
Gentlemen:
In accordance with Section 65.5 of the California AgriculturalCode, I am submitting the Annual Crop Report for all crops grown inSanta Clara County during the year 1956, including animal industryand its products, nursery and the cut flower business.
An earnest effort has been made to make this report as accurateas possible, by checking our figures wibh nany sources of information,and in presenting it in a form thatwouxd be most helpful. Your atten-tion is directed to the detailed information given for each crop. Wehave given the bearing and non-bearing acreage of all fruit crops, acre-age of other crops, average yield per acre, total production, averageunit value, and total value.
The total agricultural income for 1956was slightly lower than theprevious year, due maLnly to lower prices received for walnuts, and alarge crop of sms31 prunes. The gross income for the animal industrywas also affected by lower prices.
The valuation figures shown in this report are the Toss receiptswhich the producer received for roadside or point of first delivery.The cost of the containers is included in the unit value of some com-modities. They are readily identified by the asterisk immediatelyfollowing the unit value figure.
l wlsh to take this opportunity to express my appreciation andsincere thanks to all who have made this report possible by makingtheir records and data available to the members of my Department.
Very truly yours,
DAVID T. R~YNERAGRICULT~PRAL CO~ISSIONER
DTR:kb

SANTA CLARA COUN~ DEPARTMENT OF AGRICULTURE
SAN JOSE, CALIFORNIA
DAVID T. RAYNERAgricultural Commissioner
ANNUAL CROP REPORT
For the Year EndingDecember 31, 1956
Compiled byAssistant Agricultural Cc~missioner
T. J. Moniz
HOWARD W. CAMPEN, COUNTY EXECUTIVE
BOARD OF SUPERVISORSYe~1957
Sam P. Della Maggiore, Chairman
A. W. Brown
Ed. R. Levin
Orau L. Slaght
W. L. Hubbard
Richard Olson
District 2
District I
District 3
District h
District 5
Clerk of the Board

T. J. Moniz
Arthur W. Appel
Hobart M. Royce
Lloyd F. Plesse
Gordon G. Spencer
Eric C. Winkler
Arthur Co Mutzenberg
Chester O. Howe
Mitchell Soso
Rex E. Marsh
Herbert H. Vail
Keith K. Slaughter
James Eo Cox
James M° Cottle
Alfred No Leon
Edward A. Ratzak
Thomas H~ Auser
Kathrya I. Birmingham
Patricia C. Tralongo
1957DI,,~PART~.,~NT PERSONNEL
DAVID T. RAIq~ERAGRICULTURAL CO~TISSIONER
Chief Deputy Commissioner
Deputy Agri. Conmlissioner
Deputy Agrio Commissioner
Deputy Agri. Com~.ssioner
Senior Agri. Inspector
Agri.. Inspector~ Grade II
Agrio Inspector, Grade II
Agri. Inspector~ Grade II
Agri. Inspector, Grade II
Agri. Inspector S Grade II
Agri~ inspector~ Grade Ii
Agri~ Inspector~ Grade II
Agri. Inspector, Grade II
Agri® Inspector~ Grade i
Agri. Inspector~ Grade I
Agri. Inspector~ Grade I
Agri~ Inspector, Grade I
Field told Orchard
In Charge Gilroy Branch Office
In Charge of Standardization
In Charge of Weed, Rodentanl Bird Control
Standardization and InCharge of Seed Inspection
Plant Quarantine andNursery Inspection
Plant Quarantine, Nurseryand Apiary Inspection
Plant Quarantine, andNurseiv Inspection
Plsnt Quarantine, andNursery Inspection
Plant Quarantine andNursery Inspection
Plant Quarantine and NurseryInspection~ Gilrey Office
Standardizs:bion
Plant Quarantine andNursery Inspection
Weed and Rodent Control
Vfeed and Rodent Control
Weed and Rodent Control
Weed and Rodent Control
St. Stenographer Clerk
Intermediate Typist Clerk
..... |

Fruits and Nuts
Vegetables
Animals and Poultry Products
Field Crops and U.S. Government Payments
Nursery Stock, Cut Flowers, and Seed
Comparative Figures of Values for Fifteen Years
SUMMARY
Fruits and Nuts
Vegetables
Animal IndustriesLivestock ProductsPoultry and Rabbits
Field Crops and U.S. Government Payments
Nursery Stock, Cut Flowers, and Seed
Pages i and 2
Page 3
Page 4
Page 5
Page 6
Page 7
$51,621,955.
12,252,637.
2,270,102.
8,648,229.
TOTAL $98,268,345.

FRUITS AND NUTS - 1956
CROP BEARING NON-B PRODUCTION
TOTALVALUE TOTAL VALUE
Almonds 78 26 13.5 Tons $775.00 $ 10,462.
Apples 151 26 793498295
Total TonsT. Canned 62.50 31,125.
T. Shipped I15.0@~ 33,925.
Apricots 13,120
Avocados 2
735 61,11534,640
65o20,6255,200
3,078
Total TonsT. Canned 120o00 4,156,800.T. S~dpped 140. OCt* 91,000.
T. (Dried-3750) 960.00 3,600,000.
To By-Productsand Frozen I05.C~ 546,000.
T. Pits 120.00 369~360.
2 400 Flats 4~50 I, 800.
Cherries 2,991 1,257 17,4306,5208,5oo1,0101,400
Total TonsT. Canned 260.00 !,695,200o
T. Shipped 425.00* 3,612,500.
To Barreled 220.00 222,200.
To By-Products 200.00 280,000.
Citrus 30
Figs 2
Grapes 4,784
Peaches 134
O 7,500 Boxes
0 1,750 Flats
23 19,136 Tons
7 1,695 Tons
4.00 30,000.
2070 4,725.
45~00 861,120.
63.00 I06~785.
Pears 6,673 553 72,800 Total Tons60,690 To Canned 73.00
8,230 T. Shipped 70.00+
3,880 T. By-Products 52.00
4,430,3~0~570,100-201,760o
Sub Totals 27,965 2,629$20~ 861, 232.
. Includes Container Cost.+ Indicates Shipped, an~or sold at local stores mld roadside stands°
I

FRUITS AND NUTS - 1956CONTINUED
CROP BEARING NON-B
TOTAL
PRODUCTION VALUE TOTAL VALUE
~rsimmons 6 0 30,000 Pounds $ .12 $ 3,600.
Plums 117 12 415 Total Tons75 T. Canned 50.00 3,750.
340 T. Shipped 175.00" 59,500®
Prickly Pears 60 0 34,000 Flats 1.55" 52,700.
Prunes, Ft. 33,8~ 2,341 80,000 Tons Dry 165.O0 13,200,000.
Sug. 1,824 42 2,200 Tons Dry 300.00 660,000.
Imp. 1,159 30 2,250 Tons Dry 300.00 675,000o
Walnuts 8,309 I~I15 4~750 Tons 460.00 2,185,000.
Strawberries 2,587 930 1,852,200 Crates Shipped 2.35* 4,352,670.
80,000 Crates 2.75* 220,000.
61~683,300 Peunds Processed .145 8,944,078.
Raspberries 89 55 8o,7oo Crates Shipped 3.35* 270,345.
5,800 Crates 3.50+ 20,300.
265,000 Pounds Processed .22 58,300,
Blackberries 20 I 3,500 Crates 2.40*+ 8,400.
210,000 Pounds Processed .14 29,400.
Yeungberries 3 O 5,100 Crates 2.60*+ 13,260.
Boysenberries I 0 1,700 Crates 2.60*+ 4,420.
TOTALS 75,984 7,155 $51,621,955.
. Includes Container Cost.+ Indicates Shipped, an~or sold at local stores and roadside stands.
2

VEGETABLE C~0m - 1956
NO.MOP ACRES
AV. YIELD TOTALPER ACRE PRODUCTION
UNITVALUE
GROSS VALUETO PRODUCERS
Anise, Sweet 95 400 Crates 38,000
Beans~ GreenCanned 880Mkt~ & Frozen 450Limas 3,950
Beets, Canned 27
Broccoli 2, 900
Cabbage 220
Carrots 90
Cauliflo~mr 1,350
Celery 1,300
Corn, SwEet 325
Cucumbers 700
~i11 4
Endive 90
Garl~ ~, 1,O80
Lettuce, Head 2~500~ 250
Onions, Dry 300
Pe as I, 620
Peppers, Bell 135Wax 28Hot 9
Spinach 675
8 Tons 7,0408 Tons 3,6001.75 Tons 6,913
7 Tons 189
2 Tons 5,800
350 Crates 77,000
40 Tons 3~600
3 Tons 4,050
900 Crates 1,170,000
250 Crates 81,250
I0 Tons 70,000
IO Tons 40
600 Crates 2 Dz. 54,000
8300 Pounds 8,964,000
250 Crates 4 Dz. 625,000500 Crates 2 Dz. 125,000
10OO-50# Bags 300~000
1.3 Tons 2,160
260 Crates 35,1007 Tons 196
7 Tons 63
7.3 Tons 4,928
TomatoesCannery 4, 300idle 165
19 Tons 81,7004500 Lugs 742,500
Misc. CommercialTruck Crops 2,300 Income per Acre
Mushrooms 115,300 Sq. Ft. Beds 187,939 Lbs.
$ 1.50,
117 ̄ O O118.00160.00
25.00
13o.oo
1.25"
20.00
130.00
I.O0-
1.00-
55.00
4o oOO
°85*
.I0
1o35"°90*
l.OCB~
85.00
1.40"14o.ooII0.00
Z~oOO
22.5OI°00"
650.00
o48-
$ 57,000.
823,680.424,8oo.
1,106,080.
4,725.
754,000.
96,250.
72,000.
526,500.
1,170,000.
81,250.
385,0oo.
1,600.
45,9o0.
896,400.
843,750.112,500.
300,000.
183,600.
49,000.27,440.6,930.
118,272.
1,838,250~742,500.
1,495,OO0-
90,210.
TOTALS 25,746 $12~ 252,637.
.Includes Container Cost3

AN~AL INDUSTRIES - 1956
LIVESTOCK PRODUCTS
Milk (20,750 Cows)Grade A - Market Milk - Dutterfat 6,100,000 Ibs.Grade B - }~fg. Milk 235,000 Ibs. @
Steers 22,000 Head Av. Wt. 950 lbs.20:,900,000 Ibs@
Cows 18,500 " " i, 1050 " 19~425,000 "
Heifers 7,800 "(Yrlng) " 675 " 5,265,000 "
Calves 12,500 ,,(Wnrs.) " 400 " 5,000,000 "
Vealer Calves 2,000 " " 175 " 350,000 "
Hogs 3,800 " " 225 " 855~000 " @
Lambs 1,800 ’Q " I00 11 180,000 " @
12,600 " @
380,000 yds@
$1.3o lb. $ 7,930~000-.9O lb. 211,500.
¯ 17 lb. 3,553,000-
@ oi0 " 1,942,500.
@ .16 " 842,400-
@ .17 " 850,000.
@ ~20 ,I 70,000-
¯ 175" 29,625°
.18 " 32,400.
°52 " 6,552.
2.00 ydo 760,000.
$16,347,977 o
Wool
Manure
Sub Total
POULTRY AND RABBITS
Laying Hens 680,000387,000 oases eggs @ $11o80 $
Heavy Fryers 1,350,0OO Av. Wt. 3.25 Ibs. 4,387,500 ibs.@ .23 Ibo
Broilers 360,000 ,0 , 1.75 " 630,000 ,I @ .22 ’~
Cull HensLeghorns 325,000 " ’ 3.50 " 1,137,500 " @ .14
Heavy Breeds 45,500 " ’I "~ " 227,500 ~ @ .22 "
Baby Chicks. 5,800,000 "~ @ o16 ea~
TurkeysToms 18,3OO " " 27. " 494,000
Hens 14,200 " ’ 16. " 227,200
Squabs 44,300 " " I. " 44,300
Rabbits, Fryers 30,000 " " 4.25 " 127,500
Ste~ers 600 " " 9- " 5,400
4,573,680¢
1,O09,125.
138,6oo.
159,25o.50,050°
928,ooo.
,1 @ .261b~ 128,466-
" @ .27 " 61,344o
" @ 1.05 ea. 46,515.
,, @ .25 Ibo 31,875-
o, @ .I0 " 540.
Sub Total $ ~,127,445.
TOTAL $23,475,422.

FIELD CROPS, U.S. GOVERNMENT PAYMENTS - 1956
FIELD CROPSAV. YIELD TOTAL
ACRES PER ACRE PRODUCTIONUNIT GROSS TOVAL~ PRODUCERS
Alfalfa i, 875
Grain Hay 9,250
Permanent Pasture 5,600
5 Tons 9,375 Tons
I Ton 9,250 Tons
Value Per Acre
Barley 2,400 15OO Lbs.
Oats 120 1500 Lbs°
Wheat 58 1700 Lbs.
Sugar Beets 3,337 23 Tons
i, 800 Tons
90 Tons
50 Tons
76,751 Tons
$ 27.00 $ 253,125.
25.00 231, 250.
125.O0 700,000.
2.25 Cw%. 81,000.
3.oo c~t. 5,400.
3.50 C w%. 3,500.
IO.00 767,510o
Sub Total $2,041,785.
U. S. GOVERNMENT PAYMENTS
Sugar Beets (Sugar Act Payment)
A. C. P. (Agricultural Conservation Program)
$ 139,766.
88,551.
Sub Total $ 228,317.
GRAND TOTAL $2,270,102.

NURSERY STOCK~ CUT FLOWERS AND SEED - 1956
NURSERY STOCK AND CUT FLOWERS
Licensed Nurseries - 322Gross Income (Stock Grown in Santa Clara County)
CUT FLOWERS
Asters:21 Gro~rs86 Acres @ $39250. per acre
Carnations:25 Growers
Glasshouses -Plastic Houses-Cloth Houses -
Producing Area557,000 sq. ft. @ .80 per sq. ft.672,000 sq. ft. @ .67 per sq. ft.244,000 sq. ft. @ .45 per sq. ft°
Chrysanthemums83 Growers
Producln$ AreaGlasshouses - 141,000 sq. ft. )Plastic Houses- 892~000 sq. ft. ) 189 acres @ $7,500. per acreCloth Houses - 7~230,000 sqo ft. )
Roses3 GrowersGlasshouses - 180~700 sq. ft. @ $1.52 per sq. ft.
MiscellaneousIris, Gladiolus, Snapdragons, StephonotusFerns, Tulipsj Csm~llias~ etc.
$5,315,000-
39,500.
445,600.450,240.109,8OO.
1,417,5OO-
274,664.
55,000.
Sub Total $8,347,304.
SEED CROPS
Number of agricultural, vegetable, and flower seed stock grown - 26
Acres under cultivation595
Total Pounds Produced699,825
Average value per pound to grower.43 $ 300,925.
GRAND TOTAL $8,648,’229.
6
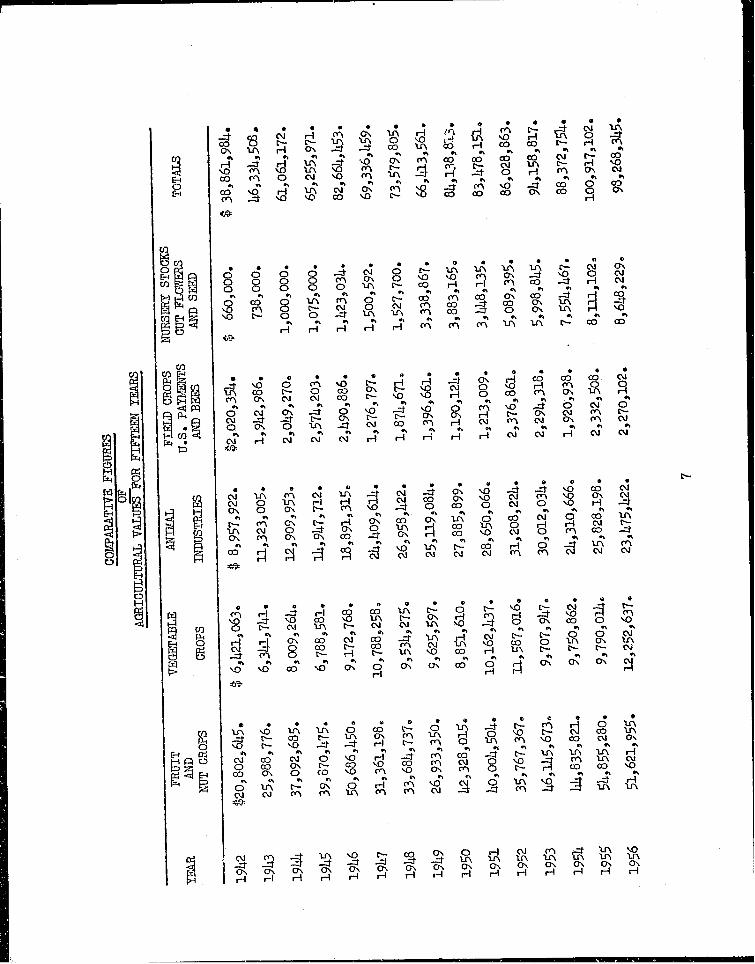
~o
~9
H~
’ ii m--

/ 57
’ fIG I(IILTURIlI=I’ CROP REPORT!I!
!!!
| ,aNIVERSITY OF CALIFOI~N~DAVIS
MAY ’> "5 ]~0,3
DAN t ~ i. ~,-.,AGRICULTURAL COMMISSIONER
¯ 227 N. First" Street.SAN JOSE, CAL~FORN IA
COUNTY OF SANTA
[)AVID T RAYNER
.%i;,~;~ HL iiH,~.t I~ [IMMIBBIONER ANDi:r~.l t’1 ^Nr QLIAI~ANTINE BFFt12’EIt
CLARADEPARTMENT OF AGRICULTURE
227 NORTH FIRST STREET
EIAN dOBE 13, []ALIFORNIA
Apr~1 30~ 1958
I[
I
D
l::’~ "’ C~ Jacobsen~ DirectorSt : c~ De;xartment o.f Ag%.iculture
Ti-~ Kono:’able Board of Supe~zisorsc, ~ tof o<~n ~a Clara County
Oc .%tleme n:
Section 65.5 of the Agricultural Code requires t~e AgriculturalCo::~nissioner to compile a report on the condition, acreage, production
and value of the agric~_Itural products of the comity. In accordancewith this requirement, ! am submitting the 1957 Agricultural Crop
R=por~ for S.m%ta Clara County.
The figures shown in this year’s report represent the gross receipts
to the gro~r at the point of production. Th~. valuss received are for
the products only~ and do not include container costs.
On this basis~ the gross return to the prod,.~oers for the commoditieslisted in this 1957 report amounts to $81~,579~9"19, as compared to$98; 268,3[~5 for 1956o The str~cingly large decrease in the total valueof our 1957 agricultural production was due mainly to lo~r prices, andin some instances~ lo,;~er production due to decrease in acreage and con-siderable crop dmuage from adverse weather conditions. It reflects,also, the deletion of the cost of containers which ~<as previously in-
cluded in the value of irony crops~
Increased production and better prices accounted for higher valuesin some crops. Nmnely~ peaches, plums, walm~t:i% pole beans, cucumbers
and cut flowers.
I ~.rish to express my sincere tharflcs to the many individuals andorganizations who so willingly contributed the l~formaulo which made
the compilation of this report possible.
Very truly yours,-)
l 1 :,I
¢
DAVID T. R,%.¥1’~RAGRICULTUF~L CONIqISS ION’~r~

0
0
t~0 ~
o
-ri
ir-i
J
o
,rJ
,la
J
o
r~o~o
Jzo

0.,0
0
|

ooo
o,r-t
0) e~N 0

IIIIIII
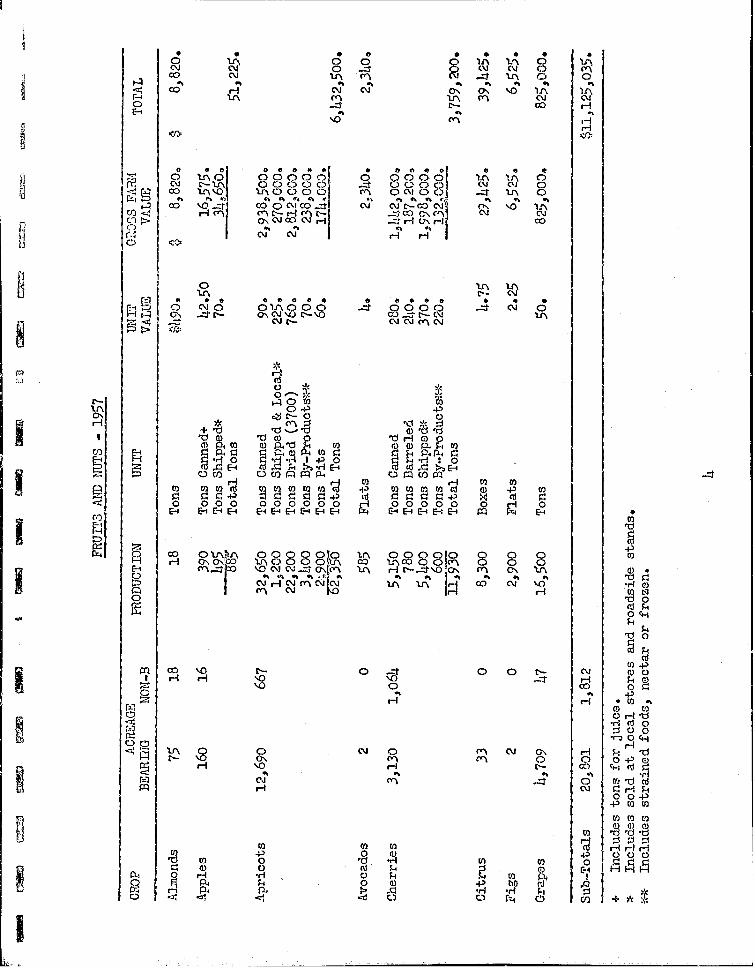
o
c~ ~:>oo
Aom
I
m~
,o
c~coco
o
0 -~
L’,-,.
c~
i--I
oooooi ~, ooool
0~.1~~ ,m, ~ ,,’,
oo
o~ ~ I ~ H I
o’x
0
_4% o~+,+ - +%+ _.++...+oo° .oy.~@Jl~ O,J OJ C’?’X OJ
0[-.+
¯ 0
oo o
~o~o..+.-~
~P+- o. ,.+. o
~,,o ~+o
coi-I
$
0
c,+4
p..
o
’u,x
’,o
c~
80
oJ
0
c,,Ico
o~
o~ooooo.~o ~ ooooto o¯ r~o 0 0 0 l~r~ ~ooo~ 8 o
o,J i+,0 r-.I
co ~0 P-- 0 ~ 0 0 t’~’~0 0
i-I
",,or--I ~0 ~-I p..-
c~ ~ ..~i-I
t,.., .+ ,,?,o ~P..I .r-t o P..+I ~ ml
o
f-I
t~r...I
,+,i~O’+l
-rlt~
o
++t~
r--I o~,,,,+ ..~
¯ O"J
.--0o
O
o o¯ ~ tam (0
gm ,t. ~
blo
o
~2"-d00
0

!
o
o~D
@
e%coo4r~
o o o
m
oc~
o oJ o|
¯ H,C~ 0(~,C ~E-~
0 0 0 0
p,.
0
80
0
0
¯ ~ 0
o o
m
p,.
m
8o
0
ID
o
0
poo~
’u-,~ co 0,4
0 ’u~ ..~t}
t-- e-t ~’q
~o
0000
e~o,I
~lao OlOa
c~oo
o4
02
c~oo
e~03
,,2
I0
o
8--,-I"
co
o,I
I0
,-I

I!I!
lI!
!
I
’L~¢~,,.%
3 ,-4(Xl
c~
o0%co L’--r-4
¢"-- ’,,0 0,, 0", ¢’"’,.0 "Lr~ r-Ir"l
0,1~o
¯ ¯r-i
o~-,~
.+
o
"0 ¯
0-,
o %
a~!+
ox
o’u’~ox r-t
0
"rq
L",-..r--t
r~ r~ ~
o % % %0~o o o
co
0 o~ 0
o ._~ ~oo~
tO c~
(1) ’~¯ r-I ~
’r~.~%
r-4 ~
o,rt
o
o
ncl
H
4
lfl
oo
r.-t
r-4oto
m

|
0
0
0m-lH
r.~
~~ooo~o~
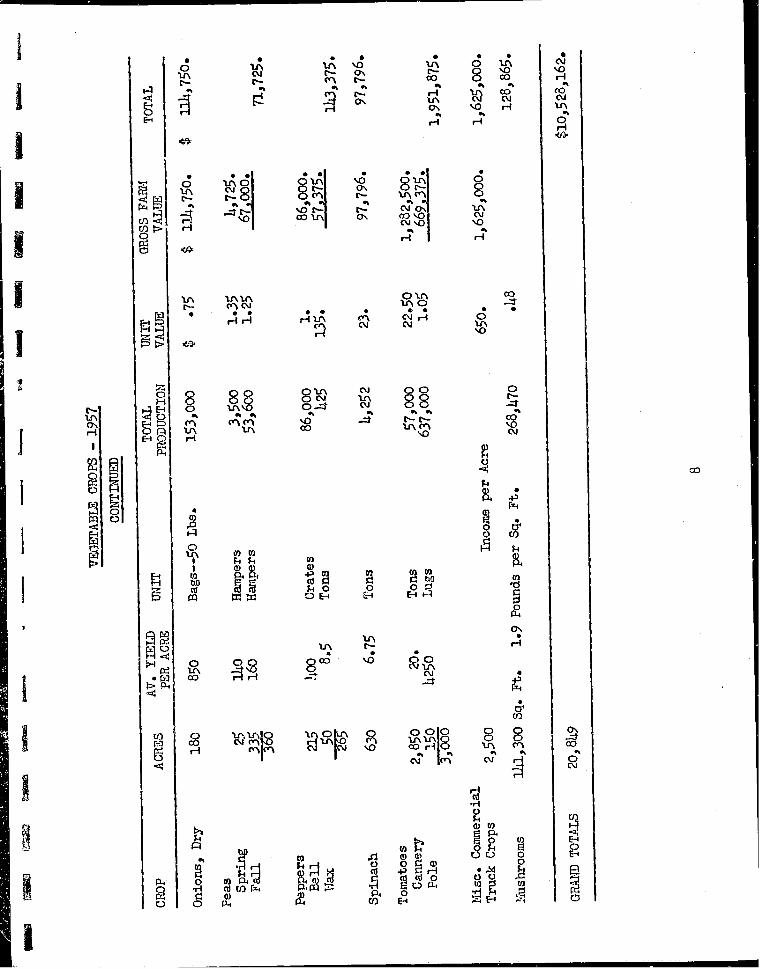
t=-
I
0r.b
H
Ct
r~
0
0 [’,,.-, o~o% c,,,-
%0 c,-. c,.-co ~ co ,,,0
£M,,o
c--- (Y~ o,I ® ¯
o,l 0
~ 8o~. ~ ~ 8r4
I~:)
oo
.-?
co
%O ,M
,S8oa",0,H"
,Sco
Q
0D..-
%0@J
0

E-~
0H
8p-,
o
’,o
0 ¯
O088
c~
1 4.~
!
4 ~ o ~
._4
¯ ¯ ¯ ¯
08808008
8 N ~"
8oO
d
o ° 8 ~° °,oo 8 ~ o ~
tll
r/l¯ ~ ~ ~ ~ .,
o,o ~-I
~2.-=t
8co O.---t O
¯ . ~ ¯
a ~ ~ g0 08 8 o 8
o
o,, rl ~,4
~ 8
o 0o o0-, .-.-t
~ ~°
-Ogo
"d
e-t
’,o
’,Dr-I
o
o

i||l|II
I!!1m
t
,q
o
. .~ F.71
03 -++4
0"
o
m
E--~’
0ooo
@
8oco¢~o~
t~- o ~+ oco oJ pc% O ~r~ "u~ o~
" ~co ,-~ ~-I Go rl
Ne o ¯ e i~
cO ¢:~ 0\| 0 -.,+++’a ..... q ,o+ Ico ~ co
rH rqt-I r-IO~ O ~ +--I¯ ¯ Ii
,-H
bO
0cr
o oo ~ o o~,o~R O OO ~.>+ ~ O 0 V-.- 0
Oo~
~r~ ~- o~ ~-- .-~" O*~ ~"
m ~M M o o ~8
o o o8 o oo o ooo8 o° o o ,~
~o o¯ H ta ~ ~t~
o ~++ +0 :+~ .,.=, ~, ,-: ~:;

|lI
||
|
¢,,_¢-!
!
E-

|
iI!
o
"’°l0~oo o o
rift|
o
8o
0
!
I0
o
00
t"-..
c~0o
o
t--410’ll
0
0gl
0
0,1rt
o
o
0
D~0
et
~0(xl
0
&0
@
O3Odvx
o~o ¯
.p
o %
o%t~
ill
o
o
:d
0
rt
8
o
o
o
o
om
03
0 ,
¢00
N
o I0 I
cM
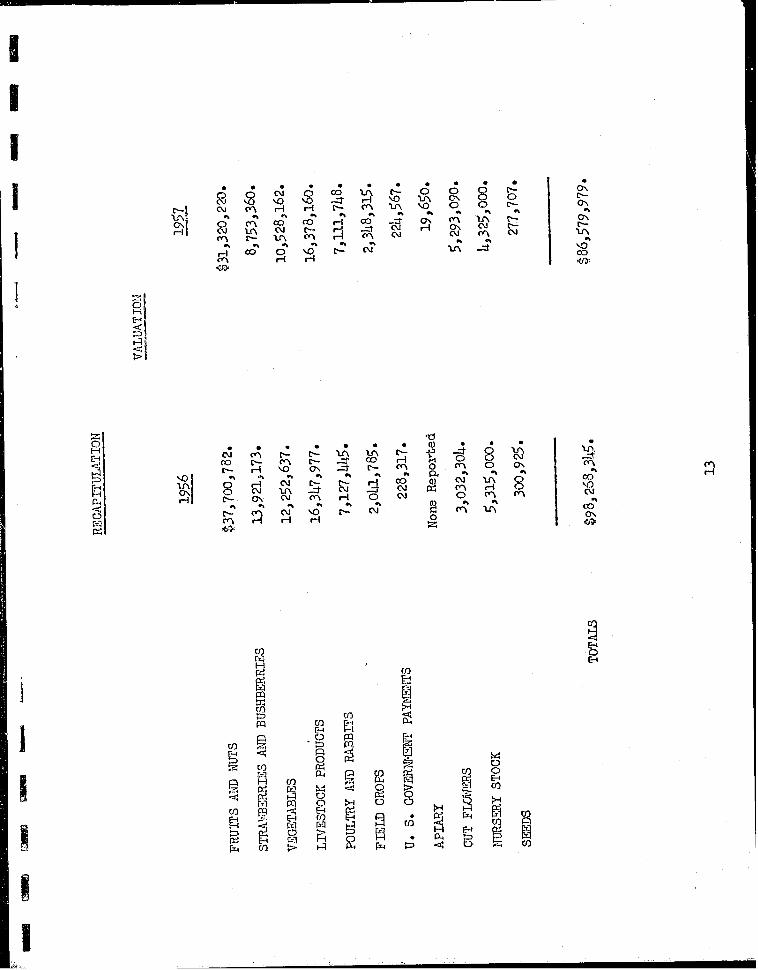
c~OxOx
~0~o
~,q # ¢-~ ~ or-t ~ O~ ~ ~ 0 e,~ 0 0~.
0,1 "krX ..:J" e~l 1~ e,~ ,--I 0
~ ~ ~ ~ o
i-r-~
,~/.’)
,<g’~
e-I
I11I
~S~
o 0
~o
f]

tti11i1
i1
|
t t t t ! I t
f-4
~ ...# ...# ~
co ~.1
# o .,., o,, ° 8
O3 ~1 ---1"
~1~ 0
~l°
~i°
r.,lm ~
N
o
,..? ,--? ~ o,,Q
o~~ -
°o
~ ~ ~ ~

iiI|I!!
1l1!
||!
1
.1~i
i,--,!I-,41
I-,<1
I---<,
T..~,H,g,
-* p1 I~,
~m
MN ~
mo
.~ r2
c
° (r.l
~m
~0 o4 ox~o8 ~ °, ~q ~r,- co rt r-t e~ co ~
co r~ ~ o~ ~ ~ ~o ~ co
co o~oc~ ~D "o o~ ~ o ~- co ~0 0
ox o c,~
~.~ 0 ~ o o~ ~ ox 0 o o’~ r-,I co co o~
r-’~ ,-’I r’~ ,’-I ,’-’I r"l ~ rH rq ,’~ ,’--I
!