classification models of students’ moods during an … models of... · classification models of...
TRANSCRIPT
50 Int. J. Knowledge and Learning, Vol. 5, No. 1, 2009
Classification models of students’ moods during an online self-assessment test
Christos N. Moridis* and Anastasios A. Economides Information Systems Department University of Macedonia 156 Egnatia Avenue Thessaloniki, 54006, Greece E-mail: [email protected] E-mail: [email protected] *Corresponding author
Abstract: A student’s emotional state is crucial during learning. When a student is in a very negative mood, learning is unlikely to occur. On the other hand, a too-positive mood can also impair learning. Thus a key issue for instructional technology is recognising the student’s mood, so as to be able to provide appropriate feedback. This paper introduces student’s mood models during an online self-assessment test. Two models were evaluated using data emanating from experiments with 153 high school students from three different regions of Greece. The results confirm the models’ ability to estimate a student’s mood.
Keywords: affective computing; affective learning; computer-based testing; mood recognition; self-assessment test.
Reference to this paper should be made as follows: Moridis, C.N. and Economides, A.A. (2009) ‘Classification models of students’ moods during an online self-assessment test’, Int. J. Knowledge and Learning, Vol. 5, No. 1, pp.50–61.
Biographical notes: Christos N. Moridis received a Bachelor’s degree in Communication, Media and Culture from the Panteion University of Athens, Greece in 2004. He received an MSc in Advanced Systems of Computing and Communications, specialising in Intelligent Systems, from the Department of Electrical and Computing Engineering, Polytechnic Faculty, Aristotle University of Thessaloniki, Greece in 2007. Currently, he is a PhD student at the Information Systems Department of the University of Macedonia in Thessaloniki. His research interests include affective learning systems, emotional agents, fuzzy systems, interface design and search engines.
Anastasios A. Economides received a Dipl.Eng. degree in Electrical Engineering from the Aristotle University of Thessaloniki, Greece in 1984. With a Fulbright and a Greek State Fellowship, he received MSc and PhD degrees in Computer Engineering from the University of Southern California, Los Angeles, USA in 1987 and 1990, respectively. At graduation, he received the Outstanding Academic Achievement Award from the University of Southern California. Currently, he is an Associate Professor and Chairman of the Information Systems Department at the University of Macedonia,
Copyright © 2009 Inderscience Enterprises Ltd.
Classification models of students’ moods 51
Thessaloniki, Greece. His research interests include networking technologies, e-learning and e-services. He has published over 150 peer-reviewed papers. He has been the plenary speaker in two international conferences.
1 Introduction
Affective neuroscience and psychology have produced much evidence in support of the strong connection between emotion and cognition, emphasising the fact that emotion is indispensable in decision-making and learning procedures (Goleman, 1995; Bechara et al., 1997; Damasio, 1994; 2003). Moreover, knowledge implies a deeper emotional, psychological and social involvement of individuals (Angehrn, 2005; Choudrie and Selamat, 2005). However, the extension of cognitive theory to explain and exploit the role of affect in learning is in its infancy (Picard et al., 2004). The research community, though, is increasingly acknowledging that emotions play a crucial role in human learning procedures (Picard et al., 2004). As a result, during the last decade artificial intelligence in education has been trying to integrate emotional factors into computerised learning systems. If the system can reason about the affective state of a user from the input that the system receives, appropriate feedback could be displayed in a way adapted to the emotion or the mood of the user. Besides, the learning flow corresponds to the archetype of human behaviour that action and feedback promote understanding and adaptation to the environment (Lytras and Sicilia, 2005).
Emotion, feeling and mood as affective roots (Forgas et al., 2005) are three significances which partly cover each other, but which are also considerably different. One should seriously take into consideration these differences when addressing instructional issues. Damasio (1994; 2003) provided a clear distinction between emotions and feelings. In particular, he distinguished between the physical state of the body (the emotion) and the perception of that emotion (the feeling). An emotion is transformed into a feeling in the same way as a stimulus becomes part of human consciousness. An emotion could be considered as a stimulus that acquires intellectual qualities and therefore becomes a feeling, which is consciously evaluated. This order is actually reversed by other approaches (Gratch and Marsella, 2004), including this paper, which call an emotion what Damasio would consider a feeling.
Mood and emotion also have common features, but also have distinctions (Larsen, 2000). Emotion and mood share three basic characteristics:
1 They are subjective experiences.
2 They are expressed through human communication channels.
3 They have a bodily impact.
On the other hand, emotion and mood are distinct at four basic points:
1 duration and intensity
The duration is a characteristic of the mood, while the intensity is a characteristic of the emotion.

52 C.N. Moridis and A.A. Economides
2 timing
It is easier to distinguish between the beginning-climaxing and the end of an emotion than of a mood.
3 cause-reaction
The cause of an emotion is usually more evident than the cause of a mood. In addition, emotion fires a target reaction, while mood’s reactions many times are vague.
4 information
Emotion carries information concerning the environment, e.g., information about a threat in our environment, while mood carries information concerning our capacity to face the threat of the environment. It may be better for the purposes of affective learning to address the issue of mood regulation rather than emotion regulation. Duration as a characteristic of the mood is what serves learning better. We want the student to have a positive attitude towards learning and afterwards the interaction with the tutoring system. Moreover, the information carried by the student’s mood may be more descriptive concerning the student’s learning experience because of its self-assessment quality. Consequently, it may be more useful in the long term for affective tutoring systems to produce a positive mood concerning learning, than to be focused on the emotion of the moment.
The student’s recognised emotional state would be properly managed by a computer-aided affective learning system based on pedagogical models, which integrate our knowledge about emotions and learning. The system would assess whether the learning process is developing at a healthy rate. If there is a positive development, the system should help the learner maintain this emotional state. If not, the system should induce the learner to have an emotional state beneficial to learning.
A person’s affective state could be predictable if their goals and perception of relevant events were known (Ortony et al., 1988). Implemented in a computational model, this can be achieved by using agents and artificial intelligence techniques, and reasoning on goals, situations and preferences (Conati, 2002).
Students’ emotional states that are detrimental to learning could be healed through a self-assessment system. Our aim is to develop an online multiple-choice-questions platform that would help students to identify and improve their weaknesses. A flexible e-learning system would take into consideration the student’s knowledge state and learning preferences (Albano et al., 2006) to generate individualised learning paths (Albano et al., 2007). In addition, the system would try to introduce students to an emotional state beneficial to learning and provide adequate feedback (Economides, 2005). The emotional feedback can occur before and after the test, during the test, and before and after a student’s answer to a question. In all these cases emotional feedback can be provided either automatically according to the student’s emotional state, or at the student’s or the teacher’s request. Emotional feedback can be implemented by using beneficial positive emotions, while preventing, controlling and managing negative emotions. The emotional feedback can also be implemented using negative emotions in order to increase the student’s devotion and engagement. These ‘strategies’ can be applied using humour and jokes, amusing games, expressions of sympathy, rewards,
Classification models of students’ moods 53
pleasant surprises, encouragement, acceptance and praise, but also through criticism and punishment (Economides, 2006). Thus, students would receive psychological and cognitive assistance through their preparation for the exams.
For this purpose we need a model that would provide a measurement for the evaluation of the students’ mood with respect to each question the student is about to answer, and to determine the system’s feedback to the student. Modelling multiple variables is important as students have complex characteristics that ultimately affect their performance. However, adding additional variables will not always increase the accuracy of the student model (Triantafillou et al., 2007). After making several assumptions, we developed and evaluated two models in order to provide a measurement for the estimation of the student’s mood while undertaking a self-assessment multiple-choice-questions test. To evaluate the two models, we created a suitable online test of multiple-choice questions about basic computer knowledge and experimented with 153 high school students from three different regions in Greece. The results verified our assumptions and proved the models’ ability to approximate students’ mood at a satisfactory level.
2 Our approach
We explored several research questions in the context of an online multiple-choice -questions self-assessment test, providing a measurement for evaluating the students’ mood during the test. To do so, we formulated and evaluated two models on the basis of hypotheses that could have an impact on a student’s mood during the test.
2.1 Student’s Mood Model 1
One hypothesis centred on the likely impact of correct or wrong answers during the test on the students’ mood. We assumed that if a student gives correct answers to almost every question, there is a high probability of being positively affected, whereas if a student fails to give correct answers to a large number of questions, there is a high probability of being exhausted from negative feelings. Another hypothesis explored whether a student’s mood also depends on the number of given questions. Specifically, we supposed that the student feels little pressure when he has answered the first three questions wrongly, and proceeds to answer the next question given that the total number of questions is 100. On the other hand, if the same student had answered 80 questions wrongly and he was about to answer the ninety-second one out of 100 questions, then the emotional pressure would be much higher. The opposite would happen if the student was about to answer question 92 being aware of the fact that he had already given 80 correct answers. In this case the student would certainly be more relaxed.
Based on these assumptions, we formulated our first model in order to provide a measurement for the evaluation of the student’s mood, with respect to each question the student is about to answer (Moridis and Economides, 2008):
M(q, r, w) = (r – w) * q, (1)
54 C.N. Moridis and A.A. Economides
where:
M = the student’s mood r = the number of correctly answered questions
w = the number of questions for which the student gives wrong answers q = the total number of questions up to the current point.
If the number of correctly answered questions r is greater than the number of incorrectly answered questions w, then M (i.e., student’s mood) is a positive number, as derived from Equation (1), and this indicates that the student is in a positive mood. On the other hand, if the number of wrong answers is greater than the number of correct ones, M has a negative value. In this case the student is in a negative mood. When the two numbers r and w have equal values, M equals zero, which implies a neutral student’s mood. It is notable in Equation (1) that the quantity (r – w) is multiplied by the parameter q. In this way we take into account the fact that the student’s mood also depends on the number of answered questions.
The maximum value that M can take in the system according to Equation (1) is:
maxM = q2, (2)
while the minimum value that M can take according to Equation (1) is:
minM = –(q2). (3)
2.2 Student’s Mood Model 2
Another hypothesis was that the student’s goal influences the student’s mood during the test in relation to the remaining questions and his/her record. That is to say, if a student knows that he/she has already failed to reach his/her goal during the test, because the remaining questions are less than the questions he/she has to answer correctly in order to reach his/her goal, there is a high probability of being in a negative mood. In addition to that, we assumed that the student’s mood is also influenced by his/her success or failure to answer the questions just before the current one. For instance, if a student has failed to provide a correct answer to all of the five previous questions, there is a high probability of being negatively influenced, but if a student has managed to provide a correct answer to all of the five previous questions, there is a high probability to be positively influenced. With the purpose of checking these hypotheses, we formulated Model 2:
R(q) = N – q, (4)
where:
R = the number of questions remaining before the end of the test N = the total number of questions q = the number of the current question
D(q) = I – r(q), (5)
where:
D(q) = the number of questions that the student still needs to answer in order to reach his/her goal
I = the student’s goal r(q) = the number of the student’s correct answers up to the current point

Classification models of students’ moods 55
H(q) = R(q) – D(q), (6)
where H(q) is a number that shows whether the remaining questions are enough for the student to reach his/her goal. For example, H(q) = –4 would mean that the student has already failed to reach his/her goal for four questions
+rr(q)
M(q) = H(q) (7)
–wr(q)
where:
M(q) = the student’s mood rr(q) = the number of correct answers in line just before the current question
wr(q) = the number of wrong answers in line just before the current question.
So, if there is one or more correct answers in line just before the current question, we add them to H(q), while if there is one or more wrong answers in line just before the current question, we subtract them from H(q).
Model 2 also provides minimum and maximum values for M, which are given from the formulas shown below:
max M = 2N, (8)
min M = –2N. (9)
2.3 Calculating the agent’s feedback to the student’s mood
Since, according to Models 1 and 2, we know the maximum and minimum values that M can take in the system, we can use a set of discrete values in order to approximate the real value of M. In this way, each discrete value of input M is mapped to a discrete output value which corresponds to a set of certain actions the agent will perform as a feedback to the student. Thus, we can calculate the agent’s feedback to the student using the formula shown below:
feedback(M, L) = A, (10)
where L is the discrete level to which M is assigned and A is a set of actions that can be triggered from the M, L pair. In order to provide the agent with a much richer and varying behaviour, we can attach more than one possible action to each M, L pair. These actions could be triggered randomly or based on the frequency of their appearance. It would be preferable if the agent would not repeat the same action for the same M, L pair.
3 Experiment
3.1 System architecture
We built the online multiple-choice-questions test in a Windows XP machine using JavaScript with Perl Common Gateway Interface (CGI) on Apache web server with MySQL. The CGI is used to provide dynamic web pages to students and the Perl
56 C.N. Moridis and A.A. Economides
programming language is a common choice for various reasons, including its simple and powerful string manipulation, web server integration (i.e., Apache web server) and data manipulation (Guelich et al., 2000). Many students took the online test simultaneously, thus MySQL, which is designed for multiple users accessing the files through a single server process, was a very convenient choice for this kind of work (Kofler, 2005).
The student’s terminal sent a standard HTTP request encoded with special variables (commonly called CGI variables) and their values. The Apache web server received the HTTP request and determined that the request was destined for a CGI program and not for an HTML file. The Perl interpreter accepted the input from the server, parsed the variables, contacted the MySQL database for reading and recording data, applied some programming logic to the data and returned a document back to the web server.
3.2 Participants
High school students (N = 153) were recruited from three different regions in Greece (60 students from Athens, 50 students from Thessaloniki and 43 students from Mitilini). The respondents consisted of 56% females and 44% males. The average age of the participants was 16.8 (SD = 1.98), with 90% of the sample ranging from 15 to 19 years.
3.3 Questions
The multiple-choice questions were focused on basic computer knowledge and skills based on material taught in lectures. The context of the questions was specified by tutors prior to the study. The test was composed of 45 questions of two degrees of difficulty. The order of questions was randomly altered among students.
3.4 Procedure and data collection methodology
The duration of the experiment was approximately 45 minutes. It took place during the regular schedule of laboratorial courses. Students were told that this was a general education test concerning computer knowledge that would help them assess their knowledge about computers. At the beginning of the test, the system asked students how many correct answers would make them feel satisfied with their level of knowledge, making them set their personal goal. Throughout the test, a student chose his answer among four possible answers and confirmed his/her choice by clicking on the ‘submit’ button. After each question the system informed the student whether his/her answer was right or wrong and presented his/her score. Then the student could proceed to the next question by clicking on the ‘next’ button. During these 45 questions a slide bar appeared asking the student to move it according to his/her mood concerning the test, from –100 (extremely negative mood) to +100 (extremely positive mood).
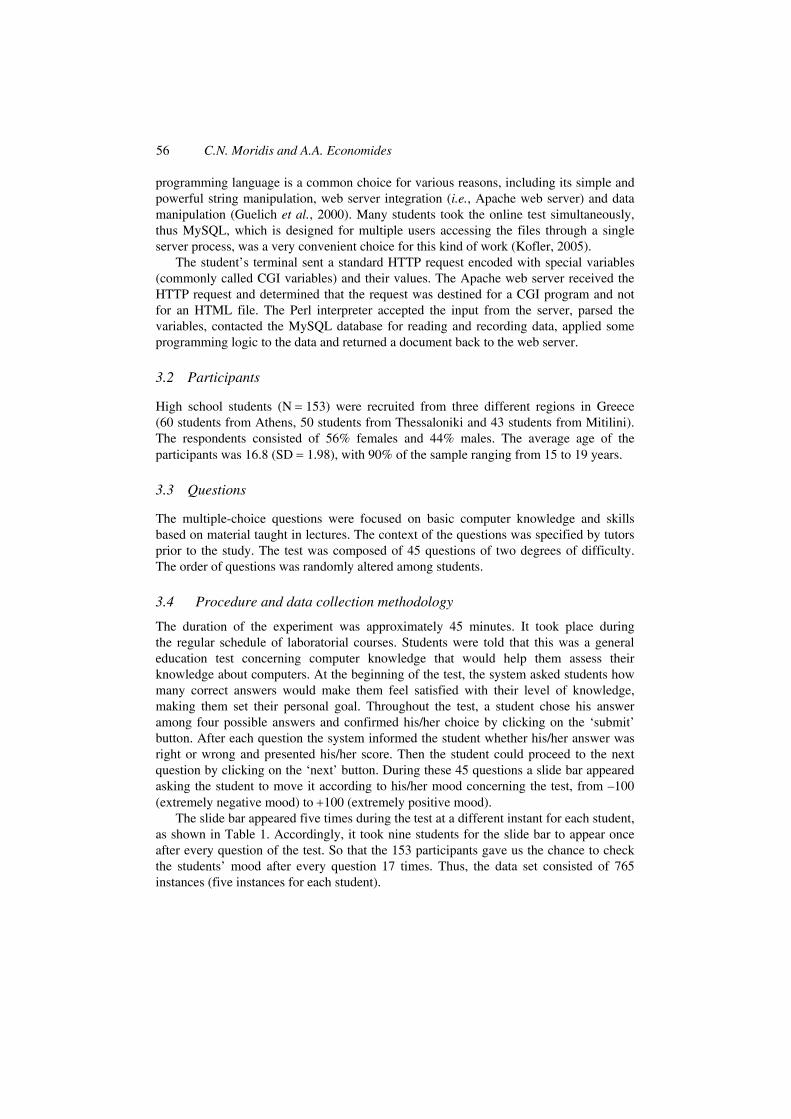
The slide bar appeared five times during the test at a different instant for each student, as shown in Table 1. Accordingly, it took nine students for the slide bar to appear once after every question of the test. So that the 153 participants gave us the chance to check the students’ mood after every question 17 times. Thus, the data set consisted of 765 instances (five instances for each student).
Classification models of students’ moods 57
Table 1 The slide bar sequence which was repeated every nine students
Student Question after which the slide bar appeared
1st student 1st 9th 18th 27th 36th
2nd student 2nd 11th 20th 29th 38th
3rd student 3rd 12th 21st 30th 39th
4th student 4th 13th 22nd 31st 40th
5th student 5th 14th 23rd 32nd 41st
6th student 6th 15th 24th 33rd 42nd
7th student 7th 16th 25th 34th 43rd
8th student 8th 17th 26th 35th 44th
9th student 10th 19th 28th 37th 45th
Following each completed interaction, ten parameters were calculated and recorded:
1 the number of the current question
2 the number of questions remaining before the end of the test
3 the number of questions that the student still needs to answer in order to reach his/her goal
4 a number that shows whether the remaining questions are more or less than the number of questions that the student has to answer correctly so as to reach his goal, i.e., the student’s hope of reaching his goal
5 the number of correct answers in line before the current question
6 the number of wrong answers in line before the current question
7 the number of correct answers up to the current question
8 the number of wrong answers up to the current question
9 the score
10 the mood that the student indicated by moving the slide bar.
4 Results
Initially we evaluated the two models based on the divergence from the real mood that the students pointed out on the slide bar. However, this is a quantitative method of evaluation, while it is difficult to be highly accurate in predicting students’ mood, which is an extremely sensitive variable.
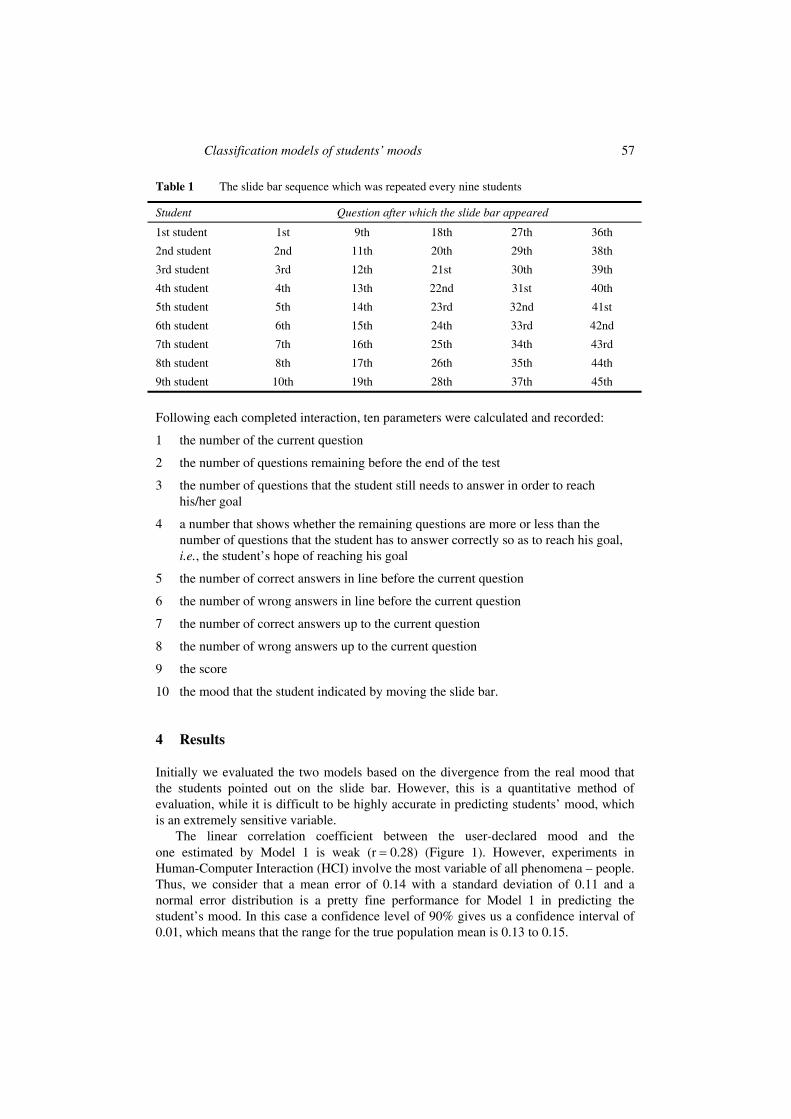
The linear correlation coefficient between the user-declared mood and the one estimated by Model 1 is weak (r = 0.28) (Figure 1). However, experiments in Human-Computer Interaction (HCI) involve the most variable of all phenomena – people. Thus, we consider that a mean error of 0.14 with a standard deviation of 0.11 and a normal error distribution is a pretty fine performance for Model 1 in predicting the student’s mood. In this case a confidence level of 90% gives us a confidence interval of 0.01, which means that the range for the true population mean is 0.13 to 0.15.
58 C.N. Moridis and A.A. Economides
Figure 1 Linear correlation coefficient (r) between the user-declared mood and the mood estimated by Model 1 (see online version for colours)
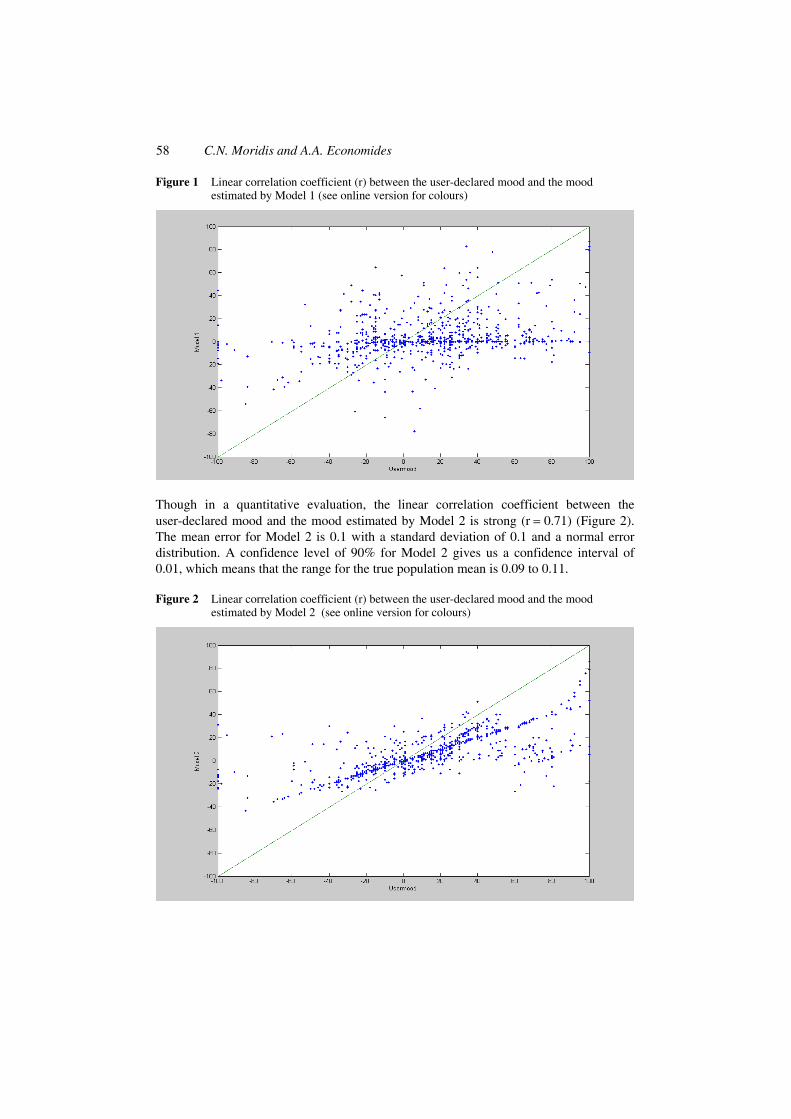
Though in a quantitative evaluation, the linear correlation coefficient between the user-declared mood and the mood estimated by Model 2 is strong (r = 0.71) (Figure 2). The mean error for Model 2 is 0.1 with a standard deviation of 0.1 and a normal error distribution. A confidence level of 90% for Model 2 gives us a confidence interval of 0.01, which means that the range for the true population mean is 0.09 to 0.11.
Figure 2 Linear correlation coefficient (r) between the user-declared mood and the mood estimated by Model 2 (see online version for colours)

Classification models of students’ moods 59
It is obvious that Model 2 has a much better performance than Model 1 (Table 2). So, taking into consideration more factors about students’ behaviour during the test increases the model’s efficacy. Specifically, a student’s success or failure to reach his/her goal during the test influences his mood. The closer to his/her goal the student is throughout the test, the more positive his/her mood becomes. On the other hand, while the student’s distance from his/her goal gets bigger as he/she proceeds with the test, the more negative his/her mood becomes.
Table 2 Quantitative comparison between Model 1 and Model 2
Student’s mood r
Mean error SD
Confidence level (%)
Confidence interval
Range for true population mean
Model 1 0.28 0.14 0.11 90 0.01 0.13–0.15
Model 2 0.71 0.1 0.1 90 0.01 0.09–0.11
Another important issue is that adding or subtracting the number of correct or wrong answers in line just before the current question increases the efficacy of Model 2 (Table 3). We compared H(q) alone with the entire Model 2, which is H(q) plus rr(q) (the number of correct answers in line just before the current question) or minus wr(q) (the number of wrong answers in line just before the current question). This shows that a student’s success or failure in answering immediately preceding questions influences his/her mood positively or negatively towards the current question.
Table 3 Comparing H(q) with Model 2 (M(q)) shows that taking into account the number of correct or wrong answers in line just before the current question increases the model’s efficacy
Student’s mood H(q) Model 2 (M(q))
r 0.64 0.71
Mean error 0.11 0.1
SD 0.1 0.1
Mean success in recognising whether student is in a positive or negative mood (%)
77 82
Mean success in recognising whether student is in a positive mood (%)
79 85
Mean success in recognising whether student is in a negative mood (%)
80 82
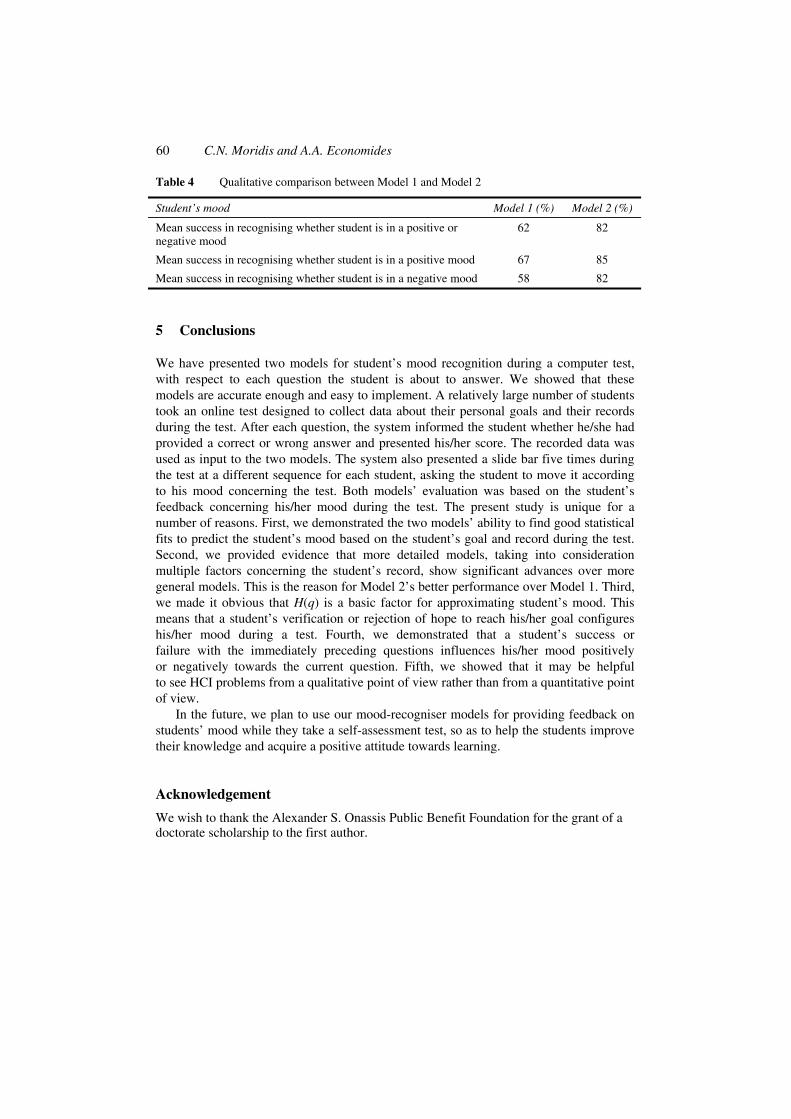
Trying to determine the exact percentage of the student’s positive or negative mood is a difficult task. However, if we try to determine just whether a student is in a positive mood or in a negative mood, things get much easier. So, in a qualitative evaluation of the two models, we would judge the models by their success in predicting whether a student is in a positive or negative mood, regardless of how positive or how negative this mood is. Again Model 2 shows a much better performance than Model 1 (Table 4). Using Model 2, we can have a safe prediction of the student’s mood in terms of whether this mood is positive or negative. A problem that is difficult to solve from a quantitative point view becomes more approachable from a qualitative point of view.
60 C.N. Moridis and A.A. Economides
Table 4 Qualitative comparison between Model 1 and Model 2
Student’s mood Model 1 (%) Model 2 (%)
Mean success in recognising whether student is in a positive or negative mood
62 82
Mean success in recognising whether student is in a positive mood 67 85
Mean success in recognising whether student is in a negative mood 58 82
5 Conclusions
We have presented two models for student’s mood recognition during a computer test, with respect to each question the student is about to answer. We showed that these models are accurate enough and easy to implement. A relatively large number of students took an online test designed to collect data about their personal goals and their records during the test. After each question, the system informed the student whether he/she had provided a correct or wrong answer and presented his/her score. The recorded data was used as input to the two models. The system also presented a slide bar five times during the test at a different sequence for each student, asking the student to move it according to his mood concerning the test. Both models’ evaluation was based on the student’s feedback concerning his/her mood during the test. The present study is unique for a number of reasons. First, we demonstrated the two models’ ability to find good statistical fits to predict the student’s mood based on the student’s goal and record during the test. Second, we provided evidence that more detailed models, taking into consideration multiple factors concerning the student’s record, show significant advances over more general models. This is the reason for Model 2’s better performance over Model 1. Third, we made it obvious that H(q) is a basic factor for approximating student’s mood. This means that a student’s verification or rejection of hope to reach his/her goal configures his/her mood during a test. Fourth, we demonstrated that a student’s success or failure with the immediately preceding questions influences his/her mood positively or negatively towards the current question. Fifth, we showed that it may be helpful to see HCI problems from a qualitative point of view rather than from a quantitative point of view.
In the future, we plan to use our mood-recogniser models for providing feedback on students’ mood while they take a self-assessment test, so as to help the students improve their knowledge and acquire a positive attitude towards learning.
Acknowledgement
We wish to thank the Alexander S. Onassis Public Benefit Foundation for the grant of a doctorate scholarship to the first author.
Classification models of students’ moods 61
References Albano, G., Gaeta, G. and Salerno, S. (2006) ‘E-learning: a model and process proposal’, Int. J.
Knowledge and Learning, Vol. 2, Nos. 1–2, pp.73–88.
Albano, G., Gaeta, G. and Salerno, S. (2007) ‘IWT: an innovative solution for AGS e-learning model’, Int. J. Knowledge and Learning, Vol. 3, Nos. 2–3, pp.209–224.
Angehrn, A.A. (2005) ‘Designing innovation games for community-based learning and knowledge exchange’, Int. J. Knowledge and Learning, Vol. 1, No. 3, pp.210–228.
Bechara, A., Damasio, H., Tranel, D. and Damasio, A. (1997) ‘Deciding advantageously before knowing the advantageous strategy’, Science, Vol. 275, No. 5304, pp.1293–1295.
Choudrie, J. and Selamat, M.H. (2005) ‘Managing organisational learning through continuous information systems development: tacit knowledge diffusion and meta-abilities perspectives’, Int. J. Knowledge and Learning, Vol. 1, No. 4, pp.342–356.
Conati, C. (2002) ‘Probabilistic assessment of user’s emotions in education games’, Special issue on Managing Cognition and Affect in HCI, Journal of Applied Artificial Intelligence, Vol. 16, Nos. 7–8, pp.555–575.
Damasio, A.R. (1994) Descartes Error: Emotion, Reason and the Human Brain, New York: G.P. Putnam Sons.
Damasio, A.R. (2003) Looking for Spinoza: Joy, Sorrow and the Feeling Brain, London: Heinemann.
Economides, A.A. (2005) ‘Personalized feedback in CAT’, World Scientific and Engineering Academy and Society (WSEAS) Transactions on Advances in Engineering Education, Vol. 2, No. 3, pp.174–181.
Economides, A.A. (2006) ‘Emotional feedback in CAT (Computer Adaptive Testing)’, International Journal of Instructional Technology & Distance Learning, Vol. 3, No. 2.
Forgas, J.P., Chan, N.Y.M. and Simon, M.L. (2005) ‘Affective influences on thinking and behavior: implications for clinical, applied and preventive psychology’, Applied and Preventive Psychology, Vol. 10, No. 4, pp.225–242.
Goleman, D. (1995) Emotional Intelligence, New York: Bantam Books.
Gratch, J. and Marsella, S. (2004) ‘A domain-independent framework for modelling emotion’, Journal of Cognitive Systems Research, Vol. 5, No. 4, pp.269–306.
Guelich, S., Gundavaram, S. and Birznieks, G. (2000) CGI Programming with Perl, 2nd ed., O’Reilly.
Kofler, M. (2005) The Definitive Guide to MySQL 5, 3rd ed., après.
Larsen, R.J. (2000) ‘Target articles: toward a science of mood regulation’, Psychological Inquiry, Vol. 11, No. 3, pp.129–141.
Lytras, M.D. and Sicilia, M.A. (2005) ‘The knowledge society: a manifesto for knowledge and learning’, Int. J. Knowledge and Learning, Vol. 1, Nos. 1–2, pp.1–11.
Moridis, C.N. and Economides, A.A. (2008) ‘A computer method for giving adequate feedback to students current mood’, IEEE Multidisciplinary Engineering Education Magazine, Vol. 3, No. 3, pp.104–107.
Ortony, A., Clore, G.L. and Collins, A. (1988) The Cognitive Structure of Emotions, Cambridge, UK: Cambridge University Press.
Picard, R.W., Papert, S., Bender, W., Blumberg, B., Breazeal, C., Cavallo, D., Machover, D., Resnick, M., Roy, D. and Strohecker, C. (2004) ‘Affective learning – a manifesto’, BT Technology Journal, Vol. 22, No. 4, pp.253–269.
Triantafillou, E., Georgiadou, E. and Economides, A.A. (2007) ‘Applying adaptive variables in computerised adaptive testing’, Australasian Journal of Educational Technology, Vol. 23, No. 3.