echelon asia summit 2015: state of app nation: asia edition
TRANSCRIPT

State o f App Nat ion: As ia Ed i t ionC h r i s t o p h e r K l o t z b a c h , H e a d o f P r o d u c t M a r k e t i n g , F l u r r y f r o m Ya h o o
J u n 2 3 , 2 0 1 5
Yahoo 2015 Confidential & Proprietary. 2
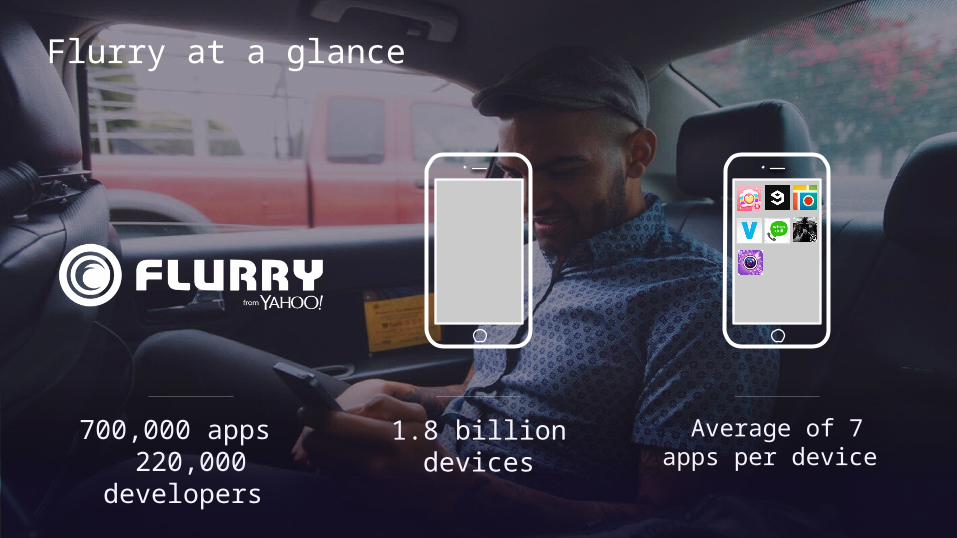
Average of 7 apps per device
700,000 apps 220,000 developers
1.8 billion devices
Flurry at a glance

We’ve Got Asia Covered

190,244APPS
36,227COMPANIES
610MACTIVE DEVICES

Ma
y-0
8
Jul-
08
Se
pt-
08
No
v-0
8
Jan
-09
Ma
r-0
9
Ma
y-0
9
Jul-
09
Se
pt-
09
No
v-0
9
Jan
-10
Ma
r-1
0
Ma
y-1
0
Jul-
10
Se
pt-
10
No
v-1
0
Jan
-11
Ma
r-1
1
Ma
y-1
1
Jul-
11
Se
pt-
11
No
v-1
1
Jan
-12
Ma
r-1
2
Ma
y-1
2
Jul-
12
Se
pt-
12
No
v-1
2
Jan
-13
Ma
r-1
3
Ma
y-1
3
Jul-
13
Se
pt-
13
No
v-1
3
Jan
-14
Ma
r-1
4
Ma
y-1
4
Jul-
14
Se
pt-
14
No
v-1
4
Jan
-15
Ma
r-1
5
Ma
y-1
5
0
63
125
188
250
TO
TAL
SE
SSIO
NS (
BIL
LIO
NS)
Music GamingM&E
SocialNetworking
Logistics &Travel
Retail
Messaging
TV
Source: Flurry Analytics, All Devices
App Revolution: No Sign of Stopping

Nothing but Growth in Asia
Source: Flurry Analytics; All Devices, Asia
Aug-10
Nov-1
0
Feb-1
1
May
-11
Aug-11
Nov-1
1
Feb-1
2
May
-12
Aug-12
Nov-1
2
Feb-1
3
May
-13
Aug-13
Nov-1
3
Feb-1
4
May
-14
Aug-14
Nov-1
4
Feb-1
5
May
-15
-
15
30
45
60
75
90
TO
TAL
SE
SSIO
NS (
BIL
LIO
NS)
LandlordPoker
LineWeChat
MonsterStrike
MakeupPlus
OmniSwipe
PosterLabs
Flipkart

Time Spent by Category in Asia
Games 25%
Utilities & Productivity 17%
Messaging & Social 13%
Shopping & Lifestyle 19%
Personalization 6%
Music, Media & Entertainment 10%
News & Magazines 2%Health & Fitness 2%
Other 7%
Source: Flurry Analytics; All Devices, Asia, April 2015; % of Users Time Spent in App
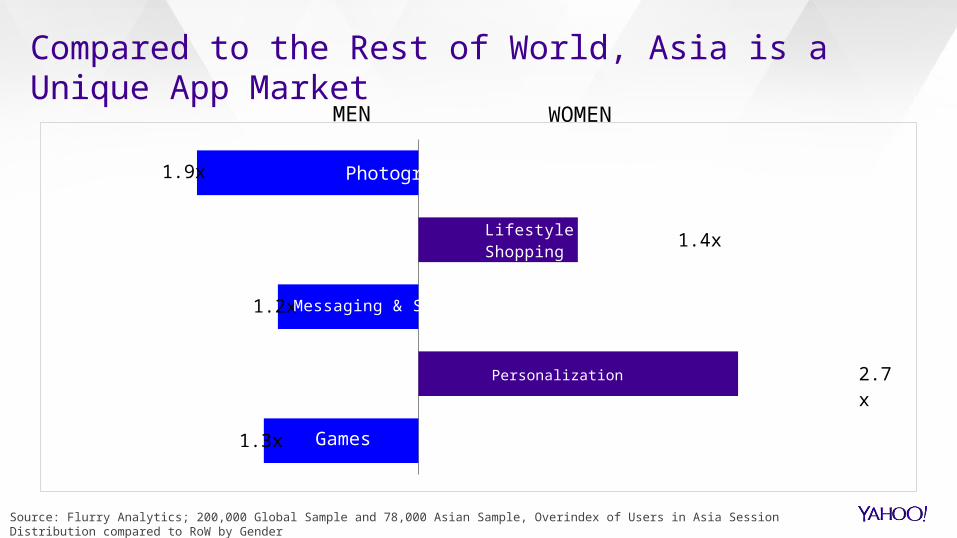
Compared to the Rest of World, Asia is a Unique App Market
Source: Flurry Analytics; 200,000 Global Sample and 78,000 Asian Sample, Overindex of Users in Asia Session Distribution compared to RoW by Gender
1.9x
1.2x
1.3x
2.7x
1.4x
Photography
Lifestyle & Shopping
Messaging & Social
MEN WOMEN
Personalization
Games

• Shift from Entertainment to Productivity
• Phablet Adoption
App Growth Factors

Shopping & Lifestyle, News & Reading, Utilities & Productivity Lead Asia’s Growth
Source: Flurry Analytics; All Devices, Asia
Shopping & Lifestyle
News / Read-ing
Utilities & Productivity
Messaging and Social
Music, Media & Enter-tainment
Games0%
50%
100%
150%
200%
250%
300% 287%
134%
89%
42% 40%26%
YoY Asian Session Growth (Trailing 12 Months, 2014-2015)
Average: 77%

5AM 6AM 7AM 8 AM 9AM 10AM 11AM 12PM 1PM 2PM 3PM 4PM 5PM 6PM 7PM 8PM 9PM 10PM 11PM 12AM 1AM 2 AM 3 AM 4AM0%
1%
2%
3%
4%
5%
6%
7%
8%
9%
10%Asia
Source: Flurry Analytics; 78,000 Sample, % of Daily Asia Shopping Session by Hour from March 2015
2nd PRIME TIME
% O
F D
AIL
Y S
ESSIO
NS
HOUR OF DAY
1st PRIME TIME
Asia Mobile Shopping Peaks at Lunch and Dinner Time
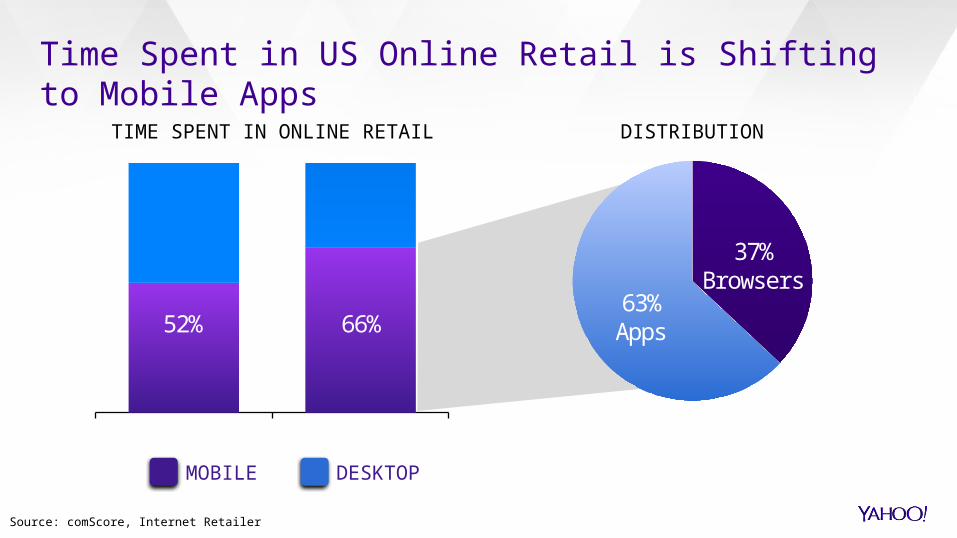
63%Apps
37%Browsers
2013 2014
TIME SPENT IN ONLINE RETAIL DISTRIBUTION
52% 66%
MOBILE DESKTOP
Time Spent in US Online Retail is Shifting to Mobile Apps
Source: comScore, Internet Retailer

Shopping & Lifestyle, News & Reading, Utilities & Productivity Lead Asia’s Growth
Shopping & Lifestyle
News / Read-ing
Utilities & Productivity
Messaging and Social
Music, Media & Enter-tainment
Games0%
50%
100%
150%
200%
250%
300% 287%
134%
89%
42% 40%26%
YoY Asian Session Growth (Trailing 12 Months, 2014-2015)
Average: 77%
Source: Flurry Analytics; All Devices, Asia

United States
China
Singapore
Hong Kong
India
Taiwan
South Korea
0% 20% 40% 60% 80% 100%
28%
43%
39%
30%
39%
31%
49%
22%
9%
19%
20%
14%
20%
17%
23%
29%
17%
18%
5%
22%
13%
17%
16%
15%
15%
32%
18%
13%
10%
4%
10%
17%
10%
9%
7%
Arcade & Action Cards & Casino Brain & Puzzle Casual Sports & Racing
Asia Loves Action Games
Source: Flurry Analytics, All Devices, Asia, May 2015; % Session by Game Category
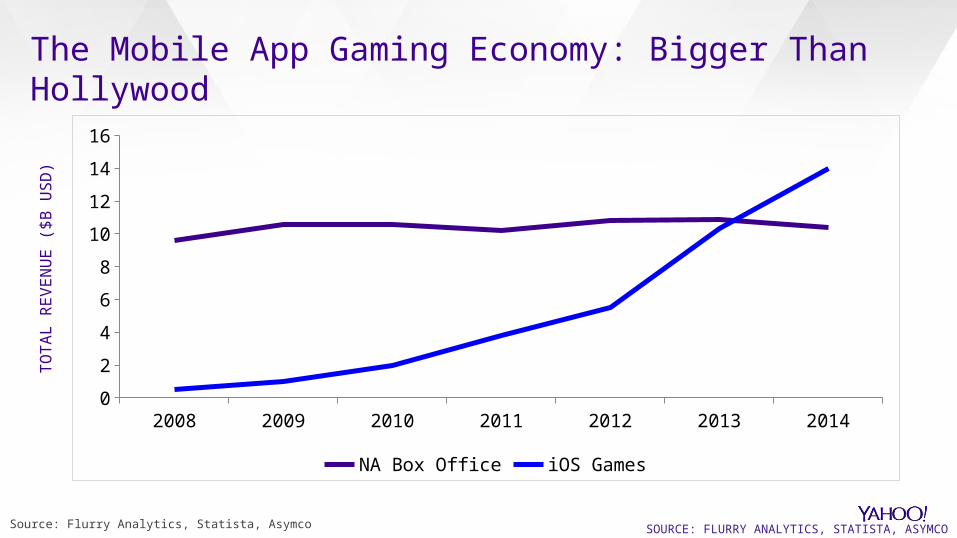
2008 2009 2010 2011 2012 2013 20140
2
4
6
8
10
12
14
16
NA Box Office iOS Games
TO
TAL
REV
EN
UE (
$B
USD
)
SOURCE: FLURRY ANALYTICS, STATISTA, ASYMCO
The Mobile App Gaming Economy: Bigger Than Hollywood
Source: Flurry Analytics, Statista, Asymco

Phablet Adoption

-50%
0%
50%
100%
150%
200%
SMALLPHONES
MEDIUMPHONES
PHABLETS SMALLTABLETS
FULL-SIZETABLETS
-18% -22%
33%11%
142%
Phablets: Fastest Growing Device Type% Growth in Usage (April 2014-April 2015)
Source: Flurry Analytics, Mapped Devices Only, Jan 2014- Jan 2015

Asia is Leading the Phablet Revolution
Global
Asia
0% 10% 20% 30% 40% 50% 60% 70% 80% 90% 100%
3%
7%
60%
45%
31%
42%
3%
3%
4%
2%
Session % by Form Factor
Small phones Medium phones PhabletsSmall tablets Full-size tablets
Source: Flurry Analytics, 78,000 Sample

South Korea is Leading the Way in Phablet Adoption in Asia
South Korea Hong Kong Taiwan United States
India China Singapore0%
20%
40%
60%
80%
100%
2% 5% 7% 9% 6% 7%13%1% 5% 5% 5%
3% 4%7%
63% 44% 35%20%
20% 15%10%
35%45%
53%65% 68% 74% 70%
full-size tablets small tablets phablets medium phones small phones
Medium Phone UsersBENCHMARK
Phablet Lovers
Source: Flurry Analytics, 78,000 Sample, User % by Formfactor in Asia
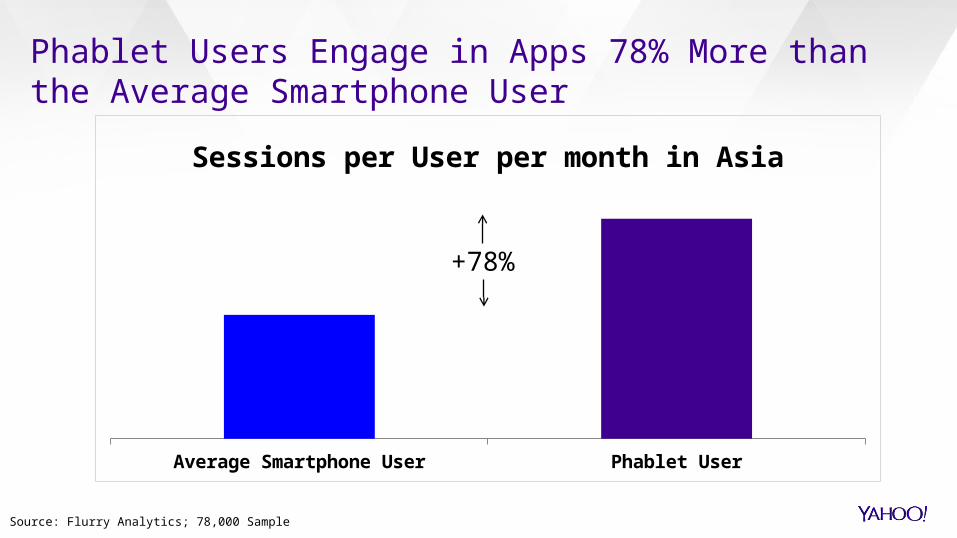
Phablet Users Engage in Apps 78% More than the Average Smartphone User
Average Smartphone User Phablet User
Sessions per User per month in Asia
+78%
Source: Flurry Analytics; 78,000 Sample

Phablet Users Leading Shift to Productivity% Growth in Category Usage and % Over Index
Utilities & Productivity Personalization Lifestyle & Shopping
21%
10% 7%
24%18% 16%
Other Form Factors Phablets
+ 14%
80%130%
Source: Flurry Analytics, 78,000 Sample

China US E.U. Brazil
13
11
2.3 1 0.9
Mobile
MIL
LIO
NS
App Revolution: Creating Real Jobs2014 Jobs Created
Source: Flurry Analytics, BCG, ILO

TR
ILLI
ION
S (
USD
)
US China Japan Germany Mobile France UK Russia India Australia Taiwan Singapore Hong Kong
16.7
9.1
4.93.7 3.3
2.8 2.72.1 1.877 1.56
0.474 0.298 0.274
MOBIL
E
The Global Economic Impact2014 Mobile Revenues Compared to GDP
Source: Flurry Analytics, BCG

Asia is just getting started…