genome size variation in the genus avena · genome size variation in the genus avena honghai yan ab...
TRANSCRIPT
Draft
Genome size variation in the genus Avena
Journal: Genome
Manuscript ID gen-2015-0132.R1
Manuscript Type: Article
Date Submitted by the Author: 01-Dec-2015
Complete List of Authors: Yan, Honghai; Triticeae Research Institute of Sichuan Agricultural University, Martin, Sara; Agriculture and Agri-Food Canada Bekele, Wubishet; Agriculture and Agri-Food Canada Latta, Robert; Dalhousie University, Department of Biology Diederichsen, Axel; Plant Gene Resources of Canada, Agriculture and Agri-Food Canada Peng, Yuanying; Triticeae Research Institute of Sichuan Agricultural University Tinker, Nicholas; Eastern Cereal and Oilseed Research Centre
Keyword: Oat, flow cytometry, nucleus, polyploidy
https://mc06.manuscriptcentral.com/genome-pubs
Genome

Draft
Genome size variation in the genus Avena
Honghai Yanab, Sara L. Martina, Wubishet A. Bekelea, Robert G. Lattac, Axel Diederichsend,
Yuanying Pengb, Nicholas A. Tinkera*
*correspondence
a Agriculture and Agri-Food Canada, 930 Carling Ave., Bldg. 50, C.E.F., Ottawa ON K1A0C6
Canada
b Triticeae Research Institute, Sichuan Agricultural University, Wenjiang, Chengdu 611130,
Sichuan, People’s Republic of China
c Department of Biology, Dalhousie University, 1355 Oxford St. Halifax NS B3H4R2 Canada
d Agriculture and Agri-Food Canada, Plant Gene Resources of Canada, 107 Science Place,
Saskatoon SK S7N0X2 Canada
Page 1 of 41
https://mc06.manuscriptcentral.com/genome-pubs
Genome
Draft
Abstract
Genome size is an indicator of evolutionary distance and a metric for genome characterization.
Here, we report accurate estimates of genome size in 99 accessions from 26 species of Avena.
We demonstrate that the average genome size of C genome diploid species (2C=10.26 pg) is 15%
larger than that of A genome species (2C=8.95 pg) and that this difference likely accounts for a
progression of size among tetraploid species, where AB < AC < CC (average 2C=16.76 pg,
18.60 pg, and 21.78 pg, respectively). All accessions from three hexaploid species with the ACD
genome configuration had similar genome sizes (average 2C=25.74 pg). Genome size was
mostly consistent within species, and in general agreement with current information about
evolutionary distance among species. Results also suggest that most of the polyploid species in
Avena have experienced genome downsizing in relation to their diploid progenitors. Genome
size measurements could provide additional quality control for species identification in
germplasm collections, especially in cases where diploid and polyploid species have similar
morphology.
Keywords: Oat, flow cytometry, nucleus, polyploidy,
Page 2 of 41
https://mc06.manuscriptcentral.com/genome-pubs
Genome

Draft
Introduction
The genus Avena of the family Poaceae (Gramineae) is comprised of approximately 30 species
(Baum 1977; Baum and Fedak 1985a, 1985b; Ladizinsky 1998) including three natural ploidy
levels (diploid, tetraploid and hexaploid) with seven basic haploid chromosomes (Rajhathy and
Morrison 1959; Rajhathy and Thomas 1974; Thomas 1992). The diploid species have either an A
or C genome, while tetraploid species have an AC or AB genome and hexaploid species an ACD
genome. There are no described diploid species with the B or D genome, although some oat
workers have postulated A. canariensis is a candidate D genome. Based on cytogenetic evidence,
both the D genome (Rajhathy and Thomas 1974) and B genome (Katsiotis et al. 1997) are highly
similar to the A genome. All Avena species except for A. macrostachya, a perennial out-crossing
oat, are self-pollinated annuals.
The most commonly cultivated oat is A. sativa L., a hexaploid species. It is an important cereal
crop for both feed and human consumption with global production that ranks sixth among cereal
crops (Ahmad et al. 2014). Increased oat consumption is often promoted due to nutritional
attributes, including antioxidants and high soluble fiber (Rasane et al. 2015). The genus Avena is
considered to be an important gene pool for oat improvement (Loskutov and Rines 2011), and
many alleles conferring disease resistance have been introgressed from wild oat germplasm into
cultivated oat (Thomas et al. 1975; Rooney et al. 1994). Other traits such as plant height (Frey
1991) and spikelet number (Loskutov and Rines 2011) show potentially useful genetic variation
in wild oat species.
Utilization of the rich genetic diversity in wild oat relatives would be facilitated by better
knowledge of genome structure and relationships among these species. Genome size is a basic
Page 3 of 41
https://mc06.manuscriptcentral.com/genome-pubs
Genome

Draft
and important metric that can provide insight into the evolutionary history of a species. Genome
size is usually measured using the C-value, defined as the DNA mass in pg within an un-
replicated gametic nucleus (Greilhuber et al. 2005); thus the 2C value represents the weight of an
entire somatic nucleus, regardless of ploidy level. The Kew Plant DNA C-value database
(http://data.kew.org/cvalues/) is a widely used resource that incorporates many historic and
current estimates of genome size. As of the last release, the Kew database holds C-value
estimates from more than 8500 plant species (Bennett and Leitch 2012).
Historically, and in the Kew database, genome size was most commonly estimated using the
technique of Feulgen microdensitometry (McLeish and Sunderland 1961). However, this
approach is laborious and slow (Doležel et al. 2007). Since the development of flow cytometry in
the 1980’s, and due to its increased convenience, speed and accuracy, flow cytometry has
become the dominant method used in genome size estimates (Doležel et al. 2007; Greilhuber et
al. 2007). Based on current results in Kew Plant DNA C-values database (release 6.0, Dec. 2012)
described by Bennett and Leitch (2012), 57% of C-values have been estimated by flow
cytometry while 37% have been estimated using Feulgen microdensitometry. In the most recent
literature, 85% of genome size estimates were made using flow cytometry vs. 15% by
microdensitometry (Bai et al. 2012).
Genome size is constant within an individual, and usually within a species (Lysák et al. 2000;
Greilhuber 2005) although there are notable exceptions such as flax (Linum usitatissimum) where
rapid evolution of genome size causes variation of up to 15% among accessions within the
species (Cullis 2005). However, genome size can vary over several orders of magnitude in
eukaryotes (Bennett and Leitch 2005; Pellicer et al. 2010a). In Angiosperms, 2C-values range
from 0.13 pg in Genlisea aurea (Greilhuber et al. 2006) to 304.4 pg in Paris japonica (Pellicer et
Page 4 of 41
https://mc06.manuscriptcentral.com/genome-pubs
Genome

Draft
al. 2010b). Even among species having the same ploidy level within a single genus, genome size
can differ by >40-fold (Bennett and Leitch 2012). Molecular investigations have shown that
changes in repetitive DNAs such as retrotransposon and satellite DNA (Piegu et al. 2006) as well
as low-abundance repeat-derived DNA (Kelly et al. 2015) are responsible for some of the more
substantial differences in genome size observed among related species.
Genome size can have profound effects on many aspects of plant biology. For example,
variations in genome size are related to phenotypic traits such as leaf size (Sugiyama 2005), leaf
architecture and metabolic rates (Beaulieu et al. 2007a), seed mass (Beaulieu et al. 2007b) and
cell size (Henry et al. 2014). Genome size can also be associated with adaptation to
environmental conditions (Kang et al. 2014) and related phenology such as weediness and
lifecycle (Leitch and Bennett 2007). Genome size has been used as an indicator for taxonomic
and evolutionary studies. For example, in wild peanuts, it is believed that larger genome size is
associated with species having more recent origin (Lavia and Fernández 2008). A combination of
genome size, morphologic traits and SSR markers provided robust evidence in support of the
taxonomy and evolution of the genus Miscanthus (Chae et al. 2014). In addition, an accurate
estimate of genome size provides critical information for genome sequencing and for the
calibration of genetic maps (Leitch and Bennett 2007; Ochatt 2008).
Genome size has been estimated in 16 species of Avena (Bullen and Rees 1972; Iiyama and
Grant 1972; Bennett and Smith 1976; Crosby et al. 2014) excluding three that are considered to
be homotypic with others in the Kew database (Baum 1977). Most estimates in the Kew database
were provided by Bennett and Smith (1976) who made additional estimates and attempted to
calibrate these with prior estimates. However, some apparent discrepancies and uncertainties
among early estimates that were based on Feulgen microdensitometry remain in the Bennett and
Page 5 of 41
https://mc06.manuscriptcentral.com/genome-pubs
Genome

Draft
Smith (1976) publication, and therefore in the Kew database. For example, the Kew database
provides very different estimates (8.0 pg vs.10.2 pg) for two closely related species with similar
A genomes: A. strigosa and A. wiestii, respectively. There is also substantial and unexpected
variation in C-value estimates among the species having ACD genomes. Recent estimates based
on multiple accessions of A. barbata suggest that its genome size is approximately 16.2 pg
(Crosby et al. 2014) which differs substantially from the reported value of 17.8 pg in Kew. Some
discrepancies may be due to variable methodologies and to lack of appropriate internal standards,
but it is also notable that the works prior to and including1976 investigated an average of only 2
accessions per species, counting an average of only 45 nuclei per replicate. Furthermore, C-value
estimates for many of the 30 Avena species described by Baum (1977), Baum and Fedak (1985a,
1985b) and Ladizinsky (1998) have not been reported. A thorough reassessment of genome sizes
in all species of Avena using current flow cytometric methodology would provide a critical
benchmark for further genome analysis, including studies of speciation and genome evolution.
The objectives of the present study were to provide accurate estimates of genome size for 26
available species of Avena using multiple accessions per species, to evaluate intra- and
interspecific genome size variation, to explore possible evolutionary models of genome size in
Avena, and to evaluate flow cytometry as diagnostic tool for use in Avena germplasm
characterization.
Materials & methods
Plant materials
Page 6 of 41
https://mc06.manuscriptcentral.com/genome-pubs
Genome

Draft
A total of 99 accessions of Avena including 14 diploid species, 8 tetraploid species, and 4
hexaploid species were used in this study (Table S1) with at least 3 accessions per species when
adequate viable accessions were available. Seeds were provided by Plant Gene Resources of
Canada (PGRC) or USDA-GRIN when not available in PGRC. The species A. matritensis, A.
atherantha, A. hybrida and A. trichophylla described in Baum’s (1977) monograph and A.
prostrata described by Ladizinsky (1971) were not included due to lack of viable materials, and
species that we considered to be homotypic are noted in Table 1.
Sample preparation
Accessions and standards were grown in cabinets. Internal standards were selected based on
appropriate non-overlapping genome size and availability of self-pollinated seed from recent
definitive work (Doležel et al. 1992). Seed of Vicia faba (26.90 pg/2C) originating from Doležel
et al. (1992) was used as the internal standard for diploid species and tetraploid species, and seed
of Pisum sativum (9.09 pg/2C) originating from Doležel et al. (1998) was used for hexaploid
species. Seed from both standards was supplied by The Centre of Plant Structural and Functional
Genomics (Šlechtitelů 31, 783 71 Olomouc - Holice, Czech Republic). Fresh leaf tissue was
harvested from young plants and kept on ice until assays were conducted, usually within three
days. A leaf area of approximately 0.5 cm2 of standard and 2 cm2 of Avena species were co-
chopped with a razor blade for about 2-4s in a petri dish containing 0.75 ml ice-cold LB01
chopping buffer (Doležel et al. 2007). The buffer was then homogenized by several repeated
pipette actions, and the solution was passed through 30 µm Celltrics nylon filters (Sysmex,
Lincolnshire, IL, USA) into 5 ml round-bottom Falcon tubes (Corning, New York, NY, USA). A
volume of 0.25 ml (100 µg/ml) propidium iodide (PI) staining buffer was then added and mixed
by gentle shaking. Samples were incubated with the staining solution at 4℃ for 30 min prior to
Page 7 of 41
https://mc06.manuscriptcentral.com/genome-pubs
Genome

Draft
flow cytometry. Samples from both standards were co-chopped and analyzed on each day on
which samples were analyzed for final adjustment to a single standard.
Flow cytometry analysis
Flow cytometry was performed using a Beckman Coulter (Miami, FL, USA) Gallios flow
cytometer. The positions of peaks and the distributions of nuclei were estimated using Modfit LT
version 4.0 (Verity Software House, Topsham, ME, USA). Several samples were initially tested
with >5,000 nuclei to evaluate the coefficient of variation among nuclei (CVn) where
CVn=SD/M, SD is the standard deviation of the cell distribution, and M is the mean channel
number (Ormerod 2008). If the CVn value of a sample or standard was more than 5%, further
estimates were done until chopping techniques were optimized and the CVn values were
consistently less than 5%. Most samples were then estimated with total nuclei numbers
(including sample and internal standard) exceeding 1500. Some results with good quality (small
CVns and good peak shape) were kept even if nuclei counts were less than 1500 but not less than
1000. All samples were analyzed with at least 3 replicates of the same individual (technical
replicates) conducted over 3 different days. The formula used to calculate the absolute 2C-value
of each sample was (mean of sample G1 peak / mean of standard G1 peak) × 2C DNA content
(pg) of the standard. Since two internal standards were used in this study, we used Pisum sativum
as standard to calculate the 2C-values of Vicia faba based on the average of each assessment.
Statistical analysis
The residuals from a model fitting means by accession were used to monitor homogeneity of
variance, and the average coefficient of variance (CVt ), calculated as the standard deviation of
residuals divided by grand mean, was estimated. A nested analysis of variance (ANOVA) testing
Page 8 of 41
https://mc06.manuscriptcentral.com/genome-pubs
Genome
Draft
replicates within accessions within genomes within species within ploidy-levels was conducted
using ‘REML’ in the SPSS software (IBM, Armonk NY, USA) Differences among species,
considering accessions as replicates, were tested using one-way ANOVA followed by multiple
comparison using Fisher’s least significant difference (LSD) test and Tukey's honest significance
difference (HSD) test within the package ‘agricolae’ in R.
Results
All measured values were calibrated to the published value of the Pisum sativum standard (9.09
pg/2C). After adjustment, the average 2C-value of Vicia faba based on 29 technical replicates
was 26.82±0.44 pg, which is very close to published value of 26.9 pg (Doležel et al. 1992). The
average genome sizes (2C) of 99 Avena accessions were estimated (Table S1) and data were
summarized by species (Table 1). All of the flow cytometric analyses generated high-resolution
histograms (e.g. Figure 1) with CVn of the G0/G1 peaks ranging from 1.14% to 3.80% (mean
2.14%). The average CVt among technical replications on separate days was 1.25%, which was
lower than previous reported variation (1.53%) in diploid Triticeae species (Eilam et al. 2007).
The mean 2C-values of individual accessions varied 3.1-fold, ranging from 8.41 pg to 26.24 pg.
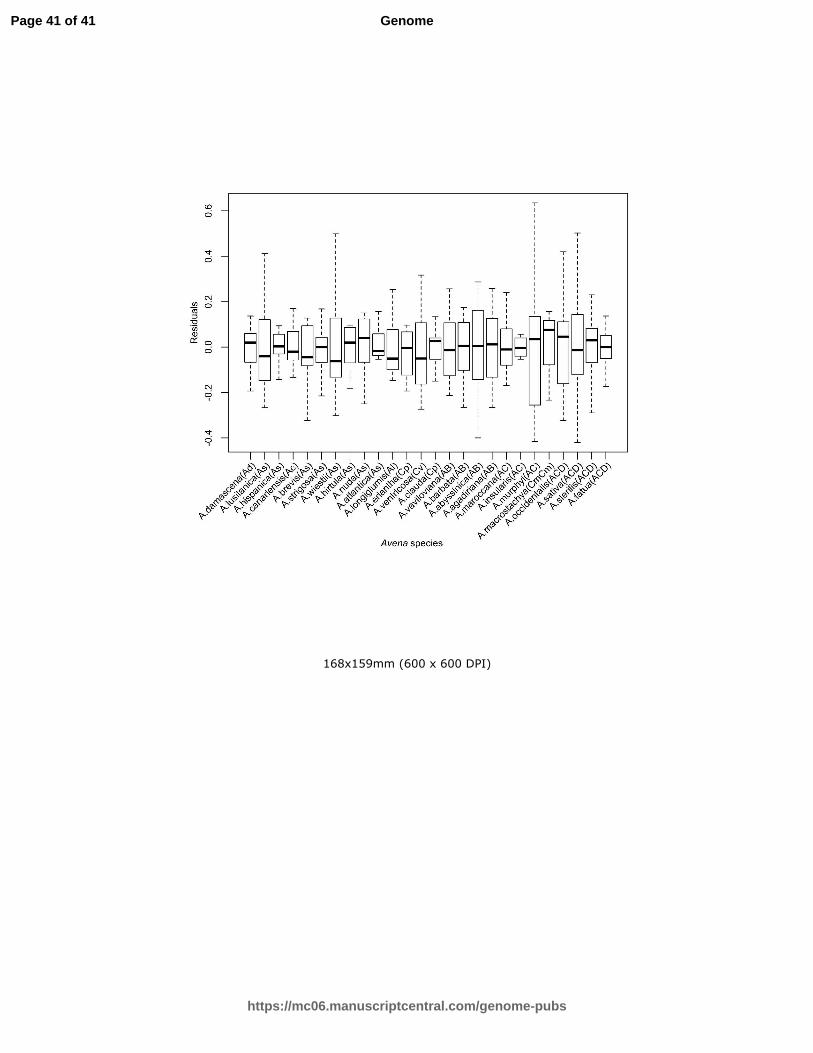
The residuals of a model fitting the accession mean to each sample were inspected in relation to
this large progression in genome size (Figure S1) and it was concluded that there was no
systematic bias in variance in relation to genome size. Thus statistical methods assuming equality
of variance were used in further analyses. The box plot of genome size by species (Figure 2),
suggested that size variation within species is minimal and that accessions were correctly
assigned to species.
Page 9 of 41
https://mc06.manuscriptcentral.com/genome-pubs
Genome

Draft
The nested ANOVA (Table 2) revealed that significant variance can be attributed to all levels
of our sampling design. The differences between ploidy levels were highly significant, as
expected, but there was also substantial variation among genome types with the same ploidy, as
well as significant variation among species with the same genome type. Variation among
accessions within a species, though appearing significant by this test, was the smallest
component of the variance. Because technical replicates conducted on different days were
sampled from the same plants, they cannot be considered independent samples of individuals
within accessions. Variance among individuals may also be attributable to differences among
plants, such as differences in the presence of dye inhibitors (Greilhuber 2005; Bennett et al.
2008). Thus, we were not able to infer true statistical differences among accessions, and this test
is presented primarily as guidance to the relative scales of variance. Variance among technical
replicates was substantially larger than the variation among accessions, and comparable to the
variance among species within genome types.
The highly significant test showing variance among species justified further inspection of
species means by LSD and HSD, both performed at P<0.05 (Table 1). Average values by ploidy
level were 9.23, 18.08, and 25.74 pg for diploid, tetraploid, and hexaploid species, respectively,
and boundaries between ploidy levels were all statistically separated. In addition, some groups of
species within ploidy levels were statistically separated. Most notably, the C genome diploids
had higher C-values (>=10.18 pg) than all A genome diploids (<=9.23 pg), and tetraploids
containing the AC genomes (18.51 to 18.70 pg) had higher C-values than those containing the
AB genomes (16.38 to 17.49 pg), while the single CC genome tetraploid (21.78 pg) had a
markedly higher C-value than any other tetraploid species. Furthermore, there were some
significant differences among A genome diploid species as well as among AB genome tetraploid
Page 10 of 41
https://mc06.manuscriptcentral.com/genome-pubs
Genome

Draft
species. For example, the diploid A. damascena had a lower 2C-value (8.43 pg) than all other
species, while A. agadiriana had a higher 2C value (17.49 pg) than other AB genome species.
There were no significant differences among AC genome tetraploid species, nor among ACD
genome hexaploid species.
Discussion
Reliability and completeness of genome size estimates in Avena
We consider these reported 2C-values in 26 species, including 10 previously unreported species,
to be the most accurate and comprehensive genome size estimates in the genus Avena available
to date. Variations among nuclei (CVn) as well as variations among technical replications (CVt)
were lower than, or comparable to, values found in current literature. Although genome sizes in
16 Avena species have been reported previously (Table 3) all except for the recently published
estimates in A. barbata (Crosby et al. 2014) were estimated by using Feulgen microdensitometry.
While Bennett and Smith (1976) attempted to correct a bias in previous studies, most previous
estimates were substantially higher than those in the current study (Table 3). This may be an
inherent bias due to the use of early Feulgen microdensitometry, as suggested by Moscone et al.
(2003), but it may also relate to the use in the current work of consistent internal standards as
recommended by Leitch and Bennett (2007). Even with internal standards, there may still be
slight systematic differences among studies caused by variable experimental factors such as the
presence of dye inhibitors in plant material (Greilhuber 2005; Bennett et al. 2008) which might
alter the measured peak of the standard (analogous to shifting the scale on a ruler). Thus a set of
estimates such as those provided here may show high degree of relative accuracy, but could
Page 11 of 41
https://mc06.manuscriptcentral.com/genome-pubs
Genome
Draft
differ slightly from estimates in other similarly controlled experiments. Importantly, the apparent
discrepancies among previous estimates (mentioned in our introduction) have now been resolved.
This includes the large variation among previous estimates of closely related A genomes, and the
discrepancy in prior estimates for A. barbata. It also resolves the large variation in prior
estimates among the hexaploid ACD species, all of which are statistically identical in this work.
While not a substantial revision from previous estimates, this work suggests that an appropriate
estimate for the haploid genome of A. sativa is 12.85 pg, which corresponds to 12,567 Mbp
(1pg=978Mbp) (Doležel et al. 2003).
Intraspecific variation in genome size
We found very little variation of genome size among accessions within a species. This was the
smallest component of total variance, and it was markedly smaller than the error variance
measured among technical replicates. This finding is consistent with measurements by Bullen
and Rees (1972). The existence of intraspecific variation in genome size is controversial.
Although numerous studies have reported intraspecific variation (Schmuths et al. 2004; Wang et
al. 2009; Díez et al. 2013), it is more common to find stability within species (Lysák et al. 2000;
Greilhuber et al. 2005; Eilam e al. 2007), and some perceived intraspecific variation may be
explained by other factors such as endogenous staining inhibitors or other methodical noise
(Greilhuber 2005; Noirot et al. 2005; Loureiro et al. 2006). Thus, our results are consistent with
the concept of intra-species stability in genome size. This is important, since the test for
differences among species requires the assumption that accessions represent random samples
from a population having a normal distribution. Any non-random biological differences within a
species (including the misidentification of an accession) could violate this assumption, reduce
Page 12 of 41
https://mc06.manuscriptcentral.com/genome-pubs
Genome

Draft
the power of detecting a difference, and/or reduce the accuracy of estimating the species mean.
Our results suggest that these factors and consequences are minimal.
A small variance among accessions was achieved partly through technical replication. Such
replication may not be necessary in all cases, depending on the goals of the study, but when they
are omitted, the associated error variance contributes to the perceived variation among
individuals or accessions. For example, in A. barbata, we estimate the variance within and
between accessions at 0.017 and 0.009 respectively (standard deviations of 0.13 and 0.0976).
Since variances are additive, if technical replicates were omitted, the apparent variance among
accessions would be roughly 0.026. This is indeed comparable to the variance reported in A.
barbata by Crosby et al (2014), who omitted technical replicates, as the initial goal of that study
was to simply verify ploidy. Thus, the wide range of estimates (15.99 -16.79 pg) reported in A.
barbata by Crosby et al (2014) need not imply intraspecific variation (Leitch and Bennett 2007;
Bennett et al. 2008), and the contrast between native Old World and colonizing Californian A.
barbata samples has yet to be verified in a strictly controlled comparison.
Interspecific variation in genome size
In contrast to intraspecific stability, numerous studies in plants have reported large variations in
genome size among species within genera (Schmuths et al. 2004; Wang et al. 2009; Díez et al.
2013). Retro-elements and polyploidization are considered to be primary factors leading to the
variations in genome size (Piegu et al. 2006; Grover and Wendel 2010). In this study, variation
among ploidy levels was substantial, and was obviously driven by genome duplication, while
variation within ploidy levels was generally consistent with prior sub-genome designations. The
2C-values of species with identical genomic constitutions were generally continuous with only
Page 13 of 41
https://mc06.manuscriptcentral.com/genome-pubs
Genome

Draft
minor differences. This suggests that there have been no major events driving divergence within
a genome type, and this is consistent with observations in the related Triticeae genera (Eilam et
al. 2007). Small but significant variations were detected, even among closely-related diploids
with identical sub-genome designations by the LSD test. For instance, within the As genome
diploid species, the genome of A. lusitanica was significantly smaller (P<=0.05) than all others
except for A. hispanica, and was close in size to the smallest Ad genome diploid A. damascena.
Molecular evidence (Fu and William 2008; Peng et al. 2010; Yan et al. 2014) also showed that A.
lusitanica was more closely related to A. damascena than to other As genome diploids. However,
the differences between A. lusitanica and other As genome diploids were not judged significant
by HSD, hence this result should be investigated further.
Most notably, our results showed that the C genome has a larger genome size than other sub-
genomes. Based on averages within the A and C genome diploids, the difference in size is
approximately 15%. This difference was also observed by Iiyama and Grant (1972), although the
large variation among A genomes reported by these authors made this difference less striking,
and the average difference that they reported was closer to 10%. The apparent divergence
between the A and C sub-genomes is supported by previous studies showing major cytogenetic
differences between A and C genome chromosomes that are most likely due to differences in
repetitive DNA content (Fominaya et al. 1988; Linares et al. 1992; Jellen et al. 1993). Within
hexaploid species, the C genome contains a greater number of large heterochromatic regions than
the A or D genomes (Fominaya et al. 1988; Linares et al. 1992; Jellen et al. 1993). In future work,
it will be interesting to compare these variations in genome size with other genomic indicators of
speciation.
Page 14 of 41
https://mc06.manuscriptcentral.com/genome-pubs
Genome
Draft
Genome size as a diagnostic tool
Since species identification in Avena is difficult, it is possible to find misidentified accessions
within large genebank collections. Such misidentifications can result in wasted resources and
erroneous scientific results. Some misidentifications can be corrected through morphological
observation, but this requires extensive field- or greenhouse-scale grow-outs, trained experts, and
substantial investment in time. In contrast, flow-cytometric assays on seedlings are rapid and
inexpensive, and these could be used to screen large collections in support of correct
identification. This possibility was suggested through the work of Crosby et al. (2014) in which
unexpected variation in ploidy level was observed among accessions previously identified as A.
barbata. Here, and elsewhere in the genus Avena (e.g. A. sterilis vs A. insularis), it appears that
species having similar morphology but different ploidy levels is common. In such cases a single
replication of flow cytometry would effectively identify errors. However, multiple replications
together with a series of standard check varieties would be required to detect the smaller
differences identified in this work. Flow cytometry could also be used in parallel with high-
throughput marker analysis, and could alleviate anticipated problems in the use of markers to
distinguish among species that carry closely-related sub-genomes in different combinations and
ploidy levels.
Genome size reduction after polyploidization
The availability of tetraploid and hexaploid species together with their diploid progenitor
genomes provided an opportunity to test for additivity in the size of sub-genome components.
Since diploid representatives of the B- and D-genomes are not known, but the genomes are
considered to be similar to the A genome (Rajhathy and Thomas 1974; Leggett and Markhand
Page 15 of 41
https://mc06.manuscriptcentral.com/genome-pubs
Genome

Draft
1995; Katsiotis et al. 1997; Shelukhina et al. 2008; Peng et al. 2010), the average A and C
genome sizes of the diploids were used to model predicted polyploid genome sizes (Figure 3).
These predictions suggest that polyploid species have genome sizes similar to the sum of their
putative genome progenitors, but that a systematic downsizing has occurred in all of the
polyploid species except for the perennial tetraploid species A. macrostachya. An alternate (or
additional) explanation could be that the unknown B and D genomes are actually smaller than
the observed A genomes. The hypothesis that the B genome is smaller than the A genome was
put forward by Iiyama and Grant (1972) for this reason, although this was also in support of a
proposed AABBDD genome constitution for the hexaploid, which has been subsequently
rejected. Polyploid genome downsizing has been observed in most angiosperms, and is assumed
to be a general trend (Kellogg and Bennetzen 2004; Pellicer et al. 2010a). The mechanisms
leading to loss of the DNA in polyploids include unequal homologous recombination (Bennetzen
et al. 2005), non-homologous recombination (Devos et al. 2002), general elimination of
redundant DNA (Ozkan et al. 2003; Leitch and Bennett 2004) and specific elimination of
duplicate genes (Renny-Byfield and Wendel 2014; Evans et al. 2015). It is interesting that A.
macrostachya, the only known perennial outcrossing species in Avena, appears to show the
opposite trend (genome inflation). However, an alternate explanation for this deviation in A.
macrostachya could be that the Cm genome differs substantially in size from the diploid C
genomes observed in this study. It has been suggested that Cm is ancestral to the C genome type
(Rodionov et al. 2005; Badaeva et al. 2010), and large differences in chromosome morphology
and heterochromatin distribution have been observed in A. macrostachya relative to other C
genome diploids (Hutchinson and Postoyko 1986; Rodionov et al. 2005; Badaeva et al. 2010).
Furthermore, symmetrical chromosomes as well as large heterochromatic blocks are more
Page 16 of 41
https://mc06.manuscriptcentral.com/genome-pubs
Genome

Draft
apparent in A. macrostachya than in other Avena species. Thus, Badaeva et al. (2010) suggested
that A. macrostachya formed via chromosome duplication from an ancestral C genome diploid
that is no longer extant, and that this occurred prior to the formation of the present C and A
genomes. Our results support this hypothesis, although other explanations cannot be excluded at
this stage.
Conclusion
The genome sizes reported here for most of the recognized species in the genus Avena should
provide consistent and reliable benchmarks to assist in further characterization of the
evolutionary relationships among these important species. Furthermore, these estimates will
facilitate the planning and calibration of future mapping and genome sequencing efforts. It is
fortunate that substantial diversity in the genus Avena has been preserved in many national
germplasm collections, but the number of accessions from some species is quite limited. Further
characterization of diversity in the genus Avena is needed in order to inform future decisions on
germplasm collection, conservation, and utilization.
Acknowledgements
We thank Paul Kron for expert advice regarding flow cytometry, and members of the Canadian
and US Genebank teams for expert assistance in maintaining and providing germplasm. This
work was made possible by outstanding technical assistance from Charlene Wight and Kathie
Page 17 of 41
https://mc06.manuscriptcentral.com/genome-pubs
Genome

Draft
Upton. This work was funded by an AAFC Crop Genomics project. Funding for H. Yan was
provided by a China Ministry of Education scholarship.
References:
Ahmad, M., Gul-Zaffar, Z.A., and Habib, M. 2014. A review on Oat (Avena sativa L.) as a dual-
purpose crop. Sci. Res. Essays. 9(4): 52-59. doi:10.5897/SRE2014.5820.
Badaeva, E.D., Shelukhina, O.Y., Diederichsen, A., Loskutov, I.G., and Pukhalskiy, V.A. 2010.
Comparative cytogenetic analysis of Avena macrostachya and diploid C-genome Avena species.
Genome, 53(2), 125-137. doi:10.1139/G09-089.
Bai, C., Alverson, W.S., Follansbee, A., and Waller, D.M. 2012. New reports of nuclear DNA
content for 407 vascular plant taxa from the United States. Ann. Bot. 110(8): 1623-1629. doi:
10.1093/aob/mcs222.
Baum, B.R. 1977. Oats: Wild and cultivated. A monograph of the genus Avena L. (Poaceae).
Minister of Supply and Services Canada, Ottawa, Ontario: Agriculture Canada.
Baum, B.R., and Fedak, G. 1985a. Avena atlantica, a new diploid species of the oat genus from
Morocco. Can. J. Bot. 63(6): 1057-1060. doi:10.1139/b85-144.
Baum, B.R., and Fedak, G. 1985b. A new tetraploid species of Avena discovered in Morocco.
Can. J. Bot. 63(8): 1379-1385. doi:10.1139/b85-191.
Beaulieu, J.M., Leitch, I.J., and Knight, C.A. 2007a. Genome size evolution in relation to leaf
strategy and metabolic rates revisited. Ann. Bot. 99(3): 495-505. doi:10.1093/aob/mcl271.
Page 18 of 41
https://mc06.manuscriptcentral.com/genome-pubs
Genome

Draft
Beaulieu, J.M., Moles, A.T., Leitch, I.J., Bennett, M.D., Dickie, J.B., and Knight, C.A. 2007b.
Correlated evolution of genome size and seed mass. New Phytol. 173(2), 422-437.
doi:10.1111/j.1469-8137.2006.01919.x.
Bennett, M.D., and Smith, J.B. 1976. Nuclear DNA amounts in angiosperms. Philos T Roy Soc
B. 274(933): 227-274. doi:10.1098/rstb.1976.0044.
Bennett, M.D., and Leitch, I.J. 2005. Nuclear DNA amounts in angiosperms: progress, problems
and prospects. Ann. Bot. 95(1): 45-90. doi:10.1093/aob/mci003.
Bennett, M.D., H, J.P., and J, S.J. 2008. Anthocyanin inhibits propidium iodide DNA
fluorescence in Euphorbia pulcherrima: implications for genome size variation and flow
cytometry. Ann. Bot. 101(6): 777-790. doi:10.1093/aob/mcm303.
Bennett, M.D., and Leitch, I.J. 2012. Plant DNA C-values database (release 6.0, Dec. 2012).
Accessible http://www.kew.org/cvalues/.
Bennetzen, J.L., Ma, J., and Devos, K.M. 2005. Mechanisms of recent genome size variation in
flowering plants. Ann. Bot. 95(1): 127-132. doi:10.1093/aob/mci008.
Bullen, M.R., and Rees, H. 1972. Nuclear variation within Avenae. Chromosoma, 39(1): 93-100.
doi:10.1007/BF00320593.
Chae, W.B., Hong, S.J., Gifford, J.M., Rayburn, A.L., Sacks, E.J., and Juvik, J.A. 2014. Plant
morphology, genome size, and SSR markers differentiate five distinct taxonomic groups among
accessions in the genus Miscanthus. Glob Change Biol Bioenergy. 6(6): 646-660.
doi:10.1111/gcbb.12101.
Page 19 of 41
https://mc06.manuscriptcentral.com/genome-pubs
Genome

Draft
Crosby, K., Stokes, T.O., and Latta, R.G. 2014. Evolving California genotypes of Avena barbata
are derived from multiple introductions but still maintain substantial population structure. Peer J.
2: e633. doi:10.7717/peerj.633.
Cullis, C.A. 2005. Mechanisms and control of rapid genomic changes in flax. Ann. Bot. 95(1):
201-206. doi:10.1093/aob/mci013.
Devos, K.M., Brown, J.K.M., and Bennetzen, J.L. 2002. Genome size reduction through
illegitimate recombination counteracts genome expansion in Arabidopsis. Genome Res. 12(7):
1075-1079. doi:10.1101/gr.132102.
Díez, C.M., Gaut, B.S., Meca, E., Scheinvar, E., Montes-Hernandez, S., Eguiarte, L.E., and
Tenaillon, M.I. 2013. Genome size variation in wild and cultivated maize along altitudinal
gradients. New Phytol. 199(1): 264-276. doi:10.1111/nph.12247.
Doležel, J., Sgorbati, S., and Lucretti, S. 1992. Comparison of three DNA fluorochromes for
flow cytometric estimation of nuclear DNA content in plants. Physiol Plantarum. 85(4): 625-631.
doi:10.1111/j.1399-3054.1992.tb04764.x.
Doležel, J., Greilhuber, J., Lucretti, S., Meister, A., Lysák, M.A., Nardi, L., and Obermayer, R.
1998. Plant genome size estimation by flow cytometry: inter-laboratory comparison. Ann. Bot.
82(suppl 1): 17-26.
Doležel, J., Bartoš, J., Voglmayr, H., and Greilhuber, J. 2003. Nuclear DNA content and genome
size of trout and human. Cytom Part A. 51: 127-8. doi:10.1002/cyto.a.10013.
Doležel, J., Greilhuber, J., and Suda, J. 2007. Estimation of nuclear DNA content in plants using
flow cytometry. Nat. Protoc. 2(9): 2233-2244. doi:10.1038/nprot.2007.310.
Page 20 of 41
https://mc06.manuscriptcentral.com/genome-pubs
Genome

Draft
Eilam, T., Anikster, Y., Millet, E., Manisterski, J., Sagi-Assif, O., and Feldman, M. 2007.
Genome size and genome evolution in diploid Triticeae species. Genome, 50(11): 1029-1037.
doi:10.1139/G07-083.
Evans, J., Crisovan, E., Barry, K., Daum, C., Jenkins, J., Kunde-Ramamoorthy, G., Nandety, A.,
Ngan, C.Y., Vaillancourt, B., and Wei, C.L. 2015. Diversity and Population Structure of
Northern Switchgrass as Revealed Through Exome Capture Sequencing. Plant J. 84(4): 800-815.
doi:10.1111/tpj.13041.
Fominaya, A., Vega, C., and Ferrer, E. 1988. Giemsa C-banded karyotypes of Avena species.
Genome, 30(5): 627-632. doi:10.1139/g88-106.
Frey, K.J.1991. Genetic resources of oats. In: Use of plant introductions in cultivar development.
Part1. CSSA Special Publication. Edited by H.L Shands and L.E Weisner. Madison, Wisconsin.
pp.15-24.
Fu, Y.B., and Williams, D.J. 2008. AFLP variation in 25 Avena species. Theor. Appl. Genet.
117(3): 333-342. doi:10.1007/s00122-008-0778-3.
Greilhuber, J. 2005. Intraspecific variation in genome size in angiosperms: identifying its
existence. Ann. Bot. 95(1): 91-98. doi:10.1093/aob/mci004.
Greilhuber, J., Doležel, J., Lysák, M.A., and Bennett, M.D. 2005. The origin, evolution and
proposed stabilization of the terms ‘genome size’and ‘C-value’to describe nuclear DNA contents.
Ann. Bot. 95(1): 255-260. doi:10.1093/aob/mci019.
Page 21 of 41
https://mc06.manuscriptcentral.com/genome-pubs
Genome

Draft
Greilhuber, J., Borsch, T., Müller, K., Worberg, A., Porembski, S., and Barthlott, W. 2006.
Smallest angiosperm genomes found in Lentibulariaceae, with chromosomes of bacterial size.
Plant Biol. 8(6): 770-777. doi:10.1055/s-2006-924101.
Greilhuber, J., Temsch, E.M., and Loureiro, J. 2007. Nuclear DNA content measurement. In:
Flow cytometry with plant cells: analysis of genes, chromosomes and genomes. Edited by J.
Doležel, J. Greilhuber and J. Suda. Wiley-VCH Verlag GmbH & Co. KGaA, Weinheim,
Germany. pp. 67-101.
Grover, C.E., and Wendel, J.F. 2010. Recent insights into mechanisms of genome size change in
plants. J. Bot. 2010. doi:10.1155/2010/382732.
Henry, T.A., Bainard, J.D., and Newmaster, S.G. 2014. Genome size evolution in Ontario ferns
(Polypodiidae): evolutionary correlations with cell size, spore size, and habitat type and an
absence of genome downsizing. Genome, 57(10): 555-566. doi:10.1139/gen-2014-0090.
Hutchinson, J., Postoyko, J., Horn, W., Jensen, C. J., Odenbach, W., and Schieder, O. 1986. “C-
banding of Avena species.” Genetic manipulation in plant breeding. In: Proceedings international
symposium organized by Eucarpia, September 8-13, 1985, Berlin (West), Germany. pp. 157-159.
Iiyama, K., and Grant, W.F. 1972. A correlation of nuclear DNA content and thin-layer
chromatographic patterns in resolving genome relationships in Avena. Can. J. Bot. 50(7), 1529-
1545. doi:10.1139/b72-190.
Jellen, E.N., Phillips, R.L., and Rines, H.W. 1993. C-banded karyotypes and polymorphisms in
hexaploid oat accessions (Avena spp.) using Wright's stain. Genome, 36(6): 1129-1137.
doi:10.1139/g93-151.
Page 22 of 41
https://mc06.manuscriptcentral.com/genome-pubs
Genome

Draft
Kang, M., Tao, J., Wang, J., Ren, C., Qi, Q., Xiang, Q.Y., and Huang, H. 2014. Adaptive and
nonadaptive genome size evolution in Karst endemic flora of China. New Phytol. 202(4): 1371-
1381. doi:10.1111/nph.12726.
Katsiotis, A., Loukas, M., and Heslop-Harrison, J.S. 1997. The close relationship between the A
and B genomes in Avena L. (Poaceae) determined by molecular cytogenetic analysis of total
genomic, tandemly and dispersed repetitive DNA sequences. Ann. Bot. 79: 103-109.
doi:10.1006/anbo.1996.0312.
Kellogg, E.A., and Bennetzen, J.L. 2004. The evolution of nuclear genome structure in seed
plants. Am. J. Bot. 91(10): 1709-1725. doi:10.3732/ajb.91.10.1709.
Kelly, L.J., Renny-Byfield, S., Pellicer, J., Macas, J., Novák, P., Neumann, P., Lysak, M.A., Day,
P.D., Berger, M., Fay, M.F., Nichols, R.A., Leitch, A.R., and Leitch, I.J. 2015. Analysis of the
giant genomes of Fritillaria (Liliaceae) indicates that a lack of DNA removal characterizes
extreme expansions in genome size. New Phytol. 208(2): 596-607. doi:10.1111/nph.13471.
Ladizinsky, G. 1998. A new species of Avena from Sicily, possibly the tetraploid progenitor of
hexaploid oats. Genet Resour Crop Evol. 45(3): 263-269. doi:10.1023/A:1008657530466.
Ladizinsky, G. 1971. Avena prostrata: a new diploid species of oat. Israel J Bot. 20: 297-301.
Lavia, G.I., and Fernández, A. 2008. Genome size in wild and cultivated peanut germplasm.
Plant Syst Evol. 272(1-4): 1-10. doi:10.1007/s00606-007-0632-0.
Leggett, J.M., and Markhand, G.S. 1995. The genomic structure of Avena revealed by GISH. In:
Kew chromosome conference IV. Edited by P.E. Brandham and M.D. Bennett. Royal Botanic
Gardens, Kew. pp. 133-139.
Page 23 of 41
https://mc06.manuscriptcentral.com/genome-pubs
Genome

Draft
Leitch, I.J., and Bennett, M.D. 2004. Genome downsizing in polyploid plants. Biol. J. Linn. Soc.
82(4): 651-663. doi:10.1111/j.1095-8312.2004.00349.x.
Leitch, I.J., and Bennett, M.D. 2007. Genome size and its uses: the impact of flow cytometry. In:
Flow cytometry with plant cells: analysis of genes, chromosomes and genomes. Edited by J.
Doležel, J. Greilhuber and J. Suda. Wiley-VCH Verlag GmbH & Co. KGaA, Weinheim,
Germany. pp. 153-176.Linares, C., Vega, C., Ferrer, E., and Fominaya, A. 1992. Identification of
C-banded chromosomes in meiosis and the analysis of nucleolar activity in Avena byzantina C.
Koch cv ‘Kanota’. Theor. Appl. Genet. 83(5): 650-654. doi:10.1007/BF00226911.
Loskutov, I.G. 2008. On evolutionary pathways of Avena species. Genet Res Crop Evol 55(2):
211-220. doi:10.1007/s10722-007-9229-2
Loskutov, I.G., and Rines, H.W. 2011. Avena. In Wild Crop Relatives: Genomic and Breeding
Resources. Edited by C. Kole. Springer press, Heidelberg. pp.109-183.
Loureiro, J., Rodriguez, E., DOLEŽEL, J., and Santos, C. 2006. Flow cytometric and
microscopic analysis of the effect of tannic acid on plant nuclei and estimation of DNA content.
Ann. Bot. 98(3): 515-527. doi:10.1093/aob/mcl140.
Lysák, M.A., Rostková, A., Dixon, J.M., Rossi, G., and Doležel, J. 2000. Limited genome size
variation in Sesleria albicans. Ann. Bot. 86(2): 399-403. doi:10.1006/anbo.2000.1200.
McLeish, J., and Sunderland, N. 1961. Measurements of deoxyribosenucleic acid (DNA) in
higher plants by Feulgen photometry and chemical methods. Exp Cell Res. 24(3): 527-540.
doi:10.1016/0014-4827(61)90452-9.
Page 24 of 41
https://mc06.manuscriptcentral.com/genome-pubs
Genome

Draft
Moscone, E.A., Baranyi, M., Ebert, I., Greilhuber, J., Ehrendorfer, F., and Hunziker, A.T. 2003.
Analysis of nuclear DNA content in Capsicum (Solanaceae) by flow cytometry and Feulgen
densitometry. Ann. Bot. 92(1): 21-29. doi:10.1093/aob/mcg105.
Noirot, M., Barre, P., Duperray, C., Hamon, S., and De Kochko, A. 2005. Investigation on the
causes of stoichiometric error in genome size estimation using heat experiments: consequences
on data interpretation. Ann. Bot. 95(1): 111-118. doi:10.1093/aob/mci006.
Ochatt, S.J. 2008. Flow cytometry in plant breeding. Cytom Part A. 73(7): 581-598.
doi:10.1002/cyto.a.20562.
Ormerod, M.G., and Novo, D. 2008. Data analysis. In: Flow cytometry: a basic introduction.
Edited by M.G. Ormeroded. Los Angeles: De Novo Software.
Ozkan, H., Tuna, M., and Arumuganathan, K. 2003. Nonadditive changes in genome size during
allopolyploidization in the wheat (Aegilops-Triticum) group. J. Hered. 94(3): 260-264.
doi:10.1093/jhered/esg053.
Pellicer, J., Garcia, S., Canela, M.A., Garnatje, T., Korobkov, A.A., Twibell, J.D., and Vallès, J.
2010a. Genome size dynamics in Artemisia L.(Asteraceae): following the track of polyploidy.
Plant Biol. 12(5): 820-830. doi:10.1111/j.1438-8677.2009.00268.x.
Pellicer, J., Fay, M. F., and Leitch, I.J. 2010b. The largest eukaryotic genome of them all?. Bot. J.
Linn. Soc. 164(1): 10-15. doi:10.1111/j.1095-8339.2010.01072.x.
Peng, Y.Y., Wei, Y M., Baum, B.R., Yan, Z.H., Lan, X.J., Dai, S.F., and Zheng, Y.L. 2010.
Phylogenetic inferences in Avena based on analysis of FL intron2 sequences. Theor. Appl. Genet.
121(5): 985-1000. doi:10.1007/s00122-010-1367-9.
Page 25 of 41
https://mc06.manuscriptcentral.com/genome-pubs
Genome
Draft
Piegu, B., Guyot, R., Picault, N., Roulin, A., Saniyal, A., Kim, H., Collura, K., Brar, D.S.,
Jackson, S., Wing, R.A., and Panaud, O. 2006. Doubling genome size without polyploidization:
dynamics of retrotransposition-driven genomic expansions in Oryza australiensis, a wild relative
of rice. Genome Res. 16(10): 1262-1269. doi:10.1101/gr.5290206.
Rajhathy, T., and Morrison, J.W. 1959. Chromosome morphology in the genus Avena. Can. J.
Bot. 37: 331-337. doi:10.1139/b59-024.
Rajhathy, T., and Thomas, H. 1974. Cytogenetics of oats (Avena L.) Ottawa: Genetics Society of
Canada 90p. Miscellaneous Publications of the Genetics Society of Canada, (2).
Rasane, P., Jha, A., Sabikhi, L., Kumar, A., and Unnikrishnan, V. S. 2015. Nutritional
advantages of oats and opportunities for its processing as value added foods-a review. J. Food.
Sci. Technol. 52(2): 662-675. doi:10.1007/s13197-013-1072-1.
Renny-Byfield, S., and Wendel, J.F. 2014. Doubling down on genomes: polyploidy and crop
plants. Am. J. Bot. 101(10): 1711-1725. doi:10.3732/ajb.1400119.
Rodionov, A.V., Tyupa, N.B., Kim, E.S., Machs, E.M., and Loskutov, I.G. 2005. Genomic
configuration of the autotetraploid oat species Avena macrostachya inferred from comparative
analysis of ITS1 and ITS2 sequences: on the oat karyotype evolution during the early events of
the Avena species divergence. Russ. J. Genet. 41(5): 518-528. doi:10.1007/s11177-005-0120-y.
Rooney, W.L., Rines, H.W., and Phillips, R.L. 1994. Identification of RFLP Markers Linked to
Crown Rust Resistance Genes Pc 91 and Pc in Oat. Crop Sci. 34(4): 940-944.
doi:10.2135/cropsci1994.0011183X003400040019x.
Page 26 of 41
https://mc06.manuscriptcentral.com/genome-pubs
Genome

Draft
Schmuths, H., Meister, A., Horres, R., and Bachmann, K. 2004. Genome size variation among
accessions of Arabidopsis thaliana. Ann. Bot. 93(3): 317-321. doi:10.1093/aob/mch037.
Shelukhina, O.Y., Badaeva, E.D., Brezhneva, T.A., Loskutov, I.G., and Pukhalsky, V.A. 2008.
Comparative analysis of diploid species of Avena L. using cytogenetic and biochemical markers:
Avena canariensis Baum et Fedak and A. longiglumis Dur. Russ. J. Genet. 44(6): 694-701.
doi:10.1134/S1022795408060094.
Sugiyama, S. 2005. Developmental basis of interspecific differences in leaf size and specific leaf
area among C3 grass species. Func. Ecol. 19(6): 916-924. doi:10.1111/j.1365-
2435.2005.01044.x.
Thomas, H., Leggett, J.M., and Jones, I.T. 1975. The addition of a pair of chromosomes of the
wild oat Avena barbata (2n= 28) to the cultivated oat A. sativa L.(2n= 42). Euphytica, 24(3):
717-724. doi:10.1007/BF00132910.
Thomas, H. 1992. Cytogenetics of Avena. In: Oat Science and Technology, Monograph 33,
Agronomy Series. Edited by H.G. Marshall and M.E. Sorrells. Madison, Wisconsin. pp. 473-508.
Wang, Y., Bigelow, C.A., and Jiang, Y. 2009. Ploidy level and DNA content of perennial
ryegrass germplasm as determined by flow cytometry. HortScience, 44(7): 2049-2052.
Yan, H.H., Baum, B.R., Zhou, P.P., Zhao, J., Wei, Y.M., Ren, C.Z., Xiong, F.Q., Liu, G., Zhong,
Lin., Zhao, G., and Peng, Y.Y. 2014. Phylogenetic analysis of the genus Avena based on
chloroplast intergenic spacer psb A-trn H and single-copy nuclear gene Acc1. Genome, 57(5):
267-277. doi:10.1139/gen-2014-0075.
Page 27 of 41
https://mc06.manuscriptcentral.com/genome-pubs
Genome

Draft
Table 1. List of Avena species in order of increasing genome size (as measured) including ploidy
levels, predicted haplomes, number of accessions measured, mean 2C- values with standard
deviations and ranges, LSD test, HSD test, and internal standards used in measurement.
Speciesa Haplome Ploidy
level
No. of
accessions
Mean 2C values
± S.D (pg DNA)b
2C-value range
(pg DNA)
LSD
test c
HSD
testd
Internal
standarde
A. damascena Ad 2n=2x 3 8.43 ± 0.11 8.41 - 8.45 a a V
A. lusitanica As 2n=2x 3 8.72 ± 0.28 8.52 - 8.92 b ab V
A. canariensis Ac 2n=2x 5 8.80 ± 0.13 8.70 - 8.93 b ab V
A. hispanica As 2n=2x 3 8.80± 0.14 8.71 - 8.96 b b V
A. brevis As 2n=2x 3 8.98 ± 0.25 8.77 - 9.09 c bc V
A. hirtula As 2n=2x 3 9.08 ± 0.11 9.01 - 9.13 c bc V
A. nuda As 2n=2x 3 9.08 ± 0.17 9.00 - 9.19 cd bc V
A. strigosa As 2n=2x 10 9.07 ± 0.22 8.74 - 9.38 cd bc V
A. wiestii As 2n=2x 2 9.08 ± 0.20 9.04- 9.10 cd bc V
A. atlantica As 2n=2x 4 9.22 ± 0.24 8.94 – 9.52 d c V
A. longiglumis Al 2n=2x 3 9.23 ± 0.20 9.11 - 9.42 d c V
A. clauda Cp 2n=2x 3 10.31 ± 0.12 10.26 - 10.41 e d V
A. eriantha Cp 2n=2x 3 10.18 ± 0.22 10.02 - 10.33 e d V
A. ventricosa Cv 2n=2x 2 10.29 ± 0.25 10.19 - 10.36 e d V
A. barbata AB 2n=4x 5 16.42 ± 0.15 16.32 - 16.58 f e V
A. vaviloviana AB 2n=4x 5 16.38 ± 0.18 16.31 - 16.62 f d V
A. abyssinica AB 2n=4x 4 16.73 ± 0.29 16.49 - 16.97 g f V
A. agadiriana AB 2n=4x 4 17.49 ± 0.24 17.23 - 17.68 h g V
A. insularis ACf 2n=4x 3 18.59 ± 0.17 18.43 - 18.79 i h V
A. maroccana AC 2n=4x 3 18.51 ± 0.20 18.31 - 18.67 i h V
A. murphyi AC 2n=4x 1 18.70 ± 0.32 18.56 - 19.13 i h V
A. macrostachya CmCm 2n=4x 1 21.78 ± 0.20 NA NA NA V
A. fatua ACD 2n=6x 3 25.81 ± 0.18 25.76 - 25.90 k i P
A. occidentalis ACD 2n=6x 3 25.69 ± 0.27 25.44 - 25.81 k i P
A. sativa ACD 2n=6x 13 25.70 ± 0.40 25.30 - 26.24 k I P
A. sterilis ACD 2n=6x 4 25.75 ± 0.23 25.49 - 25.94 k i P
a Species that are considered in this work to be homotypic include: A. nudi-brevis (=A. nuda), A.
pilosa (=A. eriantha), A. magna (=A. maroccana), A. ludoviciana (=A. sterilis), A. byzantina (=A.
sativa). The incorrect use of “A. nuda” to refer to a hulless hexaploid species has been corrected
to the accepted classification within A. sativa.
Page 28 of 41
https://mc06.manuscriptcentral.com/genome-pubs
Genome
Draft
b Comparison among species was performed based on accessions as biological replicates except
for A. murphyi where only one viable accession was available and multiple plants were grown
instead. For A. macrostachya, only one viable plant was available and statistical inferences were
not made.
c Species followed by identical lowercase letters are not significantly different at α=0.05 based
on an unadjusted Fisher’s least significant difference (LSD) test.
d Species followed by identical lowercase letters are not significantly different at α=0.05 based
on an unadjusted Tukey’s honest significance difference (HSD) test.
e The characters V and P represent the internal reference standard species Vicia faba and Pisum
sativum, respectively.
f A. insularis has occasionally been designated CD (e.g., Loskutov, 2008). Although this
constitution has not been substantiated, the similarity between A and D genomes remains a
potential source of revision.
Page 29 of 41
https://mc06.manuscriptcentral.com/genome-pubs
Genome

Draft
Table 2. Nested analysis of variance (ANOVA) of genome size (pg/2C) in the genus Avena..
Source a df MS F Sig. Variancec
Ploidy 2 5287.611 133.8 <0.0001 NA
Genome 7 26.354 30.5 <0.0001 2.201
Species 16 1.025 9.12 <0.0001 0.058
Accession 85 0.114 2.70 (<0.0001)b 0.018
Error 252 0.042 0.047
a Ploidy is a fixed factor with three levels (diploid, tetraploid, hexaploid) and 2 degrees of
freedom (df). Remaining factors are considered random (as required to estimate variance
components of a nested design) with df equal to one less than the number of observed levels
minus the df used in the preceding level. For example, the ten genome levels (As, Ac, Ad, Al,
Cp, Cv, AB, AC, CmCm, and ACD) within three ploidy levels leaves seven df.
b The significance test of accessions is not entirely valid because technical replicates, which form
the error term, were not randomly assigned. This variance ratio and significant test are reported
as guidance to the scale of variance components.
c Variance components were estimated by REML in SPSS. A parallel analysis using the package
‘nlme’ in R, gave similar results.
Page 30 of 41
https://mc06.manuscriptcentral.com/genome-pubs
Genome

Draft
Table 3. Comparison of present and previous estimates of genome size in Avena species.
Speciesa 2C value (pg)
Present study
2C value (pg) reported in previous studies
Bullen and Rees
(1972)b
Iimaya and Grant
(1972)c
Bennet and Smith
(1976)
A. brevis 8.98 8.9 (10.8) 9.5
A. strigosa 9.07 9.7 (11.7) 10 8
A. hirtula 9.08 9.4 (11.4) 9.8 8.8
A. nuda 9.08 8.8 (10.6)
A. wiestii 9.08 10.3 (12.4) 9.8
A. longiglumis 9.23 9.9 (12.0) 9.8 10.6
A. eriantha 10.18 11 9.5
A. ventricosa 10.29 10.9
A. clauda 10.31 10.6
A. vavilovana 16.38 17.0 (20.5) 18.4
A. barbata 16.42 18.5 (22.4) 18.1 17.8
A. abyssinica 16.73 17.9 (21.6) 18 9.6
A. maroccana 18.51 19.4 18.6
A. sativa 25.7 27.5 (33.2) 26.5
A. sterilis 25.75 28.6 (34.5) 28.2 27.3
A. fatua 25.81 28.3 (34.2) 25.7
a The species A.nudi-brevis, A. pilosa, and A. magna used in previous studies are synonymous to
A. nuda, A. eriantha, and A. maroccana, respectively, according to Baum’s (1977) monograph.
b The 2C estimates outside parentheses are absolute DNA contents re-calibrated by Bennet and
Smith (1976). The values in parentheses were original data obtained from Bullen and Rees
(1972).
c The 2C values displayed were re-calibrated by Bennet and Smith (1976).
Page 31 of 41
https://mc06.manuscriptcentral.com/genome-pubs
Genome

Draft
Figure Captions
Figure 1. Fluorescence histograms of PI-stained nuclei isolated from Avena species and internal
standard plants leaves. A. Avena diploid species A. damascena (Ad genome) and Vicia faba; B.
tetraploid species A. insularis (AC genome) and Vicia faba; C. hexaploid species A. sterilis
(ACD genome) and Pisum sativum. Note that the absolute readings on the PI flourescene scale
can vary due to several intrinsic experimental factors. For this reason C-values are computed
based on the standards which are included and co-chopped with each sample assay.
Figure 2. Box plots of mean 2C values by accession within species. Dark horizontal lines show
the median observation. Boxes above and below this line indicate quartiles. Lines at the ends of
the vertical whiskers indicate extreme data points.
Figure 3. Comparison of observed (blue) and predicted (red) 2C-values in polyploid species of
Avena. Predictions are based on the average A and C diploid genome sizes (8.95 and 10.26 pg,
respectively), and the assumption that B and D genomes are equivalent in size to the A genome.
Thus, predictions were: AB=2A, AC=A+C, CC=2C, and ACD=2A+C. Observed values are
averaged across species with a given genome constitution.
Page 32 of 41
https://mc06.manuscriptcentral.com/genome-pubs
Genome

Draft
Supplemental material
Supplemental Table S1. Genome size estimates for all accessions used in the present study
including their species names, reported genome constitutions, accession numbers, origins, 2C-
value with standard deviations, average coefficient variation of 2C values, average number of
nuclei, and average coefficient variation of the cell distributions used in genome size predictions.
Supplemental Figure S1. Box plots of residuals for individual replicates after fitting means of
accessions. Dark horizontal lines show the median values. Boxes above and below this line
indicate quartiles, and lines at the ends of the vertical whiskers indicate extreme data points.
Page 33 of 41
https://mc06.manuscriptcentral.com/genome-pubs
Genome

Draft
Figure 1. Fluorescence histograms of PI-stained nuclei isolated from Avena species and internal standard plants leaves. A. Avena diploid species A. damascena (Ad genome) and Vicia faba; B. tetraploid species A. insularis (AC genome) and Vicia faba; C. hexaploid species A. sterilis (ACD genome) and Pisum sativum.
183x191mm (96 x 96 DPI)
Page 34 of 41
https://mc06.manuscriptcentral.com/genome-pubs
Genome

Draft
Figure 2. Box plots of mean 2C values by accession within species. Dark horizontal lines show the median observation. Boxes above and below this line indicate quartiles. Lines at the ends of the vertical whiskers
indicate extreme data points. 168x159mm (600 x 600 DPI)
Page 35 of 41
https://mc06.manuscriptcentral.com/genome-pubs
Genome

Draft
Figure 3. Comparison of observed (blue) and predicted (red) 2C-values in polyploid species of Avena. Predictions are based on the average A and C diploid genome sizes (8.95 and 10.26 pg, respectively), and the assumption that B and D genomes are equivalent in size to the A genome. Thus, predictions were: AB=2A, AC=A+C, CC=2C, and ACD=2A+C. Observed values are averaged across species with a given
genome constitution. 236x184mm (96 x 96 DPI)
Page 36 of 41
https://mc06.manuscriptcentral.com/genome-pubs
Genome

Draft
Table S1. All accessions used in the present study including their species names, reported
genome constitutions, accession numbers, origins, 2C-value with standard deviations, average
coefficient variation of 2C values, average number of nuclei, and average coefficient variation of
the cell distributions used in genome size predictions.
Species Haplome Accession
No.a
Origin or Source Mean 2C values
± S.D (pg DNA)
CVtb (%) Mean
nuclei
Mean CVnc
(%)
A. atlantica As CN25849 Morocco 8.94 ± 0.04 0.45 1866 2.45
CN25859 Morocco 9.23 ± 0.03 0.33 3612 1.73
CN25887 Morocco 9.52 ± 0.20 2.10 2036 2.85
CN25897 Morocco 9.17 ± 0.08 0.87 3528 1.77
A. brevis As CN53507 Germany 9.09 ± 0.10 1.10 2958 2.03
CN58163 Ontario, Canada 9.05 ± 0.40 4.42 3140 2.23
CN53508 United States 8.77 ± 0.09 1.03 2912 2.35
A. hirtula As CN21703 Morocco 9.09 ± 0.06 0.66 2611 1.77
CN22633 Tunisia 9.01 ± 0.16 1.78 2737 1.88
CN19530 Turkey 9.13 ± 0.11 1.20 3391 1.80
A. hispanica As CN25698 Portugal 8.96 ± 0.10 1.12 2056 1.55
CN25727 Portugal 8.71 ± 0.04 0.46 3513 2.13
CN25787 Portugal 8.74 ± 0.12 1.49 2617 2.19
A. lusitanica As CN25885 Morocco 8.92 ± 0.36 4.04 2550 1.95
CN26265 Portugal 8.72 ± 0.23 2.64 1878 1.92
CN26441 Spain 8.52 ± 0.11 1.29 3473 1.77
A. nuda As CN79356 Germany 9.06 ± 0.17 1.88 2222 1.61
CN79351 Netherlands 9.19 ± 0.22 2.39 1937 2.37
CN79350 United Kingdom 9.00 ± 0.11 1.22 2642 1.47
A. strigosa As CN21993 Portugal 8.86 ± 0.04 0.56 6023 1.34
CN21994 Portugal 9.38 ± 0.01 0.11 2747 2.53
CN21996 Spain 9.18 ± 0.20 2.18 2704 2.20
CN21997 Spain 9.04 ± 0.31 3.54 1780 1.61
CN21998 Spain 8.97 ± 0.09 1.00 1784 1.77
CN21999 Spain 9.15 ± 0.15 1.64 1774 1.79
CN22000 Spain 9.11 ± 0.22 2.41 1798 1.56
CN22001 Spain 9.20 ± 0.12 1.30 2645 1.70
CN54038 United Kingdom 8.98 ± 0.14 1.67 2415 1.57
CN55100 United Kingdom 8.74 ± 0.09 1.14 2599 2.39
A. wiestii As PI53626_1 Giza, Egypt 9.36 ± 0.16 1.71 1814 3.19
PI53626_2 Giza, Egypt 8.88 ± 0.06 0.79 2369 2.15
Page 37 of 41
https://mc06.manuscriptcentral.com/genome-pubs
Genome

Draft
PI53626_3 Giza, Egypt 8.88 ± 0.09 1.01 2320 2.20
CN58104_1 Ontario, Canada 9.09 ± 0.14 1.54 2600 2.08
CN58104_2 Ontario, Canada 9.18 ± 0.12 1.31 3340 2.48
CN58104_3 Ontario, Canada 9.04 ± 0.19 2.10 2818 1.71
A. canariensis Ac CN23017 Canary Islands,
Spain
8.87 ± 0.15 1.69 1700 2.49
CN23029 Canary Islands,
Spain
8.79 ± 0.11 1.37 1932 2.23
CN25442 Canary Islands,
Spain
8.73 ± 0.11 1.26 2218 1.89
CN26172 Canary Islands,
Spain
8.93 ± 0.09 1.01 2753 1.98
CN26195 Canary Islands,
Spain
8.70 ± 0.06 0.69 2204 1.96
A. damascena Ad CN19457 Syria 8.45 ± 0.17 2.01 2480 1.83
CN19458 Syria 8.41 ± 0.07 0.83 2086 2.05
CN19459 Syria 8.44 ± 0.10 1.18 2290 1.98
A. longiglumis Al CN58139 Libya 9.42 ± 0.09 0.96 1876 1.83
CN58138 Oran, Algeria 9.11 ± 0.22 2.41 1630 1.99
CN73757 Setubal, Portugal 9.17 ± 0.13 1.42 2366 2.25
A. clauda Cp CN21388 Algeria 10.26 ± 0.13 1.27 3163 1.46
CN21378 Greece 10.41 ± 0.05 0.48 3814 1.88
CN19205 Iran 10.27 ± 0.14 1.36 1962 2.28
A. eriantha Cp CN21992 Cyprus 10.33 ± 0.31 3.00 2016 2.65
CN58101 United Kingdom 10.02 ± 0.10 1.10 3559 2.00
CN73755 Madrid, Spain 10.19 ± 0.10 0.98 2820 1.99
A. ventricosa Cv CN21405_1 Algeria 10.30 ± 0.24 2.33 2682 2.47
CN21405_2 Algeria 10.62 ± 0.27 2.54 1950 2.53
CN21405_3 Algeria 10.37 ± 0.22 2.12 2764 2.33
CN21405_4 Algeria 10.11 ± 0.03 0.30 1671 1.76
CN39706_1 Azerbaijan 10.10 ± 0.05 0.50 2022 2.54
CN39706_2 Azerbaijan 10.32 ± 0.36 3.59 1756 2.36
CN39706_3 Azerbaijan 10.17 ± 0.09 0.89 2359 1.46
A. abyssinica AB CN21939 Ethiopia 16.97 ± 0.25 1.47 1945 2.32
CN21941 Ethiopia 16.62 ± 0.19 1.14 1637 2.34
CN22076 Ethiopia 16.85 ± 0.35 2.08 1822 1.89
CN22092 Ethiopia 16.49 ± 0.12 0.73 2514 2.08
A. agadiriana AB CN25837 Morocco 17.23 ± 0.13 0.75 3258 2.55
CN25854 Morocco 17.68 ± 0.21 1.19 2576 2.98
CN25856 Morocco 17.47 ± 0.19 1.09 2138 2.59
CN25863 Morocco 17.59 ± 0.09 0.51 1960 2.85
Page 38 of 41
https://mc06.manuscriptcentral.com/genome-pubs
Genome

Draft
A. barbata AB CN73713 Beja, Portugal 16.38 ± 0.16 0.98 2002 2.54
CN71818 Greece 16.39 ± 0.12 0.73 2121 2.63
CN64812 Israel 16.58 ± 0.07 0.42 2494 2.50
CN71804 Izmir, Turkey 16.32 ± 0.19 1.16 2969 2.40
PI296229 Northern, Israel 16.42 ± 0.11 0.61 2730 2.78
A. vaviloviana AB CN21905 Ethiopia 16.62 ± 0.24 1.44 1582 1.67
CN22004 Ethiopia 16.31 ± 0.11 0.74 2249 2.30
CN22005 Ethiopia 16.31 ± 0.14 0.92 2242 2.25
CN22228 Ethiopia 16.35 ± 0.15 0.92 2168 2.18
CN22422 Ethiopia 16.33 ± 0.16 0.98 2354 2.26
A. insularis AC CN19178 Italy 18.43 ± 0.05 0.27 1577 1.54
CN108634 Tunisia 18.79 ± 0.06 0.32 2814 2.29
CN108635 Tunisia 18.54 ± 0.04 0.22 2358 2.28
A. maroccana AC Cia8831 Khemisset, Morocco 18.31 ± 0.09 0.49 2286 2.82
CN23044 Morocco 18.56 ± 0.09 0.48 2012 1.94
CN23049 Morocco 18.67 ± 0.21 1.12 2854 2.47
A. murphyi AC CN21989_1 Spain 18.58 ± 0.15 0.81 2342 2.31
CN21989_2 Spain 18.56 ± 0.28 1.51 2610 2.54
CN21989_3 Spain 18.59 ± 0.25 1.34 2582 2.35
CN21989_4 Spain 19.13 ± 0.29 1.57 1798 2.34
A. macrostachya CmCm CN24393 Algeria 21.78 ± 0.20 0.96 1993 2.23
A. fatua ACD CN24919 Iran 25.90 ± 0.16 0.62 1593 2.05
CN24167 Israel 25.76 ± 0.29 1.13 2467 1.84
CN22544 Turkey 25.77 ± 0.05 0.19 2752 2.01
A. occidentalis ACD CN23036 Spain 25.44 ± 0.37 1.45 2502 2.03
CN4541 Spain 25.81 ± 0.18 0.70 1210 1.73
CN4547 Spain 25.77 ± 0.19 0.74 1822 2.44
A. sativa ACD CN2807 United States 25.50 ± 0.31 1.26 1450 1.68
CN28697 United States 25.85 ± 0.09 0.35 1623 1.64
CN18136 Canada 25.90 ± 0.05 0.19 2189 2.05
CN4703 Canada 25.87 ± 0.48 1.86 3182 2.31
CN22330 Ethiopia 26.24 ± 0.22 0.84 1516 1.92
CN65923 Romania 25.56 ± 0.60 2.35 3331 2.49
CN1954 South Africa 25.43 ± 0.31 1.22 2402 2.44
CN25416 Spain 25.84 ± 0.22 0.85 1319 1.60
CN53087 Sweden 25.97 ± 0.22 0.85 2349 2.15
CN53094 Sweden 25.49 ± 0.67 2.67 2079 2.46
CN53165 Sweden 25.74 ± 0.16 0.62 2030 2.39
CN53326 Sweden 25.30 ± 0.09 0.36 2176 2.58
CN53173 United States 25.46 ± 0.31 1.22 1906 2.30
A. sterilis ACD CN20234 Iraq 25.94 ± 0.25 0.96 1424 1.77
Page 39 of 41
https://mc06.manuscriptcentral.com/genome-pubs
Genome
Draft
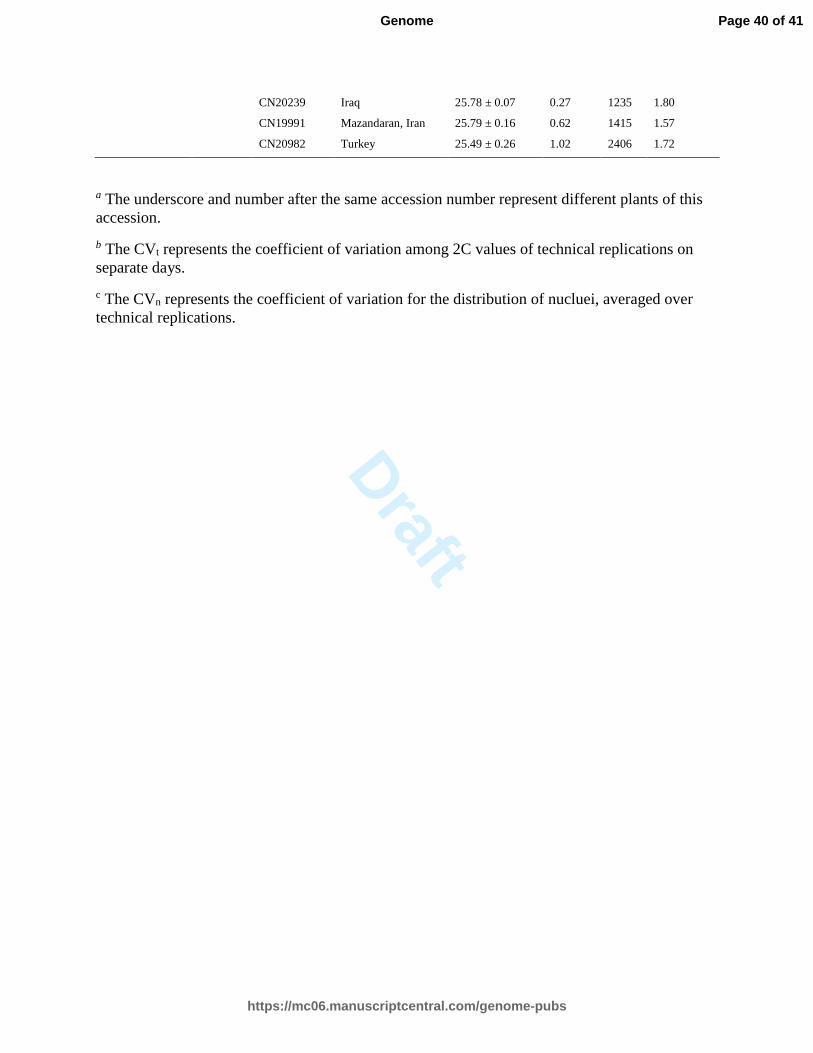
CN20239 Iraq 25.78 ± 0.07 0.27 1235 1.80
CN19991 Mazandaran, Iran 25.79 ± 0.16 0.62 1415 1.57
CN20982 Turkey 25.49 ± 0.26 1.02 2406 1.72
a The underscore and number after the same accession number represent different plants of this
accession.
b The CVt represents the coefficient of variation among 2C values of technical replications on
separate days.
c The CVn represents the coefficient of variation for the distribution of nucluei, averaged over
technical replications.
Page 40 of 41
https://mc06.manuscriptcentral.com/genome-pubs
Genome
Draft
168x159mm (600 x 600 DPI)
Page 41 of 41
https://mc06.manuscriptcentral.com/genome-pubs
Genome