munich personal repec archive - uni-muenchen.de · munich personal repec archive asean- india free...
TRANSCRIPT

MPRAMunich Personal RePEc Archive
ASEAN- India free trade agreement: anassessment of merchandise exports andimports.
Anil Varma
Zamorins Guruvayurappan College, Calicut-14
12 September 2015
Online at https://mpra.ub.uni-muenchen.de/75035/MPRA Paper No. 75035, posted 16 November 2016 14:23 UTC

1
ASEAN- India free trade agreement: an assessment of merchandise exports and imports1.
Introduction
Association of South East Asian Nations is an association of ten member states of the south
East Asia. It was formed in 1967 with the state of Indonesia, Malaysia, Philippines,
Singapore and Thailand. Later, Brune, Vietnam, Laos, Myanmar, and Cambodia enrolled as
members of the organisation. The ASEAN–India Free Trade Area (AIFTA) is a free trade
area among the ten member states of the Association of Southeast Asian Nations (ASEAN)
and India. The initial framework agreement was signed on 8 October 2003 in Bali, Indonesia.
The final agreement was signed on 13th August 2009. The free trade area as per the
agreement came into effect on 1 January 2010. The ASEAN–India Free Trade Area is the
fruit of mutually exclusive interest of both parties to expand their economic ties in the region.
India’s Look East policy was reciprocated by similar commercial interests of ASEAN
countries to expand westward.
India became a sectoral dialogue partner of ASEAN in 1992. India saw its trade with ASEAN
increase relative to its trade with the rest of the world. Between 1993 and 2003, ASEAN-
India bilateral trade grew at an annual rate of 11.2%. In 2014-15, the total volume of
ASEAN-India trade was 76527 million, around 10 % of India’s total trade. ASEAN’s export
to India was31, 812.58 million dollar and ASEAN’s imports from India was 31,812.58
million dollar. Much of India’s trade with ASEAN is directed towards Singapore, Malaysia,
and Thailand, with whom India holds strong economic relations. The sources of India’s
imports are mainly Indonesia, Malaysia Singapore Vietnam and others.
The general objective of the present paper is to review the provisions in India-ASEAN FTA
and merchandise exports and imports between both parties. This is expected to provide
deeper insight in to the research questions about the structural transformation in exports and
imports of India and ASEAN especially after the formation of ASEAN–India Free Trade
Agreement. The present paper is also expected to provide an analysis about the direction of
India’s trade with ASEAN. This has implications upon the much discussed aspects of India’s
1 The present paper is an independent work of the author from the experience as a principal investigator of a UGC minor research Project titled “Theoretical And Empirical Study On ASEAN- India Free Trade Agreement: A Case Study Of Kerala’s Plantation Sector”.
2
Look East policy. This may also help to impartially evaluate the reasons behind stiff
resistances against ASEAN-India FTA from some states in India, like the state of Kerala.
The present study is divided into five parts. The first part includes an introduction and the
provisions in the agreement. Second part is dedicated to examine India’s trade with ASEAN.
The third part deals with the direction and composition of India’s exports and imports with
the ASEAN countries. The fourth part is a brief analysis of the likely impact of the FTA and
the final part is the summery and conclusions.
The India- ASEAN FTA.
Applied MFN tariff rates for tariff lines placed in the Normal Track will be reduced and
subsequently eliminated in accordance with the following tariff reduction and elimination
schedule (ASEAN-India trade in goods agreement, 2009). Tariff lines included in the normal
track are classified in to normal track (1) and Normal track (2). There is a Sensitive track and
a Special product category. Besides this there is a highly sensitive list and an exclusion list.
The list and provisions may be specified as below.
Table 1: Normal track (1)
Source: ASEAN-India Comprehensive Economic Cooperation Agreement
Note: The Coverage of Normal track 1 is 80% of tariff lines and 75% of trade value
(imports).
COUNTRIES TARIFF
REDUCTION
PERCENTAGE
DATE
a Brune, Indonesia, Malaysia,
Singapore, Thailand, India .
100 2010 January 1 to 2013 December 31
b Philippines, India 100 2010 January 1 to 2013 December 31
c Ombodia, Myanmar, Laos,
Vietnam
100 2010 January 1 to 2018 December 31
c India 100 2010 January 1 to 2013 December 31

3
Table 2: Normal track (2)
COUNTRIES TARIFF
REDUCTION
PERCENTAGE
DATE
a Myanmar, Indonesia,
Malaysia, Singapore,
Thailand, India.
100 2010 January 1 to 2016 December 31
b Cambodia, Myanmar, Laos,
Vietnam
100 2010 January 1 to 2021 December 31
b India 100 2010 January 1 to 2016 December 31
Source: ASEAN-India Comprehensive Economic Cooperation Agreement
Table 3: Sensitive track:
COUNTRIES TARIFF
REDUCTION
PERCENTAGE
DATE
a Brune, Indonesia,
Malaysia, Singapore,
Thailand, India .
Reduce to 5% 2010 January 1 to 2016 December 31
b Philippines, India Reduce to 5% 2010 January 1 to 2019 December 31
a. India Reduce to 5% 2010 January 1 to 2016 December 31
c Cambodia, Myanmar, Laos,
Vietnam
Reduce to 5% 2010 January 1 to 2021 December 31
Source: ASEAN-India Comprehensive Economic Cooperation Agreement
This covers 10% of the tariff lines. For these items tariffs should not to exceed 5% (fifty
items). The tariffs of the rest of the items are to be reduced by 4.5 percentages, by Brune,
Indonesia, Malaysia, Singapore, Thailand and India. The rest of the countries should reduce
their tariffs to 4% within five years of their accession in to the treaty. The modalities for this
is as follows

4
Table 4: Tariff Elimination Schedule.
COUNTRIES TARIFF
REDUCTION
PERCENTAGE
DATE
a Brune, Indonesia,
Malaysia, Singapore,
Thailand, India .
0 2010 January 1 to 2019 December 31
b Philippines, India 0 2010 January 1 to 2022 December 31
c Cambodia, Myanmar, Laos,
Vietnam
0 2010 January 1 to 2024 December 31
Source: ASEAN-India Comprehensive Economic Cooperation Agreement
Table 6: Special product category
No Item Tariff 2007 Tariff 2019
1. Raw Palm oil 80 37.5
2. Refined Palm Oil 90 45
3. Pepper 70 50
4. Coffee 100 45
5. Tea 100 45
Source: ASEAN-India Comprehensive Economic Cooperation Agreement
Items like palm oil, pepper, coffee and tea are included in special category. It is a common
perception is that there is no problem because of this. But it is maintained that the tariff level
as per 2007 records cannot be kept as it is throughout the lifetime of the FTA. The basic level
tariff of refined palm oil is 80% and this is expected to be reduced to 37.5 % by 2019 by
reducing four percent every year. In the case of refined palm oil it is 90% and will be 45% by
2019 thereby reducing 4% every year. As far as coffee is concerned, it is hundred percent
now and will be reduced by 5% to make 45% by 2019. In the case of tea this is hundred
percent and is expected to reduce to 45%. For pepper it will be reduced to 50% from 70% .
Now it is clear that in all of these items the basic tariff level will be reduced and will not be
neither kept as it is nor increase. Then why these commodities are included in the sensitive
list and not in the negative list are the questions raised by the farmers.

5
Table 7: Highly sensitive list.
CATEGORY TARIFF REDUCTION
1 Reduction of applied MFN tariff rates to 50 per cent
2 Reduction of applied MFN tariff rates by 50 per cent
3 Reduction of applied MFN tariff rates by 25 per cent
Source: ASEAN-India Comprehensive Economic Cooperation Agreement
The period of reduction of tariff for the items in this category is not uniform. It is specified
below. There is no separate for countries Heavy sensitive list for Brune, Laos, Myanmar and
Singapore.
Table 8: Other Commitments
COUNTRIES DATE
Indonesia, Malaysia, Thailand 2010 January 1 to 2019 December 31
Philipines 2010 January 1 to 2022 December 31
Combodia, Vietnam 2010 January 1 to 2024 December 31
Source: ASEAN-India Comprehensive Economic Cooperation Agreement
Exclusion list.
These items are to be reviewed every year and should be considered for market entry. At
present there are 489 products in the negative list category. They are not included in the
agreement. 489 tariff lines and not exceeding 5% trade value (imports) on bilateral basis.
Malaysia has excluded 361 tariff lines. However, Malaysian exporters can export and benefit
from preferential tariff for these products, provided these products are not in India’s
Exclusion List. But there is no guarantee that these items will remain as it is throughout the
period of the agreement. If any of these items are found contrary to the interest of the free
trade agreement they can be taken out from the negative list. There is provision that an
inspection with regard to this has to be conducted every year. There are only very few items
in the negative list on which Kerala has special stake. They include tomato, potato, onion,
garlic, orange, grapes, watermelon, apple, cherry etc. Items like wine, whisky, rum; jin,

6
vodka etc. are also there in the negative list. But none of these items are having special
interest for the states like Kerala, which is a major exporter of plantation products. Many of
the sea product included in the negative list are contrary to the interests of Kerala. That
means that many sea products that are being freely available here could be could be freely
imported. Some items of coconut are included in the negative list but majority of them are in
the immediate tariff reduction category. Many of the items in the excursion category like
tapioca are in the freely importable category. Of the 173 rubber products, only few products
are in the negative list category. This may be the reasons for popular resistances against
ASEAN India FTA from this part of the country.
India’s Trade with ASEAN.
Acknowledging this trend and recognising the economic potential of closer linkages, both
sides recognised the opportunities for deepening trade and investment ties, and agreed to
negotiate a framework agreement to pave the way for the establishment of an ASEAN–India
Free Trade Area. This part of the present study examines India’s trade with ASEAN. The
trade gap (exports minus Imports) between ASEAN has widened after the formation of
customs union. This is a really disturbing phenomenon.
First of all this happens at a time when there is growing fiscal deficit and government support
to key sectors are decreasing. The widening gap in export revenue and import value that is
trade deficit is expected to build up twin deficit in the economy. The widening trade deficit is
in line with the idea that trade liberalisation of developing countries leads to faster growth in
imports compared to exports.

7
Fig 1, TOTAL EXPORT AND TOTAL IMPORT OF INDIA WITH ASEAN
Source: Export Import Data Bank - Ministry of Commerce and Industry
Note: TE- Total Exports and TM – Total Imports.
Secondly the export priority of India (to ASEAN) has not undergone rapid transition. India’s
export basket in 2000-2016 mainly consisted of primary and semi finished commodities.
However, in the case of imports, import priority has undergone more transition during the
period under consideration. India’s import priorities included animal products and primary
products in 2000 -2001. However the minerals and mineral products became predominant
import items of India by 2015-16.
Thirdly, the lacks of protection on these primary products are expected to adversely affect the
farming community in India. As a major part of the total exports of primary commercial
products of the country come from the plantation sector of the state of Kerala, this will really
affect the livelihoods and economic benefits of the farming community. None of the
plantation sector products have become the leading exports items of India, even in 2015-16
period. However items like tariff line 40 (Rubber) in the two digit HS classification are major
y = 2285.x - 1463.
R² = 0.864
y = 3137.x - 3204.
R² = 0.942
-10,000.00
0.00
10,000.00
20,000.00
30,000.00
40,000.00
50,000.00
TE
TM

8
import items. This is feared to have negative implications on an economy which largely
depends on the plantation sector.
These aspects are vindicated by the data on the percentage share of exports and imports
during the period of analysis. These figures show that both of the shares remained more or
less stagnant over the period of analysis and slightly declined after the formation of FTA.
Fig 2, TRADE GAP IN PERCENTAGE SHARE
Source: Export Import Data Bank - Ministry of Commerce and Industry
Exports
The following tables explain the export profile of India with ASEAN countries. It may be
seen that the exports to ASEAN is around ten percent of India’s total exports. After
increasing to 12 percent in 2011-12 it slightly declined to 9.59 percent in 2015-16. However
an analysis of the country wise growth rate of exports shows that the growth rate of exports
of India to almost all ASEAN countries shows a negative growth rate in 2014-16 periods.
0
2
4
6
8
10
12
14
% SHARE
% SHARE

9
Fig 3, DESTINATIONS OF EXPORTS (2014-15)
Source: Export Import Data Bank - Ministry of Commerce and Industry
India’s exports to ASEAN consist of around 9 percent of the country’s total exports. The
following tables explain the commodity wise exports and imports of the country of the top 10
items. India’s top exports items consisted of mineral fuels, mineral oils and products of their
distillation; bituminous substances; mineral waxes, meat and edible meat offal., ships, boats
and floating structures, nuclear reactors, boilers, machinery and mechanical appliances; parts
thereof, organic chemicals, fish and crustaceans, molluscs and other aquatic invertebrates,
natural or cultured pearls, precious or semiprecious stones, pre. Metals, clad with pre. metal
and articles thereof; imit. jewellery; coin, vehicles other than railway or tramway rolling
stock, and parts and accessories thereof, electrical machinery and equipment and parts
thereof; sound recorders and reproducers, television image and sound recorders and
reproducers, and parts. These products are of the semi finished goods category. The product
from the plantation and farm sector is no where there in the top export list of the country.
0.13199181 0.448030308
12.70981480.211582965
18.28380471
2.430610784
4.386880913
30.83484584
10.89138322
19.67108609
BRUNEI
CAMBODIA
INDONESIA
LAO PD RP
MALAYSIA
MYANMAR
PHILIPPINES
SINGAPORE
THAILAND
VIETNAM SOC REP

10
Table 1, India’s export destinations within ASEAN
Source: Export Import Data Bank - Ministry of Commerce and Industry
S.No. Country 2010-2011 2011-2012 2012-2013 2013-2014 2014-2015 2015-2016
%Growth
2010-12
%Growth
2011-13
%Growth
2013-15
%Growth
2014-16
1 BRUNEI 23.07 895.49 40.02 32.45 41.99 28.45 3,781.87 -95.53 29.38 -32.25
2 CAMBODIA 66.94 99.45 112.28 141.31 142.53 143.01 48.57 12.9 0.86 0.33
3 INDONESIA 5,700.78 6,677.99 5,331.30 4,850.20 4,043.32 2,819.54 17.14 -20.17 -16.64 -30.27
4 LAO PD RP 13.11 14.97 28.91 49.89 67.31 37.94 14.21 93.1 34.9 -43.64
5 MALAYSIA 3,871.17 3,980.36 4,444.07 4,197.93 5,816.55 3,706.86 2.82 11.65 38.56 -36.27
6 MYANMAR 320.62 545.38 544.66 787.01 773.24 1,070.65 70.1 -0.13 -1.75 38.46
7 PHILIPPINES 881.1 992.91 1,187.19 1,419.00 1,395.58 1,374.23 12.69 19.57 -1.65 -1.53
8 SINGAPORE 9,825.44 16,857.71 13,619.24 12,510.54 9,809.36 7,719.81 71.57 -19.21 -21.59 -21.3
9 THAILAND 2,274.21 2,961.01 3,733.17 3,703.27 3,464.83 2,987.86 30.2 26.08 -6.44 -13.77
10
VIETNAM
SOC REP 2,651.44 3,719.09 3,967.37 5,441.94 6,257.88 5,266.15 40.27 6.68 14.99 -15.85
Total 25,627.89 36,744.35 33,008.21 33,133.55 31,812.58 25,154.50 43.38 -10.17 -3.99 -20.93
India's Total 2,49,815.55 3,05,963.92 3,00,400.58 3,14,405.30 3,10,338.48 2,62,290.13 22.48 -1.82 -1.29 -15.48
%Share 10.2587 12.0094 10.9881 10.5385 10.2509 9.5903

11
Table 2, Top exports of India to ASEAN (2013-14 and 2014-15)
Source: Export Import Data Bank - Ministry of Commerce and Industry
2 The Harmonized Commodity Description and Coding System, also known as the Harmonized System (HS) of tariff nomenclature is an internationally standardized
system of names and numbers to classify traded products. The trade negotiations makes use of the HS codes at the 6 digit category which is more disaggregated, but for our analysis the 2 digit category HS classification is used.
HSCode2 Commodity 2013-14 2014-15
27 MINERAL FUELS, MINERAL OILS AND PRODUCTS OF THEIR DISTILLATION; BITUMINOUS
SUBSTANCES; MINERAL WAXES.
9829.79 7566.84
2 MEAT AND EDIBLE MEAT OFFAL. 2626.13 3129.09
89 SHIPS, BOATS AND FLOATING STRUCTURES. 1695.25 1899.87
84 NUCLEAR REACTORS, BOILERS, MACHINERY AND MECHANICAL APPLIANCES; PARTS
THEREOF.
1561.72 1712.71
29 ORGANIC CHEMICALS 1726.64 1582.5
3 FISH AND CRUSTACEANS, MOLLUSCS AND OTHER AQUATIC INVERTABRATES. 1216.81 1296.43
71 NATURAL OR CULTURED PEARLS,PRECIOUS OR SEMIPRECIOUS STONES,PRE.METALS,CLAD
WITH PRE.METAL AND ARTCLS THEREOF;IMIT.JEWLRY;COIN.
1427.91 1231.5
87 VEHICLES OTHER THAN RAILWAY OR TRAMWAY ROLLING STOCK, AND PARTS AND
ACCESSORIES THEREOF.
837.23 1070.05
85 ELECTRICAL MACHINERY AND EQUIPMENT AND PARTS THEREOF; SOUND RECORDERS AND
REPRODUCERS, TELEVISION IMAGE AND SOUND RECORDERS AND REPRODUCERS,AND
PARTS.
800.26 935.39
12
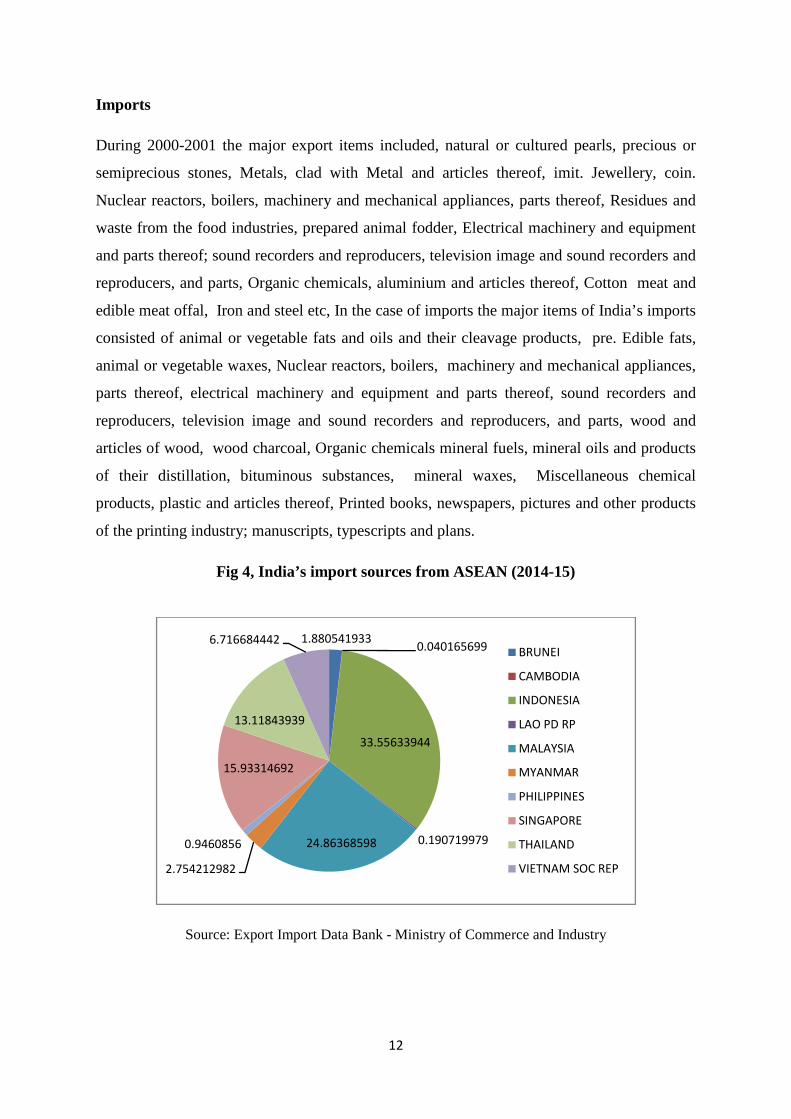
Imports
During 2000-2001 the major export items included, natural or cultured pearls, precious or
semiprecious stones, Metals, clad with Metal and articles thereof, imit. Jewellery, coin.
Nuclear reactors, boilers, machinery and mechanical appliances, parts thereof, Residues and
waste from the food industries, prepared animal fodder, Electrical machinery and equipment
and parts thereof; sound recorders and reproducers, television image and sound recorders and
reproducers, and parts, Organic chemicals, aluminium and articles thereof, Cotton meat and
edible meat offal, Iron and steel etc, In the case of imports the major items of India’s imports
consisted of animal or vegetable fats and oils and their cleavage products, pre. Edible fats,
animal or vegetable waxes, Nuclear reactors, boilers, machinery and mechanical appliances,
parts thereof, electrical machinery and equipment and parts thereof, sound recorders and
reproducers, television image and sound recorders and reproducers, and parts, wood and
articles of wood, wood charcoal, Organic chemicals mineral fuels, mineral oils and products
of their distillation, bituminous substances, mineral waxes, Miscellaneous chemical
products, plastic and articles thereof, Printed books, newspapers, pictures and other products
of the printing industry; manuscripts, typescripts and plans.
Fig 4, India’s import sources from ASEAN (2014-15)
Source: Export Import Data Bank - Ministry of Commerce and Industry
1.8805419330.040165699
33.55633944
0.19071997924.86368598
2.754212982
0.9460856
15.93314692
13.11843939
6.716684442BRUNEI
CAMBODIA
INDONESIA
LAO PD RP
MALAYSIA
MYANMAR
PHILIPPINES
SINGAPORE
THAILAND
VIETNAM SOC REP

13
Table 3, India’s import sources from ASEAN
S.No. Country 2010-2011 2011-2012 2012-2013 2013-2014 2014-2015 2015-2016
%Growth
2010-12
%Growth
2012-14
%Growth
2014-16
1 BRUNEI 234.17 605.02 814.8 763.6 840.88 554.02 158.37 -6.28 -34.11
2 CAMBODIA 8.01 7.27 11.9 12.72 17.96 54.43 -9.21 6.9 203.11
3 INDONESIA 9,918.63 14,765.93 14,879.49 14,748.30 15,004.64 13,131.93 48.87 -0.88 -12.48
4 LAO PD RP 0.22 89.26 138.64 39.4 85.28 180.03 40,696.57 -71.59 111.11
5 MALAYSIA 6,523.58 9,473.64 9,951.06 9,229.88 11,117.74 9,083.83 45.22 -7.25 -18.29
6 MYANMAR 1,017.67 1,381.15 1,412.69 1,395.67 1,231.54 984.27 35.72 -1.2 -20.08
7 PHILIPPINES 429.39 441.38 504 391.59 423.04 542.16 2.79 -22.3 28.16
8 SINGAPORE 7,139.31 8,388.49 7,486.38 6,762.49 7,124.47 7,308.38 17.5 -9.67 2.58
9 THAILAND 4,272.09 5,283.84 5,352.61 5,340.20 5,865.88 5,510.16 23.68 -0.23 -6.06
10 VIETNAM SOC REP 1,064.90 1,722.87 2,314.78 2,594.25 3,003.35 2,560.39 61.79 12.07 -14.75
Total 30,607.96 42,158.84 42,866.36 41,278.09 44,714.77 39,909.60 37.74 -3.71 -10.75
India's Total 3,69,769.12 4,89,319.48 4,90,736.64 4,50,199.78 4,48,033.40 3,81,006.62 32.33 -8.26 -14.96
%Share 8.2776 8.6158 8.7351 9.1688 9.9802 10.4748
Source: Export Import Data Bank - Ministry of Commerce and Industry

14
Major import sources of these items are Indonesia and Malaysia. These countries are
identified for their mechanised farm activities. They are more commercialised and capitalist
agricultural sector. Hence they enjoy greater productivity in many of the farm based products
than India. All the sources of exports of these items in which Kerala has special stake enjoy
higher productivity compared to Kerala. This productivity difference is an additional
incentive for the ASEAN countries to use of the provisions of the India-ASEAN FTA.
The difference in productivity may be seen from the following table.
Table 4, Productivity difference in selected items
No Commodity ASEAN countries India
1. Pepper (Vietnam) 1885 280
2. Rubber (Thailand) 1710 820
3. Coffee (Vietnam) 1920 839
4. Coconut (Indonasia) 6767 1025
ASEAN countries enjoy high productivity in agricultural sector. This is due to the high
importance that they give to mechanised, capitalist production mode. In the case of India
agricultural sector still pursue labour intensive production setup. Kerala’s agricultural sector
is dominated with nominal / marginal farmers. There is no capitalist or highly capital
intensive agricultural production setup. Household oriented agricultural practises are common
in Kerala.

15
Table 5, Top imports of India from ASEAN (2013-14 and 2014-15)
HS
CODE COMMODITIES 2013-2014 2014-2015
27
MINERAL FUELS, MINERAL OILS AND PRODUCTS OF THEIR DISTILLATION; BITUMINOUS SUBSTANCES;
MINERAL WAXES. 10419.49 11833.16
15
ANIMAL OR VEGETABLE FATS AND OILS AND THEIR CLEAVAGE PRODUCTS; PRE. EDIBLE FATS; ANIMAL OR
VEGETABLE WAXEX. 6778.08 6599.75
85
ELECTRICAL MACHINERY AND EQUIPMENT AND PARTS THEREOF; SOUND RECORDERS AND REPRODUCERS,
TELEVISION IMAGE AND SOUND RECORDERS AND REPRODUCERS,AND PARTS. 4211.97 4468.19
84 NUCLEAR REACTORS, BOILERS, MACHINERY AND MECHANICAL APPLIANCES; PARTS THEREOF. 3333.39 3652.54
29 ORGANIC CHEMICALS 2683.19 2692.87
39 PLASTIC AND ARTICLES THEREOF. 1517.04 1892.29
44 WOOD AND ARTICLES OF WOOD; WOOD CHARCOAL. 1516.99 1242.94
40 RUBBER AND ARTICLES THEREOF. 1130.83 1098.67
72 IRON AND STEEL 479.83 840.49
7 EDIBLE VEGETABLES AND CERTAIN ROOTS AND TUBERS. 626.82 819.92
Source: Export Import Data Bank - Ministry of Commerce and Industry
16
India - ASEAN FTA some concerns.
Less productive plantations and relatively higher labour cost are making Kerala plantations
more vulnerable under the India -ASEAN free trade agreement (Association of Planters of
Kerala, 2009). This is because many of the ASEAN countries with whom India has signed
the agreement is far more productive than India’s plantation sector. Another reason of
concern is the phenomenon that Kerala’s plantation sector is affected by declining
productivity. For instance, in tea, the base output is around 17-35 Kgs per person in Tamil
Nadu, while the same is around 16-21 kgs in Kerala. In the case of Robusta coffee, the base
output per day in Karnataka is 75 kgs, while in Kerala it is 50 Kgs. Hence they have got some
comparative advantage to market a product at the international level while India has a
comparative disadvantage. It is pointed out that the two countries have high complementarily
in many of the products, especially in tariff lines which include products from the farm level.
This is mainly because almost all of the products produced in the farm sector in India are
exported.
The concerns are about sectors such as plantations, fisheries and textiles that will be seriously
affected by the FTA. Sectors such as tea, coffee, cashew, coconut, oil palm, rubber, spices
like pepper and other plantation items are considered as facing serious threat under the
agreement. As per the agreement, the import tariff of tea and coffee are expected to be
brought down to 45% from the existing level of 100% and for pepper from 70 to 50% by
December 31, 2019. Natural rubber, cardamom and a few tariff lines in coffee are under an
exclusion list at present. There is no guarantee that they will remain in this category forever.
In spite of the plantation sector being predominantly agricultural, seasonal and labour-
intensive in character, all the laws applicable to industrial labour have been extended to it. In
addition, under the Plantation Labour Act, 1951, plantations are required to provide free
housing and medical facilities to the workers and their families. The cost represented by these
amenities, together with the social security benefits, amounts to as much as 70% of the direct
wages. Daily wages for a worker in tea or coffee estate in Kerala has been fixed at Rs 115,
while that for rubber estates is Rs 162. In Tamil Nadu, wages in tea estates were recently
fixed at Rs101.53.

17
One of the major reasons for the inclusion of more sensitive items of the plantations sector is
identified by the present study is the lack of organisational capability for the farmers. The
farming community is not politically organised and they are not able to pressurise the
government to categorise their products under the preference lists. This point can be
vindicated by a quick look in to the activities of the organisations representing the non
agricultural sector in India. The following table is the list of major organisations representing
various industries in India. These industrial organisations pressurise the FTA formation
process to get their products included in lists according to their preferred category. However
the interest groups who are either not able to or have insufficient political power to pressurise
the formation process like the farming community would be out from the formation process.
Table 6, Industrial organisations
NO ORGANISATION
1. All India Rubber Industries Association (AIRIA)
2. Society of Indian Automobile Manufacturers (SIAM)
3. Automotive Tyre Manufacturers Association (ATMA)
4. Automotive Component Manufacturers Association of India (ACMAI)
5. All India Association of Industries (AIAI)
6. Automation Industry Association (AIA)
7. All India Manufacturers Organisation (AIMO or TNSB)
8. All India Resort Development Association (AIRDA)
9. Associated Chambers Of Commerce & Industry Of India (ACCII)
10. Mumbai Chamber Of Commerce & Industry (MCCI)
11. Confederation Of Indian Industry (CII)
12. Electronic & Computer Software Export Promotion Council (ESC)
13. Electronic Component Industries Association (ELCINA)
14. Engineering Export Promotion Council (EEPC)
15. Federation Of Hotel And Restaurant Associations Of India (FHRAI)
16. Federation Of Indian Chambers Of Commerce & Industry (FICCI)
17. Federation Of Indian Export Organisations (FIEO)
18. Indian Machine Tool Manufacturers' Association (IMTMA)
19. India Trade Promotion Organisation (ITPO)
20. Indian Association Of Amusement Parks & Industries (IAAPI)
18
21. Indian Electrical & Electronics Manufacturers' Association(IEEMA)
22. National Association Of Software & Service Companies (NASSCOM)
23. Organisation Of Pharmaceutical Producers Of India (OPPI)
24. All India Glass Manufacturers' Federation
25. Plastic Machinary Manufacturers Association of India (PMMAI)
26. Alkali Manufacturers' Association of India (AMAI)
27. The Textile Association (India) (TAI)
Source: Compiled from various sources.
Summery and conclusions
The present paper was an attempt to analyse the status of India- ASEAN FTA and the usage
of the same by nations within ASEAN and India. The following are the specific conclusions
of the study.
The study finds that almost all ASEAN countries use the FTA route to engage trade with
India. Indian export baskets have not undergone changes even after the formation of the
ASEAN –India FTA, but the import baskets have undergone a structural transformation
during 2000-2014 period. Also imports grew faster than exports during the period of analysis.
Major destinations of India’s exports are Malaysia, Singapore and Vietnam while major
sources of imports are Indonesia, Malaysia and Singapore. Many of these countries enjoy
greater productivity in agricultural sector as their farm production is incorporated in more
capitalist production mode. The highly mechanised, capitalist agrarian sectors of these
economies, helps them to enjoy very high productivity for their products which give them a
comparative edge in international markets. Hence the argument that the agreement may
impact the Indian farm sector especially the plantation sector in states like Kerala is not
entirely baseless. Every agreement will be having positive as well as negative impacts on the
participating countries. Given the state of affairs of the plantation sector in Kerala it has the
potential to be an affected sector due to the India-ASEAN free trade agreement. Many of the
ASEAN countries enjoy high productivity than India and Kerala, especially agricultural and
plantation sector products. This helps those countries to market their products at the
international level at much lower cost than India, and the farmers with higher cost of
production are priced out. Majority of the products in which the country faces lower
productivity are not covered under the preferential lists. So the concerns raised by the farmers
19
are not baseless. Hence ASEAN India FTA will have serious impact upon the sectors and the
economies that depend on the sector. Hence Kerala’s concerns on the same may be validated.
There is very high complementarily between India and ASEAN countries in production and
the complementarily in the plantation sector is more pronounced. This is expected to reduce
India’s gains from trade.
The study finds that the lists are not prepared with scientific impact assessment techniques, or
with wide consultations with the farming community. However the non farming community
largely represented by the organisation in this field during the trade negotiations will help
them to put their commodities in the lists to which they are preference towards. This helps
them to be in a better position vice a vice their counterparts in the farm sector. This sectoral
discrimination may lead to discrimination of some economic agents in the FTA process.
The government may asses the positive and negative impact of the agreement and may have a
clear idea about the sectors which are affected and the sectors in which the agreement have
made a positive impact. A detailed survey may be conducted among the stakeholders with
this objective. Adequate representation needs to be given to the farmers and planters. A more
comprehensive and scientific criteria should be followed for the preparation of the negative
list. The industrial bodies and pressure groups should not be allowed to pressurize the
preparation of negative list. The government may provide adequate price, market and other
support to the domestic producers and should ensure through fiscal measures that none of
them are priced out in the international market. Adequate subsidies are to be provided for
raising productivity of the items in plantation sector. This is expected to help the Indian
farmers to compete on a level playing field with their counterparts in ASEAN countries who
enjoy higher productivity.

20
REFERENCES
ASEAN-India Comprehensive Economic Cooperation Agreement- Ministry of commerece
and Industry, Government of India, [URL]
http://commerce.gov.in/trade/aseanindia%20trade%20in%20goods%20agreement.pdf
Bhagwati, Jagdish (2002), Free Trade Today. Princeton University Press, New Jersey.
Bhagwati, Jagdish (2008), Termites in the Trading System: How Preferential Agreements
Undermine Free Trade. Oxford University Press.
Export Import Data Bank - Ministry of Commerce and Industry, Government of India,
[URL], www.commerce.nic.in/eidb/
Pant, Manoj, and Amit Sadhukhan. (2009), “Does Regionalism Hinder Multilateralism: A
Case Study of India.” Journal of Economic Integration Vol. 24, no. No. 2: pp. 222–247.
Siriwardana, Mahinda. (2004) “An Analysis of the Impact of Indo-Lanka Free Trade
Agreement and Its Implications for Free Trade in South Asia.” Journal of Economic
Integration Vol. 19, No. 3: pp. 568–589.
Stiglitz, Joseph. Fair Trade for All: How Trade Can Promote Development. Oxford
University Press, USA, 2007.
Yi Wu and Li Zeng (2008), “The Impact of Trade Liberalization on the Trade Balance in
Developing Countries;; IMF Working Paper 08/14; wp0814.pdf.” Accessed June 25, 2012.
http://www.imf.org/external/pubs/ft/wp/2008/wp0814.pdf.