mvinm inistry of piaish columbiaa100.gov.bc.ca/appsdata/acat/documents/r4415/245... · ditch from...
TRANSCRIPT

. -i
mvinm of inistry of piaish Columbia Environment

I
I 1 I I I I I
a
5 I I I I I 1 I I I
REPORT ON ,
GROUNDWATER - SURFACE WATER
INTERRELATIONSHIP
LOWER-MISSION- CREEK, B. C.
by
D.A. Lowen
and
D.B. L e t v a k
October 1981
REPORT ON GROUNDWATER - SURFACE WATER I N T E R R E L A T I O N S H I P ,
LOWER P'tISSIOM CREEK, B.C. ,-
I i
Syn op s i s
The in t e r r e l a t ionsh ip of the surface a n d groundwater regimes iri the Lower PSission Creek area i s described. A dischar5e metering project on Mission Creek deterinined t h a t the exchange o f water between the channel and the groundwater system i s r e l a t i v e l y minor. Ground- water s tudies were car r ied ou t , consis t ing of analysis of geological information, well water level d a t a , and pumping d a t a . Information f r o m two recent ly constructed wells has led t o a much b e t t e r de f in i t i on o f the areal ex ten t and water supply potent ia l of the Rutland aquifer , and the development o f f u r t h e r groundwater suppl ies appears t o be p rac t i ca l . The combined r e su l t s o f the two invest igat ions a1 lowed f o r an i n t e rp re t a t ion o f the recharge - discharge components of the aquifer .

1 I I I i I I I I I 1 I
1,
2,
3.
4.
5.
TABLE OF COMTENYS
Page ,!
Introduction O O O O O O o 4 0 0 . 0 0 0 0 1 4 . ~ 0 ~ ~ ~ a a ~ o ~ ~ a a o o o o a ~ o ~ o . a ~
S treamf 1 ow Mete ri ng Project . a a a a a a a e
2.1 General Description of Project .OOaO.oa..O1eOO..OO.
2.2 Metering Sites e ., a o o o e .. s o
2.3 Inflows To and Withdrawals from Mission Creek ....*
2.4 Metering Results and Interpretation e 0 0 4 1 v 0 0 0 . 0 . . 0 .
Geological History ..... O . . O O O O 1 O O O . O . . O O ...... Hydrogeology . O . . . O . . . O . . . . . . . . . . . . . . . . . o o e . . . . . . . . . . . . .
4.1 General . . . . O o . O . O . . . . . . . . . . . . . . O O O O . . . O . . O . . . . . . . .
#
4.2 Groundwater - Surface Water Interrelat
Conclusions and Recommendations . . .. .-*. .-. References . D . a e e.. . . . . -. . . . . e e a * .
onship ..... 0 0 . . 0 . .... 0 .
B
2
2
3
4
5
8
9
9
11
16
19
Appendix A - Cross Section Well Logs D e . * . . e .. . * . A 1
Appendix B - Well Hydrographs and Precipitation Data .-. B1
REPORT ON
GROUNDWATER - SURFACE WATER INTERRELATIONSHIP , LOWER M I S S I O N C R E E K , B . C .
1. INTRODUCTION
Th is r e p o r t p resen ts t h e r e s u l t s o f i n v e s t i g a t i o n s c a r r i e d o u t i n t o
ques t i ons r e g a r d i n g s u r f a c e w a t e r and groundwater use i n t h e l ower p a r t
o f M i s s i o n Creek, below t h e B lack Mounta in I r r i g a t i o n D i s t r i c t i n t a k e .
These s t u d i e s were c a r r i e d o u t i n c o n j u n c t i o n w i t h t h e T r i b u t a r y Water
Management s t u d i e s o f t h e Okanagan Bas in Imp lemen ta t i on Program, b u t
were funded a lmost e n t i r e l y by t h e P rov ince as an e x t r a c o n t r i b u t i o n t o
t h e Program, beyond t h e cos t - sha red a c t i v i t i e s .
The genera l q u e s t i o n r e g a r d i n g s u r f a c e w a t e r use was whether o r n o t
t h e r e i s a s i g n i f i c a n t amount o f wa te r l o s t f r o m o r g a i n e d by t h e Creek,
wh ich i s o f obv ious impor tance t o s u r f a c e w a t e r u s e r s i n t h i s zone. The
genera l q u e s t i o n r e g a r d i n g groundwater was about t h e a r e a l e x t e n t and
w a t e r supp ly p o t e n t i a l o f t h e Ru t land a q u i f e r . Separa te i n v e s t i g a t i o n s
were c a r r i e d o u t i n t o these two ques t ions . The s u r f a c e w a t e r s t u d i e s
c o n s i s t e d o f a program o f d i scha rge measurements a t d i f f e r e n t p o i n t s on
t h e creek and a t d i f f e r e n t t imes. The groundwater s t u d i e s c o n s i s t e d
m a i n l y o f a n a l y s i s o f w e l l i n f o r m a t i o n , g e o l o g i c a l l o g s and wa te r
l e v e l reco rd ings , and two t e s t w e l l s which were d r i l l e d as a r e s u l t o f
a p rev ious r e p o r t on t h e s u b j e c t . Both i n v e s t i g a t i o n s answered t h e
r e s p e c t i v e ques t i ons , and i n combinat ion, t h e r e s u l t s a l l o w e d f o r an
i n t e r p r e t a t i o n o f t h e i n t e r r e l a t i o n s h i p between t h e groundwater and
s u r f a c e wa te r reg imes i n t h i s area. The s u r f a c e w a t e r s t u d i e s a r e r e p o r t e d
f i r s t s i n c e t h e r e s u l t s a r e used l a t e r i n t h e groundwater p o r t i o n o f t h i s
r e p o r t .

2 . STREAMFLOW M E T E R I N G PROJECT
2 . 1 General Description of Project
I n order t o determine whether the lower creek gained or l o s t water, i t was decided t o carry o u t a program of metering the discharge a t d i f f e r e n t s i t e s . the flow measurements when the creek flow!; were low, f o r two reasons. a n d second, gains o r losses of small magritude would be e a s i e r t o ident i fy against low flows t h a n high flows. t o the degree hoped f o r , since periods of steady low flow are h a r d t o predict , and do n o t occur very frequently when the creek i s f r ee of ice.
I t was considered desirable t o do
F i r s t , losses or gains are important when flows are low,
This was n o t accomplished
There were f u r t h e r complications imposed by the degree of regulation o f the creek flows i n t h i s zone. I t was d i f f i c u l t t o accoun t f o r a l l the inflows and outflows t o correct the observed flows f o r t h i s e f f e c t . I t was also d i f f i c u l t t o deal with the f a c t t h a t flows were n o t necessarily steady during the meterings.
Other problems were encountered in obtaining accurate metering resu l t s with shallow depths, low ve loc i t i e s , and bed material which was f a i r l y large in comparison t o depth. metering e'ach s i t e twice on most occasions, and using the average of the r e su l t s , The coarse bed material a lso ra i ses the question of possible underflow, where a cer ta in p a r t of the t o t a l creek flow i s actually moving t h r o u g h the bed materials in an "underground channel" adjacent t o and associated with the surface channel. This i s not thought t o be of s i g n i f i c a n t magnitude r e l a t ive to creek flows s ince the coarse bed materials tend t o be packed with f i n e r mater ia l s , b u t no firm conclusions can be drawn in t h i s regard s ince no invest igat ion was done.
This was dea l t with by

-. 3 -
I E E
1 1 1 JI
F i n a l l y , i t s h o u l d be ment ioned t h a t t h e da ta c o l l e c t e d on t h e
f i r s t two da tes compr ised t h e o r i g i n a l p r o j e c t . The l a t e r measure-
ments c o l l e c t e d a t t h e upper s i t e s were conceived as a r e s u l t o f t h e
f i r s t two s e t s o f da ta . A l l measurements were done when t h e
me te r ing crews had t h e o p p o r t u n i t y t o f i t them i n t o t h e i r normal work
1 oad.
Stream m e t e r i n g s were c a r r i e d o u t a t e i g h t d i f f e r e n t s i t e s on
f i v e d i f f e r e n t da tes , b u t n o t a t each s i t e on each da te . The s i t e s
a r e d e s c r i b e d below, and t h e m e t e r i n g da tes were December 12, 1979,
and March 27, August 19, September 9, and September 23, 1980.
2.2 Meter i .ng S i t e s
The s t r e a m f l o w m e t e r i n g was c a r r i e d o u t a t e i g h t s i t e s on l o w e r
M i s s i o n Creek. I n t h i s case, a s i t e i s a genera l l o c a t i o n on t h e
c reek w i t h a p o s s i b l e range o f up t o 100 meters between t h e a c t u a l
s e c t i o n s measured on d i f f e r e n t dates. Me te r ings a t a g i v e n s i t e on
a g i ven d a t e were u s u a l l y done t w i c e , sometimes a t d i f f e r e n t s e c t i o n s ,
and sometimes a t t h e same s e c t i o n w i t h d i f f e r e n t measurement s t a t i o n s .
A new a l p h a b e t i c s i t e code i s ass igned f o r t h i s r e p o r t - p r e v i o u s s i t e
l a b e l l i n g was confused when d i f f e r e n t codes were ass igned t o t h e same
s i t e on d i f f e r e n t f i e l d sess ions. The s i t e s a r e shown on F i g u r e 1 and
the s i t e d e s c r i p t i o n s a r e as f o l l o w s :
( a ) S i t e A - Below B . M . I . D . i n t a k e .
Near t h e s t ream gauge 8NM239, be low t h e ove r f l ow
d i t c h from t h e B . M . I . D . p i p e l i n e i n t a k e b u i l d i n g .
S i t e B - above H y d r a u l i c Creek
Near G a l l a g h e r Road b r i d g e .
Upstream o f t h e Happy V a l l e y T r a i l e r Cour t a t t h e
end o f Senger Road.
( b )
( c ) S i t e C - S.E. Kelowna T r a i l e r Park.

1 - 4 -
( d ) S i t e D - Ho l lywood Road A t t h e West Kootenay Power s u b - s t a t i o n a t t h e end
o f t h e Ho l lywood Road e x t e n s i o n .
S i t e E - Water Survey Gauge
Near t h e W . S . C . gauge (8NM116) a t t h e f o o t of
K i n i s k i Road, a l o n g Creeks ide D r i v e .
Some s e c t i o n s were upstream o f b r i d g e and o t h e r s
downs tream.
S i t e G - Casorso Road B r i d g e .
( e )
( f ) S i t e F - KLO Road B r i d g e
( 9 ) ( h ) S i t e H - Lakes ide D r i v e B r i d g e .
S i t e upst ream o f b r i d g e .
2.3 I n f l o w s t o and Wi thdrawals f rom M i s s i o n Creek
The i n t e r p r e t a t i o n o f t h e m e t e r i n g r e s u l t s i s somewhat
dependent on w i t h d r a w a l s f r o m and i n f l o w s t o t h e creek between
t h e me te r ing s i t e s . These i n f l o w s and w i t h d r a w a l s a re d e s c r i b e d
be 1 ow:
Between s i t e s B and C y M i s s i o n Creek r e c e i v e s t r i b u t a r y
i n f l o w f rom H y d r a u l i c and KLO Creeks. Both these creeks have
d i v e r s i o n s wh ich e f f e c t t h e i r f l o w i n t o MTssion Creek.
t h e i r r i g a t i o n season, i n f l o w t o M i s s i o n Creek i s g e n e r a l l y s m a l l
( i n the o r d e r o f s e v e r a l c . f . s . ) , except d u r i n g p e r i o d s o f r a i n y
weather when t h e f l o w f r o m t h e un regu la ted p o r t i o n of t h e b a s i n s
inc reases . The South Eas t Kelowna I . D . i n t a k e i s on H y d r a u l i c
Creek, which sometimes r e s u l t s i n p e r i o d s o f i n s t a b i l i t y i n t h e
f l ows as a r e s u l t o f t h e demand v a r i a t i o n i n t h a t system. There
a re s t ream gauges on b o t h o f these creeks n e a r t h e mouth wh ich
make i t p o s s i b l e t o account f o r t h e i n f l o w s .
Dur ing

I II I I E 5
M I1
I I I I I u I I I 1
- 5 -
There are a number of locations where springs emerge near the creek and which contribute inflow t o the creek. These are near the South East Kelowna Bridge, near the KLO Road Bridge, and near the Casorso Road Bridge, as shown on Figure 1,
Between sites E and F there are two ditch diversions from the The Amalgamated Water Users (A.W,U.) ditch diverts water Creek,
near Ziprick Road and returns the excess upstyeam of KLO Road Bridge. Almost directly opposite the A.W.U. intake i s the intake for a fisheries spawning channelo which returns all the diverted flow t o the creek several hundred yards downstream.
There are also several small pump intakes on this p a r t of Mission Creek. A golf course i n South East Kelowna pumps water from the creek intermittently 1 mostly a t night during the summer. There is a small pump house on the le f t b a n k near the new f o o t bridge between sites E and F, which serves the Sutherland Hill Provinci a7 Park.
.
2.4 Metering Results and Interpretation
As mentioned previously, flows were metered a t a total of eight si tes on a number of different dates. graphically i n Figure 2 , and are summarized in tabular form i n Table 1.
The results are shown
The results of the stream meterings are interpreted fol lowi ng manner:
n the
41, In spite of the problems described earlier, the results appear
reach conclusions regarding the object of the study. exception to this statement may be the flow measured a t .site
I I
t o be reasonably consistent and are considered adequate t o The one

I U I I I I I I I I I
TABLE 1
Summary o f ' Mission Creek Discharge Measurements
Date S i t e Di scharge ( c . f. s . ) *
December 1 2 , 1979 C December 1 2 , 1979 D December 12, 1979 E December 12, 1979 F December 1 2 , 1979 G December 1 2 , 1979 H
March 27 , 1980 C March 2 7 , 1980 D March 2 7 , 1980 E March 2 7 , 1980 F March 2 7 , 1980 G March 2 7 , 1980 H
A u g u s t 19 , 1980 A A u g u s t 19, 1980 B A u g u s t 19, 1980 C
September 9 , 1980 G September 9 , 1980 H
September 23, 1980 A September 23, 1980 B September 23 , 1980 C September 23, 1980 E September 23, 1980 F September 28, 1980 H
22.3 23.1 22.9 25.7 22.9 27 .7
31.0 30.0 29 .8 31.6 32.6 35.6
130 137 128
89 .5 91.9
140 145 . 169 15 0 14% 154
* usual ly average o f two measurements
I I
I
I I
1 I
1 I I I I I
- I -
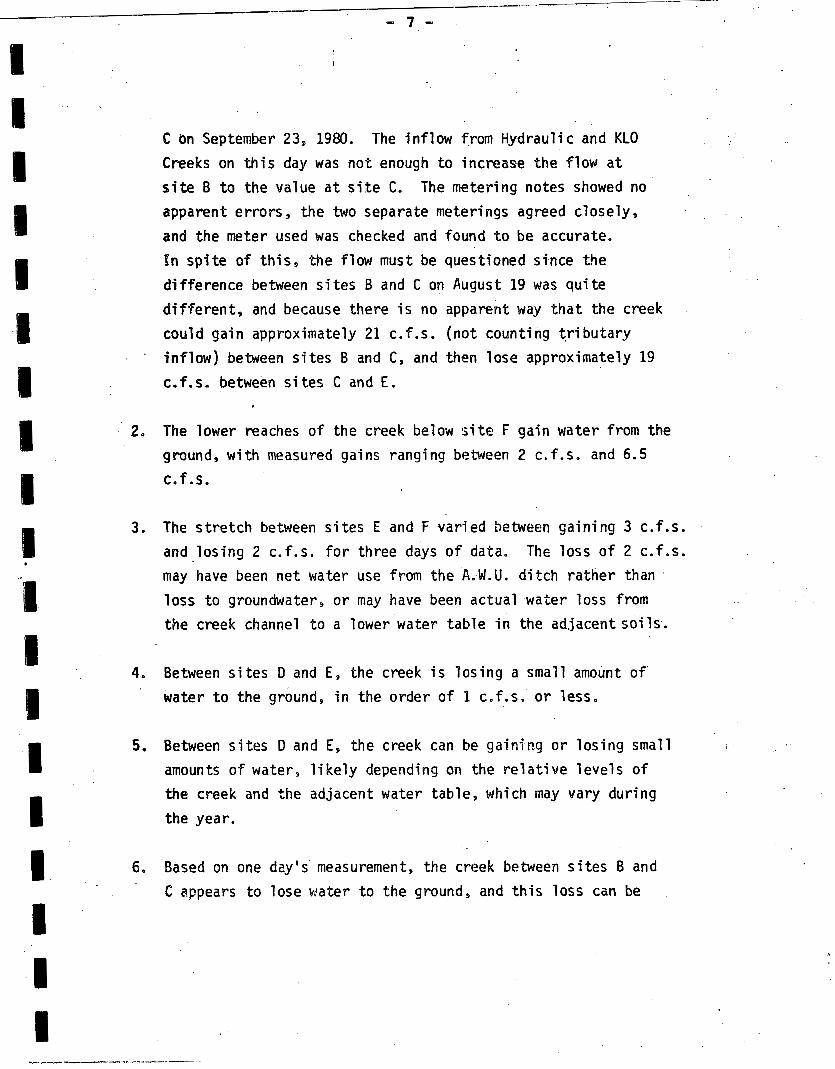
C On September 23, 1980. Creeks on this day was n o t enough t o increase the flow a t s i t e B t o the value a t s i t e C. apparent e r ro r s and the meter used was checked and found t o be accurate. In s p i t e of this, the flow must be questioned s ince the difference between s i t e s 6 and C on August 19 was qui te d i f f e r e n t , and because there i s no apparent way t h a t the creek could gain approximately 21 c . f .s . ( n o t counting t r ibu ta ry inflow) between s i t e s B and C, and t h e n lose approximately 19 c,f.s, between s i t e s C and E .
The lower reaches of the creek below s i t e F gain water from the ground, w i t h measured gains ranging between 2 c . f .s . and 6.5
c.f .s.
The inflow from Hydraulic and #LO
The metering notes showed no the two separate meterings agreed c lose ly ,
.
2.
3. The s t r e t c h between s i t e s E and F varfed between ga in ing 3 c . f . s . and l o s i n g 2 c.f .s . f o r three days o f data . The loss of 2 c . f . s . may have been net water use from the A.W.U. ditch r a the r than loss t o groundwater, o r may have been actual water loss from the creek channel t o a lower water table i n the a d j a c e n t s o i l s .
4. .
Between s i t e s D and E , the creek i s losing a small amount o f ' water t o the ground, i n the order of 1 c . f . s . or less.
5. Between s i t e s D and E , the creek can be g a i n i R g o r losing small amounts of water, l i ke ly depending on the relat iwe leve ls o f the creek and the adjacent water tab le , which may vary during the year.
Based on one dzy's measurement, the creek between s i t e s B and C appears t o lose water t o the ground, and this loss can be
6.

I I I 1 I I a I I I
I
I I I I I a
greater t h a n the inflow from Hydraul i c and K L O Creeks, when t h a t inflow i s small.
7 . The creek appears t o g a i n water from the g r o u n d between s i t e s A a n d B, a t l e a s t during the time of year (August-September) when the d a t a was co l lec ted .
8. The general conclusion i s t h a t there i s n o t a great volume of water l o s t from or gained by the creek below the B . M . I . D . intake. Water passing the B . M . I . D . intake should be avai lable f o r use a t any point downs tream.
3. G E O L O G I C A L HISTORY
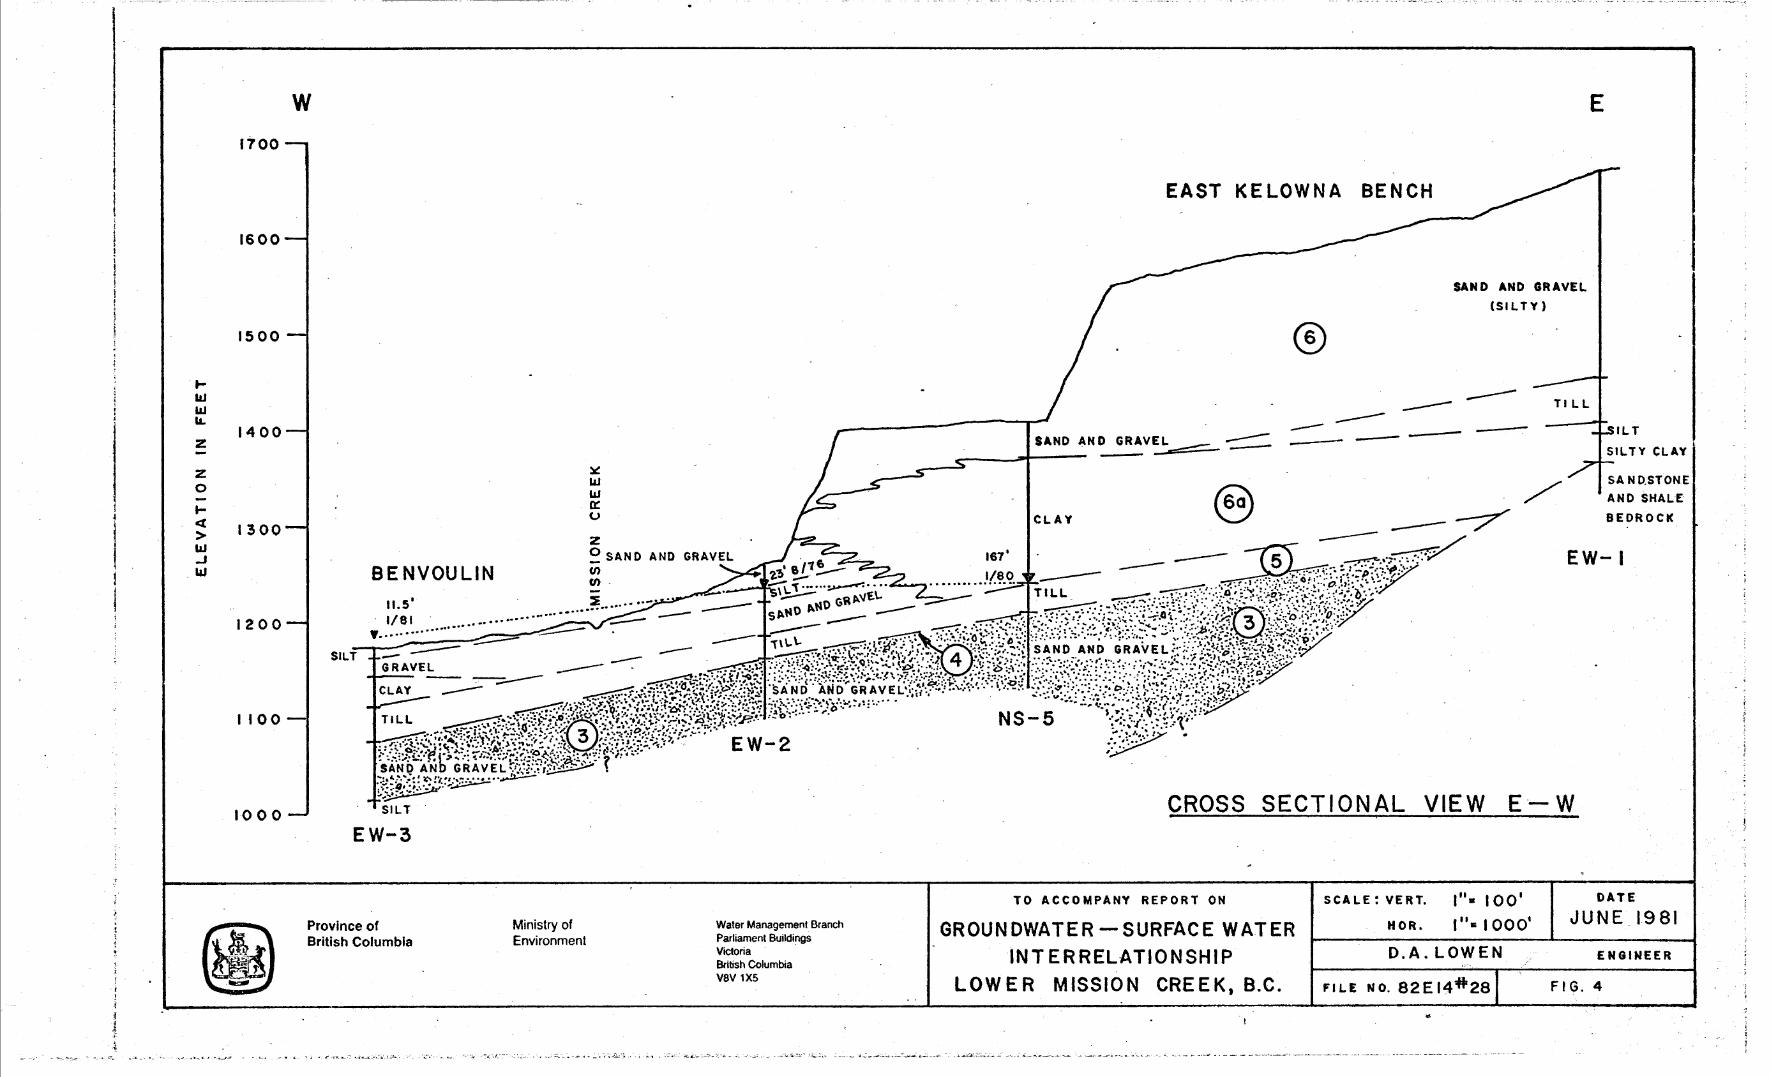
The general geology of the lower Mission Creek area has been discussed previously (Lowen, 1979). Two t e s t wells d r i l l e d on recommendation of t h i s previous report have increased o u r knowledge of t h i s area. Two cross- sections have been drawn using the two new wells. The locations o f the sect ions are shown in Figure 1 a n d the sect ions a re shown in Figures 3 and 4. A complex sequence of deposition and erosion events can be theorized t o account for the arrangement o f geological un i t s seen in these cross- sect ions. as follows:
One possible sequence of events from the o ldes t t o youngest i s
1. A glacial advance with deposition of t i l l (Unit 1) a t elevations
2 . Lacustrine deposits of sand, s i l t , a n d clay (Unit 2 ) were deposited in the region between wells N S - 1 a n d NS-3 (north of Rutland) a t approximate elevations 860 to 1,000 f e e t .
over the ent i re area o f the cross-sections approximately between elevations 1,000 - 1,300 f e e t .
from 800 t o 1,100 f e e t .
3. An extensive outwash body (Rutland aqui fe r ) was deposited (Unit 3)
-I I I I
11 1 I I I I I I I I I I I I
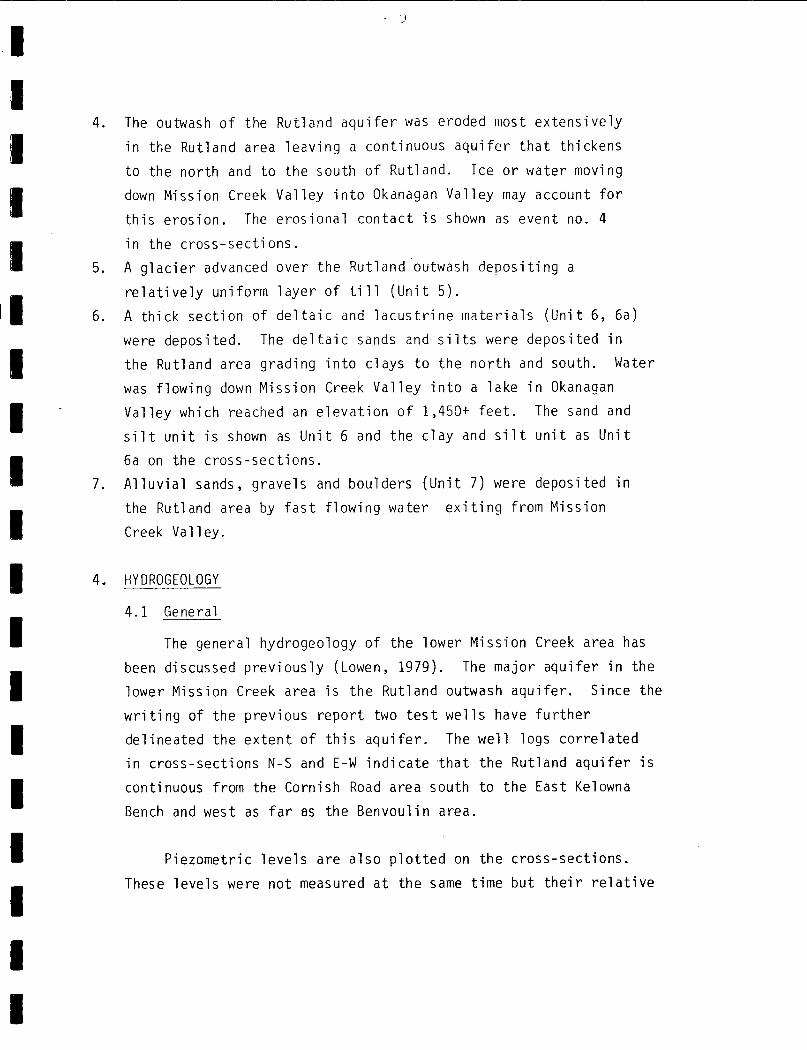
4. The outwash o f t he Ru t land a q u i f e r was eroded most e x t e n s i v e l y
i n t h e Ru t land area l e a v i n g a con t inuous a q u i f e r t h a t t h i ckens
t o t h e n o r t h and t o t h e sou th o f Rut land. I c e o r wa te r moving
down M iss ion Creek V a l l e y i n t o Okanagan V a l l e y may account f o r
t h i s e r o s i o n . The e r o s i o n a l c o n t a c t i s shown as even t no. 4
i n t h e c r o s s - s e c t i o n s .
A g l a c i e r advanced o v e r t h e Ru t land outwash d e p o s i t i n g a
r e l a t i v e l y u n i f o r m l a y e r o f t i l l ( U n i t 5 ) .
5.
6. A t h i c k s e c t i o n o f d e l t a i c and l a c u s t r i n e m a t e r i a l s ( U n i t 6, 6a)
were depos i ted .
t h e Rut land area g r a d i n g i n t o c l a y s t o t h e n o r t h and south. Water
was f l o w i n g down M i s s i o n Creek V a l l e y i n t o a l a k e i n Okanaaan V a l l e y which reached an e l e v a t i o n o f 1,450+ f e e t . The sand and
s i l t u n i t i s shown as U n i t 6 and t h e c l a y and s i l t u n i t as U n i t
6a on t h e c r o s s - s e c t i o n s .
A l l u v i a l sands, g r a v e l s and bou lde rs ( U n i t 7 ) were depos i ted i n
the Rut land area by f a s t f l o w i n g wa te r e x i t i n g f r o m M i s s i o n
Creek Val l e y .
The d e l t a i c sands and s i l t s were d e p o s i t e d i n
7.
4. HY DROGEOLOGY
4 .1 General
The genera l hydrogeo logy of t h e l ower M i s s i o n Creek area has
been d iscussed p r e v i o u s l y (Lowen, 1979). The m a j o r a q u i f e r i n t h e
l ower M i s s i o n Creek area i s t h e Ru t land outwash a q u i f e r . S ince t h e
w r i t i n g o f t h e p rev ious r e p o r t two t e s t w e l l s have f u r t h e r
d e l i n e a t e d t h e e x t e n t o f t h i s a q u i f e r . The w e l l l o g s c o r r e l a t e d
i n c ross -sec t i ons N-S and E-W i n d i c a t e t h a t t h e Ru t land a q u i f e r i s cont inuous f rom t h e Corn ish Road area sou th t o t h e Eas t Kelowna
Bench and west as f a r as t h e B e n v o u l i n area.
P iezomet r i c l e v e l s a r e a l s o p l o t t e d on t h e c ross -sec t i ons .
These l e v e l s were n o t measured a t t h e same t i m e b u t t h e i r r e l a t i v e

1
I I
posit ions a re representative of the regiorial piezometric surface. The inferred groundwater flow direct ion i s from n o r t h t o south i n the region n o r t h of Rutland and ea s t to west in the Rutland -
Kelowna Bench area. The water level gradient on the N-S cross- sect ion i s sloping in the n o r t h a n d f l a t i n the south. This i s the case because the l i n e of the section i s pc.ralle1 to the groundwater flow direct ion in the north ar .d perpendicular t o i t in the south. The slope of the water level gradient between NS-1 a n d NS-2 i s 0 .01 a n d between NS-5 and EW-3 i s 0.008. The s teeper slope between NS-1 and 2 may indicate lower transmissivi ty and f i n e r grained aquifer materials in t h i s area. This concept i s reinforced by the geological l o g of NS-1 ( a l l geologjcal logs are attached i n Appendix A ) which shows much more f ine sand t h a n the other cross-section wells. However, the aquifer i s th ickes t in the area of NS-1 and high yielding wells are possible in t h i s area using a long screen design.
The approximate known extent of the Futland aquifer i s shown in Figure 1. The k n o w n aquifer aer ia l extent. i s approximately 14 square miles. Subsequent t e s t d r i l l i n g will l i ke ly expand the known area of the aquifer. The aquifer varies in thickness from 30 f e e t to over 200 fee t . Transmissivit ies f o r the aquifer have been calculated between 2.7 x l o 4 a n d 2 .0 x l o 5 US gallons per day per foot . coef f ic ien t f o r the aquifer has been calculated i n the order of As the Rutland a u i f e r i s comprised of sand a n d gravel i t l ike ly has a porosity of approximately 0 . 3 and a spec.ific y i e l d of approximately 0 .2 (Walton, 1970).
The storage
P
The amount of water i n s torage i n the aqui fe r can be estimated as follows: Aerial extent x average thickness x porosity or 14 (2 .78 X 10’) square f e e t x 100 f e e t x 0 . 3 = 1 .2 x 10” cubic f e e t o r 7 .48 (1.2 x 10”) = 9 x 10” US gallons. This i s equal t o 275,000 acre-feet .

I I
I
1 I 1 I U 1 1
4.2 Groundwater - Surface -- Water In t e r r e l a t ionsh ip -____
There are several sources t h a t contribute recharge t o the Rutland aquifer . Recharge water must en ter the aqui fe r via the overlying semi-confini ng beds o r d i rec t ly where the aquifer crops out. The aquifer may crop o u t in the upland e a s t of Rutland in the region covered by Units 7 , 10, 11, shown on the attached Figure 5 (Sur f i c i a l Geology map by Nasmith, 1962). The possible sources f o r recharge water include; p rec ip i t a t ion , i r r i g a t i o n waters or Mission Creek. The discharge points for the aquifer include; wel l s , spr ings, Mission Creek bed, a n d possibly Okanagan Lake.
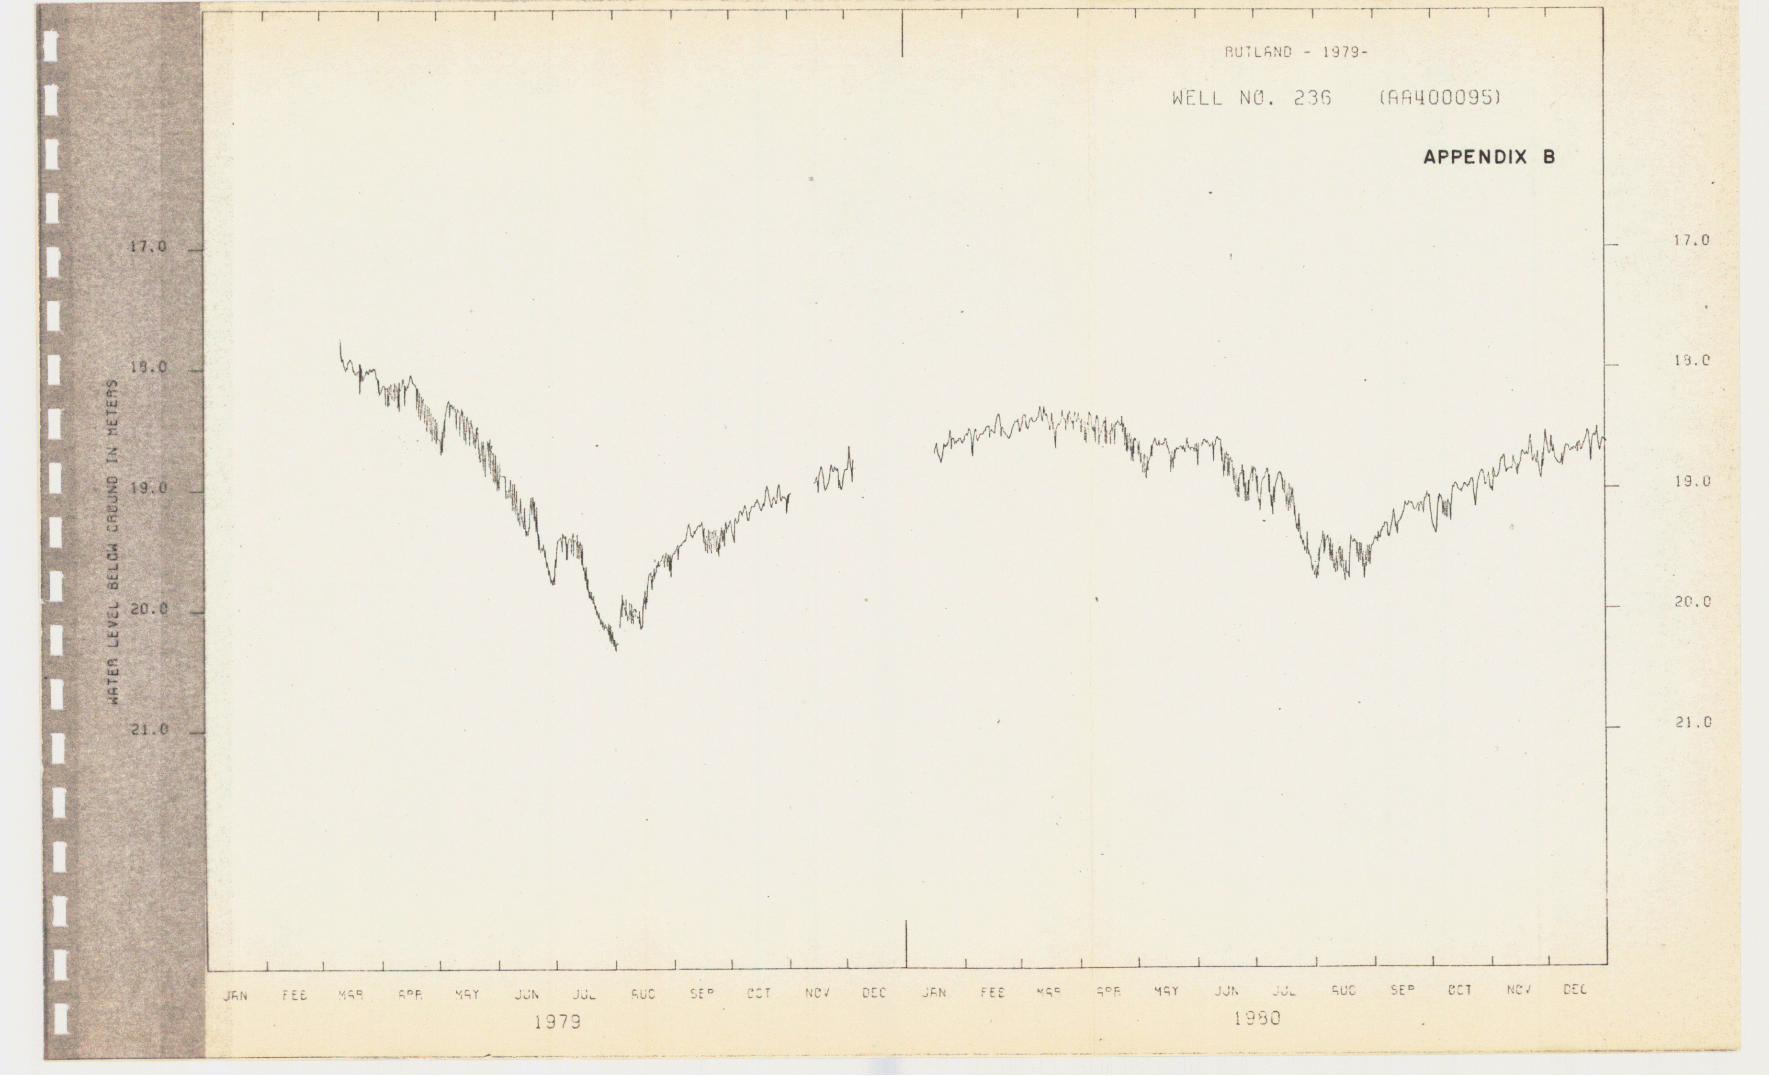
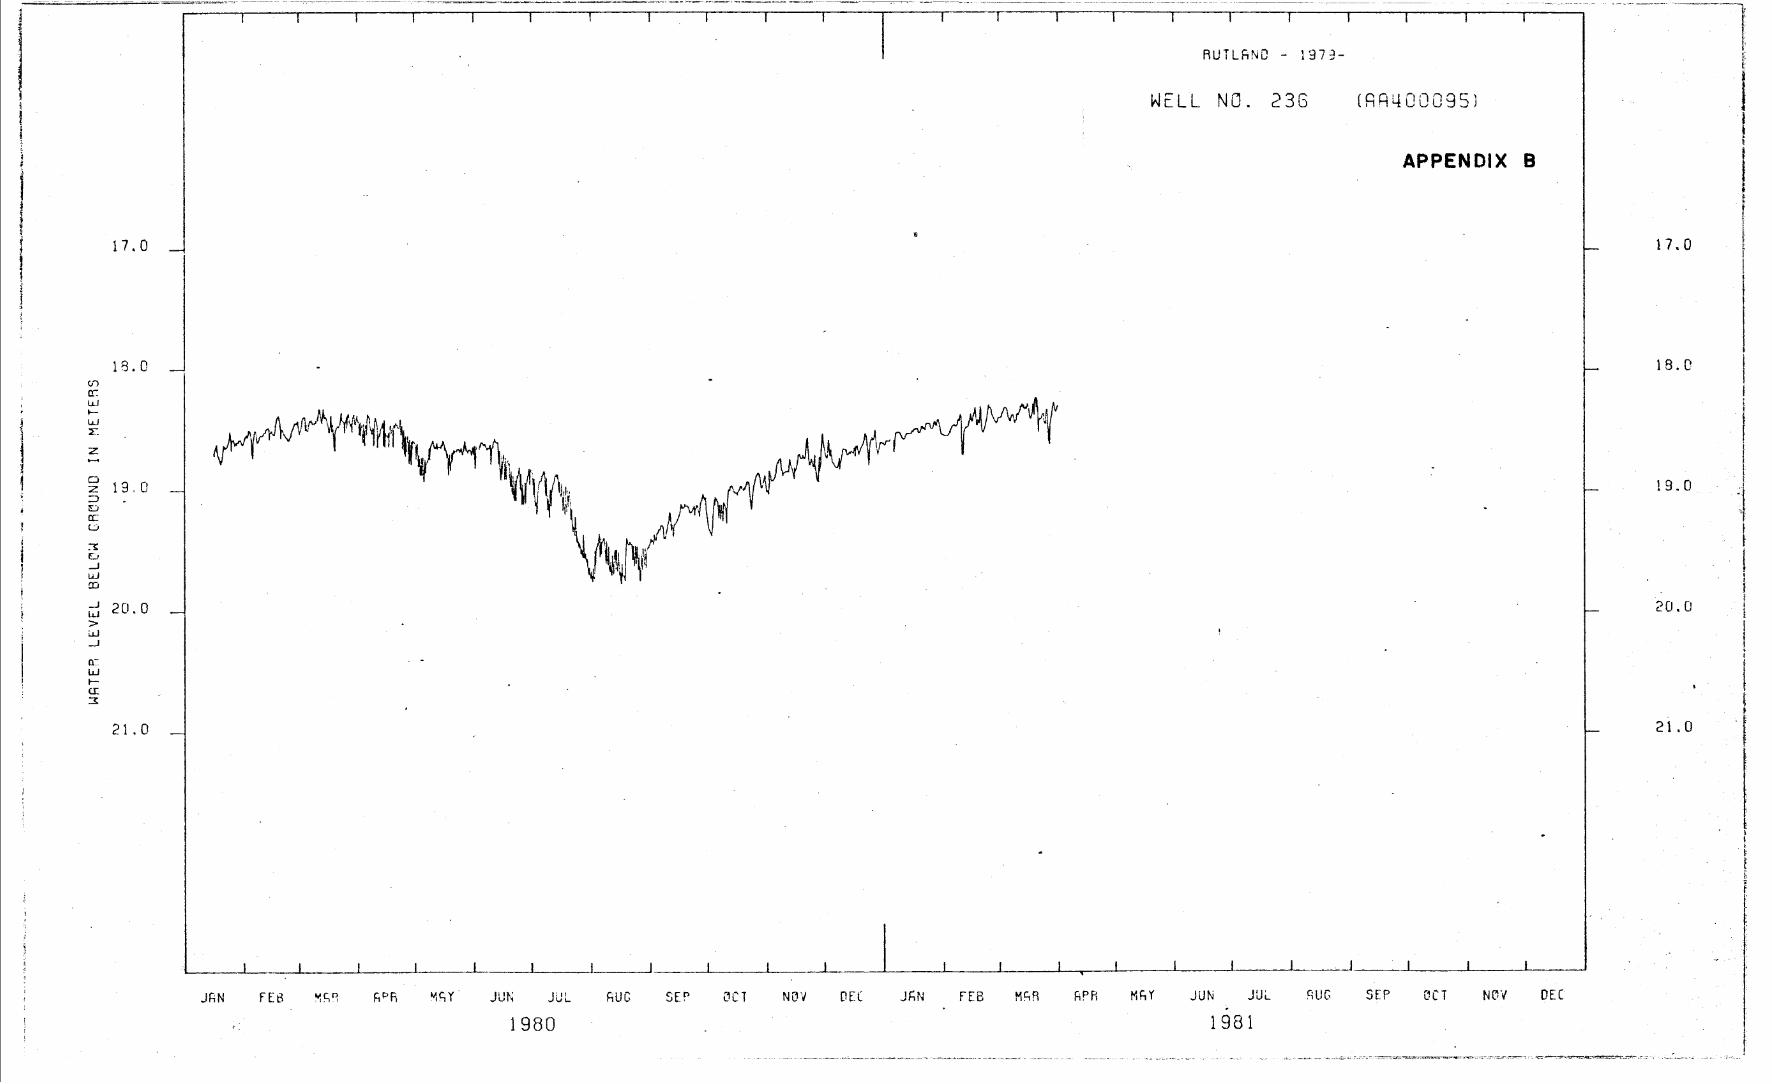
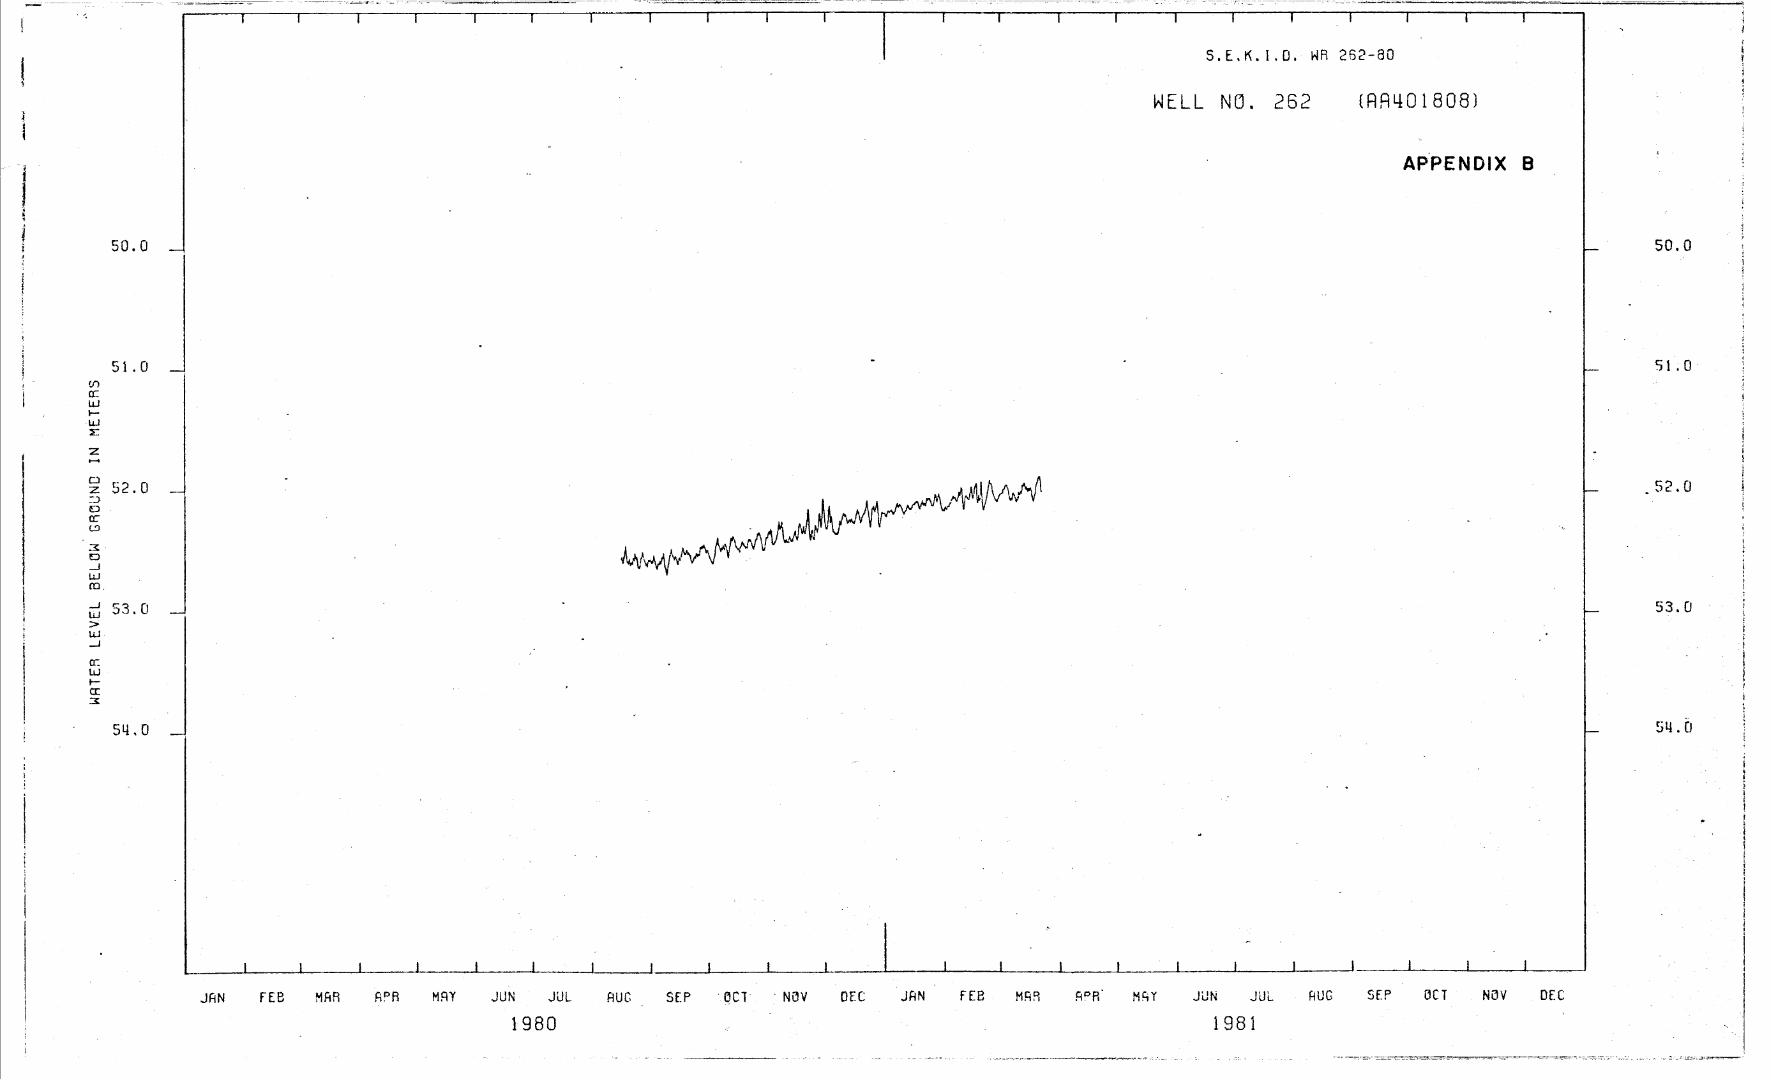
Observation well d a t a i s avai lable from 3 observation wells completed in the Rutland aquifer. The three well locat ions ( W R numbers 2 2 2 - 7 7 , 236-79, a n d 262-80) a re plot ted in Figure 1. The water level f luctuat ions in these three wells (Appendix B ) a re i n close correspondence. The length of record from well WR 262-80, however, i s n o t s u f f i c i e n t for a r e l i ab le comparison. B o t h well WR 222-77 and WR 236-79 hydrographs show s imi la r trends with a sharp t r o u g h in July a n d August, 1980 a n d a smooth peak reaching a maximum in March, 1981. Well W R 222-77 has a maximum recorded yearly f luc tua t ion of approximately 1 meter and WR 236-79 has f luctuated u p to 2.5 meters. This is l ike?y due t o the proximity of well WR 236-79 to the Rutland production wells. drawdown in this aquifer should occur in the Rutland area a s the 1 arges t p u m p i n g wi thdrawal s occur here.
The maximum
I t i s in te res t ing to note t h a t the aqui fe r begins. the recharge cycle i n July and August desp are high a t th is time. Also, minimal a t t h i s time o f year . applied i r r iga t ion may be an area.
t e the f a c t t h a t pumping withdrawals natural recharge i s expected t o be This suggests t h a t recharge from
mportant phenomenon occuring i n t h i s
Stream discharge meterings a n d h i s to r i ca l stream discharge records compared with observation we1 1 h y d r o g r a p h s ind ica te t h a t there i s not a s i g n i f i c a n t d i r ec t connection between Mission Creek and the Rutland aqui fe r . Five s e t s of stream discharge meteri n g s taken between December, 1979 a n d September, 1980 are plotted in Figure 2 and metering s i t e s a re shown in Figure 1. Between s i t e s F a n d H the discharge consis tent ly increases. Here the creek flows through a groundwater discharge area with several k n o w n springs and flowing wells. Between s i t e s E a n d F the creek can be gaining or losing. Here the creek l i ke ly recharges the su r f i c i a l aquifer or i s recharged by the s u r f i c i a l aquifer depending on the water tab le level in the su r f i c i a l aquifer . Water use and return flow from the A.W.U. ditch i s a l so a f ac to r in th i s sec t ion . Between s i t e s D a n d E the creek flow i s cons is ten t ly decreasing, by a small amount. Here the creek i s recharging the upper water-bearing so i l s t h a t over l ie the Rutland aquifer. Between s i t e s C a n d D the creek can be gaining o r losing. Here the groundwater level versus creek level relationship l i ke ly reverses during the year. the August 19 d a t a indicate a s l i g h t loss from the creek ( t h e data f o r the September 23 i s questionable a n d n o t su i t ab le f o r i n t e rp re t a t ion ) . The creek flow increases between A and B indicat ing groundwater inflow a t l ea s t f o r the l a t e r summer a n d f a l l when the meterings were taken.
Between s i t e s B a n d C ,
Historical number 08NM 11 6
May or June a n d The location o f hydrographs f o r l a t e summer t i l water levels i n
discharge records from Water Survey of Canada gauge n lower Mission Creek show maximum flows occur i n
minimum flows usually in l a t e summer, f a l l o r winter. the gauge i s plotted in f'igure 1. the Rutland aquifer show the aquifer i s recharged from
The drop i n the aqui fe r correspond t o increased p u m p i n g from the
Observation well
spring when water levels drop s teeply.
Rutland well f i e l d . I t appears t h a t i f Mission Creek recharges the Rutland aquifer there i s a time lag of several months before the aquifer responds, o r the recharge e f f e c t i s masked by pumping. A time lag f o r
flow from the creek t o the aquifer would be expected as the aquifer appears t o be overlain everywhere by a layer of very low permeability t i l l .
There are records avai lable fo r three observation wells a l so completed in the s u r f i c i a l sand and gravel aquifer , ( W R numbers 23-62, 64-65, and 65-65) i n the lower Mission Creek area and the hydrographs are attached in Appendix B. a n d t h e i r locat ions a re show,n in Figure 1. being used f o r observation purposes. a n d WR 64-65 peaked in mid-summer a n d were a t minimum levels in winter. Well WR 65-65 shows an opposite f luctuat ion with maximum levels in winter or spring and lowest levels in summer. Well WR 65-65 f luc tua tes a to ta l of about 2 f e e t a s compared to 8 or 9 f e e t f o r the other 2 wells. Observation wells WR 23-62 and WR 64-65 are a t higher elevations t h a n WR 65-65 a n d a r e located in a recharge area f o r t h i s s u r f i c i a l aquifer.
The wells range from 7 t o 24 f e e t deep These wells a re no longer
Water levels i n wells WR 23-62
The sources of recharge fo r the su r f i c i a l aquifer here are l ike ly Mission Creek ( a t f r e she t time i n p a r t i c u l a r ) , i r r i ga t ion water, a n d
d i rec t p rec ip i ta t ion . the discharge region of the su r f i c i a l aquifer and the f luctuat ions here are damped a n d may show a time lag from recharge events as the well i s d i s tan t from the recharge area.
Observation well WF! 65-65 i s l i ke ly located in
Direct prec ip i ta t ion i s not l ike ly the major source of recharge water for the Rutland aquifer . i s 12.00 inches, comprised of 8.51 inches of ra in a n d 34.9 inches of snowfall (which equals 3.49 inches of water) . the Mission Creek watershed (4,100 f e e t A S L ) , there i s a n average 12.63 inches rain and 145.1 inches snow f o r a to ta l of 27 .14 inches of to ta l p rec ip i ta t ion . The Rutland aquifer may outcrop i n the upland e a s t of Rutland as described e a r l i e r . The g rea t e s t potent ia l f o r d i r ec t recharge would be from snow melt, however., s ign i f i can t recharging of the aquifer i n spring-time i s n o t evident from the observation we1 1 hydrographs
A t Kelowna the mean to t a l p rec ip i ta t ion
A t McCulloch, higher i n

1. '1 -
Direct prec ip i ta t ion on the outcropping aquifer contributes b u t i s not l i ke ly the m a j o r recharge coniponent f o r the R u t l a n d aquifer .
Recharge from the overlying shallow deposi ts i s l i ke ly the major 5cti;'ce of replenishment fo r the R u t l a n d aquifer .
pumping overlying s o i l s . The water levels in t h e Rutland aquifer begin to r i s e in l a t e Jul'y a n d August when water levels a r e a t a minimum from the heavy suminer-time pumping,mainly from the Rutland production wells. Also the shallow well observation well records show t h a t water levels in the upper aquifer zones peak in July or August and begin t o f a l l j u s t when the R u t l a n d aquifer levels are r i s i n g . The shallow aquifer a t W R 65-65 does not follow t h i s pat tern l i ke ly because i t i s located in a groundwater discharge area.
Moreover, from the aquifer may induce s i g n i f i c a n t leakage from the
The upper aquifer in turn i s recharged by excess i r r iga t ion water, d i r e c t p rec ip i ta t ion and from Mission Creek. I r r iga t ion waters may be the most s ign i f i can t source of recharge f o r the shallow aqui fe r (s ) i n the Lower Mission Creek area. most of the area in shallow wells peak a t the height of the i r r iga t ion season. Extensive orchard i r r i g a t i o n occurs on the East Kelowna Bench and in the area e a s t of Rutland,by S . E . K . 1.D a n d B . M . I . D . respect ively. There i s very l i t t l e orchard i r r i g a t i o n i n
Rutland b u t a large portion of water consumption here i s used f o r lawn watering. I n addition to replenishing the shallow aqui fe rs , i r r i ga t ion water may recharge the Rutland aqui fe r d i r e c t l y in the area eas t 'o f Rutland.
The water levels over
The shallow aquifers a lso appear to be s e n s i t i v e t o prec ip i ta t ion . From Kelowna precipi ta t ion records (Appendix B )
i t i s evident t h a t from 1965 t o 1967, p rec ip i t a t ion was below normal. declining water levels in th i s 3 year period. This trend i s
T h e two hydrographs WR 23-62 and WR 64-65 show s teadi ly

I I 1 I 1 i
I I I I I I U
broken i n 1968 when t h e wa te r l e v e l s i n c r e a s e f r o m t h e p reced ing
y e a r i n response t o above average p r e c i p i t 3 t i o n .
Discharge f r o m t h e Ru t land a q u i f e r Carl o c c u r i n t h r e e
d i f f e r e n t manners; p r o d u c t i o n w e l l pumping, n a t u r a l s p r i n g s and
losses t o o v e r l y i n g o r u n d e r l y i n g f o r m a t i o n s . P r o d u c t i o n we1 1
pumping i s a m a j o r d i scha rge component f o r t h e R u t l a n d a q u i f e r .
The t h r e e hydrograph reco rds i n Appendix B (WR numbers 222-77,
236-79 and 262-80) show t h e sharp drawdown and r e c o v e r y s p i k e s
c h a r a c t e r i s t i c s o f pumping e f f e c t s . Despi e t h e heavy drawdown
f rom pumping i n summer-time the a q u i f e r b e g i n s t o r e c o v e r i n
August i n d i c a t i n g t h a t recharge exceeds d i :;charge once t h e
p i e z o m e t r i c s u r f a c e i s lowered below a c e r - t a i n p o i n t . Pumping
reco rds f rom t h e Ru t land Waterworks D i s t r i c t f r o m 1974-75, show
an average o f g r e a t e r than 600 m i l l i o n g a l l o n s p e r y e a r pumped
w i t h app rox ima te l y t w o - t h i r d s o f t h i s b e i n g pumped i n t h e f o u r
months f rom May t o August.
N a t u r a l s p r i n g s a r e ano the r d i s c h a r g e component i n t h e wa te r
budget f o r t h e R u t l a n d a q u i f e r .
s u r f a c e l i k e t h e Casorso S p r i n g o r may o c c u r i n t h e bed o f
M iss ion Creek and p o s s i b l y Okangan Lake.
p l o t t e d i n F i g u r e 2 show inc reased f l o w s between s i t e E and s i t e F
i n d i c a t i n g groundwater i n f l o w . Th is i n f l o w can be coming f rom b o t h
The s p r i n g f l o w may o c c u r a t
The s t ream m e t e r i ngs
t h e s u r f i c i a l sand and g r a v e l aqu
Discharge may o c c u r f rom t h e
o r o v e r l y i n g fo rma t ions . The aqu
f e r s and t h e Ru t land a q u i f e r .
Ru t land a q u i f e r t o u n d e r l y i n g
f e r i s o v e r l a i n by t i l l and u n d e r l a i n
by s i l t , t i l l o r bedrock. T i l l has a l ow p e r m e a b i l i t y b u t t h i s u n i t
may be d i s c o n t i n u c u s o r may be f r a c t u r e d i n p l a c e s a l l o w i n g s i g n i f i c a n t
f l o w wherever a h y d r o s t a t i c p o t e n t i a l i s p r e s e n t . The u n d e r l y i n g
s i l t s , t i l l, and bedrock a l s o have low perrneabi l i ty and f l o w t o these
u n i t s i s n o t expec ted t o be s i g n i f can t .

I I I I 1 1 1 1 1 I I I I I I I I I
5.
1.
2.
3.
4.
5.
6.
7.
- 16 -
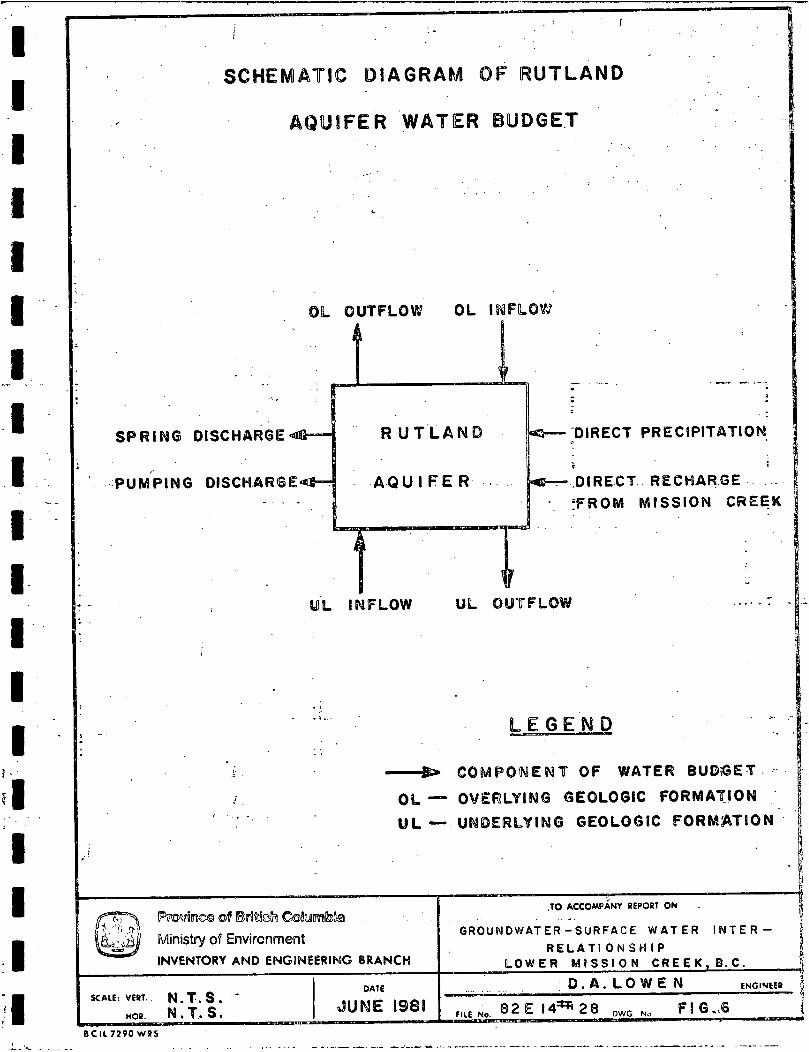
Recharge a n d discharge appear to be essent i a1 ly balanced in the Rutland aqui fe r . Observation well WR 222-77 has a maximum water level 1 foot lower a f t e r 44 years of record indicat ing t h a t water levels may be e s sen t i a l ly s tab le ov(?r the e n t i r e aquifer . The schematic d i a g r a m i n Figure 6 depicts the various recharge a n d discharge components involved in the iiquifer water budget.
CONCLUSIONS AN D R E COMMEN DATI ONS
The exchange of water between Mission Creek channel below the B . M . I . D. intake and the groundwater system i s re1a::ively mino the B . M . I . D . intake should be avai lable in the lower creek. Geological cor re la t ion i s possible in the lower Miss
'. Water passing reaches of the
on Creek region despite the complex t i e s of the region 's geological h i s tory . The Rutland aquifer which was f i r s t tapped by the Rutland production wells appears to be continuous a n d extensive, underlying most of the Rutland, Benvoulin, East Kelowna Bench, arid Cornish Road areas . The fu l l extent o f the aqui fe r has not been determined. Indicat ions are t h a t the aqui fe r underlies an area of a n approximate minimum s i z e of 14 square miles. in Figure 1.
Despite the la rge s c a l e pumping from the Rutland aqui fe r , water levels appear t o be s t a b l e . However, longer tern hydrograph records a re necessary t o e s t a b l i s h a de f in i t e trend. A continuous 10 year hydrograph record woul d be des i rabl e . The observation wells now in place i n the lower Mission Creek area should be kept i n operation as long a s possible. Observation well records f o r the R u t l a n d aquifer should be examined periodically t o determine i f and when groundwater mining i s taking place. The Rutland aquifer can support more production we1 1s without ser ious lowering o f aquifer water levels o r decrease of flows i n Mission Creek. Total pumping should not exceed the recharge potent ia l of the aquifer.
The approximate known extent of the aquifer i s shown

- ' I ? -
I
The aquifer recharge i s a t l e a s t eqilal t o the present pumping r a t e 8 of a minimum 6 x 10. US gallons per year recorded pumping by the
Rutland Waterworks D i s t r i c t . The amount of water estimated in storage i s 9 x 1 O 1 O US gallons an$ therefore present annual pumping discharge i s approximately
Additional groundwater development i s therefore very f eas ib l e .
l o x 100 = 0.66% of water in s torage.
8. Computer modelling of the Rutland aquifei- may be f e a s i b l e in the near future as more data i s becoming ava.ilable year ly . model of the aqui fe r would be a valuable management too l .
A computer
9 . The combined water resources of Mission Creek and the Rutland aquifer system provide an excel lent opportunity .for the conjunctive use of surface water and groundwater. flows in Mission Creek could be diverted t o the R u t l a n d aquifer by siphoning wells or recharge basins thereby using the aquifer as a storage reservoir t h a t can be tapped l a t e r ' n t he year when creek flows a r e minimal. t o augment creek flows when the natural flow i s t o o l o w f o r f i she r i e s o r i r r i g a t i o n requirements.
For example, some o f the excess f r e she t
\riater pumped from the aqui fe r could be used
10. A groundwater chemistry study i s recoinmendedfor the lower Mission Creek area and in par t icu lar f o r the Rutland aquifer . Groundwater chemical analyses can be used t o delsneate recharge and discharge areas and aid in defining the direct ion of groundwater movement. Groundwater isotope analyses a r e par t icu lar ly useful f o r t h i s type of study.
11. Eight components have been ident i f ied which comprise the water b u d g e t f o r the Rutland aquifer . The inflowing o r recharge components a re as follows: ( 1 ) Leakage from the overlying geological formations, ( 2 ) Leakage froin the underlying geological formations, ( 3 ) ( 4 )
Direct precipi ta t ion on the outcropping aqu i f e r , Direct recharge f r o 3 Mission Creek on the outcropping aquifer .

. . . . , , ., . , - ----- - . . . . . . ..
- 18 -
,
The o u t f l o w i n g o r d i s c h a r g e components a r e #as f o l l o w s :
( I ) Pumping d ischarge,
(2) S p r i n g d ischarge,
(3) O u t f l o w t o t h e over ' i y ing g e o l o g i c a l f o r n a t i o n s
( 4 ) O u t f l o w t o t h e u n d e r l y i n g g e o l o g i c a l f o r m a t i o n s .
Wi th t h e c u r r e n t amount o f pumping f r o m t h e a q u i f e r and i r r i g a t i o n
o v e r t h e a q u i f e r , t h e a q u i f e r i s no l o n g e r o p e r a t i n g as a n a t u r a l
system. For t h e c u r r e n t w a t e r budget, pumping i s l i k e l y a
s i g n i f i c a n t p o r t i o n o f t h e d scharge components, and leakage from t h e
o v e r l y i n g f o r m a t i o n s i s l i k e y a s i g n i f i c a n t p o r t i o n o f t h e recharge
components.
i n d i c a t e s t h a t t h e summation o f t h e recharge .components i s
e s s e n t i a l l y equal t o t h e summation o f t h e d i s c h a r g e components.
I I I B I I I
- - - - _ The o b s e r v a t i o n we1 1 hydrograph i n f o r m a t i o n t o d a t e
I
I I
D.A. Lowen G e o l o g i c a l Eng ineer Groundwater S e c t i o n N a t e r Management Branch
D.B. Le tvak S e n i o r H y d r o l o g i c a l Eng ineer S u r f a c e Water. S e c t i o n Ma te r Management Branch
, ...
DAL/ DB L/ dm a

I I I
- 19 -
REFERENCES
1, Lowen, D.A., Mission Creek Groundwater Study, E L C , Ministry o f Envi ronmen t 1979.
I -\
L- __I x 2. Nasmith, H . , Late Glacial H i s o t r y b n d S u r f i c i a l Deposits o f the
I Okanagan Valley, B.C., B u l l e t i n No. 46, B.C, Dept. o f Mines and Petroleum Resources, 1962,
3. Walton, W.C., Groundwater Resource Evaluat ion, pp. 23-34, 1970.
- 4. Lowen, D.A. and Letvak, D . B . , Memoranda on Mission Creek Discharge I Metering, March 13 and June 2 , 1980.

c
E
*
L E G E N D
i
i STREAMFLOW M E T E R I N G STATIONS . : - .
= + -
WATEf? SURVEY GAUGE I
I 'i ! .
W R - 222-77 i
i GROUNDWATER . OBSERVATION WELL,ORILLED
W E L L ~ USED F.OR GEOLOGIC CROSS-SE'CTION -
GROUNDWATER O B S E R V A T I O N WELL, DUG.
S P R I N G
. . A P P R O X I M A T E K N O W N E X T E N T OF RUTLANO i AQUIFER
N S - I
oWi- 65-65
--- - . . .. , . . , , . . - . - . . ~ . . .. . - . . . . . -
DATE I JUNE 198# S C A L E
I : 50.000 TO A C C O M P A N Y REPORT ON
Ministry of Environment
Water Management Branch Parliament Buildings Victoria British Columbia vav 1x5
Province of British Columbia GROUNDWATER - SURFACE WATER INTERRELATIONSHIP
ENOIN ESR D.A.LOWEN { D.B.LETVAK
L O W E R M I S S I O N C R E E K , 8 . C .

170
160
150
140
130
1 2 0 0
170
160
I50
140
INFLOW
Y 1.6 CFS x I t
1 3 0 j
1 2 0
jOlo I N FLOW
O \ -1 .5 C F S INFLOW - 0.76 C F S
V
w t3
l o o 3 E a 90 --I
100 2.J
[ g o c,
L E G E N D w -
3 METERING DATE
DECEMBER 1 2 , 1 9 7 9
SYMBOL
A V 0 0
x
35;o
3 0.0
2 5 .O
f 27, 1980 MARCH I
19, 1980 A U G U S T 30.0
25.0 E 20.0 S E P T E M B E R 9,1980
S E P T E M B E R 2 3 , 1 9 8 0
M E T E R I N G S 20.0
a A V E R A O E O F 2 M E T E R I N G S
S I N G L E M E T E R I N G ONLY
INFLOW TO M I S S I O N C R E E K
u/s A
M E T E R I N G S I T E S
- 1 T O A C C O M P A N Y R E P O R T O N S C A L E : V E R T . AS SHOWN D A T E Province of Ministry of Water Management Branch H O R . N.T.S. J U N E 1981 British Columbia Environment Parliament Buildings G R 0 U N DWAT E R - S U R FACE W AT E R I IN T E R R E LATlO N S H I P
D.A.1OWEN 4 0 .B .LETVAK E N Q I N E E R Victoria British Columbia vav 1x5 ,.. _ . F I L E NO. 82E14*28 I F I G . * 2
L O W E R MISSION CREEK, B.C.

1 .
1 5 0 0 - 1500
- 1400
- 1300
- 1200
- 1100
- 1000
- 900
E A S T K E L O W N A B E N C H
N L1
\ Y W
S COR Nl SH
ROAD I 4 0 0
1300
I 2 0 0
1100
I O 0 0
900
8 0 0
SAND AND GRAVEL \ : R U T L A N D SAND AND G R A ~ E ~ .......
SAND
. . . . .
---c- .......
61' 109' I 3/71 4/70 ..- ....................
_ - e? C L A ' r AND S ILT 167' 1/60 ! ?!??. ...................... C
AND
S I L T
G R A V E L AND S I L T
TILL
,......... .................................. ......................... T I L L --------
SAND AND S I L T S A N D AND S I L T
S I L T Y SAND
WIT ti
G R A V E L ' -
T I L L
S A N D
N S - 4 AND
S I L T / 1
. S A N D \
1 AND ?--- C L A Y '> \
SJLT /
\
---. \
SAND A N D
S I L T L E G E N D
NS-3 C L A Y N S - 2 - D R I L L E D W E L L S
61'- D E P T H TO W A T E R L E V E L WHEN D R I L L E D v 3171- D A T E M E A S U R E D
NS-2 n 1
4
* * * - - . * * - P I E Z O M E T R I C S U R F A C E
- T I M E S T R A T I G R A P H I C U N I T OR C O N T A C T
D I S C U S S E D IN " G E O L O G Y " S E C T I O N OF T E X T - 800
CROSS SECTIONAL VIEW N-S NS- 1 --- I N F E R R E D G E O L O G I C C O N T A C T
T O A C C O M P A N Y REPORT O N D A T E S C A L E : V E R T . 1"- 100' JUNE 1981 HOR. I " = t 000' Ministry of
Environment Water Management Branch Parliament Buildings Victoria British Columbia V8V 1x5
Province of British Columbia GROUNDWATER -SURFACE WATER I N T E R R E L A T I O N S H I P
' D. A. L O W EN E N O l N E E R
L O W E R MISSION CREEK, 0.C. f l L E N0.82E14%8[ F I G . 3 . _ . - - . -
. . . . . . . . . . . .. ... . . . . . . .._ - ..... ^J .... -., . . . . . . . . . . 1 _._- . .......J ., . . . . . . . . .
. .
- -. , . . , , ~ ~ - - . . , * ~ . . . . . . . . . . . ~- ~
E
GR OU N DWAT E R - S URFAC E W AT El?
, . "%" . - 1 c. _I
J U N E 1981 N O R . I " = 1000'
1600
1500
1 4 0 0
1300
1200
I100
1000 E W - 3
AND OR AVE L
Province of British Columbia
Ministry of Environmenl
Water Management Branch Parliament Buildings V i r i a Bribsh Columbia V8V 1x5
/
SILT
/ a B
SILT Y C L AY - SA N D.STONE
E W-
CROSS SECTIONAL VIEW E- W
.NO SHALE
E D R O C K
I
T O A C C O M P A N Y R E P O R T O N I S C A L E : VERT. 1"- 100' 1
E N G I N E E R D . A . L O W E N INT ER RELATIONSHI P L O W E R MISSION CREEK, B.C. F IG . 4 F I L E N O . 82E14*28
! a
?
. .
1

I I I I I I I I I I I I 1 I I I u I ,I
,- I I
SCHEMATIC D I A G R A M O F
AQUIFER WATER BUDGET
SPRING DISCHARGE R U T L A N D
P U M b I N G 01 SCH A R 6 E A Q U I F E R .
‘ I
.- .
, i
*DIRECT RECHARGE . :FROM M I S S I O N C R E E K
. / . i ... L E G E N D
“
- ..... . ,
.TO ACCOMPANY REPORT ON . h v i m off Blrst6& WUrnbh . . _ .
Ministry of Environment G R O U N D W A T E R - S U R F A C E W A T E R I N T E R - R E L A T I O N S H I P
INVENTORY AND ENGOWEEWING BRANCH
BC117290 WllS . _ _ - -.- _-. - -_.- .-.. --__ - --. . __-_---_._

Appendix A
Cross-section
Well Logs
. .
i

EW- 1 ,
Los
- From - To [Description
0 .
214 262 272
320
214 ( f ee t )
262 272 320
S i 1 ty sandy gravel ly outwash probably w i t h occasional patches o f ti 11. L i g h t brown compact t i 11. Sandy s i l t , quite s o f t , grey. Compact s t icky chocolate brown s i l t y clay w i t h pebbles o f sha le and deeply weathered greenish sandstone. weathered t i 11.
T h i s may be an old
337 Tert iary sandstone and shale.
EW-2
bog
To - From - '0 12 12 17 17 26
26 39 39 40
. 40 74
74 86
96
103
108 112 114
i 120 128
'86 96
103
108
112 114 120 128 129
129 135
135 140 140 148
Description
S i l t y tan sand. Medium coarse sand w i t h small cobbly gravel. Medium coarse gravel and coarse sand (water- bearing). Compact tan s i l t w i t h clay lens. Compact tan s i l t w i t h gravel. Compact coarse gravel and sand. Some tan s i l t , changes t o cobbly gravel. Ti 11 , hard gravel ly tan coloured. Very fine t o coarse sand w i t h f ine and coarse gravel , w i t h t h i n t i l l lens, h i g h tan s i l t con tent . Fine and medium loose pebbly gravel. High fine t o coarse sand content. Interbeds of tan t i l l , h i g h tan s i l t content. Fine t o coarse loose pebbly gravel , some very coarse gravel, some tan s i l t . Medium t o coarse pebbly gravel , tan s i l t . Fine t o coarse sand, tan s i l t . Cemented coarse cobbly gravel. Coarse , very coarse pebbly gravel. (water-bearing) Medium coarse sand, some fine sand, some pebbly gravel. Fine t o coarse pebbly gravel and medium coarse sand (water-bearing). Medium coarse pebbly gravel (water-bearing). Wery coarse cobbly gravel , quite compact, traces of t i l l

I
- A3 -
EM-2 (Cont)
bog
148 154 ( f ee t ) Medium coarse, loose pebbly gravel , clean. 154 158 Fine t o coarse pebbly gravel w i t h higher
medium coarse sand content (water-bearing) 158 161 Fine t o coarse compact gravel and sand
(poor water-bearing) f
From
5 .5
6 .1
8.5 9.1
11.6 12.8 19.2 27.4 29.3 32.3 33.5 37.2 41.2
41.8 44,s
46.3 48.2
- 0 '
TO - 5.5 (metres) 6.1
8.5
9.1 11.6 12.8 19.2 27.4 29.3 32.3 33.5 37.2 41.2 41.8
44.5 46.3
48.2 50.0
hog
Des cri p t i on
Clayey s i l t w i t h t h in layers of gravel. Coarse gravel w i t h cobbles t o 1.6 cm. d i ame te r , 1 00 se Coarse grave l ; s t a t i c water level approx. 0.5 rn below ground. Clay. Clay w i t h seams o f gravel. Coarse gravel w i t h layers o f clay. C1 ay . T i l l , very dense. Sloppy gravel w i t h hard 1 ayers. Sand and gravel. Sand and grave lg loose. Sand and grave l , very loose. Sand and gravel. Aquifer Sand and gravel , l ayer o f very coarse gravel 41.2 t o 41.5.
Silty sand and gravel w i t h c l ay binder, can d r i l l approx. 1 m ahead w i t h heavy mud. S i l t y sand and medium gravel. Dense s i l t w i t h some clay.
S ha 1 1 ow Aquifer
.
Deep
S i l t y sand and gravel w i t h c l ay binder. . 1 -
I

- A 4 -
NS- 1
I 1 1 I I I
Log
From - To D e s c r i p t i on
0 36 73
96 146
2 42
250 260
306 331 3 40 472
36 ( f e e t ) 73 96
146 2 42
250
260 306
33 1 340 472 5 10
Brown c l a y and s i l t . B lue c l a y s i l t w i t h sand lenses . M i x t u r e of s i 1 ty s toney d e p o s i t s , may have patches o f t i l l . T i 11 , v e r y compact. Sand, medium t o f i n e , some g r a v e l l e y and some s i l t y zones, a l l c o n t a i n s p l a n t remains. Very f i n e s i l t y sand w i t h p l a n t remains.
ROTARY HOLE FROM HERE DOWN
Very f i n e s i l t y sand, p l a n t remains. P r o b a b l y i n t e r b e d d e d f i n e sand and s i l t , w i t h p l a n t rernai ns. Same as 260-306 e x c e p t more s i l t . I n t e r b e d d e d f a t c l a y and s i l t . F a t g rey c l a y . Gravel and sand, some b o u l d e r s c o u l d be ti 11 a
From
0 33 36 47 49 63 163
199 20 1
244
259
300 316 329 33 1 348
To
33 ( f e e t ) 36 47 49 63 163 199
201 2 44
259
300
316 329 33 1 348 356
-
NS-2
Log
D e s c r i p t i on
Loose b o u l d e r y g r a v e l . F i n e brown sand. ( w a t e r - b e a r i n g ) Medi um sandy g r a v e l . S o f t s i l t . Co o u r brown. Medium sandy g r a v e l . S t i c k y g rey c l a y . Compacted g rey sandy t i l l w i t h occas iona sand and g r a v e l l a y e r s . Coarse s i l t y sand. Very h a r d a b r a s i v e t i l l g e t t i n g s o f t e r a t t h e bottom.. S i 1 ty sand o c c a s i o n a l s i 1 t y varves and sandstone c o n c r e t i o n s . Hard g rey t i l l w i t h o c c a s i o n a l s i l t y and sand l a y e r s . I n t e r b e d d e d g r a v e l l y sand and s i 1 t. Medium sand w i t h some f i n e g r a v e l . Greenish g rey till. Medium g r a v e l l e y sand. Medium sand w i t h o c c a s i o n a l s i l t and sand varves.

1 I I I 1 I I I I I 1
,
From - 0 8
14
45 76 31 90 96
115 130 132 146 169 178
. 183
208 213 2 16 2 19 220 229 231 250 252
188
TO - 8
14 45
76 8 1 90 96
' 115 130. 132 146 169 178 183 188 208 2 13 2 16 219 2 20 229 231 2 50 252 260
'- A5 -
ws-3 ' - Lagl
Descri p t i on
Loose coarse s- i l ty gravel (some boulders). Finer and sandier gravel e Tan coloured fine t o medium sand and s i l t 1 ayer . Grey s i l t . Interbedded fine sand gravel and si 1 ts. Greenish grey s i l t s (c lay) . Interbedded fine sand, gravel and s i l t s . . Fine sand w i t h occas i onal s i 1 t y (varves?) Clean f ine sand. So f t tan s i l t layers. L
Tan sand coarser and cleaner. Medium t o coarse sand, some cobbles. Fine sand ( s i l t i e r , organic) Grey sand. Coarse sandy gravel. T i g h t sand and gravel. Very t i g h t s i l t y gravel. Loose clean gravel. Wery t i g h t s i l t y gravel (boulders?) Very t i g h t s i l t y gravel. Loose sandy gravel ( s i l t varve 228') Very t i g h t gravel. Loose sandy gravel. Loose sandy gravel. Grey brown s i l t w i t h small layers of coarse sand.
260 264 Sandy t i l l .
NS-4
T O From - Description
0 15 (feet) Gravel and sand. I 15 104 S i l t s and fine sand lens.
104 145 Medium t o coarse' sand w i t h
145 148 T i 11 - coarse gravel e 248 150 Compact s i l t y sand. 150 158 T i 11 and interbedded gravel. 158 206 Sands and gravel some s i l t s , occasional t i l l .
gravel (water-bearing )
1 I I 206 2 22 Very compact t i l l - l i ke sand and gravel.
I 1 I 1 1
I
From
0 11.6 25.6 28.9 32.6 51.5 60 .1
66.2
72.2 77.1
To -
11.6 (meters) 25.6 28.9 32.6 51 .5 60 .1 66.2
72.2
77.1 84.4
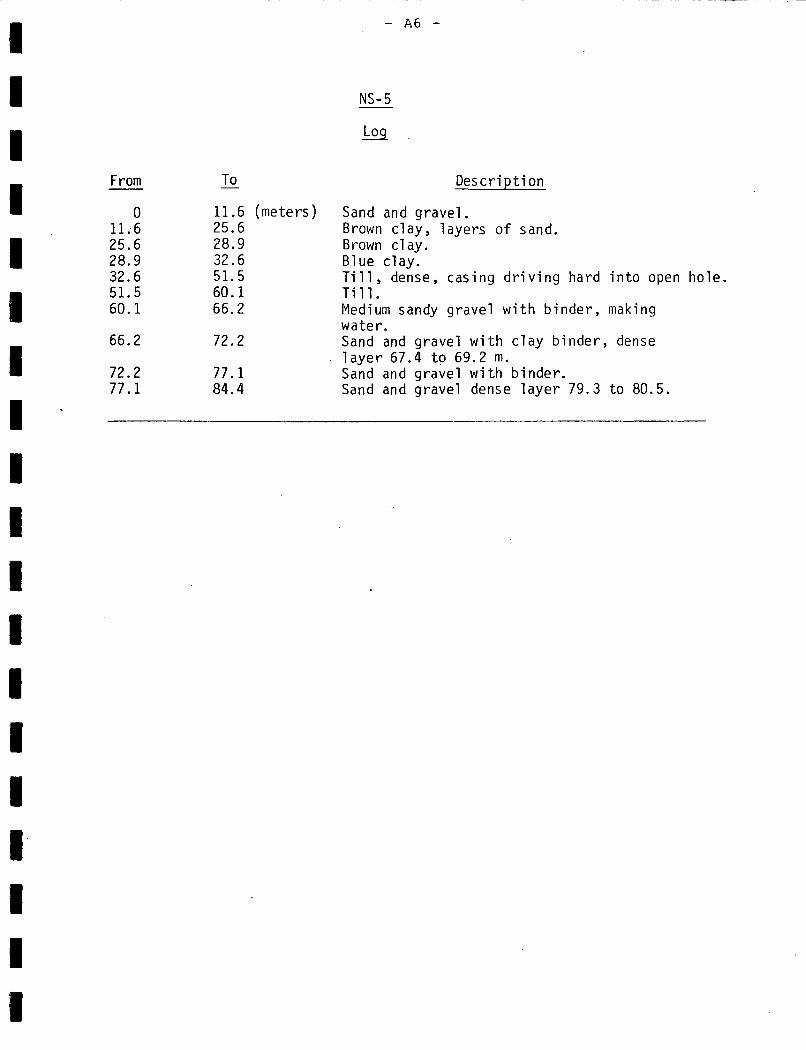
- A 6 -
NS-5
Log
Des c r i p ti on
Sand and gravel. Brown clay, layers o f sand. Brown clay. Blue clay. T i l l , dense, casing driving hard into open hole. T i l l . Medium sandy gravel with binder, making water. Sand and gravel with clay binder, dense l aye r 67.4 t o 69.2 m. Sand and gravel with binder. Sand and gravel dense layer 7 9 . 3 t o 80 .5 .

I 1
5 I I I I 1
I !
Appendix B
We1 1 Hydrographs
arid
Precipitation Data'

-I W > W -I
W
5
. , - .. ... .. .. -- -
! APPENDIX E3 HYDROGRAPHS SHOWING WATER LEVEL FLUCTUATIONS
I I I I I I I I I
I
2 -
3-
4-
5 -
6-
r - 8-
9-
IC-
II-
12 - I -
l4-
15-
I6 - n- la- 19
20 - -
22 *It
1
WATER LEVEL WR- 65- 65
WATER LEVEL WR-23-62
WATER LEVEL WR-64-65
f - - -
1 I
JFMAMJJASON J F M A M J J A S O I O J F M A M J J A S O N JFMAfflJJASON JFMAMJJASON JFIIIAMJ JASON JFMAMJ JASON J F M A H J J A S O N O J F M A H J J A ~ O N O J F M A ~ J J A S O ,
1962 1963 ;964 1965 1966 1967 1968 1969 1970 1971
1130
J 125 w >
ILJ J
213
3 u)
r 1210 0 U LL
2
I- 4 > W
1205A w
2
1557
1555
E50
. ..

5 . 0
7 . G 67 a: W I.-
W x
-1 W fn
3 . c > W -I
a - , W I- CE 3
10.0
APPENDIX 8
1 .
7.0
9 . C
9 . 0
10.0

7 . 0 -
3 . 0
9 . 0 -
10.0
6.0
7.0
8.0
9 . 0 i
10.0
I
17.0 -
19.0 -
I ! I I I I 1 I I I 1 I I I I I I 1 I I 1 I
RtlTLGhU'CI - 1 3 7 2 -
E L L NO. 236
APPENDIX B
1 7 . 0
1 8 . C
20.0
s
21.0
50.0
51 .0
52 .0
53 .0
511.0
I I I I I I I I 1 I I I I 1 I I I 1 1 I I
S.E.K.I.U. A R 2 ~ x 1
WELL N L 262 (AFtL lO 1808)
I I I I I I 1- I 1 I
JAN FEe M f i f : FiPR M 9 Y J U K J'JL RUG 5EP OCl NOV OEC
1980
APPENDIX 8
I
I I I 1 1 I 1 1 I 1 I - FIPR' H4Y JilN JUL QU6 SEP DCT NClV DEC FEE MFrF: JRN
1981
50.0 I
I
- 53.0
- 54 .0
.