pevidenceforthe tth production at s 13tevwiththeatlasdetector
TRANSCRIPT

Evidence for the t̄tH productionat
√s = 13 TeV with the ATLAS detector53rd Rencontres de Moriond – EW 2018
Robert Wolff 1
on behalf of the ATLAS Collaboration
1CPPM, Aix-Marseille Université and CNRS/IN2P3
13th March 2018
Paper accepted by Phys. Rev. D, arXiv: 1712.08891.

Top quark Yukawa coupling at the LHC
. The Higgs boson with SM properties has been discovered at Run 1 of the LHC.
. Higgs boson properties: top quark Yukawa coupling λt =√2mt/v ≈ 1.
→ Two complementary measurements of λt:
..
g
.
g
.
H
.
•
.
t,b
..
H
.
γ
.
γ
.
•
.
t,b,W
1. Indirect measurement: gluon-gluon fusion, H→ γγ decay:. Contributions enter from top quark loops by λ2t .. Run 1 ATLAS+CMS combination measured
κt = λt/λSMt = 0.87± 0.15 ( JHEP 1608(2016) 045).
2. t̄tH production best way for direct measurement:. Tree-level process, cross-section proportional to λ2t .. Run 1 ATLAS+CMS result on signal strength:
µt̄tH = σt̄tH/σSMt̄tH = 2.3+0.7−0.6,
• Obs. (exp.) significance of 4.4σ (2.0σ) ( JHEP 1608(2016) 045).
..
g
.
g
.
H
.
t
.
t̄
.
•
.
λt
. Any deviation from the SM could indicate new physics.
Evidence for the ttH production at 13 TeV with the ATLAS detector (Robert Wolff, 13/3/2018) 2
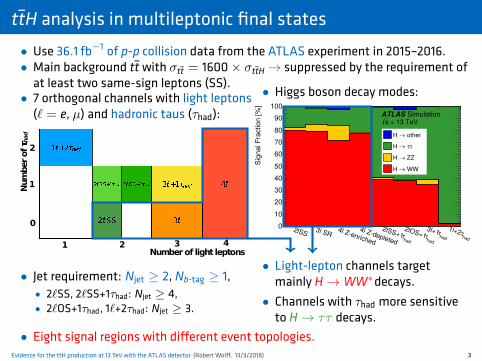
t̄tH analysis in multileptonic final states. Use 36.1 fb−1 of p-p collision data from the ATLAS experiment in 2015–2016.. Main background t̄t with σt̄t = 1600× σt̄tH → suppressed by the requirement ofat least two same-sign leptons (SS).
. 7 orthogonal channels with light leptons(ℓ = e, µ) and hadronic taus (τhad):
..
1 +2 had
43 +1 had
2 SS 3
Number of light leptons
Num
ber of
had
1 2 3 4
0
1
2
. Jet requirement: Njet ≥ 2, Nb-tag ≥ 1,. 2ℓSS, 2ℓSS+1τhad: Njet ≥ 4,. 2ℓOS+1τhad, 1ℓ+2τhad: Njet ≥ 3.
. Higgs boson decay modes:
..2lSS
3l SR4l Z-enriched
4l Z-depleted hadτ
2lSS+1hadτ
2lOS+1 hadτ
3l+1hadτ
1l+2
Sig
na
l F
ractio
n [
%]
0
10
20
30
40
50
60
70
80
90
100
other→H
ττ→H
ZZ→H
WW→H
ATLAS Simulation= 13 TeVs
. Light-lepton channels targetmainly H→ WW∗decays.
. Channels with τhad more sensitiveto H→ ττ decays.
. Eight signal regions with different event topologies.Evidence for the ttH production at 13 TeV with the ATLAS detector (Robert Wolff, 13/3/2018) 3

Backgrounds. Different background composition in SRs:
..
ATLAS
= 13 TeVs
misidq WttZtt Diboson
hadτFake Nonprompt
Other
2ℓSS 3ℓ SR 4ℓ Z−enr. 4ℓ Z−dep.
2ℓSS+1τhad 2ℓOS+1τhad 3ℓ+1τhad 1ℓ+2τhad
3ℓ ̅ W CR 3ℓ ̅ Z CR 3ℓ VV CR 3ℓ ̅ CR
.
ATLAS
= 13 TeVs
misidq WttZtt Diboson
hadτFake Nonprompt
Other
2ℓSS 3ℓ SR 4ℓ Z−enr. 4ℓ Z−dep.
2ℓSS+1τhad 2ℓOS+1τhad 3ℓ+1τhad 1ℓ+2τhad
3ℓ ̅ W CR 3ℓ ̅ Z CR 3ℓ VV CR 3ℓ ̅ CR
1. Prompt lepton backgrounds:. estimated from Monte Carlo (MC),. validated in 3ℓ CRs:
.. Number of jets
2 3 4 5 6 7 8≥
Da
ta /
Pre
d.
0.5
0.75
1
1.25
1.5
Eve
nts
0
5
10
15
20
25
30
35
40
45
50
ATLAS1 = 13 TeV, 36.1 fbs
3ℓ t t̅ W CR
PreFit
Data Htt
Wtt Ztt
Nonprompt Other
Uncertainty
Number of jets
2 3 4 5 6 7 8≥
Da
ta /
Pre
d.
0.5
0.75
1
1.25
1.5
Eve
nts
0
10
20
30
40
50
60
70
ATLAS1 = 13 TeV, 36.1 fbs
3ℓ t t̅ Z CR
PreFit
Data Htt
Wtt Ztt
Diboson Nonprompt
Other Uncertainty
.
t̄tW CR
.
t̄tZ CR
. Number of jets. Number of jets
2. Reducible backgrounds:. Non-prompt light leptons: from b-hadron decays (t̄t) and photon conversions,. Electron charge mis-identification (qmis-id): from 2ℓOS t̄t events,. Fake τhad: from light flavour jets and mis-identified electrons.
→ Reduced with boosted decision trees (BDTs) using lepton isolation and track variables.→ Estimated with different data-driven techniques.. Have robust estimate of background yields and shape prediction.
Evidence for the ttH production at 13 TeV with the ATLAS detector (Robert Wolff, 13/3/2018) 4

Example: Event BDTs in 2ℓSS channel
. In 2ℓSS channel the dominant backgrounds are t̄tV and t̄t (non-prompt ℓ):
..
mis-idq WttZtt Diboson
hadτFake Non-prompt
Other2ℓSS
.
tt̄V
.tt̄
→ Use two independent event BDTs t̄tHvs. t̄tV and vs. t̄t with input variables:. lepton properties,. jet and b-tagged jet multiplicities,. angular distances. and missing transverse momentum.
BDT output
1− 0.8− 0.6− 0.4− 0.2− 0 0.2 0.4 0.6 0.8 1
Data
/ P
red.
0.5
0.75
1
1.25
1.5
Eve
nts
/ b
in
1
10
210
310
410ATLAS
1 = 13 TeV, 36.1 fbs
2ℓSS
PostFit
Data Htt
Wtt Ztt
Diboson Nonprompt
misidq Other
Uncertainty PreFit Bkgd.
→ Data agrees well with prediction.
. In 6 of 7 channels event BDTs are used for best signal-background separation.
Evidence for the ttH production at 13 TeV with the ATLAS detector (Robert Wolff, 13/3/2018) 5

Fit set-up
. Parameter of interest is the t̄tH signal strength µt̄tH = σt̄tH/σSMt̄tH.
. Binned maximum-likelihood fit is performed in 8 SRs + 4 CRs simultaneously:
..2ℓSS
3ℓ SR3ℓ t t̅ W CR
3ℓ t t̅ Z CR
3ℓ VV CR
3ℓ t t̅ CR2ℓSS+1τhad
3ℓ+1τhad
4ℓ Z−enr.
4ℓ Z−dep.
1ℓ+2τhad
2ℓOS+1τhad
Da
ta /
Pre
d.
0.5
0.75
1
1.25
1.5
Eve
nts
/ b
in
1−10
1
10
210
310
410
510
ATLAS1 = 13 TeV, 36.1 fbs
PostFit
Data HttWtt Ztt
Diboson Nonprompt misidq Other
hadτFake Uncertainty
PreFit Bkgd.
.
6bins
.
5bins
.
2bins
.
2bins
.
10bins
.
4 CRs
.
3 low stat.
.
SRs
. Fit BDT shape in 5 SRs andsingle event counts in 3ℓ CRsand SRs with low statistics.→ in total 32 bins.. Systematics model with315 nuisance parameters:→ NPs dropped if size< 1%
to decrease time of the fit,→ NP shapes smoothed
to reduce local fluctuations,
. All systematics have been studied in single channels and in combination.
Evidence for the ttH production at 13 TeV with the ATLAS detector (Robert Wolff, 13/3/2018) 6

Results
. Major systematic uncertainties:
..
Uncertainty Source ∆µtt̄H modeling (cross section) +0.20 −0.09Jet energy scale and resolution +0.18 −0.15Non-prompt light-lepton estimates +0.15 −0.13Jet flavor tagging and τhad identification +0.11 −0.09tt̄W modeling +0.10 −0.09tt̄Z modeling +0.08 −0.07Other background modeling +0.08 −0.07Luminosity +0.08 −0.06tt̄H modeling (acceptance) +0.08 −0.04Fake τhad estimates +0.07 −0.07Other experimental uncertainties +0.05 −0.04Simulation sample size +0.04 −0.04Charge misassignment +0.01 −0.01Total systematic uncertainty +0.39 −0.30
. Observed signal strength µt̄tH:
..=125 GeV
H for m
HttµBestfit
2− 0 2 4 6 8 10 12
combined
2ℓSS
3ℓ
2ℓSS + 1τhad
3ℓ + 1τhad
4ℓ
1ℓ + 2τhad
2ℓOS + 1τhad
0.4−
0.5+1.6 0.3−
0.4+ 0.3−
0.3+ ( , )
0.6−
0.7+1.5 0.4−
0.5+ 0.4−
0.4+ ( , )
0.7−
0.9+1.8 0.5−
0.6+ 0.6−
0.6+ ( , )
1.3−
1.7+3.5 0.5−
0.9+ 1.2−
1.5+ ( , )
1.3−
1.8+1.6 0.2−
0.6+ 1.3−
1.7+ ( , ) 0.9−
1.3+0.5 0.3−
0.2+ 0.8−
1.3+ ( , )
1.5−
1.6+0.6 1.3−
1.1+ 0.8−
1.1+ ( , )
1.9−
2.1+1.7 1.1−
1.4+ 1.5−
1.6+ ( , )
Tot. ( Stat. , Syst. )Tot. Stat.
ATLAS 1=13 TeV, 36.1 fbs
.
t̄tHML
. All results are compatible with each other and with SM expectation of µt̄tH = 1.
. Best-fit signal strength µt̄tH = 1.6+0.5−0.4, obs. (exp.) significance: 4.1σ (2.8σ).
. Cross-section σt̄tH = 790+230−210 fb (expected: 507+35−50 fb).
Evidence for the ttH production at 13 TeV with the ATLAS detector (Robert Wolff, 13/3/2018) 7

Combination with other searches for t̄tH in ATLAS. Search for t̄tH→ multilepton has major impact on combination results:
..
2− 0 2 4 6 8 10
=125 GeVH
for mHtt
µBestfit
H combinedtt
H MLtt
bH btt
γγH tt
H ZZtt
0.6−
+0.60.8 , 0.3−
+0.3 0.5−
+0.6 ( )
0.6−
+0.70.6 , 0.6−
+0.7 0.2−
+0.2 ( )
0.4−
+0.51.6 , 0.3−
+0.3 0.3−
+0.4 ( )
0.3−
+0.31.2 , 0.2−
+0.2 0.2−
+0.3 ( )
( tot. ) ( stat. , syst. )
< 1.9 (68% CL)
total stat.
ATLAS1=13 TeV, 36.1 fbs
. Combined best-fit value: µt̄tH = 1.2± 0.3, significance: 4.2σ (expected: 3.8σ).
→ Evidence for t̄tH production with 13 TeV data!. Paper accepted by Phys. Rev. D, arXiv: 1712.08891.. More details about combination results in talk by D. Zanzi.
Evidence for the ttH production at 13 TeV with the ATLAS detector (Robert Wolff, 13/3/2018) 8

→ 3µ event with 2 b-tagged and 5 non-b-tagged jets (ATLAS-CONF-2016-058)
Evidence for the ttH production at 13 TeV with the ATLAS detector (Robert Wolff, 13/3/2018) 9

Backup
11 Object reconstruction and overlap removal12–13 Event selection in SRs and Non-prompt ℓ and fake τhad CRs14 Non-prompt ℓ BDT15–16 Non-prompt ℓ background estimate in 2ℓSS and 3ℓ17 Non-prompt ℓ and fake τhad composition18 qmis-id background estimate19–20 List of systematics (NPs)21 SR and CR pre- and post-fit yields22 SR post-fit plots23 Event yields as a function of log(S/B)24–25 Major uncertainties and NP ranking26 MC samples
Evidence for the ttH production at 13 TeV with the ATLAS detector (Robert Wolff, 13/3/2018) 10

Backup: Object reconstruction and overlap removal
. Triggers: Lowest unprescaled single- and dilepton trigger chains
. Standard objects:. Jets from anti-kt algorithm withR = 0.4, b-tagging with MV2c10algorithm at 70% efficiency.
. Loose and tight leptons (see table).
. Hadronic decaying taus with mediumtau ID.
(L=loose, L†=loose+isolated, L*=L†+passing X, T=tight, T*=very tight)e µ
L L† L* T T* L L† L*/T/T*Isolation No Yes No YesNon-prompt lepton BDT No Yes No YesIdentification Loose Tight LooseCharge mis-assignment BDT No Yes NoTranverse impact parameter < 5σ < 3σsignificance |d0|/σd0Longitudinal impact < 0.5 mmparameter |z0 sin θ|
. Multivariate algorithms for reduction of reducible backgrounds:. Charge mis-assignment veto: 14× background rejection for 95% signal efficiency,. Non-prompt lepton MVA: identify non-prompt light leptons using lifetime informationassociated with a track jet from track impact parameters.
. Overlap removal:
Keep Remove Cone size (∆ R)electron electron (low pT) 0.1muon electron 0.1electron jet 0.3jet muon min(0.4, 0.04+ 10[GeV]/pT(muon))
electron tau 0.2muon tau 0.2tau jet 0.3
Evidence for the ttH production at 13 TeV with the ATLAS detector (Robert Wolff, 13/3/2018) 11

Backup: Event selection in the signal regionsChannel Selection criteria
Common Njets ≥ 2 and Nb-jets ≥ 12`SS Two very tight light leptons with pT > 20 GeV
Same-charge light leptonsZero medium τhad candidatesNjets ≥ 4 and Nb-jets < 3
3` Three light leptons with pT > 10 GeV; sum of light-lepton charges ±1Two same-charge leptons must be very tight and have pT > 15 GeVThe opposite-charge lepton must be loose, isolated and pass the non-prompt BDTZero medium τhad candidatesm(`+`−) > 12 GeV and |m(`+`−)− 91.2 GeV| > 10 GeV for all SFOC pairs|m(3`)− 91.2 GeV| > 10 GeV
4` Four light leptons; sum of light-lepton charges 0Third and fourth leading leptons must be tightm(`+`−) > 12 GeV and |m(`+`−)− 91.2 GeV| > 10 GeV for all SFOC pairs|m(4`)− 125 GeV| > 5 GeVSplit 2 categories: Z-depleted (0 SFOC pairs) and Z-enriched (2 or 4 SFOC pairs)
1`+2τhad One tight light lepton with pT > 27 GeVTwo medium τhad candidates of opposite charge, at least one being tightNjets ≥ 3
2`SS+1τhad Two very tight light leptons with pT > 15 GeVSame-charge light leptonsOne medium τhad candidate, with charge opposite to that of the light leptonsNjets ≥ 4|m(ee)− 91.2 GeV| > 10 GeV for ee events
2`OS+1τhad Two loose and isolated light leptons with pT > 25, 15 GeVOne medium τhad candidateOpposite-charge light leptonsOne medium τhad candidatem(`+`−) > 12 GeV and |m(`+`−)− 91.2 GeV| > 10 GeV for the SFOC pairNjets ≥ 3
3`+1τhad 3` selection, except:One medium τhad candidate, with charge opposite to the total charge of the light leptonsThe two same-charge light leptons must be tight and have pT > 10 GeVThe opposite-charge light lepton must be loose and isolated
Evidence for the ttH production at 13 TeV with the ATLAS detector (Robert Wolff, 13/3/2018) 12

Backup: Event selection in non-prompt ℓ and fake τhad CRsChannel Region Selection criteria
2`SS 2 ≤ Njets ≤ 3 and Nb-jets ≥ 1(3`) One very tight, one loose light lepton with pT > 20 (15) GeV
Zero τhad candidatesεreal Opposite charge; opposite flavorεfake Same charge; opposite flavor or µµ
4` 1 ≤ Njets ≤ 2Three loose light leptons; sum of light lepton charges ±1Subleading same-charge lepton must be tightVeto on 3` selection
Either One SFOC pair with |m(`+`−)− 91.2 GeV| < 10 GeVEmiss
T < 50 GeV, mT < 50 GeVor No SFOC pair
Subleading jet pT > 30 GeV2`SS+1τhad 2 ≤ Njets ≤ 3 and Nb-jets ≥ 1
One very tight, one loose light lepton with pT > 15 GeVA SFSC pair|m(ee)− 91.2 GeV| > 10 GeVZero or one medium τhad candidate, opposite in charge to the light leptons
1`+2τhad Njets ≥ 3 and Nb-jets ≥ 1One tight light lepton, with pT > 27 GeVTwo τhad candidates of same chargeAt least one τhad candidate has to satisfy tight identification criteria
2`OS+1τhad Two loose and isolated light leptons, with pT > 25, 15 GeVOne loose τhad candidate|m(`+`−)− 91.2 GeV| > 10 GeV and m(`+`−) > 12 GeVNjets ≥ 3 and Nb-jets = 0
Evidence for the ttH production at 13 TeV with the ATLAS detector (Robert Wolff, 13/3/2018) 13

Backup: Non-prompt light lepton BDT
. To further reject non-prompt leptons from b-hadron decays, a cut on lepton BDTdiscriminant is required, achieving rejection factor of 20 with high prompt leptonefficiencies.→ bottom plots.
. Sensitive variables: angular distance between leptons and jet, b-taggingalgorithm output, lepton isolation, number of tracks in jet and ratio betweenlepton pT and jet pT.
. The efficiency for prompt leptons are measured in data using Z-decays events.The corrections to MC (scale factors) are at most 10% at low pT → ratio plots.
Effic
iency
0.6
0.7
0.8
0.9
1
Data
MC
ATLAS1 = 13 TeV, 36.1 fbs
µµ→Z
[GeV]T
pMuon
20 30 40 50 60 70 100
Data
/ M
C
0.9
1
10
Stat. only Stat.⊕Syst.
10 20 30 40 50 60 70 100
Effic
iency
0.6
0.7
0.8
0.9
1
Data
MC
ATLAS1 = 13 TeV, 36.1 fbs
ee→Z
[GeV]T
pElectron
10 20 30 40 50 60 70 100
Data
/ M
C
0.9
1
Stat. only Stat.⊕Syst.
Evidence for the ttH production at 13 TeV with the ATLAS detector (Robert Wolff, 13/3/2018) 14

Backup: Non-prompt light lepton estimate in 2ℓSS & 3ℓ (1). “Matrix-method” predicts non-prompt lepton events in 2ℓSS and 3ℓ from looseregions (by discarding lepton tight ID and isolation requirements). Loose-to-tight probabilities for prompt and non-prompt leptons as input.. Prompt lepton efficiency εreal is measured in prompt lepton control region fromleptonic t̄t decays (2ℓOFOS, [2,3] jets, Nb-tag ≥ 1)
. Non-prompt lepton efficiency εfake vs pT, Nb-tag or min∆R(µ, jet) is measured inlow-Njet non-prompt lepton control region (2ℓSS, [2,3] jets, Nb-tag ≥ 1)
εreal
[GeV]T
p20 30 40 50 100 200
ε
0.5
0.6
0.7
0.8
0.9
1
1.1
±
e±µ,
±
µ±Data - e
µ
e
ATLAS-1 = 13 TeV, 36.1 fbs
εfake (electrons)
[GeV]T
p50 100 150 200
ε
0
0.02
0.04
0.06
0.08
0.1
0.12
0.14 ±e±µData -
2≥ -tagsbN
= 1-tagsbN
ATLAS-1 = 13 TeV, 36.1 fbs
εfake (muons)
[GeV]T
p50 100 150 200
ε
0
0.2
0.4
0.6
0.8
1±µ±µData -
5≤) ,jµ R∆1 < min(
1≤) ,jµ
R∆ min(≤0
ATLAS-1 = 13 TeV, 36.1 fbs
εfake =Ntightdata − Ntightq mis-id (data) − Ntightprompt (MC)
Nloosedata − Nlooseq mis-id (MC) − Nlooseprompt (MC), qmis-id subtraction for e±.
Evidence for the ttH production at 13 TeV with the ATLAS detector (Robert Wolff, 13/3/2018) 15

Backup: Non-prompt light lepton estimate in 2ℓSS & 3ℓ (2)
. Closure test for matrix method whole procedure is performed on t̄t simulatedsamples.→ Non-closure is taken as one source of systematics:
11± 8% (2ℓSS) and 9± 18% (3ℓ).
. The non-prompt lepton estimates has been validated in various control regions(close to SR but orthogonal to SR in Njet requirement).
,jet)1
R(l∆
0 0.5 1 1.5 2 2.5
Da
ta /
Pre
d.
0.5
0.75
1
1.25
1.5
Events
/ b
in
1
10
210
310
ATLAS1 = 13 TeV, 36.1 fbs
2 ≤ Njets ≤ 3VR±µ±µ
PreFit
Data Htt
Nonprompt misidq
Wtt Ztt
Diboson Other
Uncertainty
) [GeV]1
(lT
p
20 30 40 50 60 70 80 90 100
Da
ta /
Pre
d.
0.5
0.75
1
1.25
1.5
Events
/ 1
0 G
eV
1
10
210
310
ATLAS1 = 13 TeV, 36.1 fbs
2 ≤ Njets ≤ 3VR±e±µ, ±µ±e
PreFit
Data Htt
Nonprompt misidq
Wtt Ztt
Diboson Other
Uncertainty
Evidence for the ttH production at 13 TeV with the ATLAS detector (Robert Wolff, 13/3/2018) 16

Backup: Non-prompt ℓ and fake τhad composition
Non-prompt light lepton composition
µ2lSSe µµ2lSS 3le µ3l τ2lSSe+1 τ+1µ2lSS
Fra
ctio
n of
fake
and
non
-pro
mpt
lept
ons
[%]
0
10
20
30
40
50
60
70
80
90
100
otherconversions
ψJ/light quark+gluonc-quarkb-quark
ATLAS Simulation = 13 TeVs
Fake τhad composition
CRτ2lOS+1 SRτ
2lOS+1 SRτ3l+1 SRτ
2lSS+1 CRτ1l+2 SRτ
1l+2 [%
]ha
dτ
Fra
ctio
n of
fake
0
10
20
30
40
50
60
70
80
90
100
otherelectrongluonlight quarkc-quarkb-quark
ATLAS Simulation = 13 TeVs
Evidence for the ttH production at 13 TeV with the ATLAS detector (Robert Wolff, 13/3/2018) 17

Backup: Charge mis-assignment background estimate. Electron charge flips in t̄t and Z+jets processes pollute 2ℓSS events.. Electron charge flip rates vs pT and |η| are measured from OS/SS electron pairsfrom Z decays→ electron charge flip background is extracted from OS data afterapplying rates.
tst__2
Entries 0Mean 0Std Dev 0
0 0.5 1 1.5 2 2.5
|η|
4−10
3−10
2−10
mis
id
∈
tst__2
Entries 0Mean 0Std Dev 0
[130,1000] GeV∈ T
p
[90,130] GeV∈ T
p
[60,90] GeV∈ T
p
[15,60] GeV∈ T
p
ATLAS
1 = 13 TeV, 36.1 fbs
test1
. The total systematic uncertainty of this background estimates is about 30%,with the dominant contribution at low pT frommethod non-closure and at highpT from limited statistics of Z→ ee events.
Evidence for the ttH production at 13 TeV with the ATLAS detector (Robert Wolff, 13/3/2018) 18

Backup: Systematics – Nuisance parameters (1)
Systematic uncertainty Type Components
Luminosity N 1Pileup reweighting SN 1Physics Objects
Electron SN 6Muon SN 15τhad SN 10Jet energy scale and resolution SN 28Jet vertex fraction SN 1Jet flavor tagging SN 126Emiss
T SN 3Total (Experimental) – 191
Data-driven non-prompt/fake leptons and charge misassignmentControl region statistics SN 38Light-lepton efficiencies SN 22Non-prompt light-lepton estimates: non-closure N 5γ-conversion fraction N 5Fake τhad estimates N/SN 12Electron charge misassignment SN 1
Total (Data-driven reducible background) – 83
tt̄H modelingCross section N 2Renormalization and factorization scales S 3Parton shower and hadronization model SN 1Higgs boson branching fraction N 4Shower tune SN 1
tt̄W modelingCross section N 2Renormalization and factorization scales S 3Matrix-element MC event generator SN 1Shower tune SN 1
tt̄Z modelingCross section N 2Renormalization and factorization scales S 3Matrix-element MC event generator SN 1Shower tune SN 1
Other background modelingCross section N 15Shower tune SN 1
Total (Signal and background modeling) – 41
Total (Overall) – 315
Evidence for the ttH production at 13 TeV with the ATLAS detector (Robert Wolff, 13/3/2018) 19

Backup: Systematics – Nuisance parameters (2)
Systematic uncertainty Type Components
Luminosity N 1Pileup reweighting SN 1Physics Objects
Electron SN 6Muon SN 15τhad SN 10Jet energy scale and resolution SN 28Jet vertex fraction SN 1Jet flavor tagging SN 126Emiss
T SN 3Total (Experimental) – 191
Data-driven non-prompt/fake leptons and charge misassignmentControl region statistics SN 38Light-lepton efficiencies SN 22Non-prompt light-lepton estimates: non-closure N 5γ-conversion fraction N 5Fake τhad estimates N/SN 12Electron charge misassignment SN 1
Total (Data-driven reducible background) – 83
tt̄H modelingCross section N 2Renormalization and factorization scales S 3Parton shower and hadronization model SN 1Higgs boson branching fraction N 4Shower tune SN 1
tt̄W modelingCross section N 2Renormalization and factorization scales S 3Matrix-element MC event generator SN 1Shower tune SN 1
tt̄Z modelingCross section N 2Renormalization and factorization scales S 3Matrix-element MC event generator SN 1Shower tune SN 1
Other background modelingCross section N 15Shower tune SN 1
Total (Signal and background modeling) – 41
Total (Overall) – 315
Evidence for the ttH production at 13 TeV with the ATLAS detector (Robert Wolff, 13/3/2018) 20

Backup: Signal and background yields, pre- and post-fitTable 10: Background, signal and observed yields in the twelve analysis categories in 36.1 fb�1 of data atp
s = 13 TeV. Uncertainties in the background estimatesdue to systematic e�ects and to limited simulation sample size are shown. “Non-prompt”, “Fake ⌧had” and “q mis-id” refer to the data-driven backgroundestimates described in Section 6. Rare processes (tZ , tW , tW Z , tt̄WW , triboson production, tt̄t, tt̄tt̄, tH , rare top decay) are labeled as “Other”. In the toppart, the pre-fit values are quoted, i.e. using the initial values of background systematic uncertainty nuisance parameters and the signal expected from the SM.In the bottom part, the corresponding post-fit values are quoted. In the post-fit case, the prediction and uncertainties for tt̄H reflect the best-fit production rateof 1.6 +0.5
�0.4 times the Standard Model prediction and the uncertainty in the total background estimate is smaller than for the pre-fit values due to anticorrelationsbetween the nuisance parameters obtained in the fit.
Category Non-prompt Fake ⌧had q mis-id tt̄W tt̄Z Diboson Other Total Bkgd. tt̄H ObservedPre-fit yields
2`SS 233 ± 39 – 33 ± 11 123 ± 18 41.4 ± 5.6 25 ± 15 28.4 ± 5.9 484 ± 38 42.6 ± 4.2 5143` SR 14.5 ± 4.3 – – 5.5 ± 1.2 12.0 ± 1.8 1.2 ± 1.2 5.8 ± 1.4 39.1 ± 5.2 11.2 ± 1.6 613` tt̄W CR 13.3 ± 4.3 – – 19.9 ± 3.1 8.7 ± 1.1 < 0.2 4.53 ± 0.92 46.5 ± 5.4 4.18 ± 0.46 563` tt̄ Z CR 3.9 ± 2.5 – – 2.71 ± 0.56 66 ± 11 8.4 ± 5.3 12.9 ± 4.2 93 ± 13 3.17 ± 0.41 1073` VV CR 27.7 ± 8.7 – – 4.9 ± 1.0 21.3 ± 3.4 51 ± 30 17.9 ± 6.1 123 ± 32 1.67 ± 0.25 1093` tt̄ CR 70 ± 17 – – 10.5 ± 1.5 7.9 ± 1.1 7.2 ± 4.8 7.3 ± 1.9 103 ± 17 4.00 ± 0.49 854` Z-enr. 0.11 ± 0.07 – – < 0.01 1.52 ± 0.23 0.43 ± 0.23 0.21 ± 0.09 2.26 ± 0.34 1.06 ± 0.14 24` Z-dep. 0.01 ± 0.01 – – < 0.01 0.04 ± 0.02 < 0.01 0.06 ± 0.03 0.11 ± 0.03 0.20 ± 0.03 01`+2⌧had – 65 ± 21 – 0.09 ± 0.09 3.3 ± 1.0 1.3 ± 1.0 0.98 ± 0.35 71 ± 21 4.3 ± 1.0 672`SS+1⌧had 2.4 ± 1.4 1.80 ± 0.30 0.05 ± 0.02 0.88 ± 0.24 1.83 ± 0.37 0.12 ± 0.18 1.06 ± 0.24 8.2 ± 1.6 3.09 ± 0.46 182`OS+1⌧had – 756 ± 80 – 6.5 ± 1.3 11.4 ± 1.9 2.0 ± 1.3 5.8 ± 1.5 782 ± 81 14.2 ± 2.0 8073`+1⌧had – 0.75 ± 0.15 – 0.04 ± 0.04 1.38 ± 0.24 0.002 ± 0.002 0.38 ± 0.10 2.55 ± 0.32 1.51 ± 0.23 5
Post-fit yields2`SS 211 ± 26 – 28.3 ± 9.4 127 ± 18 42.9 ± 5.4 20.0 ± 6.3 28.5 ± 5.7 459 ± 24 67 ± 18 5143` SR 13.2 ± 3.1 – – 5.8 ± 1.2 12.9 ± 1.6 1.2 ± 1.1 5.9 ± 1.3 39.0 ± 4.0 17.7 ± 4.9 613` tt̄W CR 11.7 ± 3.0 – – 20.4 ± 3.0 8.9 ± 1.0 < 0.2 4.54 ± 0.88 45.6 ± 4.0 6.6 ± 1.9 563` tt̄ Z CR 3.5 ± 2.1 – – 2.82 ± 0.56 70.4 ± 8.6 7.1 ± 3.0 13.6 ± 4.2 97.4 ± 8.6 5.1 ± 1.4 1073` VV CR 22.4 ± 5.7 – – 5.05 ± 0.94 22.0 ± 3.0 39 ± 11 18.1 ± 5.9 106.8 ± 9.4 2.61 ± 0.82 1093` tt̄ CR 56.0 ± 8.1 – – 10.7 ± 1.4 8.1 ± 1.0 5.9 ± 2.7 7.1 ± 1.8 87.8 ± 7.9 6.3 ± 1.8 854` Z-enr. 0.10 ± 0.07 – – < 0.01 1.60 ± 0.22 0.37 ± 0.15 0.22 ± 0.10 2.29 ± 0.28 1.65 ± 0.47 24` Z-dep. 0.01 ± 0.01 – – < 0.01 0.04 ± 0.02 < 0.01 0.07 ± 0.03 0.11 ± 0.03 0.32 ± 0.09 01`+2⌧had – 58.0 ± 6.8 – 0.11 ± 0.11 3.31 ± 0.90 0.98 ± 0.75 0.98 ± 0.33 63.4 ± 6.7 6.5 ± 2.0 672`SS+1⌧had 1.86 ± 0.91 1.86 ± 0.27 0.05 ± 0.02 0.97 ± 0.26 1.96 ± 0.37 0.15 ± 0.20 1.09 ± 0.24 7.9 ± 1.2 5.1 ± 1.3 182`OS+1⌧had – 756 ± 28 – 6.6 ± 1.3 11.5 ± 1.7 1.64 ± 0.92 6.1 ± 1.5 782 ± 27 21.7 ± 5.9 8073`+1⌧had – 0.75 ± 0.14 – 0.04 ± 0.04 1.42 ± 0.22 0.002 ± 0.002 0.40 ± 0.10 2.61 ± 0.30 2.41 ± 0.68 5
28
Evidence for the ttH production at 13 TeV with the ATLAS detector (Robert Wolff, 13/3/2018) 21

Backup: Signal region BDT distributions
2ℓSS
BDT output
1− 0.8− 0.6− 0.4− 0.2− 0 0.2 0.4 0.6 0.8 1
Data
/ P
red.
0.5
0.75
1
1.25
1.5
Eve
nts
/ b
in
1
10
210
310
410ATLAS
1 = 13 TeV, 36.1 fbs
2ℓSS
PostFit
Data Htt
Wtt Ztt
Diboson Nonprompt
misidq Other
Uncertainty PreFit Bkgd.
1ℓ+2τhad
BDT output
1− 0.8− 0.6− 0.4− 0.2− 0 0.2 0.4 0.6 0.8 1
Data
/ P
red.
0.5
0.75
1
1.25
1.5
Eve
nts
/ b
in
1
10
210
310
ATLAS1 = 13 TeV, 36.1 fbs
1ℓ+2τhadPostFit
Data Htt
Wtt Ztt
Diboson Other
hadτFake Uncertainty
PreFit Bkgd.
3ℓ
BDT output
0 0.1 0.2 0.3 0.4 0.5 0.6 0.7 0.8 0.9 1
Data
/ P
red.
0.5
0.75
1
1.25
1.5
Eve
nts
/ b
in
0
5
10
15
20
25
30
35ATLAS
1 = 13 TeV, 36.1 fbs
3ℓ SR
PostFit
Data Htt
Wtt Ztt
Diboson Nonprompt
Other Uncertainty
PreFit Bkgd.
2ℓSS+1τhad
BDT output
1− 0.8− 0.6− 0.4− 0.2− 0 0.2 0.4 0.6 0.8 1
Data
/ P
red.
0
1
2
3
4
Eve
nts
/ b
in
0
5
10
15
20
25
30
35
ATLAS1 = 13 TeV, 36.1 fbs
2ℓSS+1τhadPostFit
Data Htt
Wtt Ztt
Diboson misidq
Other Nonprompt
hadτFake Uncertainty
PreFit Bkgd.
4ℓ Z-depleted
invisible
Data
/ P
red.
0
2
4
6
8
Eve
nts
0
0.5
1
1.5
2
2.5
3
ATLAS1 = 13 TeV, 36.1 fbs
4ℓ Z−depleted
PostFit
Data Htt
Ztt Nonprompt
Other UncertaintyPreFit Bkgd.
2ℓOS+1τhad
BDT output
1− 0.8− 0.6− 0.4− 0.2− 0 0.2 0.4 0.6 0.8 1
Data
/ P
red.
0.5
0.75
1
1.25
1.5
Eve
nts
/ b
in
1
10
210
310
410
ATLAS1 = 13 TeV, 36.1 fbs
2ℓOS+1τhadPostFit
Data Htt
Wtt Ztt
Diboson Other
hadτFake Uncertainty
PreFit Bkgd.
4ℓ Z-enriched
invisible
Data
/ P
red.
0
0.5
1
1.5
2
Eve
nts
0
1
2
3
4
5
6
7
8ATLAS
1 = 13 TeV, 36.1 fbs
4ℓ Z−enriched
PostFit
Data Htt
Ztt Diboson
Nonprompt Other
Uncertainty PreFit Bkgd.
3ℓ+1τhad
invisible
Data
/ P
red.
0.5
0.75
1
1.25
1.5
Eve
nts
0
2
4
6
8
10
12
14 ATLAS1 = 13 TeV, 36.1 fbs
3ℓ+1τhadPostFit
Data Htt
Ztt Other
Nonprompthad
τFake
Uncertainty PreFit Bkgd.
Evidence for the ttH production at 13 TeV with the ATLAS detector (Robert Wolff, 13/3/2018) 22

Backup: Event yields as a function of log(S/B)E
ve
nts
/ b
in
10
210
310
Data
=1.6)fit
µH (tt
=1)µH (ttBackground
Bkgd. Unc.
=0)µBkgd. (
PreFit Bkgd.
ATLAS
1 = 13 TeV, 36.1 fbs
PostFit
(S/B)10
log
2.5− 2− 1.5− 1− 0.5− 0
Bkg
d.
Un
c.
Da
ta
Bkg
d.
0
5
10
15
20=1.6)
fitµH (tt
=1)µH (tt
=0)µBkgd. (
. All SR bins combined intobins of log(S/B) withexpected signal S and fittedbackground B.
Evidence for the ttH production at 13 TeV with the ATLAS detector (Robert Wolff, 13/3/2018) 23

Backup: Major uncertainties and NP ranking
..
Uncertainty Source ∆µtt̄H modeling (cross section) +0.20 −0.09Jet energy scale and resolution +0.18 −0.15Non-prompt light-lepton estimates +0.15 −0.13Jet flavor tagging and τhad identification +0.11 −0.09tt̄W modeling +0.10 −0.09tt̄Z modeling +0.08 −0.07Other background modeling +0.08 −0.07Luminosity +0.08 −0.06tt̄H modeling (acceptance) +0.08 −0.04Fake τhad estimates +0.07 −0.07Other experimental uncertainties +0.05 −0.04Simulation sample size +0.04 −0.04Charge misassignment +0.01 −0.01Total systematic uncertainty +0.39 −0.30
.. θ∆)/0
θθ(
2− 1.5− 1− 0.5− 0 0.5 1 1.5 2
Non-prompt stat. in 4th bin of 3ℓ SR
ttW modeling (generator)
3ℓ Non-prompt closure
ttℓℓ cross section
Flavor tagging c-jet/τhad
ttH modeling (shower tune)
ttH cross section (PDF)
τhad identification
ttZ cross section (scale variations)
ttW cross section (scale variations)
Jet energy scale variation 1
Jet energy scale (flavor comp. 2ℓSS)
Luminosity
Jet energy scale (pileup subtraction)
ttH cross section (scale variations)
µ∆
0.15− 0.1− 0.05− 0 0.05 0.1 0.15
:µPrefit impact on θ∆+θ=θ θ∆θ=θ
:µPostfit impact on θ∆+θ=θ θ∆θ=θ
Nuis. Param. Pull
ATLAS
1 = 13 TeV, 36.1 fbs
. Systematic uncertainties with largest impact on errors on µt̄tH are. t̄tH cross section uncertainty→ theory,. Jet energy scale and resolution,. Non-prompt light lepton estimates→ large contribution of CR statistics.
. No nuisance parameters pulls and constraints apart from3ℓ Non-prompt estimate closure uncertainty→ deficit in 3ℓ t̄t CR.
. All uncertainties well controlled.
Evidence for the ttH production at 13 TeV with the ATLAS detector (Robert Wolff, 13/3/2018) 24

Backup: t̄tH combination with other channelsChannel Best-fit µ Significance
Observed Expected Observed Expected
Multilepton 1.6 +0.5−0.4 1.0 +0.4
−0.4 4.1σ 2.8σ
H → bb̄ 0.8 +0.6−0.6 1.0 +0.6
−0.6 1.4σ 1.6σ
H → γγ 0.6 +0.7−0.6 1.0 +0.8
−0.6 0.9σ 1.7σ
H → 4` < 1.9 1.0 +3.2−1.0 — 0.6σ
Combined 1.2 +0.3−0.3 1.0 +0.3
−0.3 4.2σ 3.8σ
..
Uncertainty Source ∆µtt̄ modeling in H → bb̄ analysis +0.15 −0.14tt̄H modeling (cross section) +0.13 −0.06Non-prompt light-lepton and fake τhad estimates +0.09 −0.09Simulation statistics +0.08 −0.08Jet energy scale and resolution +0.08 −0.07tt̄V modeling +0.07 −0.07tt̄H modeling (acceptance) +0.07 −0.04Other non-Higgs boson backgrounds +0.06 −0.05Other experimental uncertainties +0.05 −0.05Luminosity +0.05 −0.04Jet flavor tagging +0.03 −0.02Modeling of other Higgs boson production modes +0.01 −0.01Total systematic uncertainty +0.27 −0.23
Statistical uncertainty +0.19 −0.19
Total uncertainty +0.34 −0.30
Evidence for the ttH production at 13 TeV with the ATLAS detector (Robert Wolff, 13/3/2018) 25

Backup: Monte Carlo samples
Process Event generator ME order Parton Shower PDF Tunett̄H MG5 aMC NLO Pythia 8 NNPDF 3.0 NLO [71] A14
(MG5 aMC) (NLO) (Herwig++) (CT10 [72]) (UE-EE-5)tHqb MG5 aMC LO Pythia 8 CT10 A14tHW MG5 aMC NLO Herwig++ CT10 UE-EE-5tt̄W MG5 aMC NLO Pythia 8 NNPDF 3.0 NLO A14
(Sherpa 2.1.1) (LO multileg) (Sherpa) (NNPDF 3.0 NLO) (Sherpa default)tt̄(Z/γ∗ → ll) MG5 aMC NLO Pythia 8 NNPDF 3.0 NLO A14
(Sherpa 2.1.1) (LO multileg) (Sherpa) (NNPDF 3.0 NLO) (Sherpa default)tZ MG5 aMC LO Pythia 6 CTEQ6L1 Perugia2012tWZ MG5 aMC NLO Pythia 8 NNPDF 2.3 LO A14tt̄t, tt̄tt̄ MG5 aMC LO Pythia 8 NNPDF 2.3 LO A14tt̄W+W− MG5 aMC LO Pythia 8 NNPDF 2.3 LO A14tt̄ Powheg-BOX v2 [73] NLO Pythia 8 NNPDF 3.0 NLO A14tt̄γ MG5 aMC LO Pythia 8 NNPDF 2.3 LO A14s-, t-channel, Powheg-BOX v1 [74,75,76] NLO Pythia 6 CT10 Perugia2012Wt single topV V (→ llXX), Sherpa 2.1.1 MEPS NLO Sherpa CT10 Sherpa defaultqqV V , V V VZ → l+l− Sherpa 2.2.1 MEPS NLO Sherpa NNPDF 3.0 NLO Sherpa default
Evidence for the ttH production at 13 TeV with the ATLAS detector (Robert Wolff, 13/3/2018) 26