rwa-0054 from silos to seamlessness: building a joint comprehensive hiv prevention and care services...
TRANSCRIPT

RWA-0054From Silos to Seamlessness: Building a Joint Comprehensive HIV Prevention
and Care Services Plan
Ryan White 2012 Grantee Meeting: Navigating a New Era in Care
Marriott Wardman Park HotelWashington, D.C.
November 28, 2012
Houston Area HIV Services Ryan White Planning Council

Learning Objectives
• Describe the process used to develop a joint comprehensive HIV prevention and care services plan including final content and participation levels.
• List effective strategies for engaging and retaining PLWHA, consumers, Planning Body members, and other community stakeholders in a joint planning process.
• Describe joint HIV prevention and care benchmarks for use in measuring systems improvements and monitoring progress in plan implementation, including alignment with the National HIV/AIDS Strategy and other initiatives.
2

Workshop Outline
1. Introduction to The Houston Area Plan: Rationale, Process, Participation, and Product
2. Best Practices in Multi-Disciplinary Partner Engagement: Results of an Engagement Survey
3. Implementation through Integrated Measurement, Alignment, and Monitoring
4. A Council Member’s Perspective: Past, Present, and Future5. Dialogue on “Lessons Learned” and Recommendations
3

Introduction to The Houston Area Plan: Rationale, Process, Participation, and Product
Houston Area HIV Services Ryan White Planning Council
Anna Henry, PlannerPart B and State Services
Houston EMA/HSDA and East Texas HASAThe Houston Regional HIV/AIDS Resource Group

Rationale for a Joint Plan• Common expectations from federal agencies for jurisdictional HIV plans• History of developing other core HIV planning deliverables as joint
efforts• The National HIV/AIDS Strategy’s “call to action” for increased
collaboration• Despite separate funding and administration, HIV prevention and care
services are part of a single Continuum of Care• Providers are reaching the same clients, high risk populations, and
underserved communities• An opportunity to engage new partners, strengthen existing
relationships, and gain increased ownership for addressing the local epidemic
• More and diverse sets of expertise leads to a more comprehensive and representative plan for the community
• Structure defines outcomes. To attain a seamless Continuum of Care, the process for designing an ideal system of care must also be seamless.
5

Planning Structure
6
Structure Used to Develop the Houston Area Comprehensive HIV Prevention and Care Services Plan for 2012 - 2014
Guided the overall process
Adopted vision, mission, goals, and objectives
Identified overarching concerns and solutions
Reviewed and approved final document
Leadership Team
Evaluation Workgroup
Prevention & Early
Identification
Workgroup
Filling Gaps & Reaching the Out-Of-
Care Workgroup
Special Populations Workgroup
Coordination of Effort Workgroup
Evaluated 2009 plan
Reviewed goals and objectives
Designed benchmarks
Designed evaluation plan for 2012
Ensured alignment with other initiatives
Collected and reviewed available data on each workgroup topic
Identified trends in needs and “best practice” related to each topic
Completed planning tools and logic models
Developed a three-year strategy to address each topic. Strategies included goals, solutions, activities, and benchmarks specific to the workgroup focus.

Core Partners• Ryan White Planning Council and Community Planning Group (CPG)• Directly-funded grantees, incl. CDC/HIV prevention, HRSA/Ryan White
HIV/AIDS Program (Parts A, C, D), and Part B and State Services provider• Other federally-funded HIV programs (e.g., HOPWA, CDC DASH)• Funded agencies in HIV prevention and care from the urban EMA and the
rural Health Service Designation Area (HSDA)• Individual or agency representation of HRSA-defined Special Populations
(e.g., adolescents, IDU, homeless, and transgender).• Entities and sectors indicated as priorities for enhanced coordination of
effort (e.g., private providers, substance abuse, Medicaid, and FQHCs and CHCs, etc.).
• Experts in evaluation, measurement, benchmarking, and baseline design• Individuals infected with, at risk for, or affected by HIV, including
consumers of HIV prevention and care services
7

Public Comment Process• Key Informant Interviews. Representatives of 13 Houston Area agencies,
including large facility-based ASOs, agencies serving Special Populations, and agencies indicated as priorities for enhanced coordination of effort.
• Group Presentations. 9 community group and coalition meetings. Attendance ranged in size from <5 to 40.
• Surveys. 84 individuals completed an electronic survey following a presentation or self-study.
• Focus Groups. One client focus group and one provider focus group were held with individuals representing Special Populations. Interviews with clients and with their providers were also conducted.
• Joint Concurrence. Public meetings were held and concurrence was sought/received from both Houston Area Planning Bodies.
8

Process Outcomes• Participation Levels– The Leadership Team and Evaluation Workgroup convened at least monthly for
seven months; topic-specific Workgroups met monthly for five months. In total, 36 planning meetings were held.
– 71 individuals and 56 agencies participated in meetings. Of these, 23% were PLWHA. In addition, 62% of the leadership for the process was PLWHA.
– Including the Public Comment Process, 110 individuals and 61 agencies contributed to the process.
• Perceptions of the Process– 92% of survey respondents agreed that the process allowed for participation by
HIV+ individuals; and 90% agreed the process was collaborative and reflected a joint effort
– 87% agreed that the vision of the plan reflects the Houston Area’s values for HIV prevention and care
– 90% of survey respondents agreed that accomplishing the goals of the plan will improve HIV services in the Houston Area
9

Core Plan Components• Vision statement of an ideal system of HIV prevention and care for the
Houston Area• Summary of overarching community concerns or trends in the epidemic,
field, and/or community• Summary of overarching solutions to address community concerns based
on local data, published literature , and subject matter experts• System-wide goals and objectives• A joint list of HIV prevention and care Priority Populations• Models of the local Continuum of Care and local Engagement Continuum• Four topic-specific Strategies that include three-year goals, solutions,
activities, timelines, responsible parties, and benchmarks• An evaluation and monitoring plan• Crosswalks to other local, regional, state, and national initiatives and plans• Sector-specific recommendations for how to use the plan• Local HIV Leader Profiles
10

11
“I’ve lived to see the turn of a millennium, an openly gay
Mayor of Houston, an African American President. I really was not certain I would see
these things in my lifetime…[now] it falls on us, the
children, the current survivors of this epidemic, to pick up the torch, not let the flag hit
the ground.”

12
The Leadership TeamHouston Area Comprehensive HIV Prevention and Care Services Plan for 2012 Through 2014
Joint Meeting of the Leadership Team and Comprehensive HIV Planning Committee March 26, 2012, Houston TX
Best Practices in Multi-Disciplinary Partner Engagement: Results of an Engagement Survey
Houston Area HIV Services Ryan White Planning Council
Camden J. Hallmark, MPHData Analyst
Houston Department of Health and Human ServicesBureau of HIV/STD and Viral Hepatitis Prevention
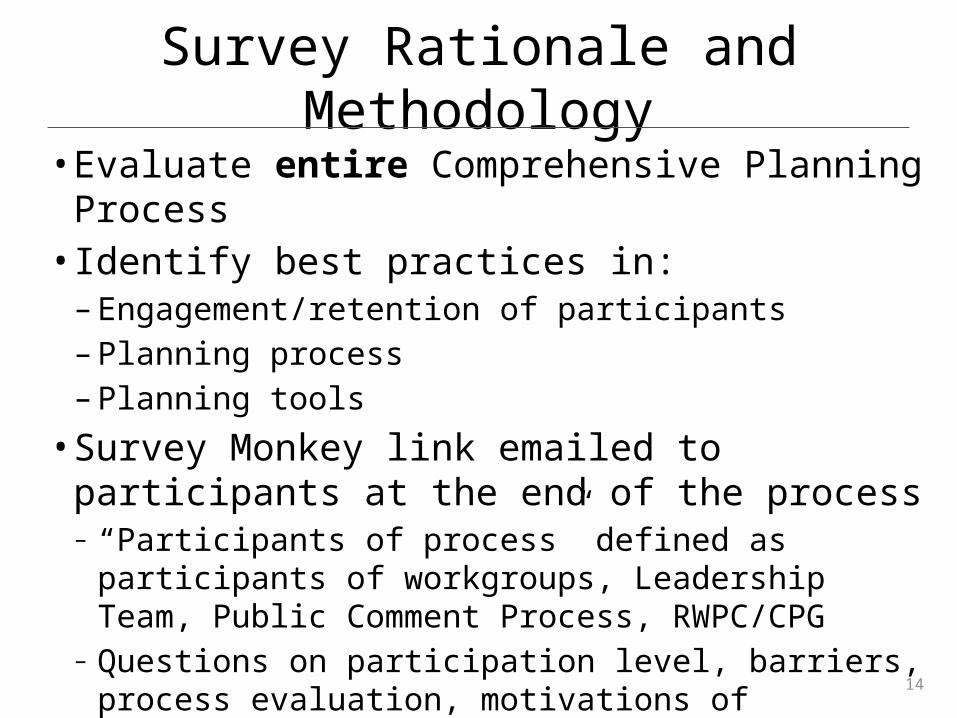
Survey Rationale and Methodology
• Evaluate entire Comprehensive Planning Process• Identify best practices in: – Engagement/retention of participants– Planning process– Planning tools
• Survey Monkey link emailed to participants at the end of the process– “Participants of process” defined as participants of workgroups,
Leadership Team, Public Comment Process, RWPC/CPG – Questions on participation level, barriers, process evaluation,
motivations of participation, etc.
14

Participation• 53 respondents: 39% HIV Prevention, 35% HIV Care – First time planning= 38%
• Participation in the Process– Served on a Workgroup: 64%– Served on the Leadership Team: 40%– Served on either the RWPC or CPG that concurred with plan: 26%– Contributed data or content not as part of Leadership Team or Workgroup: 13%– Participated in Public Comment process: 9%– Other: 4%
• Participation in the Process- Person-level– Workgroup only: 23%– Workgroup + Leadership Team: 19%– RWPC/CPG only: 11%– Workgroup + Leadership Team + RWPC/CPG: 9%– Leadership Team only: 8%– Public comment only: 6%– Contributed data/content only: 4%
• High level of participation in multiple areas (45%)
15
6%
51%26%
8%
9%
Meeting Attendance
None
1 to 5
6 to 10
11 to 15
>15

Reported Barriers to Participation
• Few logistical barriers reported– Multiple times/days to maximize participation– Location same as RWPC meetings, not far from HDHHS Central Office/CPG meeting place– Few assignments outside of meeting times
• Work conflicts most frequent barrier (38%)
16
Day of m
eetings
Time o
f mee
tings
Locati
on of mee
tings
Frequen
cy of m
eetings
Length
of mee
tings
Expect
ations o
f mee
tings
No difficu
lties0
5
10
15
20
25
30
35
Work
conflict
s
Personal c
onflicts
Transporta
tion difficu
lty
Childca
re difficu
lty
Lack
of communica
tion from organize
rs
No barriers
encountered
Other0
5
10
15
20
25
30
35
No difficulties= 64%No barriers= 58%

Agreement 7-point scale (1= Strongly Disagree, 7= Strongly Agree)
Kruskal-Wallis Test• 3 levels: HIV Prevention, HIV Care, Neither
No significant differences
Process Evaluation
17
HIV Prev HIV Care Both Neither OverallProcess was collaborative 6.0 7.0 7.0 7.0Process allowed for participation by HIV+ 7.0 7.0 7.0 7.0 7.0Reflects joint effort of HIV prevention and care 7.0 6.0 7.0 7.0Understand how Plan will be used 7.0 7.0 6.0 7.0Vision of Plan reflects Houston's values for HIV prevention and care 7.0 7.0 7.0 7.0Plan addresses major issues facing Houston in regards to HIV 7.0 7.0 6.0 7.0Accomplishing goals will improve HIV services in Houston 7.0 7.0 7.0 7.0Plan will be helpful to me in my role in HIV 7.0 6.0 7.0 7.0
MODE
HIV Prevention n=18HIV Care n=16Neither n=14Both n=2No Response n=3
χ2 (H statistic) df p-valueItem 1 0.45 2 0.80Item 2 1.00 2 0.61Item 3 0.41 2 0.81Item 4 1.14 2 0.56Item 5 0.21 2 0.90Item 6 0.53 2 0.77Item 7 0.22 2 0.89Item 8 0.60 2 0.74

Agreement 5-point scale (1= Strongly Disagree, 5= Strongly Agree)
Kruskal-Wallis Test• 3 levels: HIV Prevention, HIV Care, Neither
No significant differences
Process Evaluation
18
HIV Prev HIV Care Both Neither OverallClear about role in process 5.0 5.0 4.0 5.0Workgroup/Team matched knowledge, skills, experience 5.0 5.0 4.0 5.0Understanding of role improved over time 5.0 3.0 5.0 4.0 5.0Understanding of process improved over time 5.0 4.0 5.0 5.0 5.0Composition of Workgroup/Team conducive to success 5.0 4.0 5.0 5.0Support from staff conducive to success 5.0 5.0 5.0 5.0 5.0Would have picked same role 5.0 5.0 5.0 5.0Would recommend use similar Workgroup/Team structure again 5.0 5.0 5.0 5.0 5.0
MODE
HIV Prevention n=18HIV Care n=16Neither n=14Both n=2No Response n=3
χ2 (H statistic) df p-valueItem 1 2.21 2 0.33Item 2 2.02 2 0.36Item 3 3.91 2 0.14Item 4 5.76 2 0.06Item 5 4.16 2 0.12Item 6 3.18 2 0.20Item 7 1.11 2 0.57Item 8 5.56 2 0.06

Process Evaluation- Qualitative• What did you like BEST about the process?
– “The process encouraged lots of individuals to participate.”– “The level of client involvement within the process.”– “Synergy between Prevention and Care”– “My comments were taken seriously, and I felt comfortable participating.”– “It was very organized and a fast paced process that yielded results while honoring input.”– “Collaboration among HIV care and prevention staffers”, “Collaboration among different
agencies and providers”– Collaboration (x 6), efficiency (x 5), inclusiveness/broad representation (x 5),
thorough (x 2), teamwork (x 2)
• What did you like LEAST about the process?– “Having never served on this type of committee, I felt I could have used a mentor.”– “It was overly bureaucratic at times.”– “I thought we could of got (sic) more feedback from the general public and organizations
that aren’t key players in the HIV world in Houston.”– “Participation dwindled”, “people in the community stopped coming”– Scheduling conflicts (x 5), length of meetings (x 2), none/NA (x 11)
19
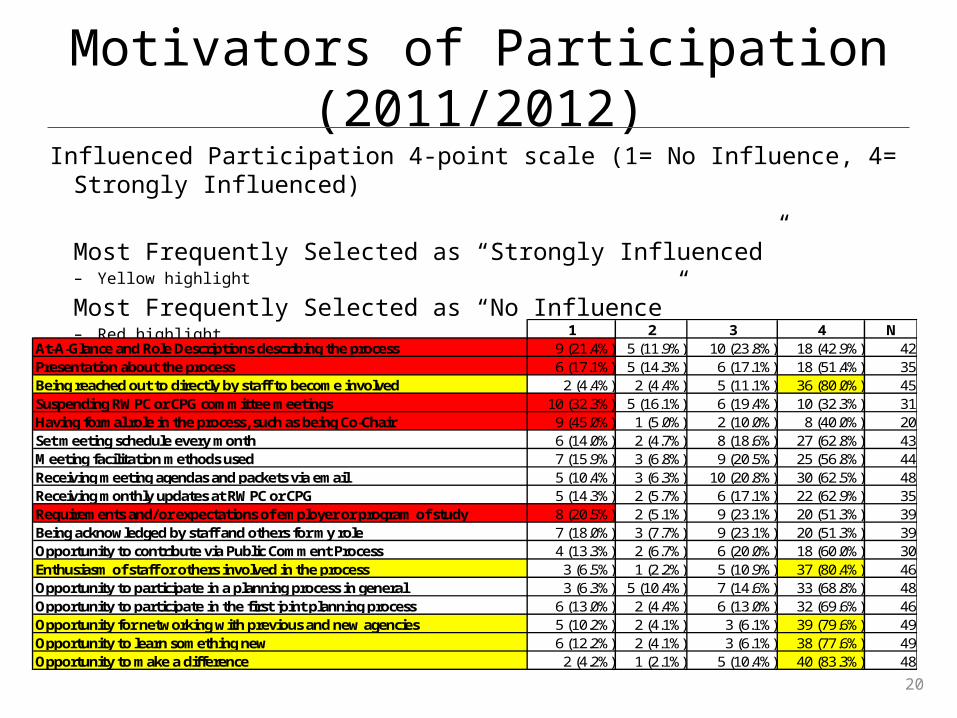
Motivators of Participation (2011/2012)
Influenced Participation 4-point scale (1= No Influence, 4= Strongly Influenced)
Most Frequently Selected as “Strongly Influenced”– Yellow highlight
Most Frequently Selected as “No Influence”– Red highlight
20
1 2 3 4 NAt-A-Glance and Role Descriptions describing the process 9 (21.4%) 5 (11.9%) 10 (23.8%) 18 (42.9%) 42Presentation about the process 6 (17.1%) 5 (14.3%) 6 (17.1%) 18 (51.4%) 35Being reached out to directly by staff to become involved 2 (4.4%) 2 (4.4%) 5 (11.1%) 36 (80.0%) 45Suspending RWPC or CPG committee meetings 10 (32.3%) 5 (16.1%) 6 (19.4%) 10 (32.3%) 31Having formal role in the process, such as being Co-Chair 9 (45.0%) 1 (5.0%) 2 (10.0%) 8 (40.0%) 20Set meeting schedule every month 6 (14.0%) 2 (4.7%) 8 (18.6%) 27 (62.8%) 43Meeting facilitation methods used 7 (15.9%) 3 (6.8%) 9 (20.5%) 25 (56.8%) 44Receiving meeting agendas and packets via email 5 (10.4%) 3 (6.3%) 10 (20.8%) 30 (62.5%) 48Receiving monthly updates at RWPC or CPG 5 (14.3%) 2 (5.7%) 6 (17.1%) 22 (62.9%) 35Requirements and/or expectations of employer or program of study 8 (20.5%) 2 (5.1%) 9 (23.1%) 20 (51.3%) 39Being acknowledged by staff and others for my role 7 (18.0%) 3 (7.7%) 9 (23.1%) 20 (51.3%) 39Opportunity to contribute via Public Comment Process 4 (13.3%) 2 (6.7%) 6 (20.0%) 18 (60.0%) 30Enthusiasm of staff or others involved in the process 3 (6.5%) 1 (2.2%) 5 (10.9%) 37 (80.4%) 46Opportunity to participate in a planning process in general 3 (6.3%) 5 (10.4%) 7 (14.6%) 33 (68.8%) 48Opportunity to participate in the first joint planning process 6 (13.0%) 2 (4.4%) 6 (13.0%) 32 (69.6%) 46Opportunity for networking with previous and new agencies 5 (10.2%) 2 (4.1%) 3 (6.1%) 39 (79.6%) 49Opportunity to learn something new 6 (12.2%) 2 (4.1%) 3 (6.1%) 38 (77.6%) 49Opportunity to make a difference 2 (4.2%) 1 (2.1%) 5 (10.4%) 40 (83.3%) 48
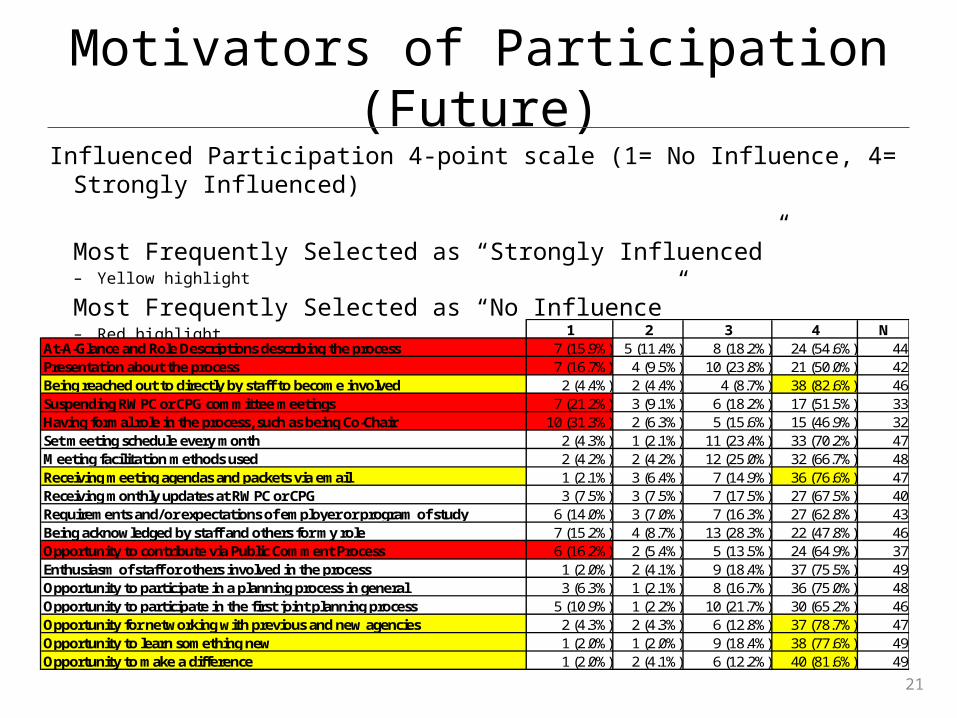
Motivators of Participation (Future)
21
Influenced Participation 4-point scale (1= No Influence, 4= Strongly Influenced)
Most Frequently Selected as “Strongly Influenced”– Yellow highlight
Most Frequently Selected as “No Influence”– Red highlight
1 2 3 4 NAt-A-Glance and Role Descriptions describing the process 7 (15.9%) 5 (11.4%) 8 (18.2%) 24 (54.6%) 44Presentation about the process 7 (16.7%) 4 (9.5%) 10 (23.8%) 21 (50.0%) 42Being reached out to directly by staff to become involved 2 (4.4%) 2 (4.4%) 4 (8.7%) 38 (82.6%) 46Suspending RWPC or CPG committee meetings 7 (21.2%) 3 (9.1%) 6 (18.2%) 17 (51.5%) 33Having formal role in the process, such as being Co-Chair 10 (31.3%) 2 (6.3%) 5 (15.6%) 15 (46.9%) 32Set meeting schedule every month 2 (4.3%) 1 (2.1%) 11 (23.4%) 33 (70.2%) 47Meeting facilitation methods used 2 (4.2%) 2 (4.2%) 12 (25.0%) 32 (66.7%) 48Receiving meeting agendas and packets via email 1 (2.1%) 3 (6.4%) 7 (14.9%) 36 (76.6%) 47Receiving monthly updates at RWPC or CPG 3 (7.5%) 3 (7.5%) 7 (17.5%) 27 (67.5%) 40Requirements and/or expectations of employer or program of study 6 (14.0%) 3 (7.0%) 7 (16.3%) 27 (62.8%) 43Being acknowledged by staff and others for my role 7 (15.2%) 4 (8.7%) 13 (28.3%) 22 (47.8%) 46Opportunity to contribute via Public Comment Process 6 (16.2%) 2 (5.4%) 5 (13.5%) 24 (64.9%) 37Enthusiasm of staff or others involved in the process 1 (2.0%) 2 (4.1%) 9 (18.4%) 37 (75.5%) 49Opportunity to participate in a planning process in general 3 (6.3%) 1 (2.1%) 8 (16.7%) 36 (75.0%) 48Opportunity to participate in the first joint planning process 5 (10.9%) 1 (2.2%) 10 (21.7%) 30 (65.2%) 46Opportunity for networking with previous and new agencies 2 (4.3%) 2 (4.3%) 6 (12.8%) 37 (78.7%) 47Opportunity to learn something new 1 (2.0%) 1 (2.0%) 9 (18.4%) 38 (77.6%) 49Opportunity to make a difference 1 (2.0%) 2 (4.1%) 6 (12.2%) 40 (81.6%) 49

Other Recommendations & Feedback
• What would you change?– Scheduling conflicts (x 4)– “Minority opinions” to hold more weight (x 2)– More feedback from community (x 2)– More client-friendly language for data – RWGA to have less influence over the process and discussion– Nothing/NA (x 15)
• What stakeholders were missing from the process that you would like to see “at the table” in the future?– Consistent set of admin staff from contracted CBOs– Small agencies, non-HIV agencies– Mental health, substance abuse– Texas DSHS– Healthcare professionals, private physicians, medical case managers– More community, more youth, more faith-based– Universities and colleges– Researchers in new medical technology– Parole/probation and others serving recently released 22

Expectations• The overall process used to develop the 2012 Comprehensive Plan – Usually or always met expectations: 88%
• The Leadership Team process as a whole – Usually or always met expectations: 91%
• The Workgroup process as a whole – Usually or always met expectations: 90%
• The Public Comment process – Usually or always met expectations: 85%
• The process used to review and provide feedback on drafts of Plan – Usually or always met expectations: 91%
• The approval and/or concurrence process – Usually or always met expectations: 91%
23

Summary70% answered they would be “very likely” to participate in the process again • “Very likely”= highest response on a 4-point scale
Limitations• Small sample size (53 of 110= 48.2%)• Recall bias– Survey at end of 9-month process
• No pre-test data for expectations
Evaluation Recommendations• Shorter survey• Consistency of scales (5 to 7-point)• Consider categorization and additional questions based on participation level or role• Specifically ask if member of RWPC or CPG– Asked if that was primary role but not capturing those that may work in HIV outside of
RWPC/CPG
24
Implementation through Integrated Measurement, Alignment, and Monitoring
Houston Area HIV Services Ryan White Planning Council
Jennifer M. Hadayia, MPAHealth Planner, Houston EMA/Part A
Harris County Judge’s OfficeRyan White Planning Council, Office of Support

New for 2012 Comprehensive Plans
“Grantees are required to evaluate their 2009 Comprehensive Plan to identify successes and challenges experienced in the
implementation of the plan and how they plan to meet those challenges.”
~“In the Comprehensive Plan, grantees will discuss how the plan will
address the goals of the National HIV/AIDS Strategy…how the Healthy People 2020 objectives will be addressed [and]… how
efforts are coordinated with and adapt to changes that will occur with the implementation of the Affordable Care Act (ACA).”
26
2012 Comprehensive Plan Instructions Part A (March 2011)

New for 2012 Comprehensive Plans
Grantees are required to document:• To what extent was input from [stakeholders] used to inform and
monitor the development and implementation of the jurisdictional plan […]
• To what extent was surveillance and service data/indicators used to inform and monitor the development and implementation of the jurisdictional plan.
27
HIV Planning Guidance (pre-decisional draft released March 2012)

Our Challenges
• Designing a process that will meet both sets of federal expectations• Designing a process that will result in SMART measurement as well as
stakeholder and community input on measurement• Identifying systems-level improvements that attain both HIV prevention
and HIV care goals seamlessly• Locating current, accurate, and replicable data sources to serve as
baselines for common measures, including use of surveillance and service data/indicators
• Calculating reasonable proximal and distal targets• Designing a process that results in alignment between the measures,
required national initiatives, and other plans unique to the Houston Area• Producing a final work product that can be implemented seamlessly• Ensuring methods for monitoring implementation as well as for
stakeholder and community input on implementation
28

Methods and Tools for Joint Measurement
and Alignment1. Evaluation Workgroup
• Composition, Structure, and Core Partner Representation• Roles and Responsibilities
Expedited Evaluation of the 2009 Houston Area Comprehensive HIV Plan
2. Leadership Team and Workgroup Tools• Inventories of Local, Regional, State, National, and International Initiatives a
nd Plans• Logic Models• Matrix of Benchmarking and Alignment, By Strategy
3. Workgroup Synergy4. Plan Design
• Strategies• Crosswalks• Dashboard
29

30
Houston EMA Treatment Cascade
0%
20%
40%
60%
80%
100%
21,567
15,712
26,424
10,9999,767 9,642

31
Houston Area Dashboard (1-2)

32
Houston Area Dashboard (3-4)
33
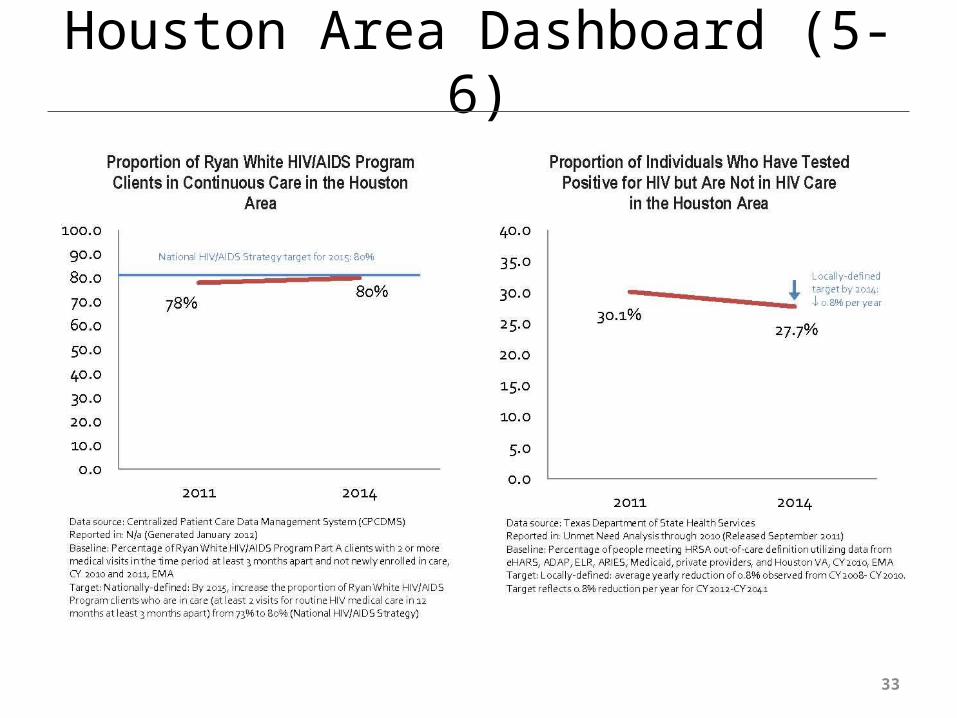
Houston Area Dashboard (5-6)

34
Houston Area Dashboard (7-8)

Methods and Tools for Joint
Implementation and Monitoring
35
1. Implementation Checklists• By Strategy• By Responsible Party• By Activity Type
2. Core Partner Liaisons• Activity Worksheet
3. Integration into Planning Body Processes• Role of the Comprehensive HIV Planning Committee
4. Continuation of the Evaluation Workgroup• Evaluation and Monitoring Plan• Matrix of Benchmarking and Alignment, By Strategy• Process Evaluation Methods

Lessons Learned• Adopt guiding principles that prioritize SMART measurement• Establish a core team of staff liaisons for each responsible party (i.e.,
RW/A, RW/B, HIV prevention, PBs) with access to: (1) data management systems and other data sources; and (2) leadership
• Enlist data experts (e.g., surveillance, epi, R&E), but also database management/IT, quality management, and program/service monitoring
• Establish a planning structure/schedule that allows for continuous feedback – or synergy – between: (1) the identification of needs and activities, (2) the identification of SMART measures, data sources, baselines, and targets; and (3) review/buy-in from responsible parties
• Utilize regional and national initiatives and plans as secondary data sources; and, as possible, replicate regional and national measures
• Create multiple and diverse sets of implementation tools• Integrate implementation into existing Planning Body structures; and
include monitoring as a standing activity of committees and meetings
36

Pleasant Surprises• The identification of gaps in baseline data, particularly for Special
Populations, mobilized stakeholders around data improvements overall. Where baseline data was unavailable, participants elected to include activities in the plan itself to collect data.
• The need for baseline data on joint benchmarks resulted in improved data sharing between prevention and care and across funding streams, which continues post-plan production
• Tools developed for benchmarking flowed seamlessly into monitoring• Funded-agencies, AAs, and Planning Bodies are adopting the plan’s joint
benchmarks as their own, using them in grant applications, program evaluation, QM, and Standards of Care
• Prioritizing the review/buy-in of activities from responsible party leadership produced higher-level design with more meaningful impact
• Ensuring alignment with local, regional, state, and national initiatives and plans produced a greater level of awareness of these expectations and guidelines that continues to infuse the Part A FOA response today
37

A Council Member’s Perspective: Past, Present, and Future
Houston Area HIV Services Ryan White Planning Council
Steven VargasCase Manager, Minorities Action Program (MAP)
Association for the Advancement of Mexican-Americans, Inc. (AAMA)
~External Member, Ryan White Planning Council
Co-Chair, Ad Hoc EIIHA CommitteeCo-Chair, Evaluation Workgroup, Houston Area
Comprehensive HIV Plan