staff 1/2 meeomoee .nonni mhemhhhhhheeee …
TRANSCRIPT

AD-A122 285 PHASE I EVALUATION OF TRASANA TECHNICAL STAFF 1/2PRODUCTIVITY MEASUREMENT SY..(U) ARMY TRADOC SYSTEMSANALYSIS ACTIVITY WHITE SANDS MISSILE RAN. JAN 82
UNCLASSIFIED TRRSRNR-TR-5-82 SBI-RD-FO58 872 F/G 5/9 N
MEEOMOEE .NONNIMhEMhhhhhhEEEENMMhMhhMhhEEEEmMhhhhMhhMhhEEmMhMhhhhhEMhEImhMhMhEEMhEMhI
• ,.ii * _ _., 0
IIIIL 2 12.
111L2 .4I-6
MICROCOPY RESOLUTION TEST CHARTNATIONAL BUREAU OF STANDARDS-1963-A
J7
[4
.[ ," . . , : .o : .- .

I ,q r os'OO 7 -
TRASANATECHNICAL REPORT 5-82
PHASE I EVALUATION OFTRASANA TECHNICAL STAFF
PRODUCTIVITY MEASUREMENT SYSTEM TEST(TPMS-TE)
[:i JANUARY 1982
Approved for public release; E CTIdistribution unlimited. DEC i0ta
DEPARTMENT OF THE ARMYUS ARMY TRADOC SYSTEMS ANALYSIS ACTIVITY
LWHITE SANDS MISSILE RANGENEW MEXICO 88002
DDC FILE GOPY 82 1 1 3 031

DISCLAIMER
The views, opinions, and/or findings contained in this report are those ofthe author(s) and should not be construed as an official Department of theArmy position, policy, or decision unless so designated by cther officialdocumentation. .-
WARNI..
Information and data contained herein are based on the input available at thetime of preparation. The results are subject to change.
a p..
- -.I
.L.°,
S

EXECUTIVE SUMMARY
This report presents the results of the Phase I (the first scoring year)evaluation of the three-year test implementation of the US Army TRADOC SystemsAnalysis Activity (TRASARA) Technical Staff Productivity Measurement System(TPMS).
TPMS is a methodology designed to measure the productivity of approxi-Umately 250 technical staff members who are mostly scientists and engineers
engaged in various facets of operations research and applied problem solving.Most of the work is performed by teams organized to meet the requirements ofeach project. The organization completez 60 or more projects a year which arequite diverse in nature. Each project is required by TPMS to have a projectplan, which is a detailed planning document including estimates of manpower
m and computer resources needed for the project, as well as a time schedule forthe project.
The project plan is submitted for approval to the Productivity Measure-ment Board (PMB) which is responsible for monitoring resource estimates andschedules. Once the plan is approved, the team executes it. When the projectis completed, the project is assigned scores based on how well the actualresource utilization and time schedule agreed with the plan, as well as aproduct quality score. The product quality score is assigned by a qualitycontrol group called the Product Review Board (PRB). The scores for all ofthe factors are multiplied together to arrive at the Project Score (PS). Twoor more PS's can be combined and weighted by expended manpower to form theProductivity Index (PI). P1's are calculated for each individual and fororganizational units of TRASANA.
TPMS was developed at TRASANA and adopted for a three year trial imple-mentation starting 1 Oct 80. The first scoring period was a truncated year(nine months) ending 30 Jun 81 to put the system on the 1 July to 30 Juneyear.
The objectives of this study were (1) to determine how the TRASANAtechnical staff (TTS) perceives TPMS, (2) to determine the degree to whichTPMS is a meaningful measure of productivity, and (3) to develop a TPMS database consisting of Phase I TPMS-T results.
The first study objective was answered by surveying the TTS at the end ofthe first year. The second objective was answered by an in-depth analysis ofthe first year TPMS scoring results, a mathematical analysis of the scoringalgorithm, a functional analysis of the PMB and PRB, and by a PI validationanalysis. The PI validation consisted of developing a measure of producti-vity which was independent of TPMS, and which could be used for comparisonwith the PI. This independent measure, or criterion measure (CM), consistedof confidential supervisory ratings obtained by personal interview. The thirdobjective was achieved by forming a computer data file consisting of both the
. survey and first year scoring results.
iii
k~

The majo findings were:
The staff reaction to TPMS was mixed. They see TP4S as apotentially useful managerial tool, but there is a high level ofconcern about Pr inaccuracies, system manipulation, and theeffect on the creative and cooperative atmosphere at TRASANA.
o The system was not seen as fair by the staff.
TPMS reflects organizational productivity in the classical sense
(value of output over value of input, and captures bothefficiency and effectiveness) but its accuracy needs to beimproved.
o The resource estimates, especially manpower, were not adequately
controlled by the PMB, which decreased the accuracy of thesystem.
o The individual Pr did not accurately reflect individual
productivity.
0 There is considerable potential for input effort/output score
mismatch with the individual PI.
o The scoring algorithm, especially the effect of judgmental and
discretionary awards, was not well understood.
o Organizational units with an overhead mission are disadvantagedby including overhead (activities that are not project specific)in the P! computation.
0 The organizational PI was more accurate than the individual PI,
but it will be much more accurate if the resource estimates arecontrolled and overhead is more consistently reported acrossorganizational units.
o The PRB serves a valuable quality control function, but the
quality scoring was much less successful.
The major conclusions were:
o TRASANA is a healthy organization with high morale and a
motivated work force.
0 TPMS is a conceptually sound productivity measurement system, butmany of its functional elements need revision.
o The individual PI should be eliminated.
O The organizational Pr would be strengthened by eliminating
overhead from the PI calculation.
o A new method of controlling resource estimates is required.
iv
6i

0 The scoring algorithr i, :4nn-ecessaril>' copruicated.
o Firm guide L7Xres are needed for overhead accozuntina.
Major recommendations inclZded:
o Use only three scoring factors - manpower, timeliness and quality- and score all three by categories, e.g., high, medium, and
low. The three category scores for manpower and for timelinessshould reward accuracy in planning.
0 Change the 125% rue (percentage of available manpower committedto projects) to the 110% rule.
0 Institute an after-the-fact division level check with reward foraccuracy in estimating manpower and timeZiness.
0 Eliminate the individual PI.
o Establish overhead charging guidelines with a specified percentage
of manpower allowed to be charged to overhead without penalty.
o Eliminate overhead from organizational PI computation.
0 Establish a scoring checklist (with scoring criteria) to be used
by the PRB for scoring each product.
o Assign a productivity rating to the PRB.
0 Maintain management intervention to avoid penalties in PI from
undertaking risky projects.
An alternative TPMS scorin3 procedure incorporating the above recommenda-tions is included in the report.
:Ac o io,?en ror
• -. NTIS .
DTI17T'-'
OTIC
Ti
iI'. _ ..- ...,.7 .../ . . ' -.. .... ." .. .. . . -.. . .

K7 T 7.
TABLE OF CONTENTS
CHAPTER 1 - INTRODUCTION
1.1 PURPOSE UE -- 1
1.2 BACKGROUND - - ------------------------- - -1-1
1.3 THE SYSTEM -1------------------- ------- - 1-2
1 .4 PROBLEM- -1--------------------------- - 1-3
1.5 TMPACT OF PROBLEM- - - - - --------------------- -3
7.6 OBJECTIVES AND STUDY QUESTIONS - - ----------------- 0
1.7 3COPE-------------I-------------------- 1-4
1.8 ASSUMPTIONS, CONSTRAINTS, AND LIMITATIONS- ------------ 1-4
CHAPTER 2 - METHODOLOGY
2.1 APPROACH ----------------------------- 2-1
2.2 TRASANA TECHNICAL STAFF PERCEPTIONS- - - -- -------- --- ----
2.3 EVALUATION OF TPMS FIRST YEAR PERFORMANCE ------------- 2-6
CHAPTER 3 - FINDINGS: TECHNICAL STAFF SURVEY RESULTS
3.1 THE SURVEY ---------------------------- 3-1
3.2 SURVEY RESULTS -------------------------- 3-2
3.3 GROUP COMPARISONS- ------------------------ 3-4
3.4 RESPONSE TO FIRST OBJECTIVE- ------------------- 3-7
CHAPTER 4 - FINDINGS: FIRST YEAR RESULTS
4.1 FIRST YEAR SCORING RESULTS -------------------- 4-1
4.2 PRODUCTIVITY INDEX ------------------------ 4-12
4.3 TPMS MANPOWER COSTS- ----------------------- 4-27
4.4 FIRST YEAR SCORING PROBLEMS- ------------------- 4-30
4.5 PRODUCT REVIEW BOARD (PRB) -------------------- 4-32 -
4.6 PRODUCTIVITY MEASUREMENT BOARD (PMB) --------------- 4-32
vi
* . .. .

4.7 TPMS ALGORIThm ANALYSIS RESULTS- ----------------- 4-33
4.8 RESPONSE TO SECOND OBJECTIVE ------------------- 4-34
CHAPTER 5 - SUMMARY AND CONCLUSIONS
5.1 DESIRED ATTRIBUTES OF TPMS -------------------- 5-1
5.2 CONCLUSIONS- --------------------------- 5-2
CHAPTER 6 - RECOMMENDATIONS
6.1 PURPOSE- ----------------------------- 6-1
* 6.2 APPROACH ----------------------------- 6-1
6.3 RECOMMENDATIONS- ------------------------- 6-1
APPENDICES
APPENDIX A - TPMS-TE STUDY PLAN
APPENDIX B - TRASANA TECHNICAL STAFF SURVEY
APPENDIX C - SUPPORTING TABLESE
APPENDIX D - TPMS SCORING SHEETS
APPENDIX E - MATHR4ATICAL ANALYSIS OF THE TPMS SCORING ALGORITHM
APPENDIX F - AN ALTERNATIVE TPMS SCORING PROCEDURE
APPENDIX G - BIBLIOGRAPHY
v
vi i
.I .,
PHASE I EVALUATION OF TRASANA TECHNICAL STAFF*PRODUCTIVITY MEASUREMENT SYSTEM-TEST (TPMS-TE)
CHAPTER 1
INTRODUCTION
O 1.1 PURPOSE
This report presents the results of the Phase I (the first scoring year)evaluation of the three-year test implementation of the US Army TRADOC SystemsAnalysis Activity (TRASANA) Technical Staff Productivity Measurement System(TPMS).
1.2 BACKGROUND
a. TPMS is a methodology designed to measure the productivity of the'* TRASANA technical staff (TTS), its organizational elements, and its individual
employees. It yields a single dimensionless index as the measure of produc-tivity. The formulation of this index is intended to be consistent with thetraditional definition of productivity as value of output divided by value ofinput. In principle, TPMS places TRASANA on a "fixed price plus incentive"basis for producing its various products. TPMS was designed with thefollowing attributes in mind:
(1) Relevant - to the organization, its products, and to the jobsthat produce the products.
(2) Rational and fair - so that it can be accepted and used by asophi sti cated. work force.
(3) Affordable - in terms of direct and indirect/overhead costs for
operation and maintenance.
(4) Flexible - to couple with a dynamic workload, organization, and
operations.
(5) Simple - both in principle and practice.
(6) Transparent - so as to facilitate understanding of cause andeffect relationships.
(7) Durable - to support multi-year use.
b. TPMS was adopted at TRASANA for a three year trial beginning 1 Oct80. The first scoring period ended 30 Jun 81, and was nine months in length.Subsequent years will run from I July through 30 June. Management formed asmall internal evaluation team in Mar 81, and charged the team with developingand executing an objective evaluation of the TPMS test implementation. Thestudy plan developed for evaluating the initial implementation period is inappendix A. In keeping with management's desire to have as independent and
1-1
w

objective evaluation as possible, the study plan was developed independentlyby the study team, and reviewed, but not changed, by management. The evalua-tion effort was directed toward determining the extent to which TPMS met itsdesign attributes.
1.3 THE SYSTEM
A complete description of TPMS, its development and the three year trialimplementation period can be fodnd in other documents.1 This brief overviewis provided for the reader who is not familiar with the system.
a. TRASANA has nearly 250 per',onnel who are referred to as analysts ortechnical staff. They are mostly scientists and engineers who engage invarious facets of operations research and applied problem solving. The moduko pe o nd'" is for a team to be assiqned to a given project. The team is respon-sible for clearly defining the problem, developing and executing an appropri-ate methodology, and publishing a report documenting the results of theeffort.
b. TPMS basically provides a method for assigning a numerical score toeach project after it is completed. This score is called the project score(PS). The PS is converted to a weighted index (weighted by invested resources)which can in turn be converted to a weighted productivity index (PI) forindividuals as well as organizational units.
c. The mechanics of the system are rather straight forward. When aproject is identified, a senior analyst is assigned as the study manager (SM).The SM is responsible for negotiating details of the project with any outsideagencies and writing a project plan. The project plan is a detailed planningdocument which breaks down the project into tasks and subtasks, specifies themanpower and computer resources needed for each subtask, and also specifierwhat the product of each subtask will be and when it will be completed. Oncethis document is completed, it is submitted to the Productivity MeasurementBoard (PMB), which consists of the Assistant Deputy for Technical Operations(chairperson) and the eight functional division chiefs. The PMB reviews eachproject plan for completeness and to insure the resource requirements andcompletion dates are realistic.
i d. Once a project plan is approved by the PMB, the basis for assigning aproject score has been established. There are five factors contributing tothe PS: manpower utilization efficiency (R), computer utilization efficiency(C), timeliness (T), product quality (Q), and priority (P). These factorseach take on a limited value as shown in table 1-1. The R and C factor scores
"- are essentially a ratio of planned to expended resources. T is based on how
1TRASANA Memorandum 5-4, TRASANA Technical Staff Productivity MeasurementSystem (TPMS)-Test, August 1980.
* TRASANA Technical Documentation 37-80, Productivity Measurement System Designand Development, December 1980.
1-2I'

TABLE 1-1. TPMS SCORING FACTOR VALUES
FACTOR MINIMUM VALUE MAXIMUM VALUE
R 0.7 1.2
C 0.9 1.;
T 0.8 1.1
Q 1.0 1.5
P 1.0 1.2
close the product is completed to the projected completion date. Q isassigned by the Product Review Board (PRB), which is an internal qualitycontrol mechanism consisting of three permanent (voting) members augmented by
-- additional analysts selected on an ad hoc (non-voting) basis. P is 1.2 if thestudy is conducted for an external customer, and is negotiated with the PMB inother cases. The PS is computed by multiplying all of the factor scorestogether:
PS = R x C x T x Q x P
1.4 PROBLEM
The problem addressed in the Phase I evaluation was to determine the degree towhich TPMS provides a meaningful measure of the productivity of the TRASANAtechnical staff and its organizational elements.
1.5 IMPACT OF PROBLEM
* TPMS is a new system. Numerous decisions were made in designing the system• which involved trade-offs. The only way to know how well the final result
achieves its goals is to test it. Furthermore, a comprehensive evaluation ofthe test is required to fully capture the effects of the system, and todocument its strengths and weaknesses. Failure to comprehensively evaluateTPMS performance during the test period could result in implementing a systemwhich does not adequately accomplish its objective, or which even may be
counterproductive.
1.6 OBJECTIVES AND STUDY QUESTIONS
a. To determine how the TRASANA technical staff perceives TPMS. Thestudy questions for this objective are:
1-3
(1) What is the TTS general attitude toward TPMS?
(2) What is the perceived motivational impact of TPMS?J
(3) Is TPMS seen as a viable managerial tool?
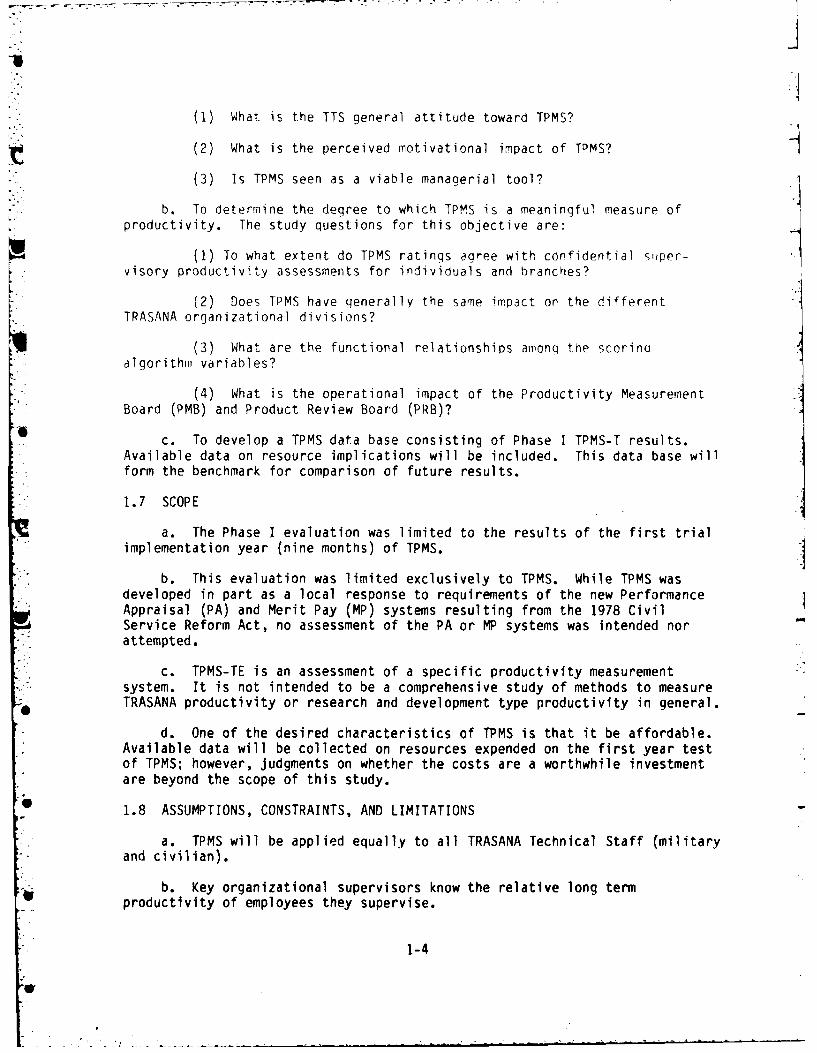
b. To determine the degree to which TPMS is a meaningful measure ofproductivity. The study questions for this objective are:
(1) To what extent do TPMS ratings agree with confidential super-visory productivity assessments for individuals and branches?
(2) Does TPMS have generally the same impact on the differentTRASANA organizational divisions?
(3) What are the functional relationships among the scorinoalgorithm variables?
(4) What is the operational impact of the Productivity MeasurementBoard (PMB) and Product Review Board (PRB)?
c. To develop a TPMS data base consisting of Phase I TPMS-T results.Available data on resource implications will be included. This data base willform the benchmark for comparison of future results.
1.7 SCOPE
a. The Phase I evaluation was limited to the results of the first trialimplementation year (nine months) of TPMS.
b. This evaluation was limited exclusively to TPMS. While TPMS wasdeveloped in part as a local response to requirements of the new PerformanceAppraisal (PA) and Merit Pay (MP) systems resulting from the 1978 Civil
Service Reform Act, no assessment of the PA or MP systems was intended nor-. attempted.
c. TPMS-TE is an assessment of a specific productivity measurementsystem. It is not intended to be a comprehensive study of methods to measureTRASANA productivity or research and development type productivity in general.
d. One of the desired characteristics of TPMS is that it be affordable.Available data will be collected on resources expended on the first year testof TPMS; however, judgments on whether the costs are a worthwhile investmentare beyond the scope of this study.
1.8 ASSUMPTIONS, CONSTRAINTS, AND LIMITATIONS
a. TPMS will be applied equally to all TRASANA Technical Staff (militaryand civilian).
b. Key organizational supervisors know the relative long term
productivity of employees they supervise.
1-4

c. Division chiefs, branch chiefs, and the TTS provided complete andaccurate information for the study.
d. Not all of the TTS worked on TPMS scored projects during the firstscoring period.
e. Since there was no uniform, quantitative productivity measure priorto TPMS, there is no basis for comparing test period productivity with past
U productivity.
f. There is no independent measure of productivity with which todirectly compare the TPMS results.
1
n 4
1-5
p
CHAPTER 2
METHODOLOGY
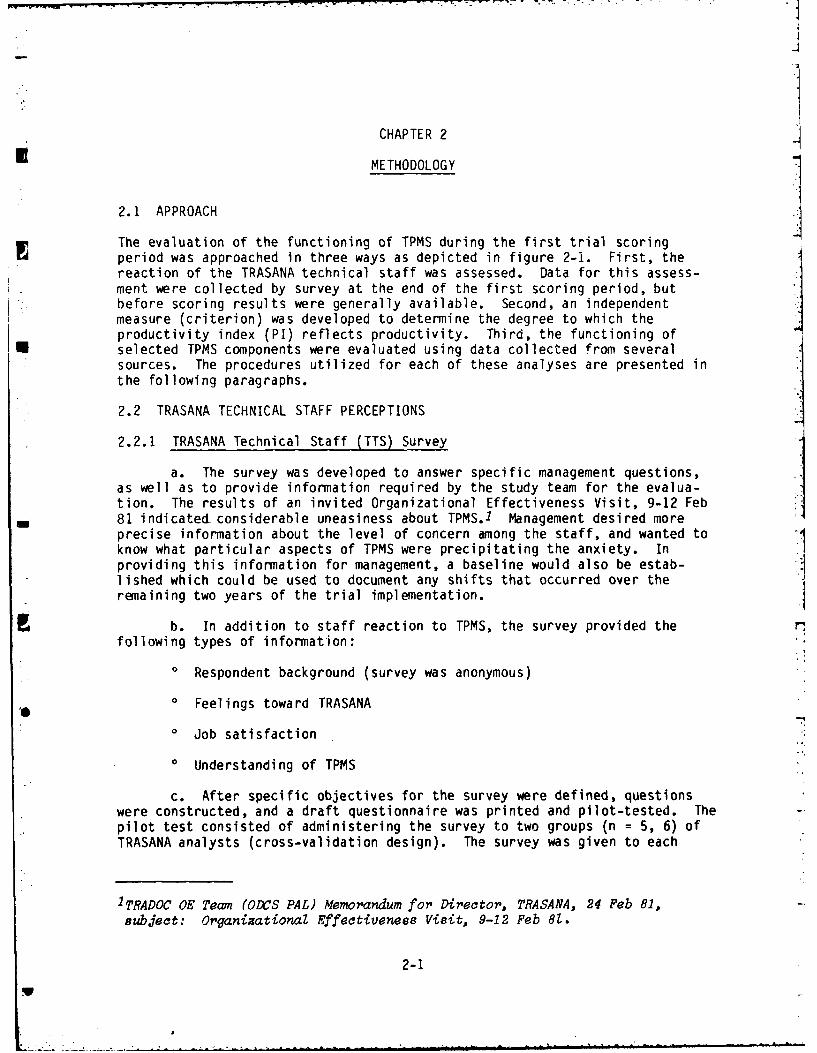
2.1 APPROACH
The evaluation of the functioning of TPMS during the first trial scoring
period was approached in three ways as depicted in figure 2-1. First, thereaction of the TRASANA technical staff was assessed. Data for this assess-ment were collected by survey at the end of the first scoring period, butbefore scoring results were generally available. Second, an independentmeasure (criterion) was developed to determine the degree to which theproductivity index (PI) reflects productivity. Third, the functioning of
* selected TPMS components were evaluated using data collected from severalsources. The procedures utilized for each of these analyses are presented inthe following paragraphs.
2.2 TRASANA TECHNICAL STAFF PERCEPTIONS
2.2.1 TRASANA Technical Staff (TTS) Survey
a. The survey was developed to answer specific management questions,as well as to provide information required by the study team for the evalua-tion. The results of an invited Organizational Effectiveness Visit, 9-12 Feb
i 81 indicated-considerable uneasiness about TPMS.1 Management desired moreprecise information about the level of concern among the staff, and wanted toknow what particular aspects of TPMS were precipitating the anxiety. Inproviding this information for management, a baseline would also be estab-lished which could be used to document any shifts that occurred over theremaining two years of the trial implementation.
b. In addition to staff reaction to TPMS, the survey provided thefollowing types of information:
O Respondent background (survey was anonymous)
0 Feelings toward TRASANA
O Job satisfaction
o Understanding of TPMS
c. After specific objectives for the survey were defined, questionswere constructed, and a draft questionnaire was printed and pilot-tested. Thepilot test consisted of administering the survey to two groups (n = 5, 6) ofTRASANA analysts (cross-validation design). The survey was given to each
1TRADOC OE Team (ODCS PAL) Memorandum for Director, TRASANA, 24 Feb 81,
subject: Organizational Effectiveness Visit, 9-12 Feb 81.
2-1

0 c0
w I-
L
c C-
40
2-2

analyst individually, and comments were solicited on clarity, difficulty inanswering any questions, and whether the questions provided ample opportunityfor expressing all feelings and concerns about TPMS. Based on these commentsand a statistical item-analysis, revisions to the survey were made. Therevised survey contained 91 items organized into three parts: demographics,attitude toward TRASANA and TPMS, and TPMS familiarity. There was also acomment page attached to the survey. A copy of the survey is in appendix B.
2.2.2 Sample
a. The survey was administered to 190 analysts, or approximately 80percent of the TTS with experience under TPMS. Those who did not take thesurvey fell into one or more of several categories. The survey authors andthose who took the pilot survey were not considered part of the available
l population. Furthermore, persons who were identified as new to the organiza-*" tion, and therefere not familiar with either the organization or TPMS, were
also excluded. The majority of the remaining persons who did not take thesurvey were unavailable due to a combination of leave and work related travel
* requirements.
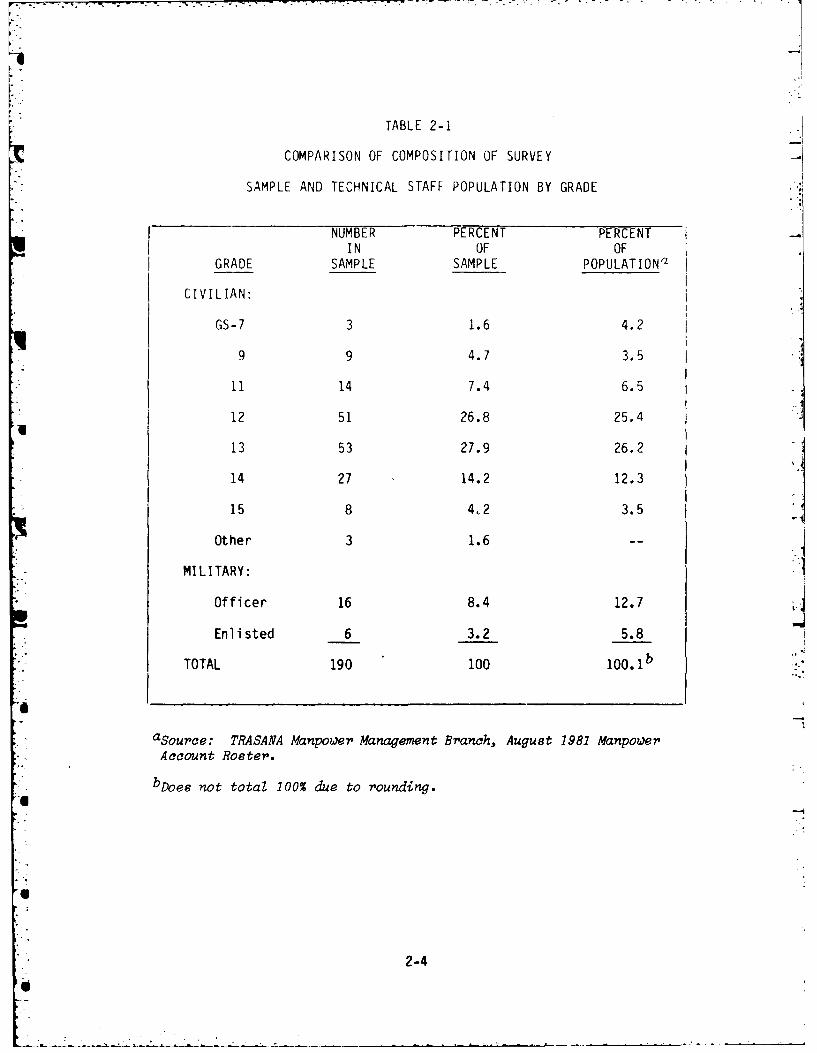
b. Table 2-1 provides a comparison of the survey sample and the TTS bygrade. Examination of the data reveals the relative homogeneity of the twogroups. The two distributions were compared statistically and found not to bedifferent. 2 The sample is therefore considered statistically representativeof the TTS by grade.
c. Table 2-2 shows the participation rate in the survey by division.Percent participation in the table is not necessarily percent of totalassigned who took the survey, because pilot test participants, evaluation teammembers, and identified new personnel were excluded. All division chiefs and20 branch chiefs took the survey. A statistical comparison was made betweenthe distribution of survey respondents by division, and the actual assignedpersonnel by division to determine if the division representation in thesurvey sample was biased. 3 There was no statistically significant differencein the distributions; therefore, no division was over or under represented tothe point of biasing the results.
2The test for independence was with the Chi-square technique. X2 12.55,*df = 8, which is not statistically significant at the p < .05 level
(X2 : 15.51).8, .05
3This comparison was by Chi-Square using actual staffing figures from the Aug81 TR4SANA Manpower Account Roster. X9 = 6.19, df = 7, which is not statis-tically significant at the p < .05 level (X2 = 14.07). Table C-Z in
7, .05appendix C shows the composition of the TTS and the survey sample by division.
2-3
KI
TABLE 2-1
COMPARISON OF COMPOSITION OF SURVEY
SAMPLE AND TECHNICAL STAFF POPULATION BY GRADE
NUMBER PERCENT PERCENT -.
IN OF OFGRADE SAMPLE SAMPLE POPULATION"
CIVILIAN:
GS-7 3 1.6 4.2
9 9 4.7 3.5
11 14 7.4 6.5
12 51 26.8 25.4
13 53 27.9 26.2
14 27 14.2 12.3
15 8 4,2 3.5
Other 3 1.6 --
MILITARY:
Officer 16 8.4 12.7
Enlisted 6 3.2 5.8
TOTAL 190 100
aSource: TRASANA Manpower Management Branch, August 1981 Manpower
Account Roster.
bDoes not total 100% due to rounding.
2-4

TABLE 2-24
U PARTICIPATION IN SURVEY BY ACTIVITY AND DIVISION
PARTIC IPT ION
UNIT -(PERCENT)
DIVISION:
A 64.5B 83.3C 72.7D 86.5E 88.9
*F 62.5G 75.0H 97.3
ACTIVITY: 80.3
2.2.3 Data Collection Procedures
a. The survey was administered to the TTS on 29 and 30 June 1981. Thetimirl as selected to allow maximum exposure to the system for familiarity,but yt.c to gather perceptions before the first scoring period results were
* available. Since the first scoring period ended 30 June 1981, the survey* captured perceptions at the end of the period, during which 61 projects were
completed and scored. Makeup sessions were held on 20 and 24 July.
b. A letter signed by the Assistant Deputy for Technical Operationswas sent to each of the eight division chiefs approximately one week beforethe scheduled administration date. The division chiefs were all aware thatthe survey was to be administered at the end of the first scoring year becausethey had reviewed and dpproved the project plan in the Productivity Measure-ment Board (PMB) meeting (12 June 1981). At the TRASANA staff meeting ofdivision chiefs on 25 June, maximum participation in the survey was encour-aged. Division secretaries were also phoned on administration dates as areminder.
c. The survey was scheduled to provide as little work interruption aspossible, and to be as convenient as possible while still under controlledconditions. Four three-hour time blocks were established over the two dayswith two divisions being scheduled for each time slot. Analysts could come tothe scheduled conference room at their convenience, complete the survey, andleave. The time schedule was only to avoid congestion. No attempt was madeat schedule enforcement, arnd all requests to take the survey in a differenttime slot were honored. The survey took 45 minutes to an hour, and was takenanonymously. Group administration was employed to control for discussion ofquestions and answers while responding and to achieve a more representativesampling than could be achieved by a mailing procedure.
2-5

2.3 EVALUATION OF TPMS FIRST YEAR PERFORMANCE
The evaluation of the TPMS first year performance involved the following
steps:
o gathering and analyzing first year scoring results
0 conducting a literature survey on productivity evaluation
0 developing a productivity criterion measure (CM)
o collecting CM data
o PI evaluation analysis
The methodology employed for each of these steps is discussed separately.
2.3.1 First Year Scoring Results
a. TRASANA Memo 5-4, describes the TPMS three year implementation,scoring procedures, and record keeping requirements. Essentially, each of theeight TRASANA divisions are responsible for keeping records of their projects,and for reporting the results at the end of each scoring year.
b. A set of three forms was developed which would provide the neces-sary information from each division for this evaluation, as well as provide aconvenient summary record which would meet the needs of the divisions. 4 Acopy of this set of forms, TPMS Division Scoring Sheet, TPMS Branch ScoringSheet, and TPMS Individual Scoring Sheet is in appendix D.
c. The forms were distributed to the division chiefs at a PMB meetingwith instructions to furnish a copy to the TPMS-TE evaluation team not laterthan 15 August 1981, which was enough time for all scoring records to beavailable.
d. Project scoring data were obtained from the TPMS scored projectlog, which is maintained by the PMB chairman.
e. After all scoring data were received, a descriptive summary wasprepared and analyzed for each of the scoring variables, for each project, andfor each scoring unit. These data formed the Phase I TPMS-T data base.
4The final version forms were a slighty modified version of those developed by
*g ATAA-TE.
2-6

2.3.2 Literature Survey Summary
A comprehensive literature review was beyond the scope of this study.Instead, an attempt was made to select the most relevant works as a framework
*for this evaluation. The works selected for review fell into four general.. categories:
0 documents pertaining specifically to TPMS
o Research and Development (R&D) productivity measurement
o performance appraisal (PA)
0 peer ratings
All available documentation on TPMS were reviewed for background, and the bestavailable references on measuring productivity of R&D or scientist andengineer organizations were consulted for background in developing the CM.References on PA and peer ratings were consulted as these techniques becameimportant in developing the CM. A detailed summary of the works consulted isnot included, because excellent literature summaries appear elsewhere.5
* Conclusions from the literature survey are outlined to show the reasoningbehind the specific study procedures employed.
a. Measuring R&D Productivity. The predominant approach to measuringproductivity among scientists and engineers is to opt for some easily count-
on able measure such as number of publications (Blose & Stansel, 1975; Katzen,
1975; Koser, 1976; Newburn, 1972; Technical Report 74-3, USAF AFIT, 1974; and- Technical Report 78-1, USAF AFIT, 1978). One ambitious attempt to compare the
knowledge production of major universities failed to find a more acceptablemeasure than publications (Clark & Guba, 1977). The obvious problem withcounting products is that the quality of the products is not considered. Onehigh quality product may be equal to several lesser quality works. Edwardsand McCarrey (1973), after an extensive literature review concluded that morestudy is needed on how to measure the performance of research or knowledgetype workers. The difficulty is measuring quality or relevant worth. The
* most credible method of doing this is by blind peer review. This methodinvolves presenting a small group of widely recognized professionals in a
*b specific field with works not identified by author to be rated according tospecified rating criteria. This "blind review" is the method used by manyprofessional journals to select articles for publication (commonly referred toas "refereed" journals).
5 The works consulted are arranged by subject area in the bibliography. Themost complete general reference is RAD Productivity published by the HughesAircraft Company (1978). Other refe-enceslirste-din the bibliographycontaining relevant literature summaries include: Christ (1981), Edwarde andMcCarrey (1973), Schainblatt (1981), and Technical Report 79-9 (USAF HRL,19 79).
2-7
p
b. Peer Ratings. The most frequent use of peer ratings reported inthe literature is in training courses. Very little was found that related to -
scientists and engineers. No evid'ence was found to support the use of peerratings for determining product quality in an organization like TRASANA.Indeed, the problems that are reported in attempts to use peer ratings suggest
*questionable validity. !t was anticipated that with the diverse backgroundsof the TTS, documented problems with peer ratings would be magnified.
c. Performance Appraisals. Once it became evident that peer ratingswere not a viable alternative for use as a CM, it was apparent that some formiof supervisor ratings or evaluations would be necessary. The PA literaturewas searched to find the most appropriate factors to include in the appraisalsas well as the best structure or format. From the literature it was foundthat the most reliable and valid appraisal is a global or overall rating.This method was adopted for the CM.
2.3.3 Criterion Measure
a. Official employee performance appraisals were not adequate for theCM because of the well known problems such as halo effect, rater bias, andvariation in rater standards. The most accurate supervisor judgments wererequired, and these judgments had to be quantitative to allow comparison withemployee P1 rankings.
b. The selected method involved asking first line supervisors (branchchiefs) to provide a confidential rank order of their employees. This rankingwas done in a private interview. Management provided the guarantee that thisinformation would remain confidential. Neither superiors nor subordinates hadaccess to this information. To preclude any chance of compromise, the confi-dential information from branch chiefs was destroyed as soon as the necessarydata pairings for -the analysis were completed. In addition to the ranking ofemployees, a rating was also obtained. The rating was an overall performanceevaluation on a scale of 1 to 10, with 5 being average for TRASANA, and 10being the most outstanding. These two confidential data elements for each
* individual, rank order in branch and overall job performance rating, becamethe productivity CM for the PI evaluation.
2.4 TPMS COMPONENT FUNCTIONING
This portion of the evaluation effort consisted of determining how well theProductivity Measurement Board (PMB), the Product Review Board (PRB), and theTPMS scoring algorithm functioned when considered all together.
* 2.4.1 PMB
Data were collected from three sources to determine how well the PMB workedthe first year. First, a meeting was observed. Second, the PMB members wereinterviewed. Third, the first year scoring results were analyzed to determineif the PMB monitoring of project plans was achieving its objective of keeping
* manpower, comnputer, and timeliness estimates from being inflated.
2-8

2.4.2 PRB
I The PRB functioning was determined by interviewing selected PRB members, anddivision chiefs, branch chiefs, and study managers who experienced PRB scoringduring the first scoring year. The scores given by the PRB during the firstscoring period were also analyzed.
2.4.3 Algorithm
The TPMS scoring algorithm was analyzed mathematically to clearly identifyfactor relationships.
2-9
S

CHAPTER 3
I FINDINGS: TECHNICAL STAFF SURVEY RESULTS
This chapter presents the results of the survey administered to the TRASANATechnical Staff (TTS) at the end of the first scoring year to achieve thefirst study objective: to determine how the TTS perceives TPMS. Thefollowing study questions for this objective are answered:
0 What is the TTS general attitude toward TPMS?
° What is the perceived motivational impact of TPMS?
0 Is TPMS seen as a viable managerial tool?
Emphasis was on quantifying the general attitude toward TPMS, determining itsperceived motivational impact, and assessing the perceptions of TPMS as aviable management tool. Since the general predisposition of the TTS would bean important factor in how a new productivity measurement system would beaccepted, organizational climate data were also collected in the survey, and
*are reported in this chapter.
3.1 THE SURVEY
* a. A complete copy of the survey is in appendix B. It consists of 91items plus a comment page. The first 14 items pertain to backgroundinformation. The data obtained from these items are summarized in tables C-2through C-7 of appendix C. These data document the fact that the TTS is ahighly educated, experienced, stable work force consisting primarily ofscientists and engineers.
b. Seventy-five items were constructed on a six-point forced-choiceLikert scale with no neutral response category. The Likert scale was selectedbecause it gives not only an agree or disagree response to each item, but alsoyields an intensity, or degree of agreement or disagreement, which is muchmore revealing than a two category (yes or no) response. Sixty-two items weregrouped into the following clusters:
0 Attitude toward TRASANA
0 Job Satisfaction
O Control of work
o General reaction to TPMS
o Fairness of TPMS
o Understanding of TPMS
o Usefulness of TPMS as a management tool
3-1

The additional 13 items did not fall into any cluster, but addressed specific
points of interest.
3.2 SURVEY RESULTS
The results of the survey clusters are discussed in this section. Even thoughcluster scores are more stable and contain less error variance than individualitem responses, it is recognized that review of the distribution of responsesto individual items may be of interest to some readers. Tables C-8 and C-9 inappendix C give the response distributions for all of the questions in thesurvey except the demographic items, which are in tables C-2 through C7
3.2.1 Cluster Means and Reliabilities
a. The results oi the survey clusters are in table 3-1. Thereliability coefficients (coefficient alpha) range from 0.70 to 0.26 for
* individual clusters, indicating that the items in the clusters were generallya homogeneous set of items (all measuring the same thing). The reliability
* coefficient of 0.89 for the entire 75 items is high for a survey of this type.
b. The results were scored so that the higher the score, the morepositive the attitude. The mid-point of the six-point scale is 3.5. Scoresfalling in the 3.0 to 4.0 range are neither clearly positive nor negative due
TABLE 3-1TTS SURVEY CLUSTER (SUBSCALE) RESULTS
CLUSTER N ~UBR OF RELIABILITY MEAN STANDARD SE____________________QUESTIONS COEFFICIENT ____DEVIATION
ORGANIZATION:Attitude toward TRASANA 12 .86 4.32 .84 .31Job Satisfaction 9 .81 4.51 .89 .39Control of work 3 .70 4.63 1.08 .59
TPMS:General Reaction 11 .73 3.45 .76 .39Fairness 4 .82 2.96 1.21 .51Understanding 11 .76 4.00 .87 .21Management Tool 12 .70 3.46 .72 .39
CLUSTER TOTAL 62 .88 3.82 .72 .25
SURVEY TOTAL 75 .89 3.80 .45 .15
3-2

to possible measurement error. 1 The three clusters measuring organizationalclimate are clearly in the positive range, showing a very favorable regard forthe organization, job satisfaction, and control of work (important for R&D
organizations). The TPMS clusters are less positive. The general reactionand usefulness as a management tool are clearly in the neutral range. Thestaff generally considers itself to understand TPMS, but does not think TPMSis fair.
3.2.2 Attitude Toward TRASANA
Overall, the staff feels that TRASANA is a good place to work. Ninety-fourpercent of the respondents like working at TRASANA, 90 percent are proud ofTRASANA's products, 91 percent think that TRASANA has high standards, and 87percent feel that people are treated fairly.
U
3.2.3 Job Satisfaction
a. In general the TTS expressed a high degree of job satisfaction.Sixty-eight percent indicated they get a lot of satisfaction from their job,and 75 percent report their job is challenging. Of those not experiencingmuch personal satisfaction from their jobs, 43 percent indicated that theirskills were not well matched to the requirements of their jobs.
b. Fifty-four percent of the respondents do not feel they get usefulfeedback on job performance. This is indicative of a problem area. Analysts
* generally have a lot of freedom in how they do their job-(92 percent say theydo), and supervisors generally meet with approval, yet over half do not feeltheir supervisors are doing an effective job of performance appraisal.Meaningful performance evaluation and feedback is important for many reasons,including helping persons to improve themselves through constructivecriticism, and maintaining a realistic perspective on future expectations,such as promotion potential. A majority (52 percent) do not see TPMS as beinguseful for individual appraisals, which means it will not likely fill thisvoid.
3.2.4 General Reaction to TPMS
The aggregate response to this cluster lies near the scale midpoint--neitherpositive nor negative. This reflects mixed feelings as well as disagreementamong the staff. There is considerable concern that too much emphasis willbe put on TPMS results to the exclusion of important job performance factorsnot captured by TPMS scores (60 percent do not believe TPMS emphasizes themost important factors in productivity). On the positive side, 81 percent
IAny measurement, physical or psychological, is only accurate to somespecified degree, and contains some tolerance or error. A band of confidencecan be built around a test score to show the upper and lower bounds of agiven score for a specified reliability and distribution. This band of
*confidence can be calculated by taking a score plus and minus the StandardError of Measurement (SEM). The SEM for this survey, shown in the lastcolumn of table 3-1, reflect that the scores are rather stable.
3-3
.L

think TPMS is bei)g given a fair chance, 69 percent believe tral marpoerresources event.jal ly can be realistically estimated, 61 percent believecwputer resources can be realistically estimated with more experience, and 34percent have seen some positive effects of TPMS (basically in project Dlanninand resource allocation). (in the other hand, 67 percent do itot think it iseasy to understand, 58 percent believe that it is not flexible enough forTRASANA's variety of projects, and 83 percent believe it can be easilymanipul ated.
3.2.5 Fairness
The response on this cluster was the least positive. Fifty percent said TPMSwas not fair (19 percent strongly disagreed with the statement that T! MS isbasically a fair system). Sixty-three percent do not believe divisions havean equal chance, 59 percent do not believe it is objective, and 61 percent donot belive that the most productive individuals will get the best productivityscores under TPMS.
3.2.6 TPMS Understanding
Of the clusters pertaining to TPMS, the response to this one was the mostpositive. It should be noted that this cluster contained items designed toreveal system understanding as well as items asking for staff perceptions oftheir own and their peer's understanding. The items designed to test systemunderstanding showed the staff could be divided into three approximately equalgroups: high, medium, and low understanding. The supervisors had the highestlevel of understanding, and the newest employees the lowest. Now that theactivity has completed a scoring cycle, it is anticipated that understandingof the system has improved considerably since the survey was administered.
3.2.7 Usefulness as a Management Tool
Sixty-four percent indicated they thought TPMS would be a useful managementtool. There is general agreement that management practices have changed as aresult of TPMS (64 percent) and that more planning is now being done (72percent), but only 33 percent believe management practices have improved.Fifty-eight percent believe TPMS is a clear change in emphasis by management,even though 62 percent do not think it will motivate people to be moreproductive.
3.3 GROUP COMPARISONS
3.3.1 Supervisors Versus Nonsupervisors
Mean cluster scores for supervisors and nonsupervisors were comparedstatistically. In every case supervisors had significantly higher (morepositive) scores than the nonsupervisors.2 Figure 3-1 shows the scoring
2These comparisons were made with t-tests. Table C-10 in appendix C gir is the* group means and standard deviation for each cluster, as welt as the c :'ues,
which are are all significant beyond the .05 level.
3-4
U

profile of the two groups. The clusters are shown along the bottom orhorizontal axis, and the cluster mean scores are scaled along the vertical
* axis. This profile analysis shows that supervisors have a consistently morepositive attitude than nonsupervisors on both the organizational and TPMSclusters. The fact that the two profiles are almost parallel indicates thatthe supervisors are not only consistently more positive, but uniformly morepositive as well (there are no group-cluster interaction effects). While itis not surprising that supervisors are more positive about the organization,the near perfectly parallel profiles indicates that supervisors andnonsupervisors have the same relative feelings about TPMS.
6
5 .I
\00,,. ~CLUSTER.E./ \ 1;:
3
,- -- SupervisorNon-Supervisor
2
-I I I I I I I ITRASANA JOB CONTROL GENERAL FAIR- UNDER- TOOL TOTAL
SATIS- OF REACTION NESS STANDINGFACTION WORK
CLUSTER
Figure 3-1. Supervisor/Non-Supervisor Profile Analysis
3-5
- S

3.3.? Other Group Comparisons
a. Mean cluster scores were also compared for persons grouped on thefollowing variables:
O Age
O Time in Federal Servicefli* Time at TRASANA
Grade
O Military/Civilian
O Division
Most of these comparisons revealed no significant differences between groups,but a few interesting trends were discovered.
*b. There was a tendency for those who had been in the organization*longer to have a better understanding of the system, to see the system as less
unfair, and to have a more positive general reaction to TPMS. It should be* recognized that nearly all of the supervisors fall in the grouping or category
that has been in the organization over nine years. The same pattern emergedfor the grade and time in federal service categories, because these groups areessentially the same people.
c. The military staff members tended to be more positive toward TPMS ingeneral than the civilian staff. They were also more inclined to believe the
* system can work and to see it as less unfair than their civilian counterpart.
d. There were some differences among the divisions. The division withthe highest job satisfaction cluster mean (4.72) had the lowest mean score ongeneral reaction to TPMS (3.19) and fairness (2.49), and among the lowest meanscore on usefulness as a management tool (3.27). This same divisior scoredhigh on understanding (4.16). This can be contrasted with the division havingthe lowest job satisfaction mean (3.89), which had much higher scores for
* general reaction (3.63), fairness (3.70), and usefulness as a management tool :(3.87). This division did nct have as high a mean on understanding as thehigh satisfaction division (3.85 versus 4.16). The division with the higherjob satisfaction scores seems to be more contented with the status quo and
* less accepting of TPMS (which is a change) than the division with not as higha level of job satisfaction. The latter is more accepting of TPMS and more
* confident TPMS will be a positive change, possibly reflecting a hope of betterthings to come.
Imp 3-6
3.4 RESPONSE TO FIRST OBJECTIVE
3.4.1 Objective 1: To determine how the TRASANA Technical Staff (TTS)perceives TPMS.
a. Study Question 1: What is the TTS general attitude toward TPMS?
The overall reaction to TPMS was mixed. There was considerable concern anduncertainty. One concern was that some staff members manipulate the systemrather successfully and thereby achieve higher productivity indexes (PI) thanothers who are just as productive, but do not "play the system" as well.There was rather deep concern about how the results will be used - especiallythe individual PI - and the resulting effect on morale and the spirit ofcooperation so highly valued at TRASANA. Another concern was that TPMS mayresult in a long term decline in the willingness to take on high risk projects
and to try to develop new methodologies. On the positive side, the detailedplanning for all projects was seen as very positive, the majority thinkresources can be realistically estimated with more experience, and one-thirdreported that they had seen some positive effects of TPMS during its firstyear.
b. Study Question 2: What is the perceived motivational impact ofTPMS?
Over half of the staff do not think TPMS will motivate people to be moreproductive, but they are evenly divided on whether TPMS will lead to a longterm productivity increase. These results reflect the reality that TPMS willnot have the same impact on all people. What the total impact will be dependsto some extent on how the system is changed to maximize the positive andminimize the negative factors.
c. Study Question 3: Is TPMS seen as a viable managerial tool?
Yes. This was seen as the most positive aspect of TPMS. In particular, thedetailed planning required for all projects in the form of the project planwas seen as very useful.
3.4.2 Organizational Climate
The TRASANA staff feel very positive about the organization, see their work aschallenging, and like the high standards of TRASANA. There is a concern feltby both supervisors (division and branch) and staff that TPMS may have adetrimental effect on the spirit of cooperation and on the willingness of thestaff to take on the very difficult and risky projects that in the past havebeen welcomed as a challenge.
3-7

CHAPTER 4
1K FINDINGS: FIRST YEAR RESULTS
This chapter presents the data collected to achieve the second studyobjective: to determine the degree to which TPMS is a meaningful measure ofproductivity. The following study questions for this objective are answered:
0 To what extent do TPMS ratings agree with confidential supervisoryproductivity assessments for individuals and branches?
oDoes TPMS have generally the same impact on the different TRASANAorganizational divisions?
0 Whiat are the functional relationships among the scoring algorithmvariabl es?
oWhat is the operational impact of the Productivity Measurement Board(PMB) and Product Review Board (PRB)?
The first step in this effort was to capture all of the first year scoringresults. These data are presented for the sixty-one scored projects, as wellas by TPMS scoring factor. The productivity index (P1) for individuals andorganizational units (branches, divisions) is examined, the individual P1evaluation analysis is presented, and scoring problems revealed from analysis
- of the first year scoring data are discussed. The analysis of the TPMSfunctioning components addresses the Product Review Board and Productivity
* Measurement Board. The results of the mathematical analysis of the TPMSscoring algorithm are in this chapter. Since the mathematical analysis issomewhat technical and requires basic familiarity with mathematics and erroranalysis techniques, it is in appendix E.
4.1 FIRST YEAR SCORING RESULTS
4.1.1 Scoring Results by Project
Table 4-1 shows the project scores (PS) for the 61 projects which werecompleted and scored between 1 October 1980 and 30 June 1981. The highest was?.376 and the lowest was 1.046. The mean project score was 1.681 and thestandard deviation was 0.258. The maximum possible PS is 2.614, and theminimum is 0.504. The baseline score for a project on time, on resources, andof average quality (defined as 1.3) is 1.56. The score assigned to theprojects on each scoring variable and the productivity points (PP) earned alsoare shown in the table.
4.1.2 Manpower Scoring Results
The manpower utilization factor (R) is scaled as a piecewise linear increasingfunction of the ratio of planned (Rp) to actual (RA) manpower for the project.It has 0.7 as the lower limit and 1.2 as the upper limit value. A detaileddiscussion of the scoring algorithm is in appendix E.
4-1

TABLE 4-1
FIRST VEAP SCnpIr,1 PFSWITSI PROJF(T P T Qp , p
P j I
11.n46 6.50 q.1? f). I 1.0) (.R 1.24 0 .2 I .IP4 12.0 n q 1.07 1. I .. 7 n I n. I 1. 643 I .?36 3.60 3.33 1.030 I 1.n In. 1.25 4.124 F 1.271 q.o n p2.16 i 0.26, 1.0 1.0 I,2 F 16.71i5 1.320 1.75 2.7F n*P:3 1.0 n. I .)3 ." 1.370 12.00 12.46 n.0IR n0 1.n. 3.n9 :
F 7 1.370 2.0 i 23.7 I .Q0) 1.0 i.v1. 14(. 3.60 12.02 n.qor 1.0 1.0 1.30q 1.417 14.00 11.02 I .R 1.0 I .P I 1,36 .in 1.131 2. F, 16.94 Q4qN 1.n 0. 1.35 -I. jw
I 1.44 i .20 I1.9q5 1..0a 1.0 1 1.3, 1.77,12 1.457 2. F 6.71 1 1.nP4 1.0 I .R I 1.40 0.7p13 1.4R2 11.50 14.76 0..015 1,0 1.0 1.35 21.PRi14 1.405 16.77 12.33 1.10")6 1.o n.8671 1.30 iR.44!15 1.525 74.00 15.7n 1 l.n26 1.n 1.0 1.17 23.94i16 1.532 35.50 13.63 1,200 1.0 0.8 1.33 F 20.82
I 17 1.545 19.25 20.n4 0,990 1.0 1.0 1.30 3n.q6I2I 1,554 92.0n 97.92 n.981 l.n 1.04 1.27 152.20;
19 1.560 74.0n 6Q.12 F 1.040 1.0 1.0 1.25 1n7.832n 1.563 37.25 3.91 0.97 1.n I .20 60.pI21 1.575 A.00 R.76 0.q72 1.0 1.0 1.35 13.7922 1:593 10.00 9.86 1.006 1.0 1.1 1.2n 15.713 1. 6on 5.00 2.37 - - - 3.7c
24 1.616 2.00 1.31) 1.122 1.0 1.0 1.20 2.25125 1,626 6P., 61.28 1 1.042 10 1.0 1.30 Qq,6326 I 626 7,qO 8. 30 1.050 1 0 1.0 1.n2 13. r3I 68:2 1. ~
27 1.630 6,0n 3.89 1.140 n.9 1.,l- 1.2n 6.3428q 1.3 F4o 33. 70 1F 1.004 F 1 n 1 1. 3r) U 7I?q 1.64n 13, on 12.02 -I,.02 1,0 1.N l 1 36 21.1i.10 1.643 35.00 32.77 1.o25 In IlnR6l 1:23 53.P9131 1.644 76.00 115.11 l.no ln 1.0 1.037 1129.2432 16So 2.7n 21. Jn 1In 1.40 4.6633 1.660 37.00 37,26 0,998 1.0 1.0271 1.35 1 61.P5134 1.668 12.00 11.86 1.010 1.1 1,0 1,25 19,4PI35 1.668 10.on 7.20 1.110 1.N 10 1,25 12nl36 1,680 21; 1.23 1.200 l.n O.q 1.30 2.n737 1.702 125.00 111.51 1.04d3 1.n I1.0 1.36 189. 793 2 2.nq 1.10 1.0 l.n 1.30 3.5939 1.724 6.75 5.40 .nRN 1.0 1.0 1.33 9.31i
4 40 1.754 4.50 3:75 1.067 1.0 1.N 1.37 6.5841 1.773 10.00 6.58 1.137 1.n 1.0 1.30 11.674? 1.785 18.N 15.86 1.026 1.0 1.0 1.37 28.31!43 1.8no 11.20 4.40 1.200 1.0 1,0 1.25 7.?244 1.,20 13.00 10.75 1.069 1.0 1.0 1.4? l.2 0
4, 1.85n 18.N 12.R 1.078 1.0 I 1.1 1.30 23.821577 1 1.0?46 1.873 63.00 5774 1.0 7 1.30 J11R.14
4-2
I

TABLE 4-1 (Continued)
PROJECT PS Rp R A R C T PP
47 1.890 10,.00 8.01 1.080 1.07 1.01 1.35 15.1548 1.909 2.55 0.96 1.200 1.0 1.02 1.30 1.8349 1.914 8.00 7.72 1.000 1.074 1.1 1.35 14.7850 1.920 2.50 0.64 1.200 1.0 1.0 1.33 1.2351 1.923 14.50 7.71 1.187 1.0 1.0 1.35 14.8352 1.930 44.00 33.84 1.044 1.0 1.1 1.40 65.2753 1.936 6.00 4.08 1.128 1.0 1.1 1.30 7.9054 1.954 2.70 1.60 1.163 1.0 1.0 1.40 3.1355 2.059 9.00 2.74 1.200 1.1 1.0 1.30 5.64
- 56 2.076 9.00 4.80 1.187 1.02 1.1 1.30 9.9757 2.095 15.60 9.56 1.155 1.1 1.057 1.30 20.0358 2.096 1.50 0.84 1.176 1.0 1.1 1.35 1.7659 2.104 11.26 6.65 1.164 1.0 1.1 1.37 13.9960 2.138 16.00 4.49 1.200 1.0 1.1 1.35 10.6761 2.376 1.20 0.10 1.200 1.0 1.1 1.50 0.24
MEAN 1.681 19.76 17.95 1.063 1.008 0.997 1.309 29.36
a ST DEV 0.258 25.43 25.36 0.093 0.031 0.083 0.069 41.87
NOTE: Not all scores are shown to the same number of significant digitsbecause there was variation in the officially recorded scores.
KEY: PS-Project Score R-Manpower Utilization Q-QualityRp-Planned Manpower C-Computer Utilization PP- Productivity PointsRA-ACtual Manpower T-Timeliness
0Ia. The R factor results for 60 projects are shown in histogram form in
figure 4-1.1 The planned manpower ranged from 1.2 to 125 technical man months(TMM) with an average of 19.8. The actual manpower utilized varies from 0.1to 115.11 TMM with an average of 17.9. Values for R ranged from 0.861 to themaximum allowable score of 1.2. The average was 1.063 and the standarddeviation was 0.093. Twenty-five percent of the projects received an R scoreof approximately 1.0, which means the RA was equal to the Rp. Two thirds ofthe projects had an R value greater than 1.0, which means they received a
IAs shown in table 4-1, one project did not have scores on R, T, Q, or C.
4-3

15-1
14 -13
12.* 12
NUMBER1.
OF9=
PROJECTS
7.-,I
6.-
5_
4-
-16 2..
* .80 .85 .90 .95 1.00 1.05 1.10 1.15 1.2
R
Figure 4-1. First Year Scores for Manpower Efficiency (R)
4-4
.U

U7-
"bonus" for RA being less than Rp. Thirteen percent of the projects receivedthe maximum R score of 1.2. To achieve the maximum R value, RA must be lessthan or equal to one half of Rp. For the eight projects achieving the maximumR score, Rp varies from 2.033 to 12.0 times RA.
b. If manpower estimates were reasonably accurate, the R distributionwould be symmetrical around a mean of approximately 1.0, or most projectswould have RA approximately equal to Rp, with as many projects falling underas over the estimates. The probability that 43 of 60 projects (72 percent)would be under the estimated manpower requirement, assuming accurateestimations, is approximately 0.0004, or 4 times in 10,000. It can only beconcluded that Rp was consistently overestimated.
c. There were several factors driving the consistent tendency toestimate required manpower high. Such accurate estimating as required by TPMS
* was new to the staff, and it takes some experience to get good at such a* difficult task. Even with practice, estimates for complex, risky projects can
never be completely accurate. When this is considered along with the factthat TPMS rewards overestimating with higher project scores, and therefore
* tends to punish either accurate or underestimating with lower scores (lessreward), the driving force for overestimating becomes clear. The only
* explicit punishment in this function is for substantially uncerestimatingmanpower requirements which results in earning points below the base level of
d. There are two system checks on Rp. Before a project plan can be* entered into TPMS for scoring, the responsible division chief must show that
his total manpower committed for all approved projects is not more than 125percent of available manpower (125 percent rule). The other check is that theproject plan must be reviewed and approved by the PMB. The purpose of thisreview is to check for realistic and accurate resource estimates andschedules. These two checks were not effective in controlling the manpowerestimates.
4.1.3 Product Timeliness Scoring Results
When a project plan is submitted to the PMB for approval , it must contain aproposed schedule for scoring. When the project is completed (includingeither a 0 score of 1.3 or higher or PRB approval for relea~e), a score is
* assigned based on the relationship of the actual completion date to theplanned completion date. The values for this variable are 0.8 to 1.1, with0.8 being the lowest score for being late and 1.1 beinq the hiqhest possiblescore for completion ahead of schedule.
a. The distribution of the timeliness (T) scores is shown in figure* 4-2. Thirty-two of the 60 projects (53 percent) received a score of 1.0,
which means they were delivered exactly on schedule. Six (10 percent)received the minimum score of 0.8 and 11 (18 percent) received the maximumvalue of 1.1. The mean T was 0.997 with a standard deviation of 0.083. Ten(17 percent) were late, and 18 (30 percent) were delivered ahead of schedule.
V 4-5 ~

36--
34
3ZT26}
2±
2
NUMBER
O F 2U10
PROJECTS
4.
.80 .85 .90 .95 1.00 1.05 1.10 *
Figure 4-2. First Year Scores for Timeliness (T)
4-6

h. One reason for the larqe numher of proiects heinn delivered onschedule is external deadlines. In many cases the reports are of lirited
r value if not availahle to decision makers hv a specified date, even if thescone of the analysis ,oust he reduced. In such cases, the project scope musthe tailored to the deadline and the report published nn time.
4.1.4 Product fuality Scorinq Results IWhen a project is completed, the Product Review Roard (PRR) convenes to review
the product qenerated byv the project. This product is typically a repnrtwhich is distrihuted to the hoard nemhers in advance. The three permanentboard memhers assiqn a product quality score (0) that can ranqe from 1.0 to1.5. A minimum score of 1.3 is required for the report to he released fordistribution outside the activity. Reports achievinn a 0 score of less than1.3 require revision before release. The n score for the product does notchanqe as a result of PRR required revisions.
a. The histoqram in fiqure 4-3 shows the distribution of the 60quality scores for the first year. The distrihution is neqatively skewed witha mean of 1.30q and a standard deviation of (.06q. The scores ranqed from1.15 to 1.5. Seventeen scores (22 nercent) were helow the estahlished minimumscore for release (1.3). This means that the PRR required suhstantialrevisions or "pnlishinq" on over one-fourth of the products. This qualitycontrol function of the PRR thus had a major impact durinn this nine monthperi od.
/ h. The PRR was not new with TPMS, hut assiqninq numerical scores was.
It has lonq heen recoqnized as a need because of the hiqhlv technical natureof the analysis performed hy TRASANA which must typically he documented in arenort understandable hy readers who often do not have the traininq necessaryto interpret a very technical report. This requirement to present a larqeamount of data and complex analyses in relatively non-technical terms accountsfor many of the scores below 1.3. 9
c. The quality score is the only variable in the TPMS scorinq function
which is totally independent of the project team. While the team is presentdurinq the review and actively interacts with the hoard, the hoard decides the
score. The fact that 0 is independent of the team would seem to make thisfactor a candidate for heavier weiqhtinq in the PS; however, there are three
6 formidable oroblems with 0: (1) adverse morale impact, (?) historicaldifficulty in achievinn hiqh reliability for such scorinq tasks, (3) theinability of a few individuals (any individuals) to be thorouqhly knowledne-able of all the relevant issues and prohlems involved in conductinq the larqenumher of diverse projects typical for a year at TRASANA.
""pqo o ,ho qp?)Pd a7. PPR3 loav~d cha rr'v'on 47zra'q t1 'e .,'rst qcyzv' oaq
nt)~~uponl 171.g Ieezatiare ' om 7'RAqAAA sginort~u after ,- 1 "oij'qt s,',ovinnmr'r'i oo onded. Tt ?das 'iq conZiaqon th7at 0,'.q d~aq t'?,- can.-
4-7
0 m mm - m m t.W

13q+28-
26-
24-
2?
16-NUMBER
OF12-
PROJECTS
1
1.15 1.20 1.25 1.30 1.35 1.40 1.45+
Q
F Figure 4-3. First Year Scores for Quality (Q)
4-8
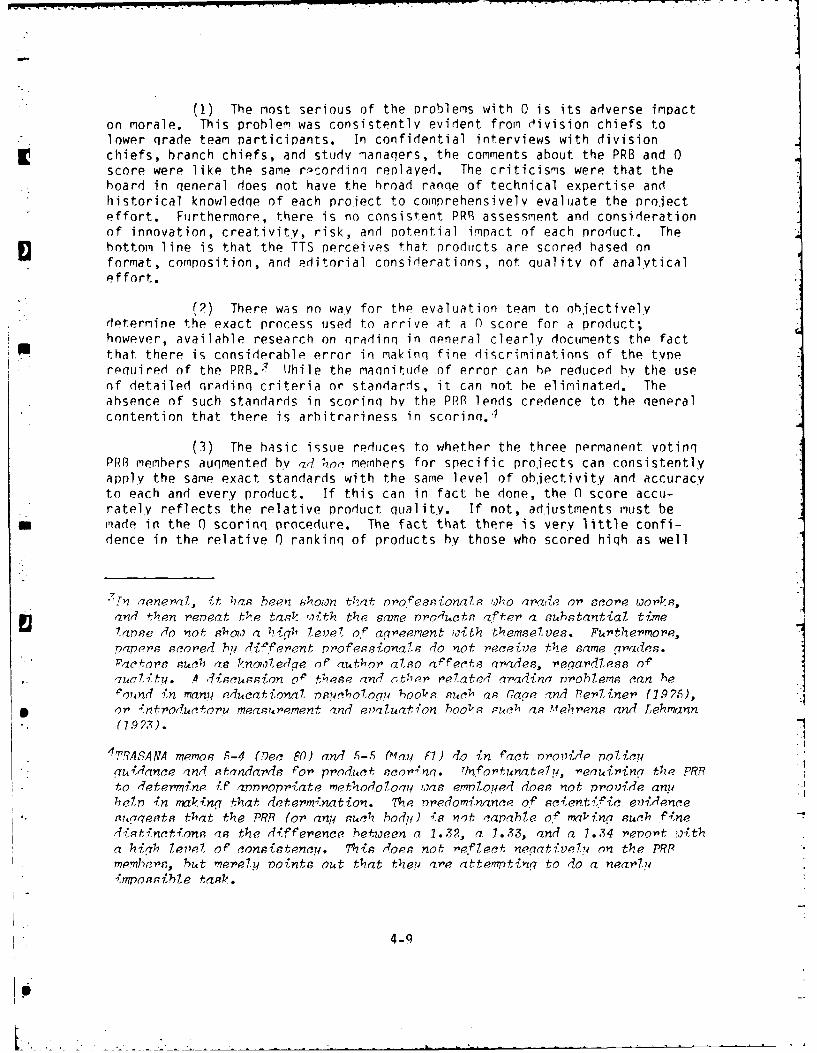
(1) The most serious of the problems with 0 is its adverse impacton morale. This problem was consistently evident from division chiefs tolower qrade team participants. In confidential interviews with divisionchiefs, branch chiefs, and study manaqers, the comments about the PRB and 0score were like the same rpcordinn replayed. The criticisms were that thehoard in qeneral does not have the hroad ranqe of technical expertise andhistorical knowledqe of each project to comprehensively evaluate the project
effort. Furthermore, there is no consistent PRR assessment and considerationof innovation, creativity, risk, and potential impact of each nroduct. Thebottom line is that the TTS perceives that products are scored based on
format, composition, and editorial considerations, not quality of analyticaleffort.
(2) There was no way for the evaluation team to ob,iectivelydetermine the exact process used to arrive at a n score for a product;however, available research on nradinq in neneral clearly documents the fact
that there is considerable error in making fine discriminations of the typerequired of the PRB. .3 While the mannitude of error can he reduced hv the useof detailed nradinq criteria or standards, it can not he eliminated. Theabsence of such standards in scoring by the PRR lends credence to the qeneralcontention that there is arbitrariness in scnrinq.'4
(3) The basic issue reduces to whether the three permanent votinqPRR members auqmented hy ad hoa members for specific projects can consistently
apply the same exact standards with the same level of objectivity and accuracyto each and every product. If this can in fact he done, the 0 score accu-rately reflects the relative product quality. If not, adiustments must be
i made in the 0 scoring procedure. The fact that there is very little confi-dence in the relative 0 rankinq of products by those who scored hiqh as well
i7
I'n aener'a7, it has been shown that 1oes.qiona.q oho aradl or score works,and then reneat the task ,ith the same nroquctp after a sustantial timelapse do not sho, a high level of agreement iith themselves. Furthemore,papors scored b ' diferent pnrofesiona'is do not receive the same grades.
' Pactors such as kno?), ede on author aTso affects qrades, peqard7ess orai~aitu. A discussion o these and -ten ?elated aradina problems can he
Pound in manu educational rns ychol.ogn boot' Ruch as Gage and Perliner (1975),* or introductoru measurement and evaluation hooz'.q -ub as Mehrens and Lehmann• (7.97,3).
4 7RASANA memos 5-4 (Dec 0) and .5-5 (lay ) do in fact rovide polUCu jquidlance and standards for product scor'nq. Unfortunately7, reauiring the PRB
to determine !F appropriate methodo~oay was emnlo!upd does not orovide anyherp in making that determination. The nredominance of scientific evidenceM4suqests that the PRP (or any Ruch bod?/) is not capable o.f maZing such finedistinctions as the difference between a 1.32, a 1.33, and a 1.34 report witha hiah 7et'el. of consistency. This does not reflect negativeu on the PRPmembers, but merely roints out that tlzeu are attempting to do a nealHu
impossible task.
4-q

as low, and by nearly all of the supervisors in the organization, makes astrong case for revised procedures, even if only for employee morale. This iseven more evident when it is realized that the only project to score 1.5 wasnot an analytical effort, and produced neither a report nor a briefing to bescored .'
4.1.5 Computer Efficiency Scoring Results
The computer efficiency factor (C) score is computed in a manner similar tothe R score. The values for C range from 0.9 for underestim.ting computerrequirements to 1.1 as the maximum efficiency score. Of the 60 projectsreceiving a C factor score, 51 scored 1.0, two were below 1.0 and seven wereabove 1.0. One project received the minimum score of 0.9, and four themaximum score of 1.1. This factor was relatively unimportant in the scoringbecause the unit of mneasure changed during the scoring period from centralprocessing unit (CPU) to standard unit of processing (SUP). Since mostproject plans estimated computer requirements in CPU's, and there is no directCPU-SUP conv,?rsion, the majority of projects were assigned the C score of 1.0admini stratively.
4 4.1.6 Priority Factor Scoring Results
The priority factor (P) was included in the scoring formula as an incentive tostrive for products meeting the needs of customers external to TRASANA. Avalue of 1.2 is assigned to all projects conducted in support of externalcustomers, and all internal projects are assigned a priority that can varyfrom 1.0 to 1.2. This factor did not work well. The PMB was unable to findan equitable way to assign priorities. The P score thus became a constantvalue equal to 1.2 for all projects.
4.1.7 Project Score Results
a. The distribution of the 61 project scores for the first year ofTPMS is shown in figure 4-4. The minimum possible PS is 0.504 and the maximumis 2.614. The negatively skewed distribution shows that projects tended toexceed the base score value of 1.56 (1.3 Q score and on planned resources andschedule). The mean score was 1.681 and the standard deviation was 0.258.One project received the base score, and 42 (69 percent) projects scored abovethe base score.
b. Table 4-2 shows thie relative effect on the PS of the same unitchange (0.1) in the Q, T, R, and C factors. The effect of the increase isless for the Q factor than for the other factors. This is because the Q scalehas a greater range than the other factors, so a 0.1 change has less impactthan it does on the more compressed range values. The proper strategy formaximizing PS is not to concentrate on Q, but to concentrate on T. R, and C.
5This pro ject was monitoin.g of the instatlation of smoke detectors inTRASANA. The next highest score was 1.42.
4-10

U 1
14.
* 13.
12
1.
NUMBER 1_
OF 9_
PROJECTS 8_
-m 7.__
6_
D 4_
3-2--1.0 1.1 1.2 1.3 1.4 1.5 1.6 1.7 1.8 1.9 2.0
PS
Figure 4-4. First Year Project Scores (PS)
4-11
p
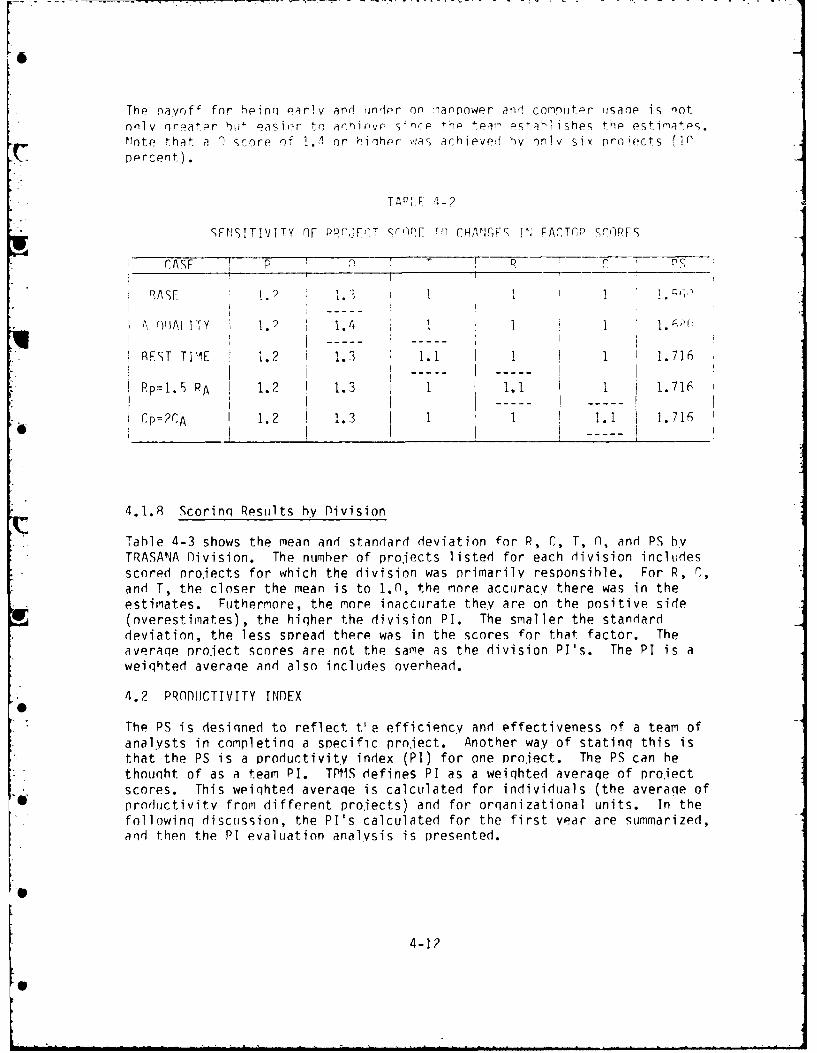
The Payoff for heinq oariv and jndpr on :iannower and corpuit:r :sane is notnnl v nroatr etil eaSier to anrivP -,inr e tea" e-tahlishes thp estimates.Note that a n score of I. or hioher v:as achieved hv only six pro icts InE percent).
UFTAP. -
RES ,T I ,.E - , . . 1
SFENSITIVITY OF PnrfJFr T £rCO[ tO{- CHAIUJFS ['; RACTrp ScOOFS
I CASE r p 2 T r _________
BASE 11? . i : ':,
tOAI . 1. 4 1 1 1 i. A; h
I REST TIldE 1.2 1.3 1.1i 1 1 1.716
PP=1. 5 PA 1.2 1.3 1 1.1 1 1.716
ICp=?CA 1.2 I1.3 I 1 1 1. 1 1.716
4.1.8 Scorinq Results by Division
Tahle 4-3 shows the mean and standard deviation for R, C, T, n, and PS hvTRASANA D3ivision. The number of projects listed for each division includesscored projects for which the division was primarily responsihle. For R, C,and T, the closer the mean is to 1.n, the more accuracy there was in theestimates. Futhermore, the more inaccurate they are on the positive side(overestimates), the hiqher the division PI. The smaller the standarddeviation, the less spread there was in the scores for that factor. Theaveraqe proiect scores are not the same as the division Pl's. The PI is aweiqhted averaqe and also includes overhead.
4.2 PRODUCTIVITY INDEX
The PS is desinned to reflect tie efficiency and effectiveness of a team ofanalysts in completion a specific project. Another way of statinq this isthat the PS is a productivity index (PI) for one project. The PS can hethouqht of as a team PI. TPMS defines PI as a weiqhted averaqe of projectscores. This weiqhted averaqe is calculated for individuals (the averaqe ofproductivitv from different projects) and for orqanizational units. In thefollowinq discussion, the P1's calculated for the first year are summarized,and then the PI evaluation analysis is presented.
4-12
S

TARLE 4-3AVERAGF PROJECT Arin FACT0P sCnPE RY r)1IVSInJ
IV1SIOT PROJFECTSl R C 0 PS
A6 1.I19 I .qR3 1.290 1 1.571(.0q3) (0) (.0q9 ) (.0ql) (.353)
R 10 1.07P 1 I.n?9 1.303 1.736I (.062) (0) 1 (.046) 1 (.068) (.185)
C 10 1.07P 1.029 1.n09 1.292 1.742(.022) (.n44) (.101) (.044) (.29n)
1.04q .QR6 .qq5 1.287 1.583* .1£ (.035) (.oq ) (.0156) I (.210I)
F 12 l.no 1.008 .97r)- 1.352 1.744(.1n3) (.n29) (.oq7) I (.066) (.294)
F 2 1.n9 1 .950 1 1.30 1.615(.156) (0) (.071) (.071) (.261)
3 1.071 l.n5n I.n35 1.25 1.696(.072) (.071) (.n49) (.n71) (.153)
H 9 1.015 i 1.8 O) .qq 1.317 1.62Q(.n77) (.023) (.n70) (.OR5) (.26n)
TOTAL rnO 1.063 1.002 .gq7 1.309 1.681_ (.093) (.n31) (.0 I) (.n6 9) (.259)
qOf)'T: rhP too number in the tahZe i, the me.7.zn 7)(77, aMzn the nr m-r' itnnao,ntheses i.q the standarl deviaton.
4.2.1 Individual PI Results
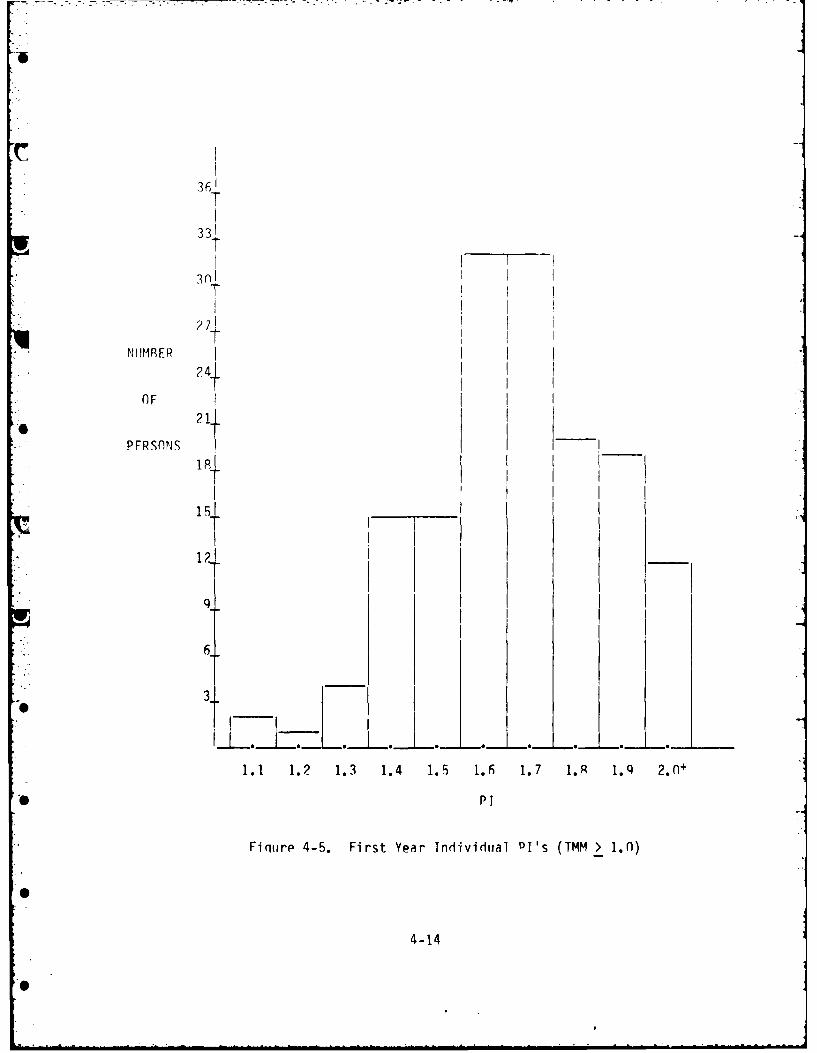
a. Fiqure 4-5 shows the distrihution of individual PI's for the firstscorinq period. Only PI's includinq at least one man-month are included.
* This was necessary to eliminate spuriously hiqh P1's that were primarily anartifact of system start up. For example, one individual received 0.11productivity points on O.07 TMM, and also collected 2.0 discretionary points(nP). The resultinq PI of 30.14 was unrealistically inflated hecause theindividual only charqed a fraction of a month to scored projects. Inflatedand unrepresentative PI's emerqed in several instances because projectsinitiated under TPMS were not completed by the end of the first scnrinqperiod. This situation should occur less frequently in future years, sinceall projects will he covered by TPMS, and therefore the number of people notworkinq on scored projects in any year should decline. There were 152 personswith P1's meetinq the one TMM charqed to scored proiects criterion. The meanof the distribution was 1.6F9 and the standard deviation was 0.27?. Thevalues ranged from 1.09 to 3.49.
4-13
6'
•3 F• T
331
?1--r I
NIIMRFR I.. 24+ _2~ 4I
OF
PFRSnNS tiR1
6 -- _____
1.I1 1.2 1.3 1.4 1.5 1.6 1.7 1.8 1.9 2.0+
t _
4-14
09
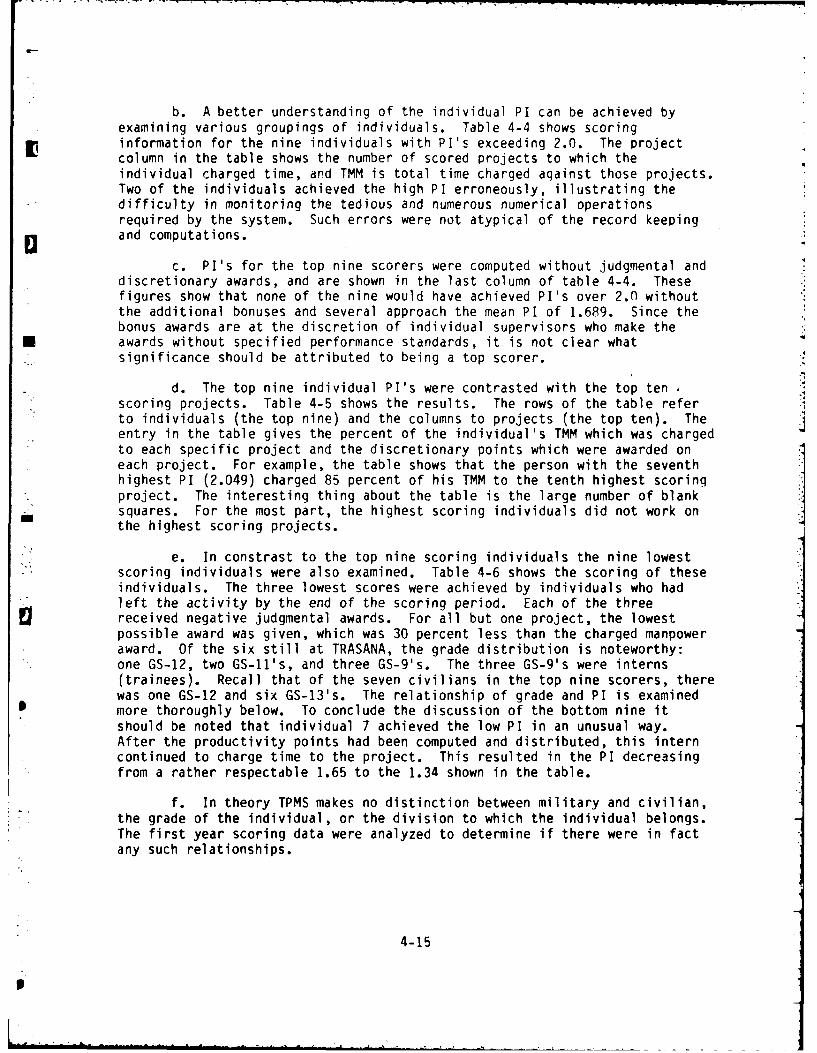
b. A better understanding of the individual PI can be achieved byexamining various groupings of individuals. Table 4-4 shows scoringinformation for the nine individuals with P1's exceeding 2.0. The projectcolumn in the table shows the number of scored projects to which theindividual charged time, and TMM is total time charged aqainst those projects.Two of the individuals achieved the high PI erroneously, illustrating thedifficulty in monitoring the tedious and numerous numerical operationsrequired by the system. Such errors were not atypical of the record keepingand computations.
c. PI's for the top nine scorers were computed without judgmental anddiscretionary awards, and are shown in the last column of table 4-4. Thesefigures show that none of the nine would have achieved P1's over 2.0 withoutthe additional bonuses and several approach the mean PI of 1.689. Since thebonus awards are at the discretion of individual supervisors who make the
* awards without specified performance standards, it is not clear whatsignificance should be attributed to being a top scorer.
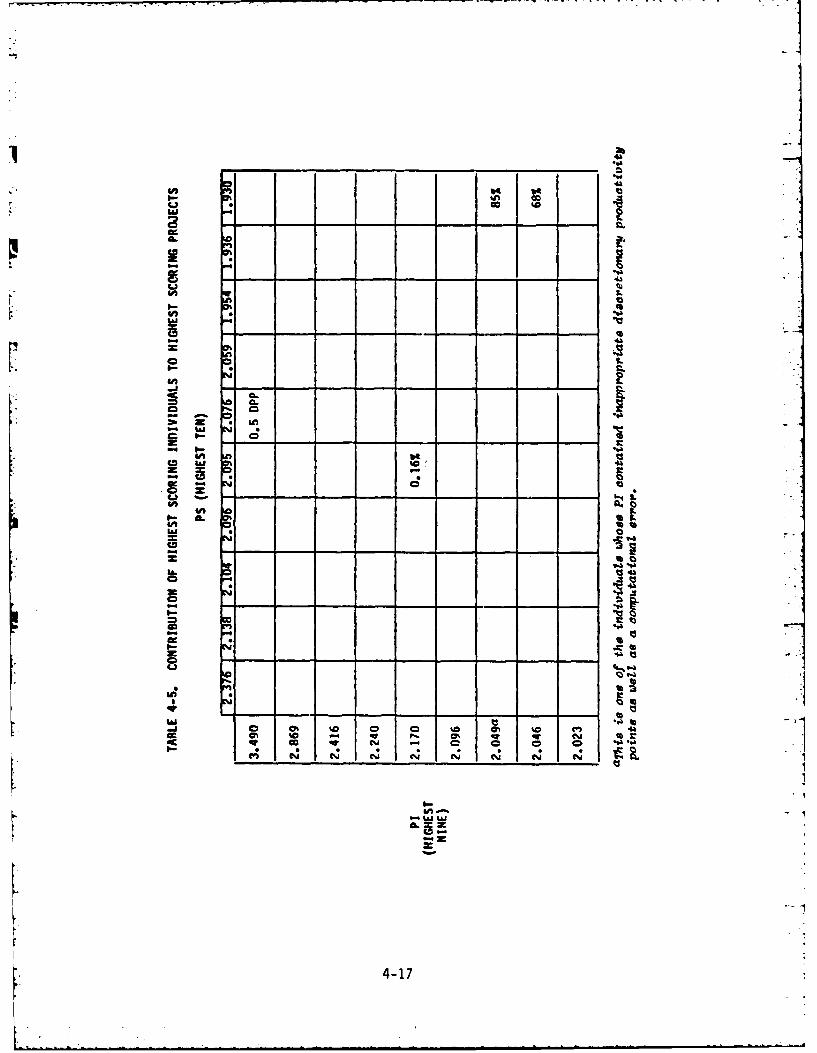
d. The top nine individual P1's were contrasted with the top tenscoring projects. Table 4-5 shows the results. The rows of the table referto individuals (the top nine) and the columns to projects (the top ten). Theentry in the table gives the percent of the individual's TMM which was chargedto each specific project and the discretionary points which were awarded oneach project. For example, the table shows that the person with the seventhhighest PI (2.049) charged 85 percent of his TMM to the tenth highest scoring
* project. The interesting thing about the table is the large number of blanksquares. For the most part, the highest scoring individuals did not work on
im the highest scoring projects.
e. In constrast to the top nine scoring individuals the nine lowestscoring individuals were also examined. Table 4-6 shows the scoring of theseindividuals. The three lowest scores were achieved by individuals who hadleft the activity by the end of the scoring period. Each of the threereceived negative judgmental awards. For all but one project, the lowestpossible award was given, which was 30 percent less than the charged manpoweraward. Of the six still at TRASANA, the grade distribution is noteworthy:one GS-12, two GS-11's, and three GS-9's. The three GS-9's were interns(trainees). Recall that of the seven civilians in the top nine scorers, therewas one GS-12 and six GS-13's. The relationship of grade and PI is examined
* more thoroughly below. To conclude the discussion of the bottom nine itshould be noted that individual 7 achieved the low PI in an unusual way.After the productivity points had been computed and distributed, this interncontinued to charge time to the project. This resulted in the PI decreasingfrom a rather respectdble 1.65 to the 1.34 shown in the table.
f. In theory TPMS makes no distinction between military and civilian,the grade of the individual, or the division to which the individual belongs.The first year scoring data were analyzed to determine if there were in factany such relationships.
4-15
P

F. 4- L A
1t en 0 6n 10 10 0 D 0 f-
%C o cc %- tz %a c co f-
0 to- ~~.,
C7 qw 01c q 0 0 0
fn*a f V C I * Y C:4'.L f
It
0 ~ ~ ~ ~ ~ I 0 10 010~~Q 9
C4 N0 0 ID o"~6~ *T
-b WD h
CO
W6 9L 4'I : ! I
w I-
* I--~ Lt
ac uuj ua f No N' N 10 10 rn M 01 1-
t 4-16
0 CL
o go
CR.
C4 cz ey* % ~
C Iw C
a -4-17

m - -C 1= CD--m cCc ON to
I'IL
01 r0) C, C: r4 4-0) (7 - Oc Cs C\i o cc to t) -
C:) C\J q) '~ ' ~
(NL C) C=) C C C 0 C) CD C) w q
0-)
C C C) C C) a C ' CD IL
C'i (0
z~ = -o m o~ CD C 0 0 2
II-
C* w 0 Q 04 3
Uo ~to
2 - c% 'zz to
100
U.-
4-4 0Li
In -4-4O
-c to.V)L CD
en~~~ ~ t qton % r o a
44to V 2-%4
- - (N.4 18

(1) Table 4-7 shows the comparison data for military and civilianPI's. There was no difference in the treatment of military and civilians hyTPMS.
TABLE 4-7. COMPARISON OF !AILITARY AND CIVILIAN PI
I CATEGnRY 1 ri 1 MAN 1 STANnAR m MINIMUM 1 MAXI!MIIM___II Pl I nFVIATION _ _ _
MILITARY 29 I 1.66 0.?? 1.n02 I 2.Oq6
CIVILIAN 123 ] 1.70 n.20 l.nq4 I 3.4-I Iff _ _ _ _ I _ _ I I _ _ _
(2) The PI summary data for three civilian qrade cateqnries are intable 4-8. These data show a relationship between qrade level and individualPI. There was a statistically siqnificant difference between the GS-7 to 11qroup and the GS-13 qroup. 7 Either the PI is measurinq a real difference inproductivity hy qrade level, or there is a difference in the treatment ofqrade levels in the application of TPMS.
TABLE 4-8. COMPARISON OF PI BY CIVILIAN GRADE
I L5 LEVEL N MEAN STANDARD MINIMIIM I MAXIMIIM_ __PlI DEVIATION _
I 7 - 1I 25 1.57 .22 1.0 l 1.98
12 43 1.6R .19 1.39 2.24
13 49 1.77 .39 1.40 3.49
"qhin compawison was made b7, t-tert; t O.P2, T = .,536.
7The ntatstcal test applied was AnaZ7?sis of Variance (ANOVA); ' = 4.237,P < .02. The multipTe ranee test applied ?,,ao .ce'% at the .n5 leveZ.
4-19

(3) Table 4-9 qives the individual P1 comparisons by TRASANAdivision. GS-14's and 15's are not included because their P1's are primarilybranch or division PI's. Statistical analysis revealed no significantdifferences among division mean P1's.8 There was no advantage as far asindividual PI goes to being in any one of the eight divisions.
TABLE 4-9. COMPARISON OF PI RY DIVISION
(Civilian - GS-13 or Lower)
DIVISION NT EN SADR MINIMUM MAXIMUMF " " DEVIATION . . . .. ... . . . . . . .. . .
A 19 1.65 0.25 1.09 i 2.10
B 17 1.70 0.11 1.56 1.97
C 18 1.71 0.21 1.40 2.24
D 13 1.68 0.12 1.54 1.85
E 13 1.84 0.62 1.40 3.49
F 7 1.64 0.39 1.40 2.42
G 12 1.71 0.23 1.38 1.87
H 19 1.63 0.24 1.29 2.05
TOTAL 118 1.69 0.29 1.09 3.49
4.2.2 Individual PI Evaluation Analysis
The extent to which the individual PI reflects productivity can only bedetermined by comparing the PI results with an independent productivitymeasure or criterion measure (CM). The results of the P1 evaluation analysisare presented next. Since CM data are sensitive and were collected under theagreement with branch chiefs that the data would remain confidential , the data
* presented are summarized sufficiently to avoid the possibility of individualor branch identification.
* 8This comparison was by, ANOVA, F =0.749, P =0.63.
4-20
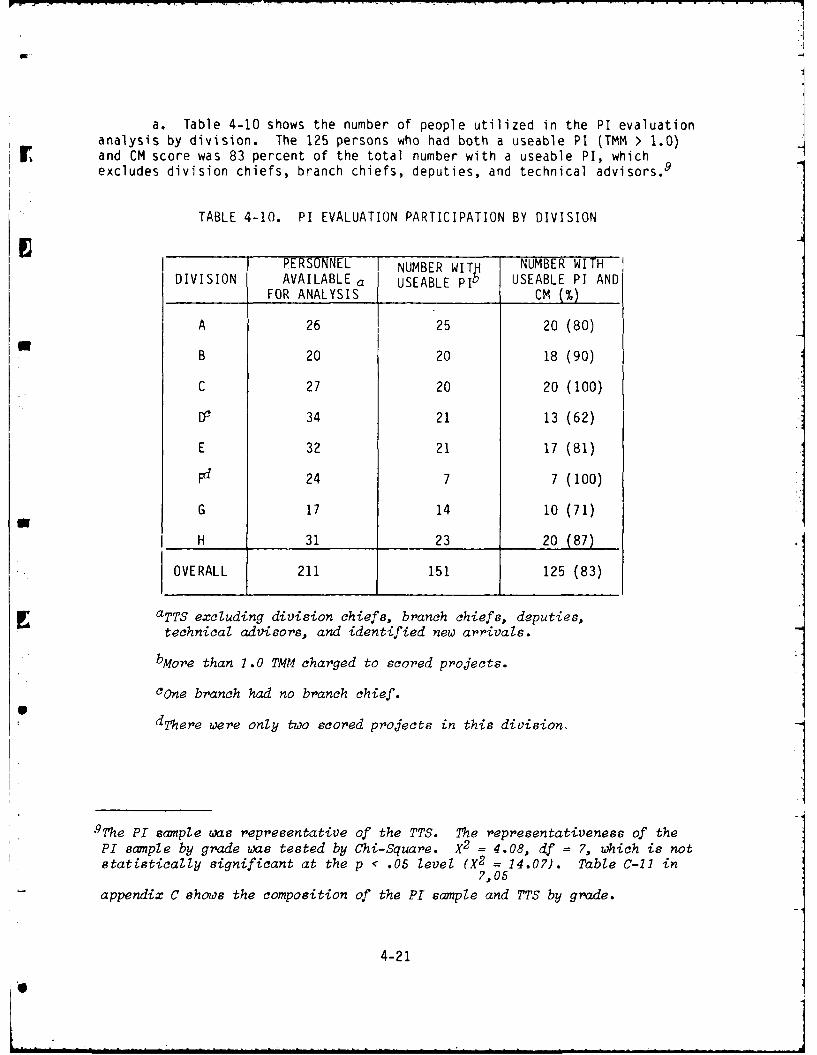
a. Table 4-10 shows the number of people utilized in the PI evaluation
analysis by division. The 125 persons who had both a useable PI (TMM > 1.0)rand CM score was 83 percent of the total number with a useable PI, whichexcludes division chiefs, branch chiefs, deputies, and technical advisors.9
TABLE 4-10. PI EVALUATION PARTICIPATION BY DIVISION
PERSONNEL NUMBER WIT NUMBER WITHDIVISION AVAILABLE a USEABLE pIb USEABLE PT AND
FOR ANALYSIS CM (%)
A 26 25 20 (80)
B 20 20 18 (90)
C 27 20 20 (100)
D 34 21 13 (62)
E 32 21 17 (81)
Fd 24 7 7 (100)
G 17 14 10 (71)
H 31 23 20 (87)
OVERALL 211 151 125 (83)
aTTS excluding division chiefs, branch chiefs, deputies,
technical advisors, and identified new arrivals.
bMore than 1.0 TMM charged to scored projects.
cone branch had no branch chief.
dThere were only two scored projects in this division,
9The Pr sample was representative of the TTS. The representativeness of thePI sample by grade was tested by Chi-Square. X2 = 4.08, df = 7, which is notstatistically significant at the p < .05 level (X2 = 14.07). Table C-11 in
7,05appendix C shows the composition of the PI sample and TTS by grade.
4-21

h. CM data were collected frorn nineteen hranch chiefs. The CMconsisted of two senarate data elements. First, the branch chief rank orderedthe individuals in his/her hranch on the basis of overall ioh nerformance.Next, each person in the branch was assiqoed a numerical ratino on a scale of1 to in. The scale was defined as 10 heinq a "superstar," and one h- theopoosit- of in. Five was defined as the averaqe for TRASA!IA. The rank orderwas obtained for comoutinq a rank order corrplatinn with the PI r~nk order.The ratinq was obtained to determine the level of anreent of hranch chiefsin ratinn standards.
c. Table 4-11 shows the nercentaie of analysts rated in each n the I
to In catenories hv the branch chiefs. The total number of ratinas in thptable is 16), which includes those individuals rated hy brarch chiefs who didnot enter the analysis due to the lack of a useahle Pl. In all hut Throebranches, C'1 measurps were )htainpd before 01's were computed. The .,eanratinq by branch ranned from a hiqh of q. to a low nf 6.?5, with a mean of7.n7, a standard deviation of 0.70 and a median of 7.0. These data show thatthe ten point confidential ratinn achieved the desired discrimination ofperformance levels.
d. A rank order correlation was computed between the CM rank order andthe ?I rank order for nineteen branches. Table 4-12 shows the resultinqcorrelation coefficients from highest to lowest. The N is the number ofindividuals in each branch who had hoth of the necessary scores for thecorrelation. The third column in the table shows the necessary absolute valuefor the N for statistical siqnificance at the .05 level. The small numhers
* involved in the individual correlations do not provide the stability desiredfor a hiqh level of confidence in the results. The one clear point from thesedata is the tremendous variability. Only one shows a siqnificant positivecorrelation, and it is offset by a siqnificant neqative correlation. Thesedata fail to support the PI as a reliable indicator of individualproductivity.
e. While the branch by branch rank order correlations of CM and PIreveal that there is no strong positive relationship, the fact that the numberof pairs in each correlation is small may mask a low order trend. To test forthis possibility, CM ratinqs (1 to 10) were used. Within each division, allCM ratinqs ,ere listed from high to low and divided into three catenories.The rationaie was that these confidential supervisory ratinns could becombined within a division and accurately identify three relative levels ofperformance - hiqh, medium, and low. For each division the ratinqs wereexamined for cut points which would yield three approximately equal qroups.This procedure resulted in a division by division cateqorization that variedsomewhat amonq the divisions because the branch chief ratinqs were not aforced distribution.
f. After the three .ioh performance cateqories were established foreach division, the PI rank order for the division was used to form threecategories with the same number of individuals, but usinq PI rank orderinstead of CM ratinqs. For example, the CM ratinqs for one division resulted
*in six individuals in the hiqh performance cateqory, 10 in the medium, andfive in the low cateqor.v. These 21 persons were then rank ordered from high
4-22

TABLE 4-11
BRANCH CHIEF CONFIDENTIAL RATINGS OF TRASANA ANALYSTS
RATING N %
10 (HIGHEST) 21 12.40 I£9 24 14.20
8 22 13.02
7 35 20.71
6 30 17.75
5 26 15.38
4 4 2.37
3 6 3.55
2 1 0.59
1 (LOWEST) -
a
TOTAL 169 99.97
aTotal does not equal 100% due to rounding.
to low using their individual PI. The top six were put in the high PIcategory, the next 10 in the medium, and the last five in the low category.The two classifications, one by CM and one by PI, were then compared to seehow different the two groups were. Figure 4-6 shows the percentage ofindividuals by division whose classification by PI rank order was differentthan by CM rating. The percentage misclassified by PI varies from 45 to 80percent. The misclassifications did not exhibit any detectable pattern.Several individuals moved from one to the other extreme category.1 0 These
S.: data show that the individual PI does not accurately categorize individuals" -into high, medium, and low performance groups.
1 OThe data for this analysis are not provided as agreed with branch chiefs.The PI categories showed marked variance from the CM categories, and themovement of individuals was not minor. In fact, 16.?% of the individualswent from the high to low group or vice versa, and a total of 58% changedcategories.
4-23
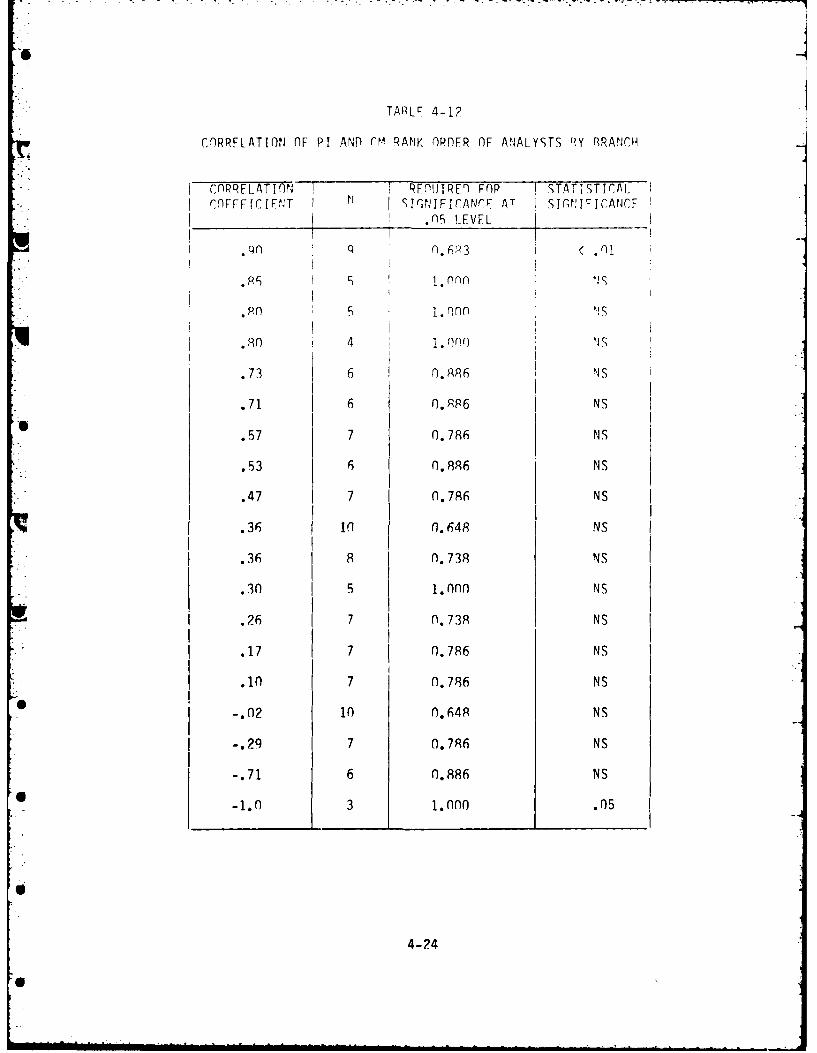
TARLF 4-12
CORRELATION OF PI ANn CM RANK OR0ER OF ANALYSTS Y RRANCH
CORRELATION I qREIJIREO FOP STATISTICALCnFFFIC[F:T I Pi IrIFICAWtE AT SIrhIFICANCE
.5 LEVEL
qO Q n.623 < .)1
5 5 1.nnfn
20 AN5 i. MNN
.O 4 1.n0
.73 6 0.A86 NS
.71 6 0.PP6 NS
.57 7 0.786 NS
.53 6 0.886 NS
.47 7 0.786 NS
.36 i0 (7.64R NS
.36 8 n.738 NS
.30 5 1.0n NS
.26 7 I 0.738 NS
.17 7 0.786 NS
.10 7 0.786 NS
-.02 10 n.648 NS
-.29 7 0.786 NS
-.71 6 0.886 NS
-1.0 3 1.0o0 .05
4-24
6I

100T
PFRCENT 50} ____I
____
10
A R C l E F 1F H
Fiqure 4-6. Individtial Performance Misclassified by P1
4-25

4.2.3 Individual PI Difficulties
Conceptually, the PI for an individual is the DS modified by supervisoryjudgment to better reflect the individual's level of contribution to the PS.This adjustment takes the form of increasing or decreasing the PS by up to 30
* percent for the individual.
a. One real difficulty with quantifying the individual contributionsto the PS is that the PS actually reflects much more than individual effort -
and therefore so does the PI. The PS is essentially a team score. Many ofthe tasks in a project are actually a team effort which are virtuallyimpossible to divide into individual contributions. Furthermore, the teamperformance is related to many things that any given individual on the teammay have very little or no say so in, such as who is on the team, how the
* project is planned and executed, project difficulty (and other risk factors),and project leader decisions.
b. The adjustment factor itself is part of the problem. Plus or minus30 percent of a low scure may still be a low score, and the opposite in thecase of a project scoring very well. A high performer on a Doorly planned and
4 executed project, or a poor performer on a very well managed project will have* P1's which do not likely reflect the true difference in performances. This
situation is further complicated by the fact that the supervisor is playing azero-sum game. To give someone more, someone else gets less, because thetotal will always be the same. The only discretion is in distribution of theavailable points. There was a lot of variation in how this was handled. Theinconsistency with which supervisors approached this situation was a majorpart of the PI problem. Some supervisors tried to make the P1's reflect theirjudgments, and others made awards almost entirely on manpower charges withoutJapplying the individual contribution adjustment factor.
c. The same inconsistency applied to the use of discretionaryproductivity points. The lack of understanding of the potency of DPP's wasevident in some cases, which is why some P1's were unrealisticallyexaggerated. It has already been pointed out that the top nine scorers would
* not be top scorers without bonus awards. There is no problem per' Se in thisfact. The problem is that the lack of consistency makes the winners andlosers too dependent on factors other than performance.
d. A supervisor has at his disposal, the power to substantially alteran individual's P1 by the application of the + 30 percent rule, and the awardof DPP, if he chooses to do so. The fact that supervisors were so inconsis-tent in this regard made the first year P1's meaningless. Furthermore, the PIdoes not capture all of the relevant aspects of job performance in all cases,and reflects factors over which the individual has no control. The indivi-dual's P1 is therefore subject to considerable misinterpretation and abuse.Since it is not a good individual performance indicator, and there is aperformance appraisal system designed to document job performance, theindividual PI should be sliminated. Its retention weakens the productivity
* measurement system, but yet does not provide a useful performance appraisaldevice.
4-26

4.2.4 Branch PI's
a. Branch PI's ranged from 1.17 to 1.81 with a mean of 1.48 and astandard deviation of 0.15. The scoring data by branch are in table C-12 in
.. -appendix C. The branch with the lowest PI had less than one TMM charged toscored projects during the scoring period.
b. There was a wide range of charges to overhead (OH) among thebranches. The lowest charge was 0.5 TMM and the highest overhead charge was50.34 TMM. The effect of overhead charges on branch P1's is illustrated intable 4-13. The effect OH has on any given PI depends on several factors --the rules used in charging or not charging overhead, the total branch TMMcharged to scored projects, and the fact that some branches have a missionrequiring overhead activities. The erratic overhead charging pattern andtendency to hide actual overhead in project manpower charges dilutes theusefulness of the PI for branch comparisons.
c. The inclusion of overhead in the PI has a substantial effect. Thevalue of what a branch produces is not lowered by overhead, but the PI is.The reason for including overhead in the PI is to keep branches from chargingtime to overhead instead of to projects to affect the R score. The result isthat overhead is not being accurately documented, and since R is not beingcontrolled, overhead is being charged to projects. Overhead charging has tobe controlled, but including it as a PI decrement makes the organizational PIless accurate.
4.2.5 Division PI's
Division PI's ranged from 1.32 to 1.60. Table 4-14 shows the division PI'swith and without OH, and reveals the same difficulty of inconsistent OHcharging as the branch figures. Division OH charges ranged from 11.10 to108.16 TMM. More complete scoring data by division are in table C-13 inappendix C.
4.3 TPMS MANPOWER COSTS
There is no way to determine exactly how much manpower was expended on TPMSduring the first scoring year. Some of the things required by TPMS are alsorequired for good management, such as a detailed project plan. Such activi-ties cannot legitimately be considered TPMS costs. Activities such as calcu-lating P1's and distributing PP's are pure TPMS costs. A separate manpowercharging code was established for documenting time spent for TPMS activities.In addition to the above mentioned calculations, time spent in PMB activitieswas also charged to TPMS. Table 4-15 shows the TMM charged to the TPMS over-head account during the individual scoring year as well as to PRB activities.As mentioned earlier, the PRB existed before TPMS. The PRB charges are shownseparately because it represents a substantial investment and is an important 7part of TPMS, even though it is not a pure TPMS cost. It should be noted thatmost of the first year PI calculations were performed after the end of June,and therefore are not reflected in the figures in the table.
4-27

TABLE 4-13
BRANCH PI'S CALCULATED WITH AND WITHOUT OVERHEAD CHARGES
-I.i
REGULAR PI W ITH Pi W/0BRANCH OVERHEAD OVERHEAD OVERHEAD
1 4.06 1.81 1.862 6.75 1.64 1.693 3.02 1.63 1.724 0.50 1.63 1.725 7.80 1.62 1.706 2.71 1.59 1.617 2.68 1.58 1.608 7.35 1.58 1.689 9.44 1.57 1.65
10 5.70 1.55 1.66S11 16.63 1.52 1.71
12 16.72 1.50 1.7913 13.72 1.47 1.7514 9.01 1.44 1.5815 33.07 1.42 1.7216 4.03 1.42 1.9217 4.55 1.41 1.4618 3.56 1.38 1.4519 44.14 1.36 1.7820 11.44 1.33 1.5321 50.34 1.30 2.3822 12.70 1.27 1.3923 13.12 1.23 1.4024 4.96 1.17 1.83
MEAN 12.00 1.48 1.69
SD 12.86 0.15 0.20
NOTE: Branches are arranged from highest to lowest PI.
4-28
IFe

TABLE 4-14. DIVISION PI'S CALCULATED WITH AND WITHOUT OVERHEAD CHARGES
REGULAR PI WITH PI W/OOVERHEAD OVERHEAD OVERHEAD
11.46 1.60 1.63
26.55 1.57 1.66
27.39 1.56 1.76
11.10 1.55 1.59
66.74 1.46 1.67
78.67 1.39 1.81
108.16 1.35 1.70
31.57 1.32 1.60
NOTE: Divisions are arranged from highestto lowest P1.
TABLE 4-15. TPMS MANPOWER CHARGES FROM OCT 80 THROUGH JUN 81
DIVISION/ TMM FOR TMM FOR
OFFICE TPMS OVERHEAD PRB OVERHEAD
A 0.84 1.16
B 1.60 1.74C 2.80 1.72D 11.62 1.42E 3.38 0.60F 6.80 2.90G 0.69 1.50H 1.54 1.50
DT 2.57 2.11
DA 0.35 2.99
TOTAL 32.19 17.64
4-29
Kg

4.4 FIRST YEAR SCORING PROBLEMS
There were numerous instances of computational inaccuracies and questionablescoring procedures in the first year scoring data. There were manyv reasonsfor these problems. The fact that it was a new system was certainly a largepart of th'e problem, but by nn means all of it. The record keeping andcalculation requirements are cumbersome and had to be done manually. Such asituation invites errors. Furthermore, the diligent monitoring of so Muchdata kept by several different offices would approach a full-time job. Whilesome of the problems were due to system start-up, there is no reason to assurethe second year data will be much improved unless considerable simplification,automation, and/or monitoring is undertaken. Selected examples illustrativeof the kind of problems that were not un,,owon are cited below.
4.4.1 Example 1 - Situation Not Covered by TPMS Guidance
This person received two discretionary awards consisting of 1.57 and 2.38 PP.No other TMM or PP were recorded for this individual. Since discretionaryawards increase an existing PI, and this person had no PI, there was asituation where the routine application of the formula did not work. In this
-4 situation, a rather innovative solution was applied. The person's PI wascomputed as the average of the discretionary awards weighted by total projectTMM, resulting in a PI of 1.78.11
* 4.4.2 Example 2 - Inaccurate Record Keeping/Computation
The project summarized in table 4-16 illustrates record keeping and computa-* tion difficulties. Values appearing in the first row of the table were taken
from the TPMS project log (TMM and PP). The remaining data in the table come* from the TPMS scoring sheets. While the two sources agree that the expended
TMM was 23.07 by the responsible division, the number of productivity pointsearned is different from the two sources. The scoring sheets show that 1.04more PP were awarded than the project log. Two branches charged time to thisproject which summed to 24.54 TMM. This is more than 1.0 TMM over the valuefor expended TMM in the project log. If the larger expenditure were in factcorrect, the R value would drop from 0.99 to 0.96, and the project score wouldchange from 1.37 to 1.32. Also, the sum of PP awarded at the branch level was32.796, which is inconsistent with both the division score sheet and the
* project log.
4.4.3 Example 3 - System Manipulation
a. This example illustrates a TPMS design difficulty. The scoring ofone branch with regard to this project is shown in table 4-17. Again the
* values in the first row come from the project log and the other data from the
11If the PI had been calculated using the individual's regular OH it is likelythat the PI would have been much higher. Suppose for illustrative purposesthat the person had 1 main-month of regular OH. The P-r computed with this OHis 4.95.
4-30

TABLE 4-16. TPMS SCORING SHEET SUMMARY FOR PROJECT NUMBER 7
TMM EXPENDED fPRODUCTIVITY POINTS PI
Project 23.07 31.60 13
Division 23.07 32.64 1.41_
Branch 24.54 32.796
X 8.26 10.98 1.33
Y 16.28 21.816 1.34
TABLE 4-17. TPMS SCORING SUMMARY FOR PROJECT NUMBER 33
TMM EXPENDED PRODUCTIVITY POINTS PI
Project 37.26 61.86 1.66
-Division 37.17 61.70 1.66
Branch 24.63 46.45 1.89
Person A 10.80 24.24 2.24
RNPerson B 4.21 9.45 2.24
Person C 0.06 0.14 2.33
Person Total 15.07 33.83 NA
scoring sheets. The branch received a judgmental award of 5.57 PP for a PI of1.89 on this project. Score sheets for the branch show only three individualscharging to this project. These three individuals do not account for 9.56 ofthe man-months charged by the branch nor 12.62 of the productivity pointsawarded to the branch. The assumption is that these 9.56 man-months were
* charged by the branch chief who then took a minimum negative judgmental award(judgmental factor of 0.70) with absolutely no loss in the branch PI (which ofcourse is the branch chief's P1). This negative judgmental award to thebranch chief allowed positive judgmental awards to the three individuals in
* the branch. These awards put two of the three individuals into the top ninescorers in the activity (PI > 2.00) even though the project score was 1.66,which is below the mean activity PS of 1.68.
4-31

b. The problem illustrated in this example is that when a branch chiefcharges to a project, the points which he earns may be used as bonus pointsfor, other individuals in the branch. They are of no use to the branch chiet,and can thus be distributed to other team members. It is to the team'sadvantage then to have the branch chief cnarge time to projects. When thissituation does occur, it creates ineqjity for individuals on projects to whichthe branch chief does not charge time, or on prolects with larqe numbers otparticipants to share the bonuses. The same kind of manipulation occurred ininstan(s ' where team members departed the orga .izat ion before PP's weredistributed.
4.5 PRODUCT REVIEW BOARD (PRB)
Data concerning the PRB functioning came from the first year scoring resuiltsand interviews with division chiefs, branch chiefs, and PRB members.
a. The results of the Q score analysis are presented in 4.1.4.Essentially, the Q score distribution was statistically a better distributionthan those for the other factors. What is not revealed by the distribution isthe accuracy of scores, or how well the Q score captures actual differences inproject quality. This element was addressed in the interviews.
b. The result of the interviews wac a unaminous lack of confidence inthe Q scores. There was no difference in responses by those who had and hadnot fared well in their Q scores. It is generally believed in the organiza-tion that the PRB grades projects primarily on such factors as report formatand editorial considerations. Not one supervisor was found who felt the Qscore adequately discriminated between project quality. This lack of confi-
*dence in the score given by the PRB is a substantial detriment to morale.Several branch chiefs expressed concern that reports were being tailored moreand more to the PRB and therefore less to the proponent. Another concernwhich frequently surfaced was that larger projects are penalized because it ismuch more difficult to organize and write a readable report for largecomplicated projects.
c. As was pointed out in 4.1.4, the PRB has d very difficult, if notimpossible, task in trying to make fine discriminations among very diverseprojects and products. The major problem is seen as the grade and the gradingprocess, not the PRB. There was general agreement (incidently, supported byfirst year data) that the PRB is necessary, but its current power andinfluence in the TPMS scoring process is not well received. A more definitivebalance of power is needed between the responsible division (or linemanagement) and the PRB (staff function).
4.6 PRODUCTIVITY MEASUREMENT BOARD (PMB)
Data for the analysis of PMB functioning came from the first year scoringresults, interviews with PMB members, and observing one PMB meeting. The PMB
* is responsible for reviewing all project plans for accuracy in estimatedresources and schedules. The primary emphasis in this analysis was how thePMB members made these judgments, and how effective they were in controllingthe input estimates.
4-32
6

a. First year scoring results reported in 4.1.2 document the fact thatc the resource estimates were not adequately controlled the first year.Interviews with PMB members (division chiefs) revealed that the generalopinion of the PMB members was that they did not know how to judge thevalidity of estimates from divisions other than their own. In fact,considerable frustration was expressed in regard to being asked to make suchjudgments. As a result of this uncertainty, the tendency was to only raisequestions in cases where blatant inaccuracies were suspected, which was ratherinfrequent.
b. In many respects, the PMB members are faced with the same dilemma asthe PRR members, in that no matter how hard they try, it is not clear thattheir task is reasonably achievable. Considerinq that over 100l prcjects wereentered into the system the first year, and that 60 to 90 reports aregenerated by TRASANA every year, the magnitude of the problem comes moreclearly into focus. In addition to the number of projects, there isconsiderable variation in what the projects involve. There is just not anadequate amount of time for division chiefs to acquire and process detailedinformation about each and every project and keep abreast of their owndivision responsibilities.
4.7 TPMS ALGORITHM ANALYSIS RESULTS
a. Numerical error analysis revealed that the numerical error associatedwith both the project score and the PI is 0.027. The contributing factors are
m errors in the scoring factors and the computational methods. Depending on howthe PI is used, this may be an unacceptably high numerical error. Forexample, if a PI is computed as 1.689 (first year mean) the true value couldvary from as little as 1.662 to as much as 1.716. At the top end of thescaile, a PI of 2.00 could have a true value varying from 1.973 to 2.027.
b. One of the stated reasons for using a multiplicative rather than anadditive scheme for assembling the project scorinq factors is that an additivescheme is compensatory while a multiplicative scheme is not. In fact, amultiplicative scheme is compensatory to a certain degree. This necessi'tatesadopting a minimally acceptable value, sometimes called a critical hurdle, forQ (currently 1.3). The resulting scoring function is a combination of acompensatory and conjunctive (critical hurdle) scheme.
c. The use of distinct ratio efficiency factors (R and C) which areweighted differently is intended to reflect efficient resource use and also toencourage substituting manpower with less expensive computer usage. However,the different weighting distorts actual resource costs and the use of distinctfactors could actually encourage replacing some computer usage by moreexpensive manpower to maxim~ize the project score.
d. The hierarchical distribution of PP (first to divisions, then tobranches, and finally to individuals) constrains the awardinig process to theextent that supervisors may not be able to award PP equally for comparablework in some cases.
4-33

I7
e . Branch and division P1's are weighted averages of PP (includingoverhead) over a scoring period. Scored projects can carry-over from oneperiod to the next while overhead would not. This could result inorganizations having equal productivity over two years, but their P1's foreach year would be different.
* 4.8 RESPONSE TO 'SECOND OBJECTIVE
4.8.1 -Objective 2: To determine the degree to which TPMS is a meaningfulmeasure of productivity.
a. Study Question 1: To what extent do TPMS ratings aqrpe iqitn* confidential supervisory assessments for individuals and branches?
(1) Individuals. There was not agreement between individual PI'sand confidential supervisory assessments. Furthermore, the individual PI isto some extent subjective, reflects factors beyond the individual 's control,and is subject to misinterpretation and abuse. The individual PI was plaguedwith so many difficulties that even with substantial modifications, itsusefulness will be questionable.
(2) Branch. On the branch level, the evaluation was not based onsupervisory evaluations. Branch P1's (as well as division P1's) were muchmore meaningful than individual P1's. The most useful aspect of the PI is fororganizational units. If input estimates are better controlled (see 4.1.2),and the problems with the quality score (see 4.1.4) and overhead (see 4.2.4)are resolved, the organizational P1 will be a solid productivity indicator,especially over a several year period.
h. Study Question 2: Does TPMS have generally the same impact on the* different TRASANA organizational divisions?
No. The major problem here was the treatment of overhead. There wereconsiderable inconsistencies in the way overhead was charged. As TPMS iscurrently structured, organizational units are punished (PI is lowered) forcharging time to overhead. When P1's are calculated without overhead, theresulting branch (and division) rank order is virtually uncorrelated with thecomplete (with overhead) P1 rank order. The inclusion of overhead, which
A earns productivity points at a lower rate than the worst scoring project,punishes those organizational units with an overhead miss'on, and dilutes the -
useful ness of the organizational PI.
c. Study Question 3: What are the functional relationships among thescoring algorithm variables?
(1) The most important driving factor behind first year scores wasthe manpower utilization factor (R). The priority (P) and computerutilization (C) factors, except for a very few C scores, were constants in thescoring equation. The timeliness factor (T) equalled 1.0 for over half of theprojects. The quality (Q) score had a lesser effect on the project score than
U the R, C, and T factors because of its range, its scoring distribution, andthe multiplicative scoring function.
4-34

(2) A conservative estimate of the numerical error associated withboth the project score and the PI is 0.027. Depending on how the PI is used,this may be an unacceptably high numerical error.
(3) The use of distinct ratio efficiency factors (R and C) whichare weighted differently could actually encourage replacing computer usage bymore expensive manpower to maximize the project score.
(4) The hierarchical distribution of PP (first to divisions, thento branches, and finally to individuals) constrains the awarding process to
* the extent that supervisors may not be able to award PP equally for comparablework in some cases.
(5) Branch and division P1's are weighted averages of PP(including overhead) over a scoring period. Scored projects can carry-overfrom one period to the next while overhead would not. This could result inorganizations having equal productivity over two years, but their P1's foreach year would be different.
d. Study Question 4: What is the operational impact of theProductivity Measurement Board (PMB) and the Product Review Board (PRB)?
(1) PMB. The most important function of the PMB was controllinginput estimates for R, C, and T. It was not effective at this, especially inthe case of R. This does not reflect poorly on the PMB. This way ofcontrolling estimates was a good idea that did not work.
(2) PRB. The PRB appears to have done a good job in the area ofquality control (28 percent of the reports were rejected the first timearound), but the actual assigning of "grades" was less successful. Theproblem was that the PRB tried to make very fine distinctions between projectsbased on reviewing reports in a relatively limited amount of time.
4-35

CHAPTER 5
SUMMARY AND CONCLUSIONS
- This chapter summarizes the findings of the Phase I evaluation of TPMSrelative to the original design attributes of the system, and presents theconclusions supported by the analysis. Summary responses to the objectivesand study questions are at the end of chapters three and four.
5.1 DESIRED ATTRIBUTES OF TPMS
a. Table 5-1 shows the results of the first year evaluation relative tothe original design attributes of TPMS (see chapter 1).
TABLE 5-1. FINDINGS RELATED TO TPMS DESIGN ATTRIBUTES
ATTRIBUTE FINDINGS
Relevant Yes; Measures productivity
Rational Yes; Except individual PI and DPP
Fair Individual: Input/output mismatchOrganization: Overhead mission disadvantaged
* Affordable ?
Flexible Undetermined
Simple No
Transparent No
Durable TBD
0 (1) TPMS was judged to be relevant to the organization, itsproducts, and to the jobs that produce the products. The classical definitionof productivity is value of output over value of input, and captures bothefficiency and effectiveness. The R and C factors of TPMS capture efficiency,and the T and Q factors capture effectiveness. 1 The weakness in terms ofmeeting the classical definition is in controlling estimated manpower, whichis the single most important factor in establishing project worth under the
* - cost-plus-incentive concept.
1The P factor captures neither efficiency nor effectiveness. In terms of theclassical definition of productivity, the P factor is questionable. It wasnot an issue in this analysis because it reverted to a constant value for allprojects.
5-1

(2) The system was judged to be conceptually sound, and thereforerational , but some of the component elements did not work as well1 as others.Basically, the inconsistent application of judgmental and discretionary pro-ductivity points had an undesirable impact on individual P1's. Furthermore,so many of the tasks in projects are actually group tasks, or team tasks, thatthere is no objective way to measure tne relative contributions ofindividuals.
(3) The most frequently stated complaint about TPMS was that it is -
un f a ir. There is some basis in fact for this coinplainc. On an individuallevel, there is considerable potential for an input effort/output reward mis-match. For example, two persons with equal capabilities and putting forthequal time and effort on two equally scoring projects (i.e. equal projectscores) may not earn productivity points at the same rate. This could occurfor reasons totally beyond the individual's control, such as one study mianagerusing judgmental awars to reward "Super" performers , and the other studymanager distributing all productivity points based solely on manpower charged(i.e., everybody on the team earns at the same rate). On an organizationallevel, those branches and divisions with an overhead mission are disadvan-taged.
4(4) No judgment is offered on the affordability of the systembecause that is a decision for management to make after all the facts areavailable.
(5) The flexibility of the system was not determined. One problemrelated to flexibility is the disadvantage to units with an overhead mission.
(6) The system is not simple. The PI calculations are cumbersomeand complex, and the staff generally does not understand how the various
*factors and components interact to affect scores. The biggest problems hereare the use of judgmental and discretionary productivity points (and theirimpact), and dividing productivity points between organizational units.
(7) The system is not transparent. Most of the staff do not see adirect relationship between input effort and output score - which is onereason so many see the system as unfair.
(8) More time is required to determine the durability of the system.6 Part of the durability depends on lowering resistance to certain elements of
the system (addressed in chapter 6).
b. In summary, several problems were found by the evaluation, but thesystem seems to be conceptually sound. It has more validity on the organiza-tional level than for individuals, and probably has its greatest use over a
S period of several years so that short term fluctuations are averaged out.
* 5.2 CONCLUSIONS
5.2.1 General
5-2
6L
a. TRASANA is a healthy organization with high morale, job satisfac-I tion, and a motivated work force that is challenged and proud of the organi-
zation.
b. There is mixed reaction to TPMS. Supervisors have a more positiveview than nonsupervisors, but the majority of the staff have legitimateconcerns about TPMS fairness, and how TPMS will affect the creative,cooperative work environment.
c. TPMS is a conceptually sound productivity measurement system, butmany of its functional elements need revision.
d. The project olan is a very positive contribution of TPMS.
* .e. Firm guidelines are needed on overhead so the system willaccurately document the level of overhead use. Different categories ofoverhead are needed, especially in those situations where there is anoverhead mission.
5.2.? -Productivity Index
a. The individual PI did not perform well and is the source ofconsiderable staff uneasiness. Since accurate reflection of individualcontributions in group analysis efforts cannot be captured with an objectivemeasure, the system would be more accurate and less objectionable to thestaff if the individual PI were eliminated.
b. The organizational PI would be greatly strengthened by eliminatingoverhead from the P1 calculation.
c. The organizational PI will be a solid productivity indicator if the* input estimates are more accurate. The PMB was not effective in controlling
input estimates.
5.2.3 Product Quality Score
a. The PRB serves a necessary quality control function.
b. The quality scoring by the PRB is such a strong morale detrimentthat it should be changed.
c. PRB scoring procedures and authority should be more clearly definedand specified. *5.2.4 -Scoring Algorithm
a. The scoring algorithm is unnecessarily complicated.
b. Judgmental and discretionary awards caused many problems and shouldbe eliminated. They add a subjective element that is performance appraisaloriented, and did not work well. Individual performance appraisal and teamproductivity measurement should be separate.
5-3

c. Management flexibility is required to intervene in situations wherecircumstances beyond the team's control result in a poor score - such asundertaking a very risky project.
5.2. Follow-Up Evaluation
This study team has formed definite opinions about TPMS and has made substan-tial recommendations for changes in chapter 6. To preserve objectivity, anyfurther TPMS evaluation should be performed by another study team. Since TPMSis a complex measurement system, a strong bacKground in human meas.urement andmanagement is needed.
5
I-
} i 5-4

CHAPTER~ 6
13 RECOMMENDATIONS
6.1 PURPOSE
This chapter contains recommendations for improving those aspects of TPMSwhich did not work well during the first scoring year.
6.2 APPROACH
The major problem areas are listed in table 6-1 along with the recommendationsfor correcting the problems. Specific strategies and procedures for imple-
*menting the recommendations are presented in appendix F in the form of analternative TPMS scoring algorithm. The rationale behind each of therecommendations is discussed below.
* 6.3 RECOMMENDATIONS
6.3.1 Estimated Manpower (RP)
a. The overestimation of manpower was the largest problemfrom the perspective of actually measuring productivity in the classicalsense. Currently a division chief can enter a project into TPMS if his
* projected manpower requirement is not more than 125 percent of availablemanpower (125% rule). This 125 percent should be reduced to 110 percent toencourage more accurate estimating. Furthermore, it may need to be reduced
* even mrore in the future. The extra 10 percent is recommended for now becauseperfectly accurate estimating is not realistic.
b. The categorical scoring recommenoed for R, T, and Q will encourageU -more accurate manpower estimating by not rewarding overestimation. Further-more, at the end of each scoring period each division's accuracy over theperiod can be determined, and a bonus given to the most accurate estimator.The bonus could take the form of increasing the division PI somewhat (thecloser the factor score to 1.0, the higher the bonus), or some other rewardcould be devised. Since punishment is generally less effective than reward
* for effecting long term behavior change, and also has undesirable side-effects, rewarding the desired results is the favored approach over punishinginaccuracy.
6.3.2 Productivity Index (PI)
a. Individual. In its current form, the PI for individuals does notaccurately reflect individual contributions and has considerable potential forabuse. An example would be a supervisor who accepts the PI as accurate with-out considering its limitations, and subsequently writes performance apprais-als based on an "individual 's productivity" using the PI. For this reason,
-retention of the individual PI is not recommended. A less desirable alter-native is to eliminate judgmental and discretionary awards and assign everyteam member the team (project) score. The judgmental and discretionary awards
6-1
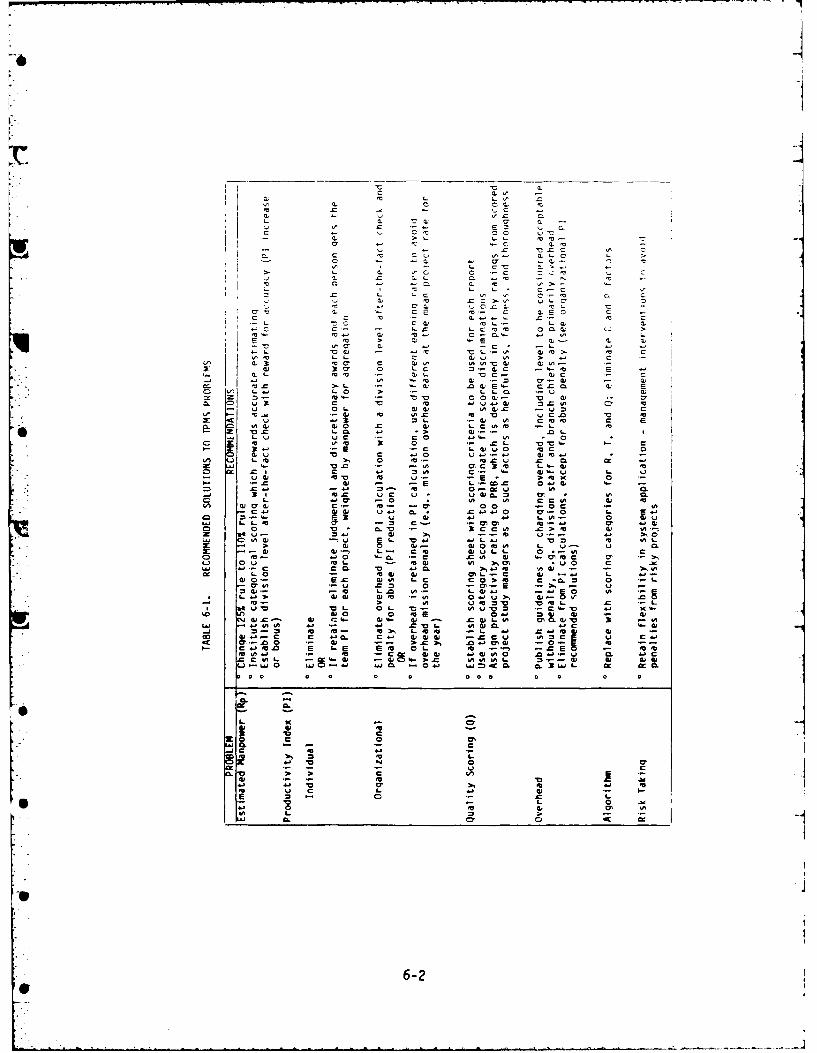
-C
10 - ! L - -
a, -CV E C
' .3: mC C, a' Q, w
c I 'C 'L CIc C . C
CUo 'oc 0C 0 C.1-'C~~~~O a-- cr c'~v oa
CV 3C a~ -0 ,I a)~'r s VC 4D SC u
VI 10 It w-' I) CPI
Z~ ~~~~~ Z-'. ' 0 ,
- U0'.5033~0LC C L83 'U t.C 'U 0 c C 0 '
z ~. "D C' -) mt ' ' C)w. c)0 .C LC- ' L'
a;' -0 -C 'a ~ I 'CCl W.C-s 'AC.
'.3 3-'U 5, 0 '0 'UC C ~ ~ .
o i = c. u.. 0.-U u2- 043 'V 1: 1 - ;t0
M.0 - -E m E.G-23 0 'U 06.w
Mgt LUA =C -C CL U . m cc I C
0 0 3 0. 0 . 0C.040 00
9L V (A. 3 C ' .>' 3
9L. L ' J L 'cc
o 'C .30 ~ 0. C .C' 4 .-6-2

are an attempt to make an organizational productivity measurement system serveC as an individual performance appraisal device. As shown in the first year
results, this just did not work. The system will work better without theperformance appraisal aspect (be a stronger organizational index), and thereis already a separate personnel appraisal system where supervisors can reflectindividual job performance.
b. Organizational. On the organizational level, the problem isoverhead. One approach is to eliminate overhead from the PI computation, andto have a penalty for abuse of overhead. Another approach is to havedifferent earning rates for overhead (see 6.3.4).
6.3.3 Quality Scoring (Qj
The PRB serves a very valuable quality control function which should beretained; however, there are several difficulties with the current Q scoring.Categorical scoring (excellent, okay, revision required) will help consider-
* ably, but that is not enough. A checks-and-balance procedure is needed toavoid the possibility of the PRB exerting too much influence over reports.The primary responsibility for reports should rest with line management. ThePRB should be required to complete a checkl ist and rating scale for eachreport which is promptly furnished to the responsible division chief. Thischecklist should contain those factors the board uses in determining thequality score. It is likely that these factors are to a large extent reportorganization and readability.) Additionally, accountability is a two way
* street. Permnanent PRB members (voting members) should be held accountable fortheir productivity by being scored on their thoroughness, helpfulness, andfairness by project study managers, branch chiefs, and division chiefs(instances were reported of PRB members not having read the report prior tothe board meeting). A simple one-page rating form for this purpose could bedeveloped rather easily.
6.3.4 Overhead
Guidelines for charging overhead are essential if this problem is to beovercome. The guidelines should establish "acceptable" overhead limits. Forexample, supervisors are generally overhead, and there are legitimate overhead
* activities that take up a small amount of everyone's time. This is widelyrecognized in such activities as applying for research grants, where a figurearound 30 percent is fairly typical of expected research overhead expense.The first year treatment of overhead diluted PI usefulness.
1The Colonel who served as PRE board president during the first scoring periodwas interviewed before departing TRASANA. He reluctantly admitted that thiswas the case even though he %"wished"l it could different. He had norecommendations for how to change the situation. The problem is that PRBmembers do not have enough time to gather and process detailed informationon each and every project. The possible return on the investment of havingthem take such time would not likely be worth -it.
6-3

6.3.5 Scoring Algorithm
If three categories are used for the R, T, and O factors, the currentalgorithm can be replaced by 27 possible outcomes without loss of information,and with reduced record keeping requirements (especially if individual PI isdiscontinued). These 27 possible outcomes should be evaluated and weighted inadvance, so a project score is automatically assigned based on the outcomecategory (see appendix F for details).
6.3.6 Risk Taking
There is considerable concern that TPMS will reduce staff willingness to take
on unknown and risky projects. Since no workable risk index is available,this problem can be handled by not applying TPMS scoring dogmatically.Management should reserve the perogative of adjusting project scores whererisk resulted in inequitable results.
61
6-4
Sw

APPENDIX A
TPMS-TE STUDY PLAN
U7
A-i

STUDY PLAN FOP THE PHASE I
EVALUATION OF TRASAIA TECHNICAL
STAFF PRODUCTIVITY MEASUREMENT
SYSTEM-TEST (TPMS-TE)
MAY, 1981
A-2

TABLE OF COrNTENITS
PAGE
1. PURPOSE 4
2. BACKGROUND 4
3. PROBLEM 4
4. IMPACT OF PROBLEM 5
5. SCOPE 5
6. OBJECTIVES FOR PHASE I EVALUATION 5
7. ASSUMPTIONS 6
8. CONSTRAINTS 6
9. DATA COLLECTION METHODOLOGY 6
10. DATA ANALYSIS METHODOLOGY 7
11. OPERATIONAL SUPPORT REQUIREMENTS 9
12. SCHEDULE 12
7 A-3I

>T 11,y '-Onk~ THEF PHASE I EWASIAT ION OF TRAWNA TUH AL MWmoPtrJIJC(FIV! fy MEAM,,:L!" V S TEM-T4ST (TDV -.
To eva I uate Pha,;e I (t he first year) of the thrre-vea r -qt f Mnat ' 1tat,;
the TRASANA Tc<hrcal %taff Product ivitj Measur,;.nt by r.- K ,'9, fACKGR9)4N.
d. TDMS q i nethodonqy designed to ,edsure ds .ep pr i
"RASANA technical staff, 's urganizatbonal elements, a",c Vi 'employees. it yields a single dimensionless index as tW ,p;d Jproductivity. The formulation of this index is intended t,2 'e ,cis!sten V .
the traditional definition of proouctivity as value of output ,divided r'y vai,of input. !n principle, TPMS places TRASANA on a "fixed price pl,, incen iv,hasis for producing its various Droducts. TPMS was designed itO t'efollowing attributes in mind:
(1) Relevant - to the orgdanization, its products, ir(d to the jobsthat produce the products.
(2) Rational and fair - so that it can be accepted and used by asophisticated workforce.
(3) Affordable - in terms of direct and indirect/overhead costs for
operation and maintenance.
(4) Flexible - to couple with a dynamic workload, organization, ,r~doperations.
(5) Simple - both in principle and practice.
(6) Transparent - so as to facilitate understanding of cause and 7I
effect relationships.
(7) Durable - to support multi-year use.
b. Given that TPMS enables reasonably equal opportunity for prcductivityand scoring throughout the organization, then the resulting productivity index(PI) can be used to compare the relative productivity of TRASANA divisions,branches, and individuals. Management and individual goals can be structuredin terms of changes in the PI. The degree to which the goals are met could bea factor in performance appraisal. The TPMS has been adopted at TRASANA for athree year trial beginning 1 Oct 80. This study is the first phase of a 3year, 3 phase, evaluation of the TPMS test (TPMS-T).
3. PROBLEM
To determine the degree to which TPMS provides a meaningful measure of theproductivity of the TRASANA technical staff and its organizational elements.
A-4

" 4. IMPACT OF PROBLEM
The purpose of the TPMS test period is to develop experience working with thesystem so its effects on management practices, employee motivation, andproductivity can be judged. A systematic collection and assimilation of
'. information about the system test is required to assess these factors.Implementation of an untested system could result in having inaccurateproductivity results, or even hamper productivity by adversely affectingmanagement practices and employee motivation.
5. SCOPE
a. The study will be limited to evaluating the results of the first trialimplementation year of TPMS.
b. TPMS was developed in part as a local response to requirements of thenew Performance Appraisal (PA) and Merit Pay (MP) systems. While informalintegration of TPMS data and PA and MP systems may occur during the testperiod, this evaluation is limited exclusively to TPMS. No assessment of thePA or MP systems is intended.
c. TPMS-TE is an assessment of a specific productivity measurementsystem. It is not intended to be a comprehensive study of methods to measureTRASANA or research and development type productivity.
d. One of the desired characteristics of TPMS is that it be affordable.Available data will be collected on resources expended on the first year testof TPMS; however, judgments on whether the costs are a worthwhile investmentare beyond the scope of this study.
6. OBJECTIVES FOR PHASE I EVALUATION
a. To determine how the TRASANA technical staff (TTS) perceives TPMS.The study questions for this objective are:
(1) What is the TTS general attitude toward TPMS?
(2) What is the perceived motivational impact of TPMS?
(3) Is TPMS seen as a viable managerial tool?
b. To determine the degree to which TPMS is a meaningful measure of* productivity. The study questions for this objective are:
(1) To what extent do TPMS ratings agree with confidential. supervisory productivity assessments for individuals and branches.
(2) Does TPMS have generally the same impact on the different TRASANA*i organization divisions?
(3) What are the functional relationships among the scoring algorithmvariables?
A-5
6

(4) What is the operational impact of the Productivity MeasurementBoard (PMB) and Product Re~iew Roard (PRB)?
c. To develop a TPMS data base consisting of Phase I TPMS-T results.Available data on resource implications will be included. This data base willform the benchmark for comparison of future results.
7. ASSUMPTIONS
a. Phase I of the TPMS-T implementation wil! end 3Fi June 1-4,.
b. TPMS will remain essentially unchanged during Phase ] of eimplementation (test integrity).
C. The test will apply equally to all TRASANA Technical Staff (e.g.civilian and military).
d. Key organizational supervisors know the relative long termproductivity of employees they supervise.
e. Division chiefs, branch chiefs, and the TTS will provide coriplete;accurate and timely information for the study.
f. First year test results and other required inputs will be provided cntime, including manpower and computer time charges.
g. Management will respect the confidential data collected as a part of
the study.
8. CONSTRAINTS
a. Not all of the TTS will have completed TPMS scored projects during thefirst test implementation year.
b. There is no basis for comparing test period productivity with pastproductivity.
9. DATA COLLECTION METHODOLOGY
The study methodology consists of several independent data collectionsteps and the development of accompanying data collection instruments.
a. TRASANA Technical Staff Perception Questionnaire.
(1) This questionnaire will be designed to gather the data requiredto answer the three study questions supporting the first objective: generalattitude toward TPMS, perceived motivational aspects of TPMS, and theperceived impact of using TPMS as a managerial tool. After the questionnaireis constructed it will be tested, evaluated for reliability, and revised as
4 appropriate before administering to the TRASANA staff.
A-6I
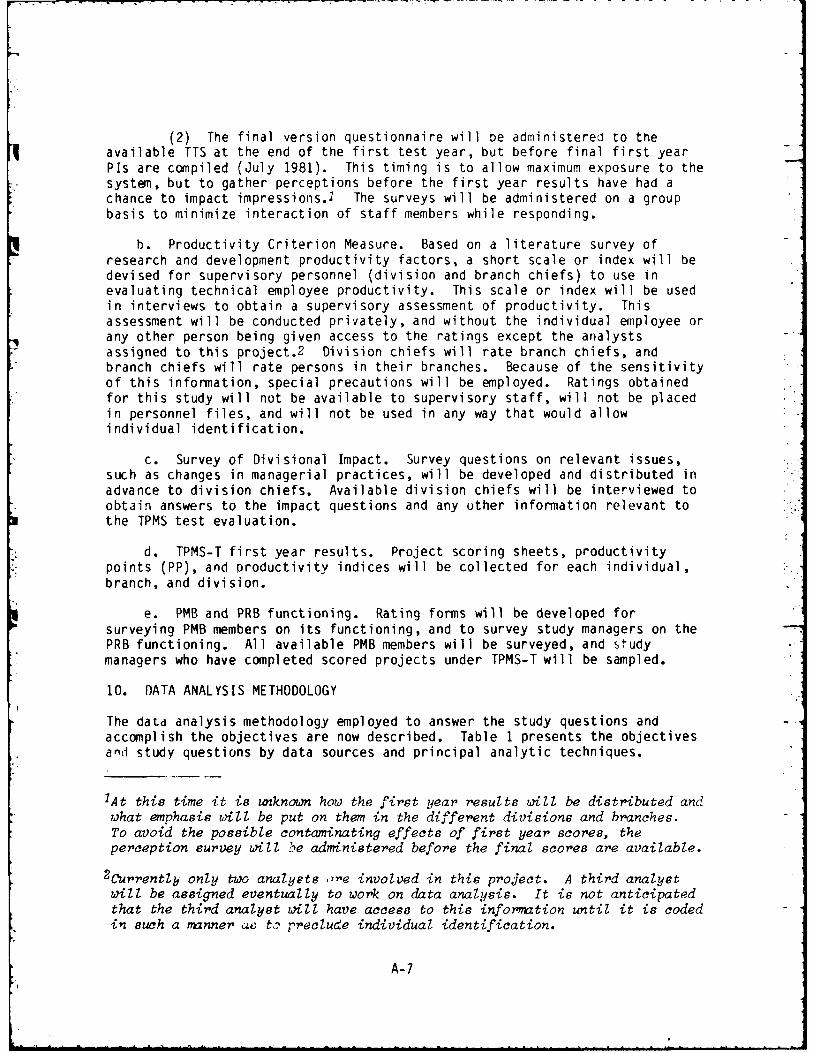
(2) The final version questionnaire will be administered to theavailable TTS at the end of the first test year, but before final first yearPIs are compiled (July 1981). This timing is to allow maximum exposure to thesystem, but to gather perceptions before the first year results have had achance to impact impressions.' The surveys will be administered on a groupbasis to minimize interaction of staff members while responding.
h. Productivity Criterion Measure. Based on a literature survey ofresearch and development productivity factors, a short scale or index will bedevised for supervisory personnel (division and branch chiefs) to use in
* evaluating technical employee productivity. This scale or index will be usedin interviews to obtain a supervisory assessment of productivity. Thisassessment will be conducted privately, and without the individual employee orany other person being given access to the ratings except the analystsassigned to this project.2 Division chiefs will rate branch chiefs, andbranch chiefs will rate persons in their branches. Because of the sensitivityof this information, special precautions will be employed. Ratings obtainedfor this study will not be available to supervisory staff, will not be placedin personnel files, and will not be used in any way that would allowindividual identification.
c. Survey of Divisional Impact. Survey questions on relevant issues,such as changes in managerial practices, will be developed and distributed inadvance to division chiefs. Available division chiefs will be interviewed to
*obtain answers to the impact questions and any other information relevant tothe TPMS test evaluation.
d. TPMS-T first year results. Project scoring sheets, productivity* points (PP), and productivity indices will be collected for each individual,
branch, and division.
e. PMB and PRB functioning. Rating forms will be developed forsurveying PMB members on its functioning, and to survey study managers on thePRB functioning. All available PMB members will be surveyed, and studymanagers who have completed scored projects under TPMS-T will be sampled.
10. DATA ANALYSIS METHODOLOGY
The data analysis methodology employed to answer the study questions andaccomplish the objectives are now described. Table 1 presents the objectives
* and study questions by data sources and principal analytic techniques.
lAt this time it is unknown how the first year results will be distributed andwhat emphasis will be put on them in the different divisions and branches.To avoid the possible contaminating effects of first year scores, theperception survey will -be administered before the final scores are available.
2Currently only two analysts or~e involved in this project. A third analystwill be assigned eventually to work on data analysis. It is not anticipatedthat the third analyst will have access to this informa~tion until it is codedin such a manner ae to preclude individual identification.
A- 7
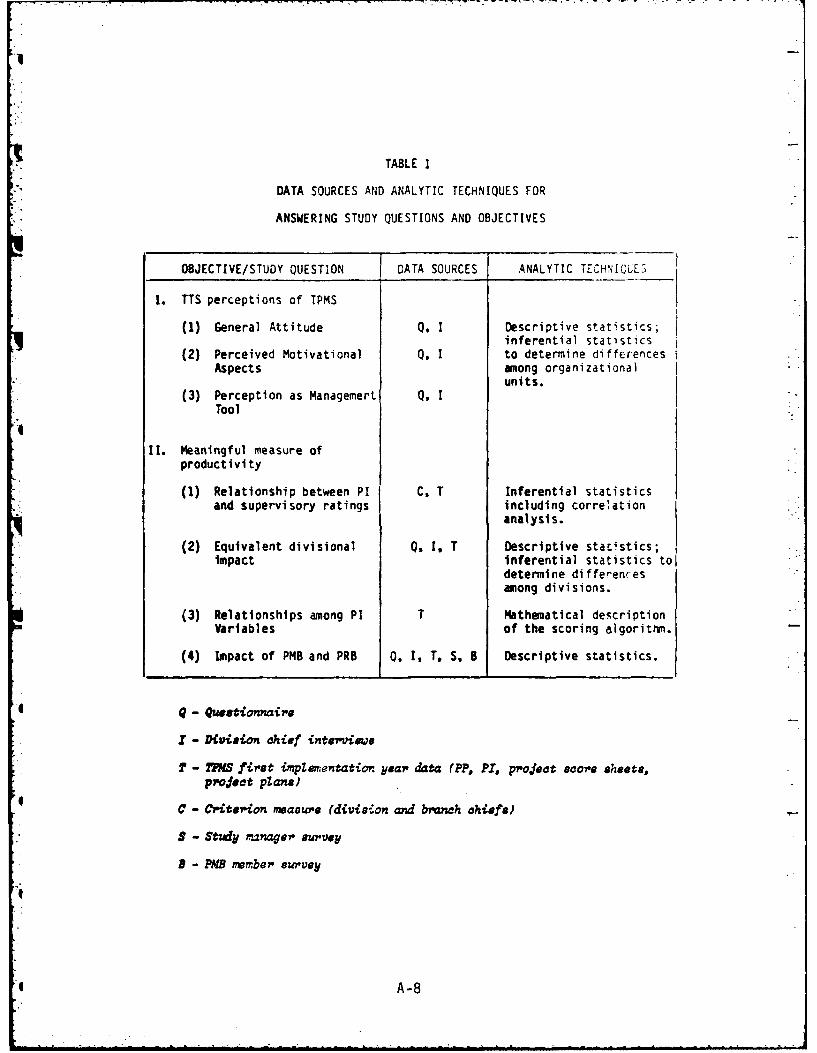
TABLE 1
DATA SOURCES AND ANALYTIC TECHNIQUES FOR
ANSWERING STUDY QUESTIONS AND OBJECTIVES
OBJECTIVE/STUDY QUESTION J DATA SOURCES ANALYTIC TECHNIQUES
Io TTS perceptions of TPMS
(1) General Attitude 0, I Descriptive statistics;inferential statistics
(2) Perceived Motivational 0, I to determine differencesAspects among organizational
units.(3) Perception as Managemert Q, I
Tool
I1. Meaningful measure of
productivity
(1) Relationship between Pl C, T Inferential statisticsand supervisory ratings including correlation
analysis.
(2) Equivalent divisional Q, I. T Descriptive statistics;impact inferential statistics tol
determine diffe-encesamong divisions.
(3) Relationships among PI T Mathematical descriptionVariables of the scoring algorittim.
(4) Impact of PMB and PRB 1, T. S. B Descriptive statistics.
Q - Questionnaire
I - D vieon chief intervieve
T - 2Ma first impZementation year data (PP, P1, project score sheet.,project pZane)
4 C - Criterion ,measue (division and branch chiefs)
S - Study rn nager euvey
B - PHE member eurvey
6 A-8
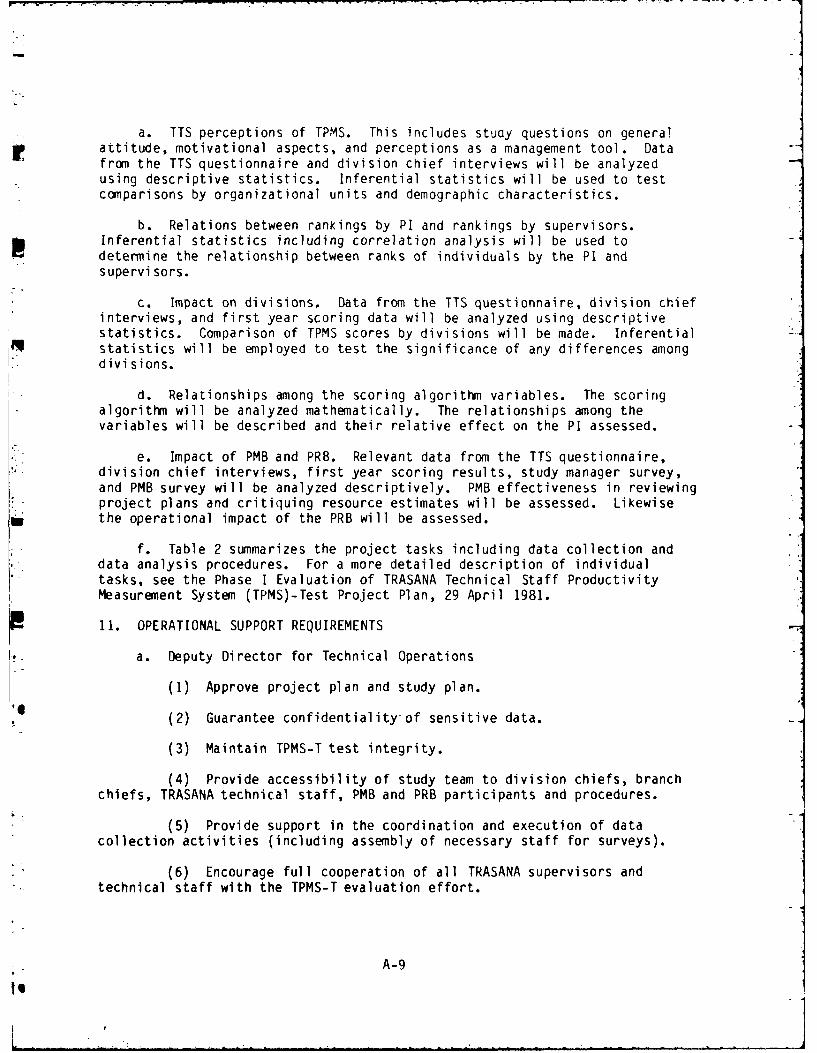
a. TTS perceptions of TPMS. This includes study questions on generalattitude, motivational aspects, and perceptions as a management tool. Datafrom the TTS questionnaire and division chief interviews will be analyzedusing descriptive statistics. Inferential statistics will be used to testcomparisons by organizational units and demographic characteristics.
b. Relations between rankings by PI and rankings by supervisors.Inferential statistics including correlation analysis will be used todetermine the relationship between ranks of individuals by the PI andsupervi sors.
c. Impact on divisions. Data from the TTS questionnaire, division chiefinterviews, and first year scoring data will be analyzed using descriptivestatistics. Comparison of TPMS scores by divisions will be made. Inferentialstatistics will be employed to test the significance of any differences amongdivisions.
d. Relationships among the scoring algorithm variables. The scoringalgorithm will be analyzed mathematically. The relationships among thevariables will be described and their relative effect on the PI assessed.
e. Impact of PMB and PRB. Relevant data from the TTS questionnaire,division chief interviews, first year scoring results, study manager survey,and PMB survey will be analyzed descriptively. PMB effectiveness in reviewingproject plans and critiquing resource estimates will be assessed. Likewisethe operational impact of the PRB will be assessed.
f. Table 2 summarizes the project tasks including data collection anddata analysis procedures. For a more detailed description of individualtasks, see the Phase I Evaluation of TRASANA Technical Staff ProductivityMeasurement System (TPMS)-Test Project Plan, 29 April 1981.
11. OPERATIONAL SUPPORT REQUIREMENTS
a. Deputy Director for Technical Operations
(1) Approve project plan and study plan.
(2) Guarantee confidentiality-of sensitive data.
(3) Maintain TPMS.-T test integrity.
(4) Provide accessibility of study team to division chiefs, branchchiefs, TRASANA technical staff, PMB and PRB participants and procedures.
(5) Provide support in the coordination and execution of datacollection activities (including assembly of necessary staff for surveys).
(6) Encourage full cooperation of all TRASANA supervisors andtechnical staff with the TPMS-T evaluation effort.
A-9

r
TABLE 2TPMS-TE TASKS
PREPAREPROJECT
PLAN
PREPARESTUDYPLAN
- I IOEVELOP COLLECT TPHS INTERVIEW DIVISION DEVELOP OEVELOPTPMS PHASE I SCORING CHIEFS FOR EVALUA- TPMS CRITERION FT s & D'a
PERCEPTION DAIA TION OF TPMS DIVI- MEASURE (CM) FLNCTIOrI':QUESTIONNAIRE SIONAL IMPACT SURVEYS
ADMINISTER CODE & ORGANIZE AND ADMINISTER CM ADMINISTERQUESTIONNAIRE ANALYZE ASSIMILATE DIVI- TO DIVISION SURVEYSTO TRASANA DATA SION CHIEF INTER- AND BRANCH
TECHNICAL STAFF VIEW DATA CHIEFS
I IPREPARE RESULTS ORGANIZATIONAL PREPARE DESCRIPTIVE ANALYSIS
SUMMARY RESULTS SUMMARY OF TPMSFUNCTIONAL
COMPONENTS
INTEGRATED DATAANALYSIS
BRIEFING
REPORT
A-10

(7) Provide needed support and assistance to help study team
F overcome unforeseen obstacles.
b. Division Chiefs
(1) Participate in data collection including individual productivityassessments of branches.
(2) Provide an assessment of the impact of TPMS on divisionmanagerial practices, productivity, and employee morale.
(3) Afford study team free and unrestrained access to divisionpersonnel for the required data collection procedures.
(4) Encourage full cooperation of employees with study effort.
c. Branch Chiefs
(1) Participate in data collection including individual productivityassessment of branch members.
(2) Afford study team free and unrestricted access to branch
personnel for the required data collection procedures.
(3) Encourage full cooperation of employees with study effort.
d. Study Team
(1) Develop project plan and study plan.
(2) revelop study instruments.
(3) Collect required data.
(4) Conduct study in accordance with study plan and project plan.
(5) Safeguard sensitive information collected as part of this study.
(6) Keep Deputy Director of Technical Operations informed on studyprogress, including a briefing of Phase I results by 23 December 1981.
(7) Prepare a report of Phase I results.
A-il0

12. CH[ IL L
Milestone :D, t e
a. Draft Project Pla', :r
b. 1raft 2tdy Plan 1 r;
c. TPASANA fechniral Staff Surve, '
P. TvMS ;i st Yea r rejl ts po'o eu 2 "Se. U]rlter nn Measu-re Data Col ert-d
f. Division Chief Interviews nC1pi,-ited ic , t -1
q. Data Analysis Com p eted I LDec .,
h. Brief Results to Deputy DJirector for 23 !)ec Di1 Technical Operations
i. Phase I Report Completed 29 Jan :1
A
I
A-i12

C APPEN~DIX B
TRASANA TECHNICAL STAFF SURVEY]
Ur
oil

TRASANA TECHNICAL STAFF SURVEY
TURN THE PAGE AND READ THE INFORMATION
AND INSTRUCTIONS
B-2I

PURPOSE
The purpose of this questionnaire is to find out how the TRASANA
Technical Staff views the TRASANA Productivity Measurement System (TPMS) at
thi s time.
GENERAL INFORMATION
l This questionnaire has been designed to answer specific management
questions about TPMS as a part of the evaluation of the TPMS three year trial.
Honest answers to the questions are required for a meaningful evaluation. You
are not required to give your name, but your organizational unit (office
symbol) is needed for grouping responses. Results will be presented to
management in the form of sumary statistics only.
This survey has three parts. Part I asks general background information.
Part II consists of several attitude statements about TRASANA and TPMS. You
are to indicate on the answer sheet the extent to which you agree or disagreeI
with each statement. You will probably disagree with some statements and
*i agree with others. We are interested in the extent to which you agree or
disagree with the stated opinions. Part III has three questions on your
familiarity with TPMS. The entire survey should take approximately 15
minutes.
B-3

GENERAL INSTRUCTIONS
1. Use a soft lead pencil for marking the answer sheet.
2. Read the instructions for each part of the questionnaire.
3. Read each item carefully, and be sure the number on the answer sheetmatches the item you are answering.
4. Fill in the circle on the answer sheet wAich SEST describes your -esocrseto the statement. Select only one response for eSc-cstatement.
5. If you make a mistake or wish to change your answe-, erase the markcompletely before enterirg a new ine.
6. Answer every item. If the answers provided are not exactly what you ooul,like, select the one which is closest.
ANSWER SHEET
1. In the space *NAME', print the complete office symbol for your branch. Ifyou are assigned to a divisional level job, enter your complete office symbol.EXAMPLE:
NAME (Last. First V.I.)+, ATIJAI- IT D 1AI 11 1 11 1 1 x l' O00ok000O00000O0000010
- --
2. Under "SPECIAL CODES" enter (left justified) the four number designation* for your career specialty area if you are a civilian. Military personnel*. enter duty MOS. EXAMPLE:
BIRTH DATE IDENTIFICATION NUMBER SPECIAL CODES
M.OAY IYW Al1CI[ F BJ H IJIiK I 1 3/,-0 1 3
SI Mg L( 5 3b
0o0 (0 6V (va(Di 0n00 1110 000*o0 400 0 Ao36r
3. rhe last page of this booklet is for you to add any comments about TPMS orthe three year test of TPMS (rRASANA MEMO 5-4) which you feel would be helpfulto the test evaluation, including suggestions for improvements.
*B -4
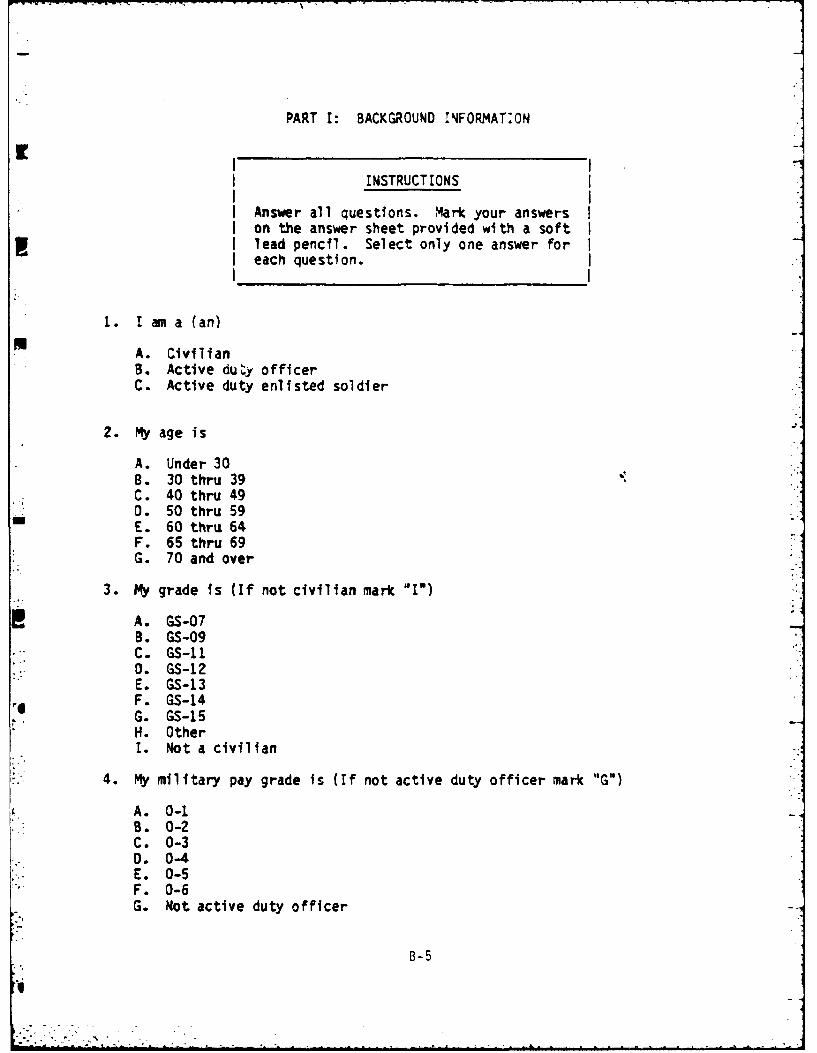
PART 1: BACKGROUND INFORt4Ar:ON
K I II
PAT INSTRUCTIONS
Answer all questions. -Mark your answerson the answer sheet provided with a softlead pencil. Select only one answer foreach question.
1. I am a (an)
A. CivilianB. Active du'- officerC. Active duty enlisted soldier
2. My age is
A. Under 30B. 30 thru 39C. 40 thru 490. 50 thru 59E. 60 thru 64F. 65 thru 69G. 70 and over
3. My grade is (If not civilian mark 'I")
A. GS-07B. GS-09C. GS-11.D 0. GS-12E. GS-13F. GS-14G. GS-15H. OtherI. Not a civilian
4. My military pay grade is (If not active duty officer mark "G")
A. 0-1B. 0-2C. 0-30. 0-4E. 0-5F. 0-6G. Not active duty officer
B-5

5. My military oay gride is (if not active duty enlisted soldfer -nark "
A. E-4B. E-5C. E-6
0. E-7E. E-8F. E-9G. 4ot active duty enlisted soldier
6. ' have 'eeq in my oresent ,rade fo7-
A. Less than . yearB. I year tut lot 2C. 2 years but not 30. 3 years but not 4E. 4 years but not 5F. 5 years but not 6G. 5 years but not 74 . 7 years but not 81. 8 years but not 9J. 9 years or more
7. 1 have worked for TRASANA (or its SAFEGUARD predecessor) for
A. Less than I yearB. I year but not 2C. 2 years but not 30. 3 years but not 4E. 4 years but not 5F. 5 years but not 6G. 6 years but not 7H. 7 years but not 8 (SAFEGUARD)1. 8 years but not 9 (SAFEGUARD)J. 9 years or more (SAFEGUARD)
8. 1 have worked for the Federal Government (including military service) forSa total of
A. Less than I yearB. I thru 3 yearsC. 4 thru 9 yearsD. 10 thru 19 yearsE. 20 thru 29 yearsF. 30 years or more
9. The highest academic degree or diploma I have is
A. High School Diploma/GEDB. Associate degree,C. Bachelor's degree0. Master's degreeE. Doctor's degree
* B-6

10. My orimary academic specialty, or the area in which ! have iad the* highest level of advanced study, is
A. EngineeringB. Physical sciences (physics, chemistry, etc.)C. Mathematics/statistics0. Computer scienceE. Social sciences (psychology, sociology, etc.)F. EducationG. Business (management, accounting, etc.)H. Liberal arts (music, art, history, etc.)I. Other
11. 'y position is best described asUA. ClericalB. Technical/Professional (team chief, team member, support)C. Advisory (non-supervisory)D. First-line supervisor (Branch Chief)E. Second-line supervisor- (Division Chief or Deputy)F. None of the above
12. lama
A. MalenW B. Female
13. My primary ethnic identity is
A. American IndianB. HispanicC. Afro-AmericanD. Asian AmericanE. Other
GO ON TO PART II
B-7

PART Er: TPMS OPIION SURVEY
INSTRUCTIONS
This section of the survey contains a series of attitude st3tements
designed to determiine how the staff feels about TPMS and its relation to th..
type of work .e do at TRASANA. Read each statement, and jecide *nether you'
agree or disagree with it. 4ext, select the letter that 2EST describes to
what extent you agree or disagree with the statement, and mark the cir:7e
under the letter on the answer sheet. In the event that none of the six
responses adequately reflects your opinion on the statement, select the one
which is closest to the way you feel, or which is least objectionable to you.
Answer all questions.
6,
U
Uo
B-
"-g -

I Agree D isagree
CHECK TO BE SURE YOU ARE AT T14E RIGHT 3 3PLACE ON4 HE ASWEq ShEE-T,. a
14. Overall. the performance standards at A 3 C a E FTRASAMA are high.
15. 1 an oroud to De associated oit A 3 C 0 E FTRASAMA oecause of its qualityproducts.
16. 1 like working at TIASANA. A 8 C a E F
17. There is a Tot of *lead wood* at A 3 C 0 E FTRASANA.
18. Most of the people at TRASANA do tigh A B C 0 E Fquality work.
19. The management at TRASANA does its .A a C 0 E Fbest to provide good workingcondi tions.
20. Supervisors in TRASANA will take care I A B C 0 E Fof their people, with or without TPMS.1
BE SURE YOU ARE AT 21 ON THE ANSWER SHEET I
21. Most people are treated fairly at A B C 0 E FTRASANA.
22. The overall productivity of TRASAMA A a C 0 E Fis not really very high.
2 . If TRASANA were on a profit basis, I A B C 0 E Fsuch as a private contractor orconsulting firim ft would not bemaking money.
24. Productivity in my branch often A B C 0 E Fsuffers from inadequate organizationand planning.
25. Productivity in my division often I A 8 C 0 E Fsuffers from inadequate organizationand planning.
26. 1 like doing the kind of work I do at A B C 0 E FTRASANA.
B-9

:..
S Agre Jvsgree
I ' 3M - - = -
per-rd nce.
29. " do not get -nuChy personal 3 0 ] -satisfacti on :,- ,my -oD.
"0. ",e skiis lave ire ,et matc.?Ied t3 3 1, 13the -equir-ements )f 'y Job.
3E SURE YOU ARE AT 31 ?N THE ANSWER SHEE7
* 31. ' lo not get much isefuT feedback on I A 3 C 0low 11 3m doing in my job.
32. ky supervisors g)neral'y give me the A S C .Frespect r deserve.
33. 4y suoervisors do not know what Z can 3 C 0 E Fdo.
34. 'y supervisor- does a good job of A C 0 E Fplanninq work and managing people.
35. r am usually free to decide on my own A 3 r 3 E Fhow to go about accompl ishing thetasks I am given to do.
36. 1 usually have very little say in the A 3 C 0 E Pschedule for completing my tasks.
37. r can use a lot of initiative and try I 3 C 0 E Fnew things in my job.
38. 1y job typically involves doing a IA C 3 E "sall part of a large project forwhich sompone else Is reponsible.
39. Quantifying productivity in the kind A 3 C 3 F Fof work I do can be done with rea-sonable accuracy (i.e. distinguishingbetween the quallty of contributionmade by different people over a periodlof time).
B-10

or
Agree O1sagree
I - -_I. I- 016- -A z;I V
40. TU'SAHA productivity can be increased A 3 C 0substantially without hiring rnre Ipeopl e.
41. 'fst people are giving T!4S a fair A 3 C 0 E Fchance.
P 42. TP4MS is a siopTe, easy to understand A 3 Esystem.
43. TPMS is flexible enough to accommodatel A 3 C 0 E Fmost of the projects done in TRASANA.
44. TPMS places emphasis on the factors I B 0 Ethat reflect differences inproductivi ty.
45. The distribution of productivity A B C D E Fpoints will show how the studymanager views the work qual ity ofindividual team members.
46. Productivity points and indicis do A 3 C 0 E Fnot really matter right now becausethe system is just being tested.
47. With experience, manpower resources i 3 C 0 E Frequired for projects can berealistically estimated.
48. With experience. computer resources A B C 0 E Frequired for projects can berealistically estimated.
49. 1 have seen some positive effects of A a C 0 E FTPMS so far.
50. In my division, most people have A B C D E Fmade up their minds about TPMS.
S1. I do not expect to score very well A B C 0 E Funder TPMS.
52. Considering that measuring A B C D E Fproductivity is not easy, TPMS isbasically a fair system.
53. In the long run, all divisions will A B C 0 E Fhave an equal chance to earnproductivity points under TPMS.
Sp B-11 -1

Agree 3 s
':-I
o r- ) duc t- points ;ndee- S-
46. -'14S -arT De easiT, .an:u te3 - 3 "-
57. " understand the mechinics ? . A 3
58. Vost of the technic3T *af jo ,ol 3 3jnderstand -DYVS.
59. ci know the five factors jsed -n A 3calculat4 ng a ;roJict scor?.
60. r do not know how a project score s A 3 -comouted.
JRN ANSWER SHEET CVER
61. 1 understand the difference beteen A 3 C 0 Eproductivity points (PP) andproductivity index (PI).
62. Given all the input factor values, i A B C 0 Ecould Compute my own productivityindex right now.
63. As long as a person does his job, he IA C I Eneed not worry about TPMS because hewill come out okay.
54. For the most part, productivity oolns!are distributed according to the A 3 0 ramount of time spent on a oroject. -
65. If a division chief feels an A 3 C 3 Eindividual has not been Justlyrewarded for work on a project, hecan create extra productivity pointsfor that person.
B-12

Agree Oisagree
', [
66. A person has the option of not using A 3 C Dtime charged to overhead activitieswhen calculating his Droductivfiy Iindex.
57. Jndr '4S. a study canager is 3 E 3 C 'encouraged to 4ork 'or the lighestquality (PRB) score, even at Vieexpense of being late or over onmanpower.
68. Productivity points and merit pay A 3 C 0 E Fare not related at this time.
69. TPMS will only affect management. A C 0 r
70. 4anagement practices have been A 3 C 0 E Fchanged by TPMS.
BE SURE YOU ARE AT 71 OM THE ANSWER SHEET
71. More planning is being done for A B C 0 E Fprojects now than before TPMS.
72. TPMS will be a useful tool for A B C D E Fmanagement.
73. After the bugs are worked out, TPMS A B C 0 E Fwill be a useful factor for I.individual performance appraisals.
74. My productivity index (?I) under A a C 0 E FTPMS is pretty much beyond mycontrol.
75. My supervisor has discussed with me A B C 3 E Fthe distribution of productivitypoints on the projects on which thave worked.
76. Management practices have improved [ A 8 C 0 E Fas a result of TPMS.
77. TPMS represents no major change in A B C 0 E .emphasis by TRASANA management.
["
B-13
..... .
D-A122 285 PHASE I EVALUATION OF TRASANA TECHNICAL STAFF 2/2 \PRODUCTIVITY MEASUREMENT SY..(U) ARMY TRADOC SYSTEMSANALYSIS ACTIVITY WHITE SANDS MISSILE RAN. JAN 82
UNCLASSIFIED TRASANR-TR-5-82 SB1-AD-F@50 972 F/G 5/9 N
smmomhhhhhhiu

ioui,112-0INIIII1 H I--- ii
I1111=_2 LA 111_L
MICROCOPY RESOLUTION TEST CHARTNATIONAL BUREAU OF STANDARDS- I963-A

tr
r -- - - -[
,.Agree -sagree
7
' I 79. 4?y .-erfornarce 3oor~lsaT 'or this " ] E .• year oi'l not -,e -tfluenced by -214S.
M(. -')S mill -;at af~ec: -,e ery -luch. A 3 ' S -91 gl. Assuming that oroduct y :in e A 3 C I C
Increased by doing -nr- vor( ordoing higher quality 0ork, TMS W7
73 lead to increased product.ivity inthe long run.
72. ?MS hias -esulted in a -nore A 3 C -
competitive environment among the
TRASANA staff.
31. If PMS is adopted at TRASANA, A 3 C Ethings wd not really change very
uc .
34. TPMS has substantially affected MY A 3 C E F
,b ranch.35. If TPMS is adopted at TRASANA, A 3 C 0 E F
productivity will not change. vy"
86. 1 do not care whether TPMS succeeds orl A , C 0 E F
fails in Its three year test.
87. I do not know very much about TPMS. I A B C 0 E F
88. 1 would like to know more about TPMS. A 8 C 0 E F
GO ON TO PART III
B-14

PART III: TPMS FAMILIARITY AND COMMENTS
I INSTRUCTIONS .
I This section of the survey contains questions ,designed to find out how familiar the TRASANAstaff is with various aspects of TPMS at this -
.1 time. Read each question carefully and recordyour answers on the answer sheet. Answer allquestions
CHECK YOUR ANSWER SHEET TO BE SURE YOU ARE ON THE CORRECT NUMBER
• 89. Which of the following best describes your familiarity with TRASANAMemorandum 5-4?
A. I do not know what it is.B. I know what it is but have not seen it.C. I have seen it, but have not looked through it.D. I have browsed through it quickly.
" E. I have read it.m F. I have read it more than once.
G. I have studied it thoroughly.
. 90. Which of the following best describes your overall understanding of TPMSat this time?
A. I fully understand it.B. I understand it fairly well.C. I do not understand some parts of it.0. I understand very little of It.E. I do not know anything about it.
91. Which of the following statements best describes your overall feelingabout TPMS at this time?
A. I like it.B. There are some good and bad points to it, but the good probably
outweigh the bad.C. There are some good and bad points to it, but the bad probably
outweigh the good.0. 1 don't like it.
Please use the attached page for comments about TPMS which would be helpful tothe evaluation team, including suggestions for changing TPMS or 5-4. Thankyou.
B-151
B-i i71

APPENDIX CISUPPORTING TABLES
U-
S
' C-'

TABLE C-i
TTS AND SURVEY SAMPLE BY DIVISION
DIVISION PERCENT OF TTS PERCENT OF SAMPLF
A 12.6 ]1.1
B 9.5 1(9.5
C 13.0 12.6
0 15.0 15.
E 14.6 17.9
F 11.1 7.4
G 8.3 6.3
H 15.8 18.4
TOTAL 99.9 100
aDoes not total 100% due to rounding.
C-2
..U .- - : . . . -. : .. : - . . . .- - ". . . . _ - : . . . . . : :

TABLE C-2aAGE OF RESPONDENTS
AGE CATEGORY NUMBER PERCENT
Under 30 21 11.1
30 to 39 57 30.0
40 to 49 78 41.1
50 to 59 29 15.3
60 to 64 4 2.1
65 to 69 1 0.5
aTOTAL 190 100.1
aDoes not total 100% due to rounding.
TABLE C-3
RESPONDENT TIME AT TRASANA
* TIME (YEARS) NUMBER PERCENT
Less than 1 yr 25 13.2
1 21 11.1
2 8 4.2
3 3 1.6
4 7 3.7
* 5 11 5.8
6 19 10.0
7 0 0
8 6 3.2
9 or more 90 47.4
a
TOTAL 190 100.1aDoes not total 100% due to rounding.
C-3

g-U
TABLE C-4RESPONDENT TIME IN GRADE
TIME (YERS) NUMBER PERCENT
Less than I yr 31 16.3
1 17 8.9
2 12 1 6.3
3 16 8.4
4 16 8.4
5 20 10.5
6 10 5.3
U 8 4.2
8 6 3.2
9 or more 54 28.4
TOTAL 190 99.9
aDoes not total 100 due to rounding.
TABLE C-5 JRESPONDENT TIME IN FEDERAL SERVICE
"-ITIME YERS) NUMBER PERCENT ,
Less than 1 yr 3 1.6
1 to 3 13 6.8
4 to 9 36 18.9
10 to 19 75 39.5
20 to 29 60 31.6
30 or more 3 1.6
TOTAL 190 100
C
*i c-4
*
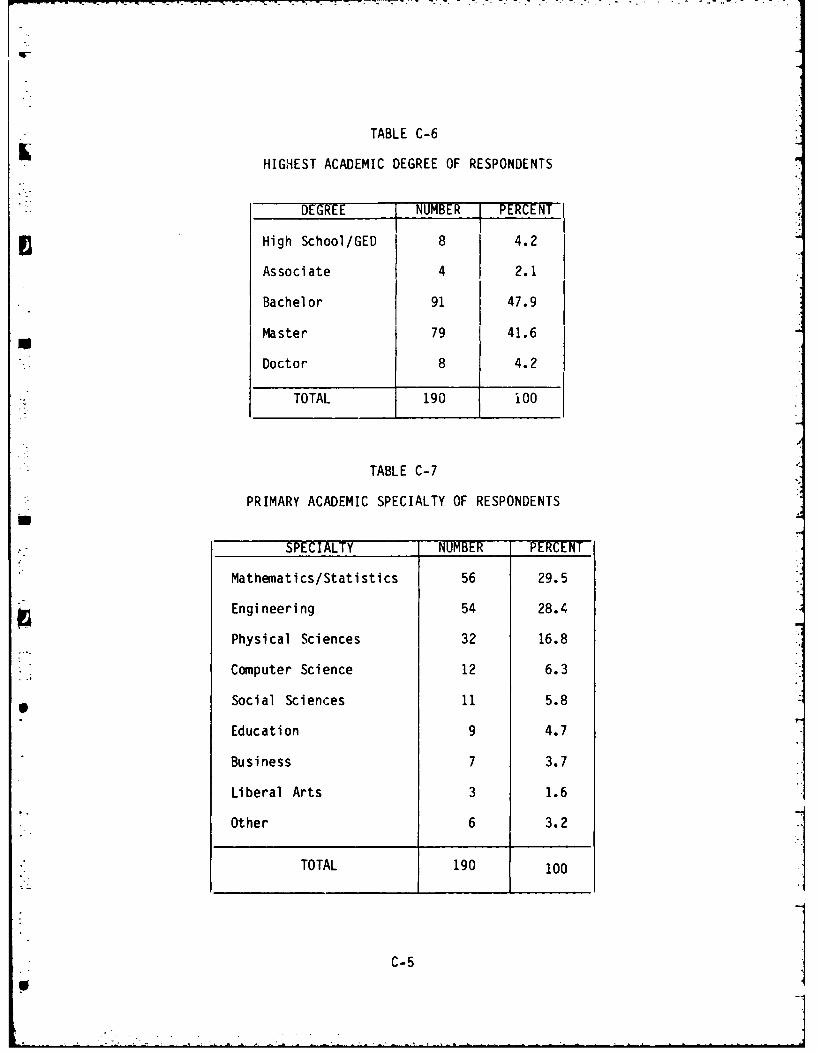
TABLE C-6
HIGHEST ACADEMIC DEGREE OF RESPONDENTS
DEGREE NUMBER PRWI
High School/GED 8 4.2
Associate 4 2.1
Bachelor 91 47.9
Master 79 41.6
Doctor 8 4.2
TOTAL 190 iO
TABLE C-7
PRIMARY ACADEMIC SPECIALTY OF RESPONDENTS
SPECIALTY NUMBER PERCENT
Mathematics/Statistics 56 29.5
Engineering 54 28.4
Physical Sciences 32 16.8
Computer Science 12 6.3
Social Sciences 11 5.8
Education 9 4.7
Business 7 3.7
Liberal Arts 3 1.6
Other 6 3.2
TOTAL 190 100
C-5S

TABLE C-8
TECHNICAL STAFF SURVEY RESPONSES TOITEMS 14 TO 88(PERCENTAGES)
1 s ~ - ~ DISAGREErS S s- S - S - -ST 0 L L 0 7
ITEM R M II M p0 E G F 0
NUMBER N W H H W NG H T T H GL A L H L A i_Y T Y Y T Y
-A B C D E F
W 14 27 48 16 6 2 1
15 33 38 19 6 3 1
16 53 29 12 2 3 1
17 16 22 24 16 13 9
18 22 45 20 9 3 1
19 26 31 22 6 8 7
20 26 35 20 9 5 5
21 28 38 21 6 6 1
22 5 14 21 17 25 18
23 18 12 18 14 23 15
24 9 14 21 12 19 25
25 5 20 24 16 16 19
26 49 27 13 5 3 3
27 6 8 11 8 27 40
28 33 40 16 6 3 2
* 29 5 15 12 14 23 31
30 30 39 11 8 7 5
C-6

TABLE C-8 (CONTINUED)
AGREE DISAGREE,..s s s s s sv T 0 L L 0 TITEM R M I I M R
0 E G G E 0NUMBER N W H H W N
G H T T H GL A L L A LY T Y Y T YA B C D E F
31 15 21 18 12 19 15
32 39 33 14 5 3 6
33 7 12 17 11 30 23
* 34 23 36 19 7 9 6
35 51 27 14 4 2 2
36 12 11 12 18 24 23
37 39 31 14 7 5 4
38 19 19 12 8 17 25
39 5 14 17 11 22 31
40 22 29 25 6 13 5
41 10 33 38 7 8 4
42 3 15 15 18 22 27
43 4 21 18 20 18 20
44 1 13 26 20 14 26
45 7 21 23 13 17 19
46 4 11 16 21 19 29
47 10 39 20 12 9 10
48 8 30 23 16 12 11
49 4 12 18 18 18 30
C-7
-1

TABLE C-8 (CONTINUED)
S AGREE DISAGREE
T 0 L L 0 T
ITEM R M I I I M R0 E G
GE
NUMBER N W H H W NG H T T H GL A L L A LY T Y Y T Y
A B C D E F
50 12 24 24 29 7 5
51 12 12 19 19 24 14
52 3 15 32 15 16 19
53 4 11 22 17 23 23
54 4 9 28 17 13 28
55 4 14 21 18 17 26
56 27 33 23 11 6 0
57 17 37 21 14 6 5
58 5 16 22 26 22 9
59 31 21 18 7 7 16
60 1.2 7 14 18 17 32
61 28 23 16 10 7 16
62 23 20 12 14 8 23
63 2 19 12 23 21 23
64 14 35 20 15 10 6
65 17 14 21 17 13 18
66 14 8 19 18 19 22
67 8 12 12 19 23 26
468 28 23 17 12 10 10
C-8
171

TABLE C-8 (CONTINUED)
U AGREE DISAGREES S S S S ST 0 L L 0 T
ITEM R M I I M R0 E G G E 0
NUMBER N W H H W NG H T T H GL A L L A LY T Y Y T YA B C D E F
69 2 3 5 12 22 56
70 14 22 28 13 11 12
71 12 29 31 9 8 11
72 9 25 30 10 12 14
73 6 17 24 12 22 19
74 16 20 21 19 15 9
- 75 18 13 13 7 11 38
76 1 8 24 24 18 25
77 9 14 19 24 22 12
78 1 12 26 15 19 27
79 16 14 18 28 16 8
80 7 8 13 20 26 26
81 12 17 22 14 16 19
82 11 20 23 20 13 13
83 5 14 24 20 18 19
84 5 14 29 26 17 9
85 10 19 28 27 9 7
86 8 9 13 19 23 28
87 13 9 19 11 25 23
88 16 21 24 16 10 13
C-9

TABLE C-9
TECHNICAL STAFF SURVEY RESPONSES T'ITEMS 89 TO 91(PERCENTAGES)
ITM ___RESF ONSEITEM -." °
A. I do not know what t is. 11
B. I know what it is but have not seo it.
C. I have seen it, hut have not looked throiqh it. k
89 D. 1 have browsed through it quickly. 24
E. I have read it. 2?
" F. I have read it more than once. 30
G. I have studied it thoroughly. 9
A. I fully understand it. 5
B. I understand it fairly well. 42
90 C. I do not understand some parts of it. 30
D. I understand very little of it. 20
E. I do not know anything about it. 3
A. I like it. 1
B. There are some good and bad points to it, but 33the good probably outweigh the bad.
: ' 91
C. There are some good and bad points to it, but 47
the bad probably outweigh the good.
D. I don't like it. 19
C-10

TABLE C-10
COMPARISON OF SUPERVISOR AND
NON-SUPERVISOR SURVEY RESPONSES
CLUSTER 1 SUPERVISOR NON-SUPERVISORS tVALUEa
(n = 26) (n = 127)
TRASANA 4.92 h 4.19 4.41(.76) (.80)
UJob Satisfaction 4.84 4.43 2.30
(.84) (.89)
Control of Work 5.06 4.52 2.62(.93) (1.09)
General Reaction 3.84 3.36 2.90(.76) (.74)
Fairness 3.56 2.82 2.98(1.15) (1.18)
Understanding 4.85 3.84 6.85(.66) (.79)
Management Tool 3.92 3.35 4.06
(.64) (.70)
TOTAL 4.29 3.71 6.52(.41) (.44)
* aAZI t-vaiues are significant beyond the .05 level (critical values:
p < .05 = 1.96; p < .01 = 2.58; p < .001 = 3.29).
bTop number is the mean and the number in parenthesis is the standard
deviation.
C-11S :CI

TABLE C-1I
TTS AND PI SAMPLE BY GRADE
GR-A-I PERCENT OF TTS PERCENT OF P1- SAMPLE
~CIVIL IAn":
8S-1 4.2 2.7
9 3.5 5.3
11 6.5 9.2
12 25.4 28.3
13 26.2 32.2
* 14 12.3 3. 3
15 3.5
OTHER 1.0
MILITARY:
Officer: 12.7 12.0
Enlisted: 5.8 6.0
TOTAL 100. 1 a 100
aDoes not total 100% due to rounding.
C-12

K
-TABLE C-I2. TPMS SCORING DATA BY BRANCH
BRANCH PROJECT'Sa TMM REGULAR MAN DIR JUDG . DISC DISC TOIAL P1OVERHEA) OVERHEAD AWARDSL AWARD PP PI
1 2 58.41 4.0t 0.43 0 0 0 108.80 1.812 1 80.71 6.75 0.11 0 0 0 136.73 1.643 10 44.33 3.02 4.43 -2 2 2.36 72.48 1.634 3 31.17 0.56- 0.45 0 0 0 50.92 1.635 8 61.99 7.80 1.01 41 0 0 105.09 1.626 3 165.29 2.71 0.23 0 0 0 265.28 1.597 10 106.26 2.6 , 0.07 -1, +1 1 1.50 168.94 1.588 4 35.00 7.35 0.57 0 0 0 58.74 1.589 7 73.36 9.44 0.54 0 0 0 121.14 1.57
10 12 36.18 5.70 0.90 0 1 1.0 58.88 1.5511 9 98.09 16.63 0.38 0 5 2.08 165.31 1.5212 9 32.64 16.72 0.16 0 3 0.75 57.51 1.5013 2 22.74 13.72 0.85 0 0 0 39.53 1.4714 10 28.89 9.01 0.18 0 1 0.25 45.36 1.4415 12 54.74 33.07 0 0 2 2.45 91.59 1.4216 3 3.68 4.03 0.1 0 0 0 6.87 1.4217 4 32.43 4.55 2.69 0 0 0 45.98 1.4118 2 19.86 3.56 0 0 0 0 28.76 1.3819 4 33.46 44.14 4.73 0 1 0./6 57.63 1.3b20 4 16.21 11.44 1.94 0 2 4.00 19.98 1.3321 17 21.78 50.34 0 0 3 8.0 43.77 1.3022 8 28.46 12.70 0.11 0 0 0 39.49 1.2723 2 17.57 13.12 0.56 0 0 0 24.27 1.2324 2 0.90 4.96 0.35 0 0 0 1.59 1.17
NOTE: These data were taken from the 7PMS scoring sheets submitted by each division office. Branches
are arranged from highest to lowest PI.
arneludes the total number of projects for which productivity points were awarded to the branch.
bonly interbranch judgrental awards (JA) are showrn. A negative JA means that the branch received up to 30percent less PP's than earned based solely on ranpower charges. A positive JA means the branch receivedup to 30 percent more PP's than earned based solely on nanpower charges. All of these JA's were in thescne division.
C"11
*C-13

1-4MK
[A3L' c-1 3. IPM Ni DATA lv
OW ',ION
...................................... : -...... ......................... ....... ....... .
1,8' Tr L M. ",ft Am MAN !1k Jl,'l flsi., Jj'.I ,.,F AD AWA<,< AWAHD pp I
.------ 4-- J.- -:+ - - .-.-
UJ ?b1.4.' iI.h1 (4) 1.31 0 0 01 45t.'b .t,(
14 ? 3.'P, b.s5 (12) 5.6<4 -I 3 3.8, !4,j. :4 1.5 I
5 7 7. 65 0/. 39 (35) 1.841 90 0 USm~i5 b
13 158.38 11.10 (7) 1.38 0 1 U.4 ?51.07 .5
10 159.94 66.74 (42) 0.87 0 6 2.85 263.31 1.46
81./0 78.67 (90) 1 5 +1 3 9.2 152.00 .39
1" 110.01 108.16 (98) 5.80 0 2 2.45 18?.81 1.35
7 48.59 31.51 (65) 2.56 0 2 4.00 72.83 1.32
U.'TF" 'Phese data were taken from the TP1S scoring sheets submitted by each dioison office. .Divisions areSby Pr.
"Includes ,nly projects for which the divieion was primr, ily responsible.
bNumber in parentheses are percent of TMM, rounded to nearest whole number.
0Only interdiioiaon JA's are shown. One division reeived lese PP'e and another received nore than ear'ned basedsolely an manpower charges for one project.
*C -14

3 APPENDIX D
TPMS SCORING SHEETS
D- 1

4:
I -
2'D-2

i iscretionary ,ouzvtTPMS BRANCH SCOlRING SHEETrnmt no
Branch:__",.I__-Q__F___
Q '.
I . - . -A -
I I4
-Q /__ Az
_ _ _ _ _ _ 5I 1
_ _ _ _ _ _ _ II _0
_ _ _ _ II I z?_____ ____ _ I I - ~ T I...
* _________ ~
Prodctivty Idex Sum of column OilProuctvit Inex um of column 4
1. Record overhead charge accounts as separate projects. >2. Entries marked with a" asterisk are optional.
D-3

3iscreticnary -roauc T, , y
N1 S :~~ DLSC'2RIG 3r iEi Pm4n. lpo'
' / ,~~. /. . /.' ane: , z. r" " .
-Z~
.e-_: Q. -,, .-- -/S- , '-." -. 4.' , . ._ "4 *.,,.. , I
PoducItiv Index .um' - u 4
_ _ _ _- "" it. I - ,'. ' . .-_ I'2 j'" '-
_ _ _ dele t
_________ f1 --- --- --- -- _____
* _ _ _ _ - ___ -_ IPrdctvt Idx u , oum 1
1. Record overhead charge accounts as separate projects.2. Entries marked with an asterisk are optional.
* D-4
APPEmnfIX F2
MATHEMATICAL ANALYSIS OF
THF TPMS SCORING ALGORITHM i
E- 1

APPETI)IX E
MATHEMATICAL ANALYSIS OF
THE TPMS SCnPING ALCORITHM
1. GNFPAL
This appendix provides the dptailed mathematical analvsis of the TPMS scorinoaIooritim.
9. THF TD'IS MWASI !P"FNT FI 'CT['!
The assiqnment of the productivitv index ,(0) hv the measturement function can
he convnntlv senmentpd into a sequPnce of assiqnments bv component func-tions. First, a Pro.ict scorinq function vields a nroiect score (5) fromrelevant variables. Next, usino the concent of productivity points (OP), thcscore is apportioned amonq the units and individuals who contributed to th,-pro.iect in relation to manpower expended and to the quality of the cmntrilu--..--
A I tion. Finally, the PT for the individual or the unit is qiven as an averaqeof proiect PP earned, weiqhted hy the manpower expended on the projects.
a. Project Scorinq Function
The S is the oroduct of five project variahles: manpower utilizationefficiency (R), computer utilization efficiency (C), timeliness (T), quality(0), and priority (P). Thus
S= R x C x Tx O x P
Each of these five factors is discussed separately.
(1) Priority. Oriqinally the value of P was to vary from 1.0 to 1.2
with the value of 1.2 assiqned to external projects. For internal projectsthe value of P was to he determined by the PMR. Since all projects wereassiqned a P value of 1.2 durinq the first scorinq period, this variable willhe held constant in the subsequent analysis.
(2) Oualitv. The value of 0 is assiqned hy the PRR upon review ofthe project final report. Values of 0 may vary from 1.00 to 1.50.
(3) Manpower 1ltilization Efficiency. The value of R is determinedfrom the planned manpower usaqe for the project (Rp) and the actual manpowerused on the project (RA) as follows:
n.7 when Rp/RA < 0.5
R = 1.0 when Rp/RA = 1.0
1.2 when Rp/RA > 2.n
• E-2

W-
Intermediate values of R scale up linearly between 1.0 and 1.2 and scale downlinearly between 1.0 and 0.7. The expression for R as a oiecewise linearfunction of Rp/RA is then
n.7 when Rp/RA < 0.5
0.6 (Rp/RA) + 0.4 when 0.5 < Rp/RA < 1.0R =-
0.2 (Rp/RA) + 0.8 when 1.0 < Rp/RA < 2.0
1.2 when 2.0 < Rp/RA
U
The qraph of this function is shown in fiqure E-1.
1.2-
0.7
0.5 1.0 2.0R VAA
Fiqure E-1. Manpower Utilization Efficiency (R)
E-3

!2
(4) Computer utilization ef iciencv. The value of C is dpterminedfrom the planned computer nsaip for thp priect (Cp) and hp actual 7:mputprusane ( /) as follows:
0'1 when r,/rA
S_. 1.n when rl, - n/9
1.1 wher ' !
Interlediate vaijes nf C ScalP up andI dnwn 'inprar'v froi" . Tq
expression for r a rnerewiso inear o s in, r,)n of A
, l.l wh~~ ~. "r; r A
Fiqure F-2 is the qraph of this -ri ,,r * , , hP course of the firstscorinq period the measurp of n',p ''- ,iio was 'hanqpd. Recause of this. 51of the 61 proects scored in the t :pr ,I, wpr& administratively assioned aC value of 1.
(5) Timeliness. The value )f , i a function of the planned
completion date and the actual complPtiun dato'. The value may vary between amaximum value of 1.1 for early completion and a minimum value of 0.8 for late
completion. The functional relationship yipldinq T is project dHoendent andis determined hy the project study mananer with the approval of the PMB.Fiqure F-3 qives the timeliness value as a function of time for one project.
(6) Project score values. Values for project scores can vary from
0.504 to 2.6136.1 A value of 1.56 miqht he viewed as a "base" score -
representinq a project with minimally acceptable quality (R or 0 = 1.3),exactly on time (T = 1.n), and usinq exactly planned manpower (R = 1.0) and
computer usaqes (C = 1.n). The minimum score for a project of minimal'yacceptable quality is n.7R6?. Table F-i shows maximum, minimum, "base", andminimally acceptahle proiect scores with C varyinq in the first case, and held
constant at 1.n in the second case. The project score has a wider ranqe of
possile values when C is not held constant.
lAl projiects seored "'n the first pe'iod have P = 1.P. When ca ulatef t,!th
a77 7a<ahles (n7ual to the 7.oest vaT~e except for P 12, the l.oest scoreie n 0.804 P.
E-4I-

1.1
1.0
0.9
U
U
0.; 1.0 2.0
Fiqure E-2. Computer Utilization Efficiency (C)
M 1.11.0
T
O.8
2 We.~wd2 W"ol
eml am P, Daft Lat
Fiqure E-3. Timeliness (T)
E-5

*-
r
TAP' F- ]
PPr,0rrT SCORFS FrIP PFDRFSFNTATT VF IMPIT
11ariah1p ValiP nf
rase P r T 1,
i 'l x . . .
vir i l I ]v cce,-t, p j? i.2 i .. .0 q ,1. 7,r
Constant valtup nf C
P " P C T"! Case
'!a x imum 1. 9 1, 1.? 1 1.1
Minimum 1.9 I.n 0.7 1 0.8 0.67?
Rasp 1.2 1.3 1.n I 1.n 1.56
Minimally Acceptable 1.2 1.3 0.7 1 f. n.R736
h. Produ~tivity Point Fistrihution
Productivity points are qenerated for a project by multiplyinq the projectscore by the actual manpower usaqe (in man-months).2
PP = S x RA
These PP are then distributed amonq the units and individuals who charqed timeto the project. Basically an individual or unit is awarded PP in relation tothe mannower charqed to the project. However, the qualitv of an individual'sor unit's contribution can result in a plus or minus 3n percent deviation from
2 0verheM can he treated as a nroiect with a score ofP 1 for aeneral overheador P for nnnag.ment directed overhead.
E-6I

this straiqht charqe to manpower award. In addition, the distrihution of PP
is done in a hierarchical manner which makes deviations he'yond 30 percent
possible in some cases. Points are distrihuted first to divisions, then tobranches within a division, and finally to individuals within a branch. Atany of the 3 levels ir. the distribution a plus or minus 30 percent deviationfrom a straiqht charqe to manpower award is possible.
(i) fivision. If division i charqes M i man-months to a project itearns
PP x (Mi/RA) x dior
S x Mi x di productivity points
where n.7 < di < 1.3
The d i is the division ,iudqmental factor. If the award is strictly accordinqto manpower charqed, di = 1. Since all manpower charned oriqinates from somedivision and all PP must he awarded:
RA = iover
contrihutinq divisionsand
RA = 1 (Mi x di)over
contrihutinq divisions
(?) Branch. 3 The S x Mi x d- productivity points distributed todivision ,j are next awarded to hranches of this division which contributed tothe pro.iect. If branch k of division i chared Mik man-months to the projectit earns
S x Mj x di x(M,ik/M.i x hkor
S x M.ik x dj x hk productivity points
where 0.7 < hk < 1.3
3 rn the hierachicaZ distribution or PP, perRons at tio dl?'ofson level (notaeempe to a br~anc~h) ar'e awar'd Pi' at tlis level..- 'v th.O dIlscsqinn,
divinqion Ptaff prpronne, are treated tl-e .ame ag a hancb.
F-7

The hk i- the branch iudomental factor. If the award is strictly accordinoi toiar)pnwPr harp hk, = i. Since all livisi il maopowr (harfP, nriejnatps
from sori branch and all PP mus - hp a.,ar.'lP-r
ovo P Ftrih!1+ n
kcanq-hps nf ,!lv l,cn
41 1r' P/ ,a! Tho P k x x k rrndLC , s s r
'N fP,! #.) branch K are )Pxt Iistrihutpdr tr)t -he inlividual-, w-ifoin 4hi- h.arch
who co ri rit); d to the project. If individual 1 of branch k of di,io -
char e ,I ] ar-ln- nths to thp !,r i ,P hr, Parns
S k x d4 x ')k X'"ikl/Mik,X nlor
S x Mikl x d.i x hk x pl productivity points
where n.7 < pj < 1.3
The )l is an individual iidqnental factor. If the award is strictly accordinnto mannower charqed, P1 = 1. Since all branch mannower orininates from someindividtiai and all PP must he distrihuted:
Mi k A.- j k lcontrihutinqindividualsof branch k
Mik x di x hk = (Mkl x d' x hkxcont ri butinqindividualsof branch k
0 (4) fiscrtionary Productivity Points (nPP). In addition to theproductivity points qenerated hv the pro.iect score and manpower expended,there is another class of points - discretionary productivity points. Thesepoints are awarded to units and individuals whose contributions to a proiectare not adequately rewarded by the standard point distribution process.
. TRASANA Memo 5-4 describes nPP and the constraints on their awardinq.
4 F-8

c. Assiqninq the Productivity Index (PI)
The PI is an averaqe of project PP weiqhted hy the manpower expended on thenroJects. This assinnment is descrihed in detail for divisions, hranches, andindividuals.
(1) Division. If division J contributes to n projects (includinqoverhead) for i = 1, 2, 3, ...., n with scores Si, expendinq Mi i man-months,earninq FPP 4 theni i
__ (Si x mij x dii) + nDPPi iPl = i
U2E Mij
Si d x _ _ _ X_ _ _ _
Mi " i i
(2) Branch. If branch k of division j contributes to n projectsm (includinq overhead) for i = 1, 2,..., n with sccres Si, expendinq Plijk
man-months, earninq DPP 5 theni ik
i (Si x Miik x di, x hik) + DPPii k
Miik
1
Mik@/ Mi ik O-PPi ik
= /--Si x dii x bik x _ + 1\ -Mi ik M ik
i i
44,t the division l.evel onlu PP for exceptional. ontribhution and proiectresc 4e are counted.
-4t thie branch Zev.l onbu DPP for exceptiona. con, rih,tion and rno.4ec.t rescne
rcue
S.

(3) Individual. 6 If individual I of branch k and division jcontributes to n projects (now overhead may be deleted) i i,2,..., n withscores Si , expending Mijkl man-months, earning DPPijKl then
2> (S. x Mij x d.. x b x pi + Du p ..1 J kl J 'k l
-I M.J~
mij kl-- Dp, i kl
. (S i x Mijkl x dij A 0ik x ri x- M 'KM
3. MEASUREMENT ALGORITHM ERROR ANALYSIS
Any measurement contains some error. The usefulness of the measurement canonly be fully realized when the magnitude of the possible error is clearlyspecified. This analysis provides approximate bounds for the numerical errorassociated with the project score and the PI. Numerical error in the computedvalues of a function is dependent upon the algorithm chosen for the computa-tion. Once a correct algorithm is chosen, numerical error may be caused by(1) error in input values, (2) algorithmic error (i.e. round-off error), and(3) mistakes (i.e. arithmetical). The project scoring sheets indicated theuse of fairly consistent procedures for computing project scores from theinput variables. The analysis of numerical error in project scores assumesthese procedures. 7 Standard forms are used to compute the PI given theproject scores. The computational procedure suggested by these forms willalso be assumed for the analysis of the error in the P1.
a. Project Score Error
First the error in each of the four factors is discussed, and then total erroris described.
(1) Quality. The value of Q is given by the PRB to two decimalplaces, resulting in an absolute error of no more than 0.005. Because thevalue of Q is near 1, the maximum absolute relative error can be taken to bethis same value (0.005).
6The PI for division level staff is computed by a different formula. Refer to
TRASANA Memo 5-4.
7See Conte and de Boor (1980) for a discussion of numerical error analysis.
E-10

(2) Manpower utilization efficiency.K(a) Project scoring sheets indicate that the formula for computing R
is
0.7 when Rp/RA < 0.5
1 1 - 0.3 A P when 0.5 < Rp/RA < 1.0
R R P
R -R1 + 0.2 P A when 1.0 < Rp/RA < 2.0
/ 0.5 R )
1.2 when 2.0< Rp/RA
This interpolation formula is inconsistent with the previous definition of R interms of Rp/RA. In fact, the above formula does not give R as a piecewiselinear function of Rp/RA, but rather
W 0.7 when Rp/RA < 0.5
-11.3 - 0.3 (Rp/RA) when 0.5 < Rp/RA < 1.0
-1
1.4 - 0.4 (Rp/RA) when 1.0 < Rp/RA < 2.0
1.2 when 2.0 < Rp/RA
(b) Assuming error free input values, the use of the interpolation* formula rather than the formula of paragraph 2a(3) could cause the value of R to
be in error by as much as 0.05. Since the value of R is rounded to two decimalplaces before recording on the project scoring sheet and inclusion into themultiplicative formula for S, the absolute maximum error could be as much as0.055. Since R is close to 1, 0.055 would also be an approximation of themaximum absolute relative error.
(c) A more useful analysis of the error in R would assume the use ofthe formula of paragraph 2a(3) for the computation. The value of Rp could beassumed to be exact, so that input error is entirely the result of RA. Thevalue of RA (in man-months) to two decimal places is provided by the TRASANAF'inpower Utilization Reporting System (TMURS). 8 The maximum absolute input
8 The most recent version of TMURS reports man-months to 3 decimal places.
E-11

i near 1.
(rId ' -h TtHDS -anpower a, no,!nf 5~.:1t... , 1,2 '
- t 5
, -r"pi]-', 7rvi r'f9OrtS
'anpo~ .,r charIec, tor ,1l t nps nf a c.' i + '2 i' ' "
•ao irz n'1 ro n r tin vr I -e - '' . ", h r r" r1 ,
l n ' - ,r '.nd r -o orrei ant~ 4,F'"' ' ' v ,' ! ,l r. 2'r ' , , f'/,,. *r '2:. ...,
q'lq fF'"l" ," G l:(l'~ :,qI;.0
*cln nQ~ f''p ,/ r] .1 t 'v " )fi*J~ i r. 1 ,-
. fl , - i','2 ,1',
i o f ut fiii ion, va;f:, i i ecv ~rn h ~rt;rioi* ~ ~~~~~~~~ nos 1r1et je' crdwt no~cI~ a eo .S ieti
trhecas, for s'ihse ".noriP, ap ,vino v,,, r he n rical rro .u t v 'q r
is desc-r ihe. This desription !f.,l D 4- assume ithe,,, use of.l T te-, forla f na, ... r• h
r )a n , . h
Of CA. The value Of CA i7 aSured in Standard Un 4,ts of Processinq (SUP) i ....consists of the sum of Central Processin Unit (CrPU) time, Innut/lutpilt (fln)time, and Control Card/xecitiv Reouest (CC/Fe) time in hours. Suppose tha.the valj of CA is reported in SUP hours to the nearest hundredth .3.6 seondc).This error in CA results in an approximate maximum ahsoiute error of' n~flfl in ilecaidse C is near 1, .oip approximsates the maximu m absolute relative error in
C.faA1) Timeliness. The tii einess factor is a function of the devia-
tion of the actual deCivery date of the completed project report from thePlanned delivery date. This functional relationship is roiect dependent.detailed error analsis would require this function in addition to knowltatr,the accuracy with which the deviation in dates is meoasusred (e.ne. nearet day,nearest week, etc.). If the deviation can he assumed to he exact (in days,,s\the nmerical error in T is solely a conse aiance Of the current practice ofrouindino T to two decimal places hefore its incorporation into the formula forcaS. The maximum ahsolteu rlativ error is then n.OS.
(5) Project Score. The relative error in S is simply the sum of therelative errors of its factors. Since S is near 1, relative error approxi-mates actual error. For the first scoring period (using the interpolationformula for R) the project score has maximum absolute (relative) error of
npproximatel 'rr71. This result assumes exact arithmetic in the computationsI except for the intermediate roundinqs of R, C. and T. A final roundinq to two
decimal places results in an approximate error of 0.076 in the project score.A more useful result would assume that the formula of paragraph 2a(3) is usedto compute R. If the value of T is assumed to be exact and all arithmeticalcomputations are exact, the maximum absolute (relative) error in S is approxi-mateply 0.r7. If intermediate roundinas of R, C, and T, a final rounding of Sare done to two decimal places, the maximum numerical error in S is approxi-mately n.027. Rounds for the numerical error in the proiect score are
E-i?
-- ---------

summarized in table F-2. The results presented there assume exact arithmeticexcept where otherwise noted. A numerical example is qiven in table F-3 toillustrate the efficiencv of the hound (I.n?7) from the last row and lastcolumn of table F-2. In table F-3 thp value of S qiven in the first columnand the rounded value of S qiven in the last column differ by almost 0.N26,thus demonstratinq the efficiency of the n.027 hound. A reported projectscore could then he in error by as much as plus or minus 0.n27. For example,if a reported project score is 1.56O (base case) the true value could varyanvwhere from 1.P7 to 1.533.
TARI.F F-?
* S'I MARY NF MIIM R1CAI EPPORS (ADPpnXTMATF "AXIMITI ARSOLIITE ERRnP)
Interpolation Formula for R Formula of 2a(3) for RVAPIARLE NO INTFRMEOIATF 1 INTERMEPIATE NO INTFRMFnIATE INTERMEFIATE
ROIINO ING J ROIDING RO1NDING RO)NDINGnN5 nw ,nn5 .05
R ,n5 ,N95 ,nNi ,NN
C no1 .006 no1 .006
T NA .005 NA .N05
* S .056 .071 on07 .022
IS RO1NDED .n61 .n76 .012 .027TO T140
~nFCIMAL PLACES _
h. Productivity Index Frror
Followinq the formulas of 2c the PI may he computed by summinq PP and manpowerexpended and dividinn the two. lsinq exact arithmetic, the maximum ahsoluteerror in a computed PT is hounded by the maximum absolute error in the projectscores plus a much smaller term involvinq the number of projects, totalmanpower, and total PP. In fact, the maximum absolute error (0.n27) in theproject score alone is a realistic approximation of the numerical error in thePI. Thus a reported PI could he in error by as much as plus or minus .027.In the first scorinq year there was only a difference of N.N3 between thelowest PI of the top nine scorinq individuals and the PI of the next hirhestscorer. This difference could in fact then he due almost entirely tonumerical error.
E-13

1 -
" . . , , • , -. - . ,, - - _ : - _ ... - ..
U
AF - I'!IMFP I rAt F Pn " o.n F ',rnQ
r , ,. '.1 romputat i nn , rJ In ! h ton co iqni f:1 car fi iC.rts
+"1 * ")' F . • ".
.~~~~~~~ 1.,r •7 ]"•'+
I' , 7
i'C fl. OPq4'q' F2F ,4 : f o
T +.tn rl 17)1
2S 1,24453Pq " .1 2 4 7q7 20Qr
S ROI I I In2 1.22 ,TO TWO
DEC IMALPLACES
7, r ()R < q 1o1
or: 7?.Rp")R < 1. 0 10- P
4. RFLATIONSHIPS AMONK THF PROJECT SCOPF VARIABLES
A traditional measure of nroductivitv is value of output divided hy valie of0II input. The project scorinq function which is a qlohal measure of a project
team's proHuctivitv is a variation of this traditional measure. If f and ndenote the piecewise linear functions of paraqraphs 2a(3) and (4) respectively,then
S = P x 0 x T x f (Rp/RA x q (r~P/CA)
In a sense, Rp and Cp represent the output values of a pro.ject (as determinedhy the PMR) and RA and CA represent input values. Rather than use ratiosdirectly, they are adjusted hy f and q to take into account the relative costsof these two resources. The 0 and T (and also P) factors miqht he viewed as'value multipliers." Timeliness or quality increase the worth of a project, orperhaps more realistically, the lack of timeliness or quality decrease itsworth.
F-14
0t

a. Schemes for Assembling Factors
The method for assembling the individual factors into a project score, theproject scoring function, is a combined multiplicative and conjunctive scheme.To contrast alternate scoring schemes, suppose that the project score S is afunction of Q and R alone.
(1) An additive or compensatory scheme would compute S as S = Q + R.Using Q = 1.3 and R = 1.0 as base values for a B or "good" project, the
* category of B or better projects is defined by S > 2.3. The compensatoryproperty of this scheme is illustrated by the fact that a project with Q =1.2
-and R = 1.1 and a project with Q = 1.4 and R = 0.9 both score 2.3.
(2) A conjunctive scheme would define a B or better project as one- with Q > 1.3 and R > 1.0. Now a low score on one factor can not be compensated*for by a high score on another factor.
(3) A strictly multiplicative scheme for S would compute S by-S = Q x R. A project graded 8 or [etter would be defined as one with-S > 1.3 = (1.3) (1.0). To some extent this scoring function is also compensa-
tory. For example, a project with Q = 1.35 and R = 0.962 and a project with* Q = 1.2 and R = 1.0833 both have S = 1.3. Thus a low value on one factor can* be compensated for by a higher value on another.
(4) Although the TPMS scoring function is multiplicative, to avoidthe compensatory property (at least for Q) a minimum acceptable value ofQ = 1.3 must be achieved. In theory a project scoring less than 1.3 on Q wouldbe required to expend more manpower to upqrade quality to at least 1.3. In
*computing S the original Q value is used with the inflated R value. In prac-*tice, because some R scores are so high, low scores for Q are in effect compen-
sated for. In the first scoring period for example, one project had Q = 1.2and R = 1.122 for S = 1.3464.9 Another project had Q = 1.35 and R = .998 forS = 1.3474. Thus it appears that a low score on Q is compensated for by a highscore on R and vice versa.
(5) Figures E-4 to E-7 illustrate the different scoring schemes just
discussed. The shaded area in each corresponds to scores of B or better.
b. Distinct Resource Efficiency Factors
Two resource efficiency factors are used to compute the project score. Twodifficulties arise as a consequence of these factors.
(1) Scale factors. After the ratio of planned resource to actualresource is computed, it is scaled by a piecewise linear function before it isfactored into the project score. These scale functions (f and g in thenotation of the previous section) are the source of one difficulty.
9Fov' illustraztion only, S =Q x R.
E- 15

1.3 I s-R+Q>2.3
1.0 A - -- --. --
0.7 1.0 1.2
R
-4 Fiqure E-4
Compensatory or Linear Scheme
f! E-16

1.5 ~-Q>1.3I and
1.0 ---------
;7 1. I.
Fiqr E-
Cnuciv Scem
E-17

1.5-
a) S R XOQ1.3
10 -
0. 1 I .R
Fiqr E-
Ml ilctv Scem
E-18
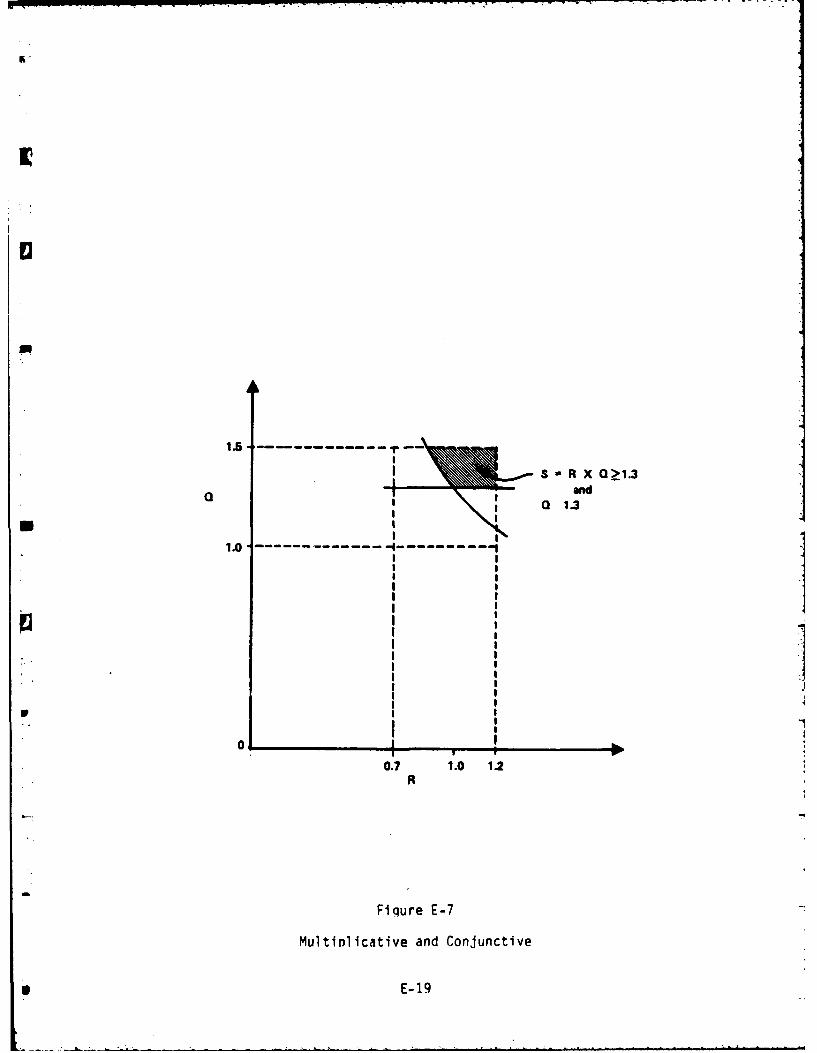
I-
I I
II
IS R X >1.3
---.--- I-an
Q II 0 1.3
1.0 --
- o
0I
0.7 1.0 1.2R
Fiqure E-7
Multinlicative and Conjunctive
S E-19

4a) , +hf. ratio 7 ir 7 " "r '1 ',,i i a t ir, c nn 'I
a~1J a .r w prf ~i ri r)n v fit cr f q.2 1f a ' r
*. i an, !' is <!nne with . , r r~ q n fc P~ i .~ di ) " " ""
'i.- lr, f , . i, m i I ass qin ai r t-j r ff iri v f ;'t r r< ] Thip rat,; -r 'i I r nt "f' f !-I t ior S . a "3P yhp) .-,) '5 - r p
fr"n' i r'l . . . .a 1' in v h n a; : , - ,
-) a V. f V ' 14 i invephad S
a1 1 thatt sh'uil rco:iraie o rr c- r the r ; tp prr ii r,
"j. tp-n,,
p 1 ii r ate thp c,'iter factor rpfl fieP scn0nrn f,n(f ien a tinethi.
.2 i tistinct Factors. Another ratinnaIP for navi-' 0 ifferpnr 11fnctions is that it miqht enco.:race t radin relativolv :heap (a' pf tpr ,::srmore exprersive manpower. Iiowevor, hocause the nro ect score i 9 r r,fidriCt -fdistinct factors, in General the Or)' i n rncP(41iurf, is to Iaxi "'i79 each +- c+indenendentlv of the other. In fact. it. is not hard to construct xairq)l es,hre chean computer usane miqht he rpplaced hv exrpnsive manpower in orf, rincrease the project score. For exciplp, sunose a prn.iect is initiated withR= 2 an d CDr 2. Sunpose that well into the study, the stuffy manaqer isconfronted with the possihilitv of comnletina the proiect with PA = 1 andCA = 2 Ln this case R x C z 1.17. Havingi alreadv usie 1 S1 P, he does havethe option of doina the 1 SUP of computer work renaininn with man-months ofmanpnwer. If he chooses this optinn the project will he cnmpleted withA = 2l and CA = 1. In this case P x . 1.1. If all other factors are the
saine, replacina cnmnuter usaqe hy manpower would result in a hiqher pro.iectscore. If it is desired that computer use replace manpower when it is coste~fective, realistic costs for each resource should be given and the projects,'ire function should use a single factor which includes hoth manpower andcomruter use in relation to their costs.
c. The flifferentipl of S
The differential (dS) of S is useful in assessinq effects of chanqes in thevalues of the variables on the value of S. In general, the differential of afunction can he used to approximate changes in function values given changesin its independent variables. In this case the differential is
dS = P [TPC 0 ( + fRC AT + OTC AR + nTR &C]
Recause n is scaled with larmer values than T, R, or C; small changes (AC,&T,* &R) in these variables will have a qreater effect on the value of S than will
E-2n

a small chanqe (&0) in n.1f Tahle E-4 illustrates the effect of incrementinqC the variables hy n.1. Table F-S does the same for an increment of n.0ns.
Notice that a smaller value of S results from incrementinq n. Scalinq n withlarqer values has an effect of emphasizini the other variahles in the formulafor S.
TABLE E-4
THE FFFECT ON TI-F BASE SCOPE nF INCREMENTING
VARIABLES RY n.1
CA E 1 0 T I R C ! S
RASE I1.3 I I 1 1 1.560
A OIIALITY 1.4 1 1 1.68n
REST TIME 1.3 1.1 1 1 1.716I
Rp=1.5 RA 1.3 1 1.1 1 1.716
Cp=?C A 1.3 1 1 1.1 1.7,6UI
TABLE F-5
THE EFFECT ON THE BASE SCORE OF INCRFPNTING
VARIABLES RY 0.n5
I CASE Q T f R C S
RASE i1.3 1 I 1 1 1.56
IR+ OIALITY 1.35 1 1 1 1.620- I
m0on TIME 1.3 1.OS 1 1 1.638
Rp=1.2S RA 1.3 i1 1.05 1 1.638 ,
Cp=1.SCA 1.3 1 I I 1.nr 1.6319
101n the fi'st secoring pnp'iod the smallot att,71- 'd n a ?ia1i " of 0(.1L) t nSreatv7 than maximum w onZh .)e ?val.za. fow T (1.7) or C. (1.1). .47.o for z7 7exoept 3 mrojfects the vaTp of r wa aeato. ora o(2 a4(7l to t'e -rix m.,mr
value or R.
E-21

The prjokc scoire is a nlohal measnre nf tke nroipct teamrn p 'eayi Vp prvo.'c-ivitv. Thp npchanis" for' aar'1jnq qrpr nr fp OP tnlar thar !~' InT '-
ntrai qhl chrn to( ,anpov/pr award al 1 OWI a narA.(Ior to ij Ifpflsr' ?,tp I j~
nnalitv of ind 'mduals' or units ' Onnrjrl")Ijjn~.
a r Of hiprdrchica) pro,-s W~ awa rl'PVin:.rm,
I ,- ~ i -' , An) raro r o n, 7 : ~ ~ -
riqh1 1 " of tha nril *. hp f4Fnr 0'uaOs 1 i' ip pi i
* ~ ~ ~ vtr, nQ Arqp in rwaqflfwer mwar'1 cop>~ hp inr)Cpanal2 h itr ir -5 2, - ' , 7 r .,- oasp hy 11 - ( .9 fac-rr '
h, The hierarchical WistrhVijo' of judnmnl'a PP W~l' cnO,1fl'-flAlpr
ofWilyinn hv the imrlmental factors jinht reSoj t in uni nten'x remfl v.
Consdertheexamnpl e ill ustrateO in tahie E-F. Supoose it s thp jidhr-r3tthp sttidy ,ianaqer and division chief that persons ? and I di,' equally hailvand should receive no more than the ahsol'ite mininurm awarn. Person 1 ar-',1-hp nroipct anH should receive the maximum possihle award. As shnwn in thet ahle, since persons 2 and I helonn to different hranches, nprnnvn 7 alltOMati-cally receives more PP and a hiqher P1.
TARLE F-F
AN FXAMPLF OF AWARDING 11M~rGMENTAL POINTS
RA =1.
PP = J
1MM p I P 1 1 I MM PP Fn
q 13IR1 ,7 I IRRAMCH 2 4 (1/3)(18)(.7)i 1.flS
Person I1 1I(1/?)(13.R)(1.3)j 2.24 1 Person 3 1 4 1 4.? 1.05(max award)I R*07i ( award)
IPerson 2 4 (1/2)(13.,R)(.7) I1.21(min awardlI 4R3
I _ __ _ __ _ __ _ __ _ _ __ _II_ _ __ _ __ _ _ _ ___E-2__ _ _ _ __ _

L
6. WEIGHTED AVERAGE
The PI is simply a weiqhted averaqe over a scorinq period. Specifically it isan averaqe of project scores weiqhted hv their manpower reguirements. Hereoverhead is considered as a proiect with a score of 1. Recause however, anon-overhead project could carry over fronm one period to the next whileoverhead would not, snurious results can he nhtained. The data in tahle E-7illustrates Just this. The hranches seem to he enjually productive durinq thetwo years, however this is not reflected in their PI's.
TARLF E-7
-m AN EXAMPLE OF COmPI!TING RPA'CH PI'S AS WEIGHTED AVERAGES
IST PERIOn 2ND PERIOD
1 TMM Overhead 1 TM OVERHEAn
2 TMM on Project with S = 1.5
RRANCH A 0 TMM carried over ............ 11 TMM on project with S = 1.5
total TMM = 3 total TMM = 21total PP = 4 total PP = 31
PI = 4/3 = 1.333 PI = 31/21 = 1.476
1 TMM Overhead 1 TMM Overhead
IRRANCH R 11 TMM on project with S = 1.5 11 TMM on project with S = 1.5
* total TMM = 12 total TMM = 1?total PP = 17.5 total PP = 17.5
17.5 17.5PI = = 1.458 Pl = = 1.458
12 1?
E-23

APPENDIX F
AN ALTERNATIVE TPMS SCORING PROCEDLR E
F-1

APPENDIX F
AN ALTERNATIVE TPMS SCORING PROCEDURE
1. GE NERAL
The purpose of this study was to evau ate the first year functioninq rif TFH S,however, possible system improvements which followed directly from theevaluation were to be offered. This appendix presents a conceptua! scrinjalternative which has as its basis improving system functioning in !lqiht )fthe oriqinal system design attributes. This alternative i5 simple, woildimprove the system flexibility, and should considerably lessen resistance t,TPMS because it specifically addresses those issues most frequently cited as
*problems with the current system.
2. SCORING FACTORS
The alternative procedure retains the manpower utilization efficiency factorA (R), the quality factor (Q), and the timeliness factor (T). A distinct
computer utilization efficiency factor is not used. As long as the computerremains a somewhat unlimited resource with fixed cost, and manpower costs
*account for approximately 80 percent of TRASANA resources, a separate computerfactor is not seen as cost effective. If the magnitude of computer use andcosts should change in the future, computer usage could be incorporated intothe scoring procedure. If this is done however, a more appropriate methodmight be to have a combined resource efficiency factor which incorporatesmanpower and computer usage. This combined resource efficiency factor couldthen be weighted to reflect the relative cost of the two resources. Each ofthe three factors is discussed separately.
a. Manpower Utilization Efficiency Factor (R)
Figure F-i is the graph of a generic efficiency factor Rp/RA as a function ofRA/Rp. Figure F-2 is the current efficiency factor R, also as a function ofRA/Rp. The alternative suggested for scoring R is in Figure F-3. The verti-cal scaling is just'ordinal, i.e., simply three categories of efficiency. Aproject with actual manpower within plus or minus 10 percent of planned man-power would be placed in the medium category. When actual manpower is 10percent over planned mAnpower, it is placed in the low category. Projectswith actual manpower of less than 90 percent of planned manpower are placed inthe high category. In addition, a division level check on R should be imple-mented. For example a division might be required to have a given distributionof projects among the three categories, or bonus points could be awarded forachieving a relatively symmetrical distribution with over half of the projectsin the middle category. Another possibility is to give rewards or bonuspoints to divisions whose average Rp/RA is near 1.
F-26

71C _ A
L0
4-)C-)
LJ
C-)C0)
4-,
'4.-'4-'JI
U
'I
Eo -q -.1~
La~ -
OJ -.L
aD .- 71C
~-1
U ~1* 7- 'aC C
~1
A
F -3

CDC
4-
IF-4

U-A
0 0
4-J
41
LL.
II.
F-5-

b. QuaIi tyThe alternative scoring procedure requires that quality also be ordinaily
* scaled with three categories: high (excellent), medium (okay), low (substan-tial revision required to release). This categorical scoring would producethe desired discrimination among projects and would be much more realistic interms of expectations from PRB members. The potentipl for placing a projectinto the wrong category would be considerably less t an the pot(,ntial err.m ir%the current gradi ng scheme.
c. Timeliness
This factor would also he scaled ordinaily with the following tnree cate-gories: high (early), medium (on time), low (late). Figure P-4 shows thegraph for this factor.
3. COMBINING THE FACTORS
a. The three distinct levels or categories for each of the three fhctors* results in a total of twenty-seven distinct possible results for any project.
These outcomes are represented with the tree diagram in Figure F-S. Rankingof the projects on a productivity scale can now be accomplished by sorting thevarious outcomes according to the importance attached to the level of eachfactor. Numerical values could then be assigned to the sorted categories.This would allow for weighted (by manpower) averages of project scores to becomputed for organizational units.
* b. Table F-i gives one possible sort of categories, assuming that eachfactor is of equal importance and that the levels across factors arecomparable. In this scoring scheme there are seven distinct categories. Ifthis scoring scheme were applied to the first year results, the resultingdistribution is shown in figure F-6.
* 4. ALTERNATIVE SCORING PROCEDURE FLEXIBILITY
a. In addition to its simplicity, the alternative scoring procedure isextremely flexible. For example, if overestimation J~ Rp is not sufficiently
* discouraged, the computation of R could be altered to include a penalty windowfor overestimation. Figure F-7 shows two methods by which this could be done.
* If a project has actual manpower between 50 and 90 percent of planned man-power, an R value of "medium" could be assigned (upper dotted line), or an Rvalue of "low" could be assigned (lower dotted line). Using the latterchoice, the projects for the first scoring period were given scores by the
* alternative procedure. The results are shown by the histogram in figure F-8.This histogram can be compared to the one in figure F-6. Notice that dis-couraging or penalizing overestimating results in a more symmetrical distri-but ion.
F-6

I
o- 0
DU
* L
•I aj
mG
o p~
U OJ
L
U..n
-2 -:
I-.
WAI
F-i

MANPOWER L
*.QUALITY H M L H M L H M L
TIMELINESS -HML HML HML HML HML HML HML HML HML
* Figure 7-5. Scoring Outcomes
* F-8

TABLE F-i
A RANKING OF SCORING CATEGORIES
CATEGORY RANKING OUTCOME CATEGORY
7 (H, H, H)
6 (H, H, M), (H, M, H), (M, H, H)
5 I(H, M, M), (M, H, M), (M, M, H)_______________(H, H, Q),__(H,__L,_H),__(L, H, H)
*4(M, M, M)4 (H, L, M) (H, M, L) (L, H, M)
______________ (M,_H,_L)__(M,_L,_H)__(L,_M,_H)
3 (L, M, M) (M, L, M) (M, M, L)
____________ (L,_L,_H)_(L,_H,_L)_(H,_L,_L)
2 (M, L, L) (L, M, L) (L, L, M)
1 (L, L, L)
F -9

I2 .t
r-
198I
171
16iI15
14113
NUMBER '
*~ OF 1 2 __11
PROJECTS10
9
8
7-
6
5
41
2
S1 234 5 6 7
CATEGORY
-- Figure F-6. First Year Project Scores Alternative Scoring Procedure
F-10
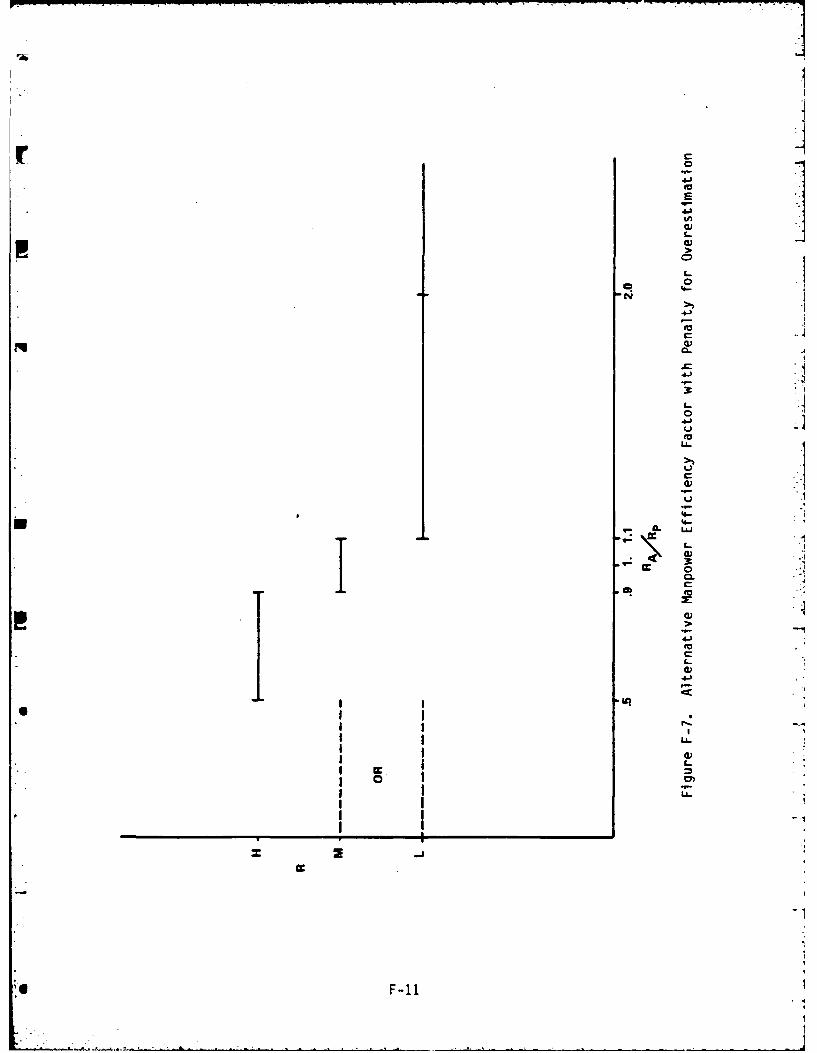
.'
L
4-
I -i
0 I
I-I3IL
(-I
0J

21
2O01!
19 4
18!
13
NUMBER 12
OF
PROJECTS 10"
7
6-[, 5
4
" 4 3
22-
CATEGORY
Figure F-8. Alternative Scoring Procedure with
Penalty for Overestimation of ManpowerApplied to First Year Project Scores
F-12

b. As another example of the flexibility of the alternative system,suppose that it is decided that the timeliness factor should be scored:high-on time, medium-late, and low-very late. The levels of this factorprobably should not be treated as comparable to those of the other two, and anew ranking of the 27 scoring outcomes of figure F-5 might be required. TableF-2 gives one of many possible ranking schemes.
TABLE F-?
A RANKING OF SCORING CATEGORIES
TIMELINESS ALTERED
CATEGORY RANKING OUTCOME CATEGORY
8 (H, H, H)
8(H, H, H)
7 (H, H, M) (L, H, H)___________(H, L, H) (M, M, H)
6 (H, M, M) (M, H, M)(M, L, H) (L, M, H)
5 (H, H, L) (L, L, H) (M, M, M)___________(H, L, M) (L, H, M)
4 (H, M, L) (M, L, M)(M, H, L) (L, M, M)
3 (H, L, L) (L, H, L)(M, M, L) (L, L, M)
2 (M, L, L)___ __ ___ __ ___ __ (L, M, L)
1 (L, L, L)
c. The use of three levels for each of the factors seems to be simple touse yet provides enough discrimination among the projects; however, more orfewer levels might also be considered. For example, the timeliness factormight be altered to have only two levels: medium-on time and low-late. Ifthe other factors remain the same, the tree diagram of figure F-9 shows the 18possible outcomes for this scheme and table F-3 gives one possible ranking ofthe outcomes.
F-13
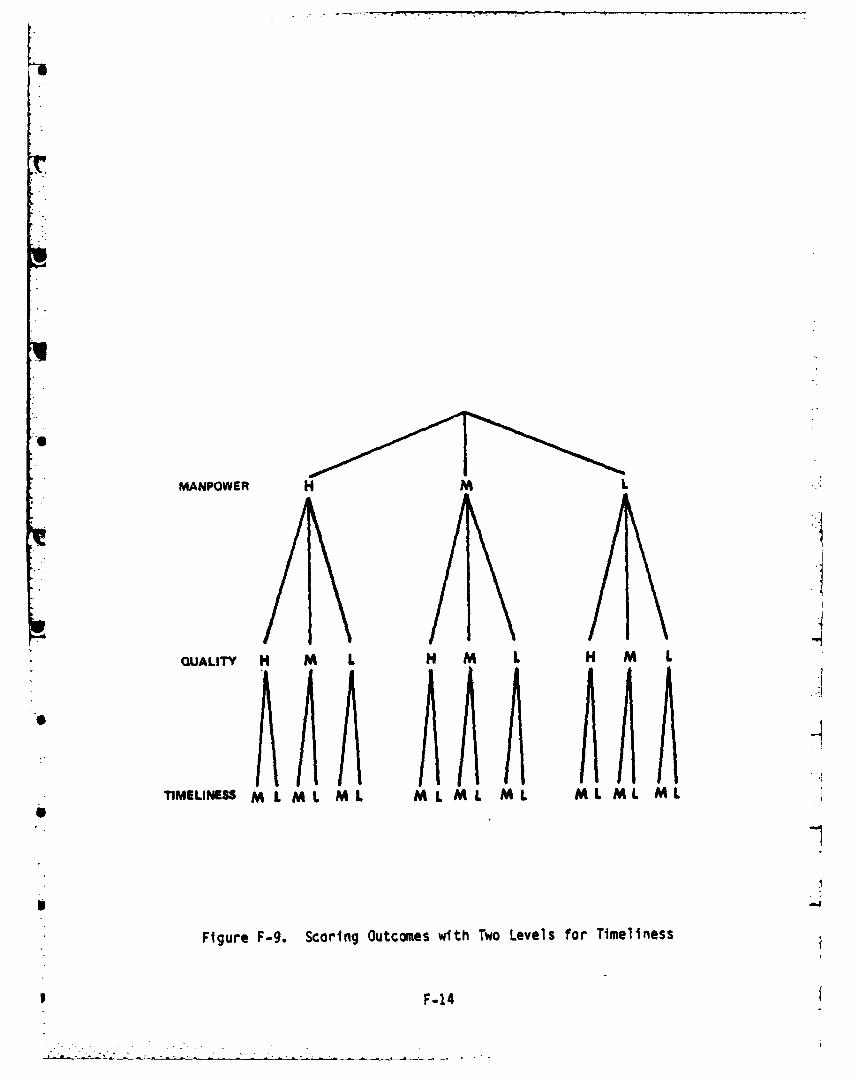
MANPOWER H L
QUALITY H M L H M L H M L
TIMELINESS M L ML PAL M L ML ML ML ML ML
Figure F-9. Scoring Outcomes with Two Levels for Timeliness
3 F-1 4
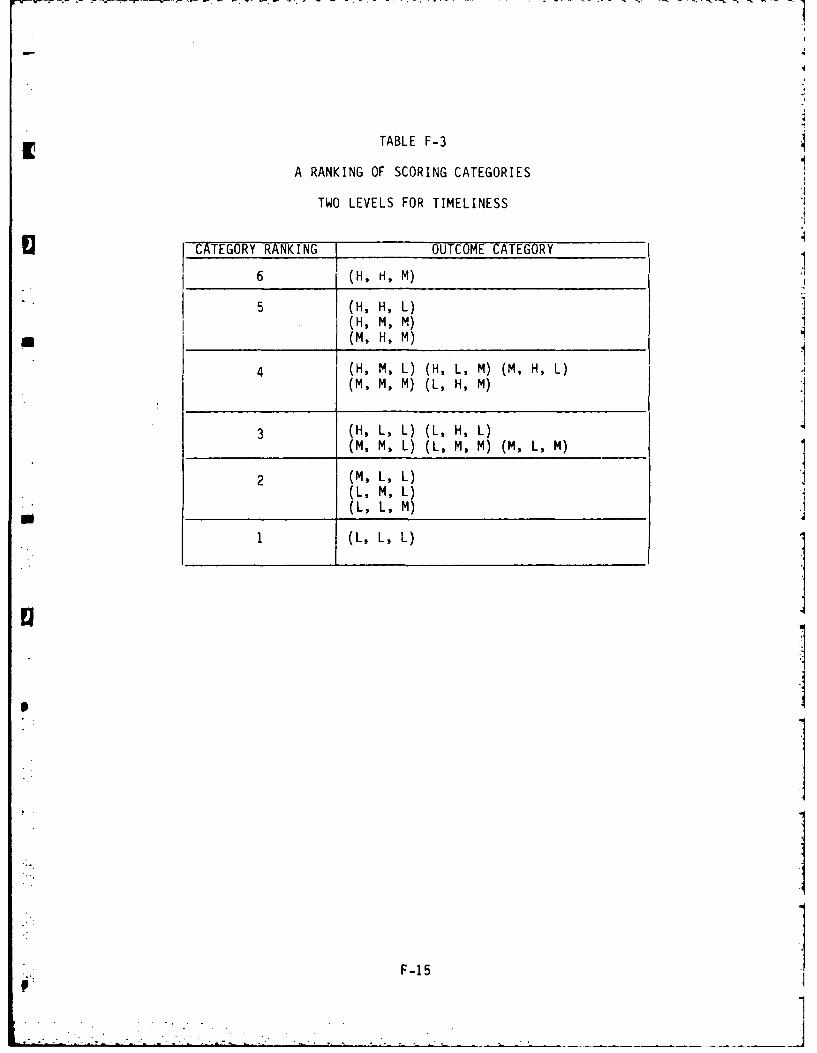
TABLE F-3
A RANKING OF SCORING CATEGORIES
TWO LEVELS FOR TIMELINESS
UCATEGORY RANKING OUTCOME CATEGORY
6 (H, H, M)
5 (H, H, L)I(H, M, M)*j(M, H, M)
4 (H, M, L) (H, L, M) (M, H, L)(M, M, M) (L, H, M)
3 (H, L, L) (L, H, L)_____________(M, M, L) (L, M, M) (M, L, M)
2 (M, L, L)I(L, M, L)
U _____________ (L, L, M)
1(L, L, L)
F-15]

APPENDIX G
BIBL IOGRAPHY
G- 1

"i
BIBLIOGRAPHY
GENERAL
Conte, S. D. and De Boor, C., Elementary Numerical Analysis: An AlgorithmicApproach, 3rd Edition, McGraw-Hill, New York, 1980.
Gage, N. L. and Berliner, D. C., Educational Psychology, Rand McNally,Chicago, 1975.
Glass, G. V. and Stanley, J. L., Statistical Methods in Education andPsychology, Prentice-Hall, Englewood Cliffs, NJ, 1970.
Goodman, A. W., Analytic Geometry and the Calculus, 3rd Edition, MacMillan,New York, 1974.
Mehrens, W. A. and Lehman, I. J., Measurement and Evaluation in Education andPsychology, Holt, Rinehart & Winston, New York, 1973.
Siegel , S., Nonparametric Statistics for the Behavioral Sciences, McGraw-Hi I,*New York, 1956.
TPM S
.* Christ, R. E., The Initial Development and Evaluation of An Algorithm forMonitoring Manpower Requirements and the Relative Difficulty of ProjectsWithin TRASANA, US Army TRADOC Systems Analysis Activity (TRASANA), October
* Crum, J., Report on the Evaluation of the Productivity Measurement SystemDeveloped by TRADOC Systems Analysis Activity (TRASANA). Personal
~communication to Leon F. Goodfe, Jr., Deputy Director for Technical Operations,
* TRASANA, 25 July 1980.
Dooley, D., TPMS Evaluation Summary, Memorandum for Record to Leon F. Goode,Jr., Deputy Director for Technical Operations, TRASANA, 21 July 1980.
Goode, L. F., Jr. and Meier, D. H., Productivity Measurement for Thinkers -AnOverview of the TRASANA technical staff Productivity Measurement System,Bureaucrat, April 1981.
TRADOC OE Team Memorandum for Director, Organizational Effectiveness Visit,9-12 February 1981, TRASANA, 24 February 1981.
TRASANA Memorandum 5-4, TRASANA Technical Staff Productivity MeasurementSystem (TPMS)-Test, Department of the Army, TRADOC Systems Analysis Activity(TRASANA), August 1980.
TRASANA Memorandum 5-5, Quality Assurance of TRASANA Technical Products,*.- Department of the Army, TRADOC Systems Analysis Activity (TRASANA), May 1981.
G- 2r"

TRASANA Technical Documentation 37-80, Productivity Measurement System Designand Development, Department of the Army, TRADOC System Analysis Activity(TRASANA), December 1980.
Schainblatt, A. H., Measuring the Productivity of Scientists and Engineers inR&D: A State of the Practice Review, The Urban Institute, May 1981.
R&D PRODUCTIVITY MEASUREMENT
Clark, L. C. and Guba, E. G., A Study of Teacher Education Institutions asInnovators, Knowledge Producers, and Change Agencies, Indiana University,April 1977.
m Corbin, L. J., Productivity and Job Satisfaction in Research and Development:Associated Individual and Supervisory Variables, Thesis, Air Force Instituteof Technology, September 1977, AD A045981.
Edwards, S. A. and McCarrey, M. W., Measuring the performance of researchers,Research Management, January 1973, pp. 34-41.
Katzen, R., Measuring the productivity of engineers, Chemical EngineeringProgress, April 1975, pp. 24-28.
Koser, M. C., Quantitative Scientists/Engineers Productivity and Some- Associated Individual and Organizational Variables, Thesis, Air Force
Institute of Technology, December 1976, AD A035752.
* Measuring engineering efficiency, Chemical Engineering, 24 December 1962.
Newburn, R. M., Measuring productivity in organizations with unquantifiableend-products, Personnel Journal, September 1972, pp. 655-657.
R&D Productivity, Hughes Aircraft Co., 2nd edition, 1978.
Stevens, A. E., Rewards in Air Force R&D: An Analysis of Desirability, Per-ception and Association with the Productivity of Scientists/Engineers, Thesis,Air Force Institute of Technology, December 1976, AD AO 36462.
Technical Report 74-3, Research and Development Professionals: An Examinationof the Personal Value System and Operative Goals of the Scientists, Engineersand Managers in One Government R&D Organization, Department of the Air Force,Air Force Institute of Technology, September 1974, AD 786877.
Technical Report 78-1, Productivity in the Air Force Weapons Laboratory:Measurement and Prediction, Department of the Air Force, Air Force Institute 7of Technology, April 1978, AD A052897.
Technical Research Report 1149, Motivational Factors Affecting Army Researchand Development Personnel, Department of the Army, Personnel Research Office,May 1966, AD 640390.
G-3p"
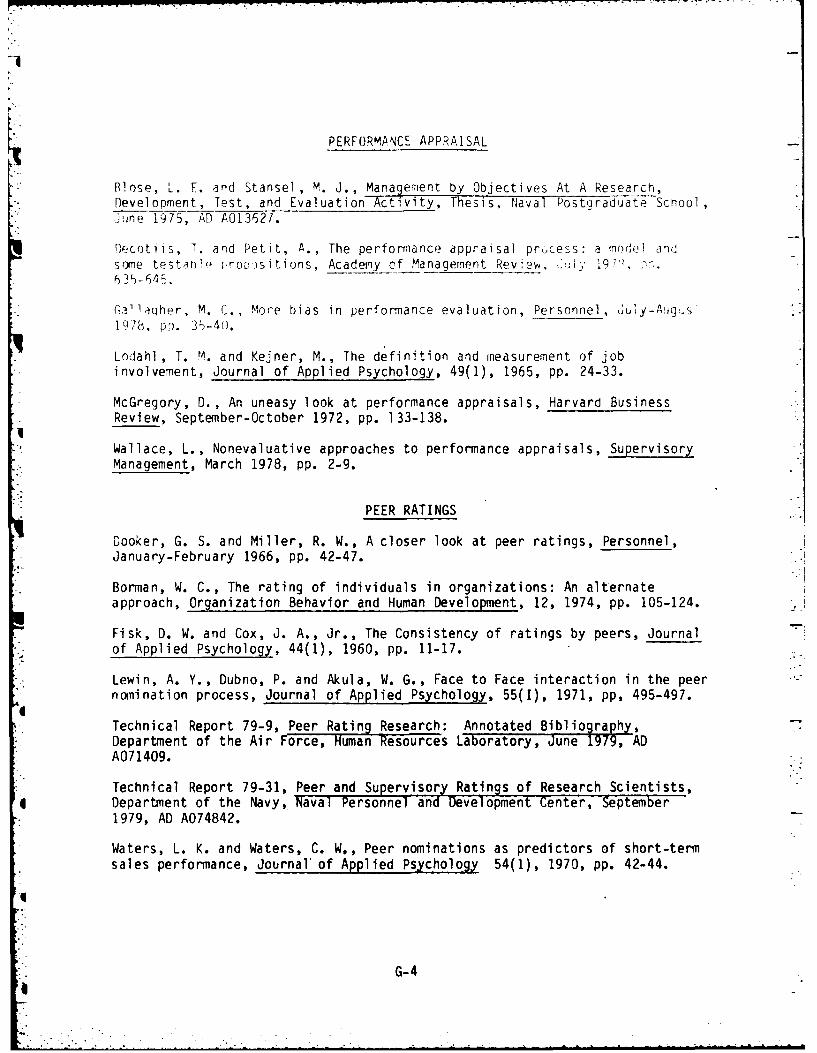
PERFORMANCE APPRAISAL
B!ose, L. F. and Stansel, M. J., Management by Objectives At A Research,Development, Test, and Evaluation Activity, Thesis, Naval Postgraduate School,june 1975, AD A013627.
Decotiis, T. and Petit, A., The perfonance appraisal prucess: a model a1dsome testmPr ;rooositions, Academy of Management Review. .'ly 1971, P.
G(I31laqher, M. C., More bias in performance evaluation, Personnel, July-Aig ,s19,8, pp. 35-4).
Lodahl, T. M. and Kejner, M., The definition and measurement of jobinvolvement, Journal of Applied Psychology, 49(1), 1965, pp. 24-33.
McGregory, D., An uneasy look at performance appraisals, Harvard BusinessReview, September-October 1972, pp. 133-138.
Wallace, L., Nonevaluative approaches to performance appraisals, SupervisoryManagement, March 1978, pp. 2-9.
PEER RATINGS
* Dooker, G. S. and Miller, R. W., A closer look at peer ratings, Personnel,. January-February 1966, pp. 42-47.
' Borman, W. C., The rating of individuals in organizations: An alternateapproach, Organization Behavior and Human Development, 12, 1974, pp. 105-124.
Fisk, D. W. and Cox, J. A., Jr., The Consistency of ratings by peers, Journalof Applied Psychology, 44(1), 1960, pp. 11-17.
Lewin, A. Y., Dubno, P. and Akula, W. G., Face to Face interaction in the peernomination process, Journal of Applied Psychology, 55(I), 1971, pp, 495-497.
"4
,. Technical Report 79-9, Peer Rating Research: Annotated Bibliography,Department of the Air Force, Human Resources Laboratory, June 1979, AD
* A071409.
Technical Report 79-31, Peer and Supervisory Ratings of Research Scientists,Department of the Navy, Naval Personnel and Development Center, September1979, AD A074842.
Waters, L. K. and Waters, C. W., Peer nominations as predictors of short-termsales performance, Journal' of Applied Psychology 54(1), 1970, pp. 42-44.
G
.. G- 4

I