standing at a crossroad: biosolids management decisions in
TRANSCRIPT

Standing at a Crossroad: Biosolids
Management Decisions in the Face of an Uncertain Future
Presented by Matt Van Horne, PE
1
Outline for today’s presentation
• A historical perspective and framework
• Case studies
• Closing thoughts and observations
• Questions (and maybe answers)
2

Master Planning Can Be Complicated…
3

A Historical Perspective and Framework
4

• Major Subsections Regulate – Land Application – Surface Disposal – Pathogen Reduction and Vector Attraction
Reduction (VAR) – Incineration
• Land Application Constraints – Non-Hazardous – Criteria Pollutant Levels – Pathogen Density – Vector Attraction
Sewage sludge regulated under 40 CFR 503 to establish minimum standards
5

• Statewide Programs – Application Rates – Seasonal Restrictions – Slope & Buffer Restrictions – Soil pH Management – Phosphorus Loading Rates – Nutrient Management Plans
• Local Government Programs – Local Oversight Function – Monitor Application at Sites – Additional Residuals Testing – Enforce State Regulations – Fee Supported Program
State and local regulations can raise the bar above that of the 40 CFR 503 regulations.
6

Watershed nutrient management programs may impact land application of residuals
7

• Increased focus on getting “organics” out of landfills
• Fugitive methane (GHG) emissions
• Competition for “volume” with MSW and recycling driving MSW mass rates down
• Implications of reduced MSW rates – Landfill compactor operation compromised
with a poor MSW:CAKE ratio: – 15:1 = Acceptable – 10:1 = Problematic
Landfill disposal is becoming less attractive (more expensive) and fails to recover resources.
8

Increasingly stringent air emission regulations are impacting utilities that incinerate sludge.
• Changes in MACT rules driving toward lower air emissions rates
• MHI and FBI are considered differently
• “New” and “Existing” are also considered differently.
9

Increasingly stringent discharge limits have resulted in higher levels of treatment and…
10

… increased consideration of residuals handling and sidestream recycle impacts on treatment.
11

Aging infrastructure can bring utilities to the crossroad when considering recapitalization.
12

Land application may become more restrictive due to nutrient management regulatory changes
13

What’s Next?
Land Application Regulations
Land Application
Public Concerns
Landfill Disposal Costs/
Availability
Air Emission Regulations
Emerging Technologies
Energy Neutrality
Many Elements Drive Biosolids Improvements
14

Water Resource Recovery Facility is becoming the new expectation from our former WWTPs.
15

The new paradigm will require getting the pieces of your plant to work together seamlessly.
16

Case Studies
17

1. Multiple large facilities with interconnected biosolids handling
2. Increasing off-site processing costs drive on-site improvements
3. Holistic integrated approach to plant optimization
Four Case Studies Demonstrate Various Approaches to Future Modifications
18

New York City DEP
19

• The City-Wide Biosolids Management Plan (BSMP) is a comprehensive evaluation of the solids handling operations and infrastructure at all 14 WWTPs operated by the NYC DEP
• Analysis of current solids handling operations used as baseline for comparison with potential improvements and upgrades
• Future projections for both short (2020) and long-term (2040)
Background
20

• Infrastructure age
• Increasing solids loads – WAS increases can be significant
What is Driving the Need for a Plan?
Average 2020 Increase Average 2040 Increase
Non-BNR Facilities 7.0% 20% BNR Facilities 25% 39% 21

Final Biosolids Handling Contract Approach is Complex
Contract Duration Expires Process Disposal Location
Daily Amount, Wet Tons
Avg Min Max
A 3 years 4/19/13 Advanced treatment NJ 54 54 54
B 4 years 6/23/14 Landfill VA, PA, OH, GA 250 325 750
C 3 Years 5/31/13 Landfill VA,PA, OH 290 250 410
D 3 years 3/17/14 Landfill OH 360 250 410
E 5 years 4/18/18 Advanced treatment NJ 80 80 100
F 5 years 7/1/17 Lime treatment PA 305 200 400
G 3 years 7/1/16 Lime treatment PA n/d 200 400
22

• Digester capacity is limited
• Solution may be a combination of approaches
Driving to a Class B Biosolids Product May Require Significant Investment
Facility A Facility B
23

Mechanical Thickening Alternatives
Rotary Drum Thickener (RDT) • Enclosed process • Slow rotation speed • Permeable drum • Large WWTP experience
Gravity Belt Thickener (GBT) • Highly visible operation
• Simple adjustments to improve performance
• Odor considerations • Large WWTP experience
24

• Even large, complex networks can benefit from a new look at biosolids handling approaches
• Defining the goals of the plan are important
• Identifying a phased approach to capital improvements is critical to balance spending
• Balancing nutrient loading from processing activities (i.e. dewatering) is important
NYC DEP – Lessons Learned
25
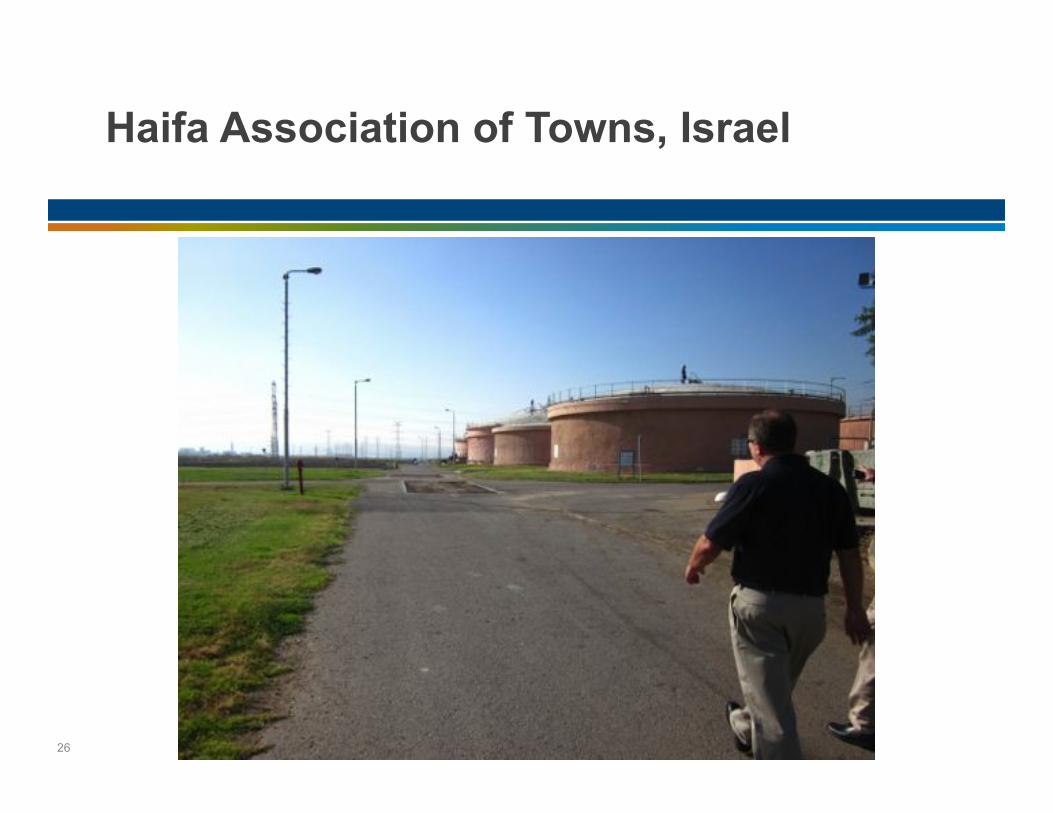
Haifa Association of Towns, Israel
26

• Water Regulations (Use of Sludge and its Disposal) 2004 require that: – Starting in 2007, sludge must meet Class A requirements for
agricultural land application
• Off-site composting was chosen for the approach to meet these requirements – Two concessionaries each about 150 km away from the WWTP – Contracts are set to expire in next 3-5 years – Price increasing at ~10% per year
Regulations
27

Class A Complications – 2010 Metals
Constituent Class A
Limit (mg/kgdry)
Average Pollutant Content
(mg/kgdry)
Number of Measurements (> non-detect)
Standard Deviation (mg/kgdry)
Cadmium 20 0.41 2 0.0 Chromium 400 121 12 62.2 Copper 600 519 12 152.9
Lead 200 32.6 12 6.1 Mercury 5 N/D 0 -- Nickel 90 109 12 26.3
Zinc 2,500 2,738 12 512.6
28

Variable Metals Concentrations Impact Disposal Options
ZINC
29

MASTER PLAN 20-YEAR NET PRESENT COST
UPDATED 20-YEAR NET PRESENT COST
Alt 2 – Thermal Drying NIS 443,880,000 NIS 342,480,000
Alt 3 – Thermal Hydrolysis NIS 239,290,000 NIS 227,680,000
Alt 5 – Pre Pasteurization NIS 284,940,000 NIS 292,850,000
Economic Sensitivity Analysis
10/2013 Composting
Cost
30
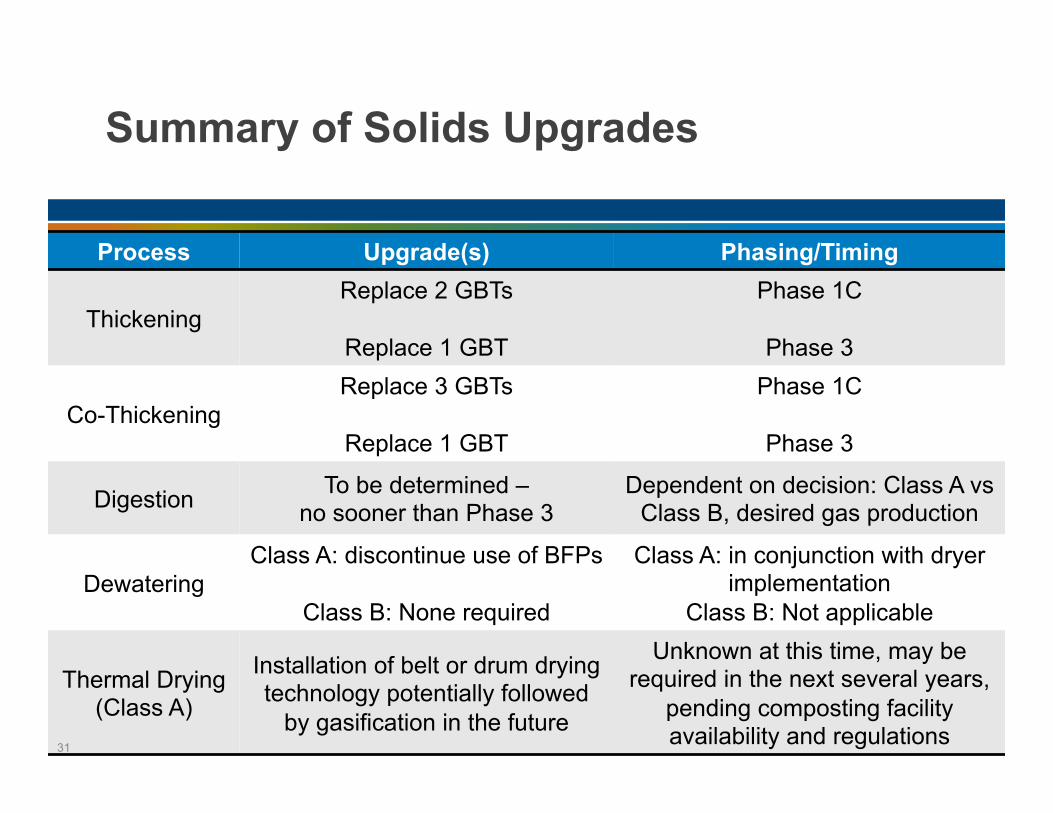
Process Upgrade(s) Phasing/Timing
Thickening Replace 2 GBTs
Replace 1 GBT
Phase 1C
Phase 3
Co-Thickening Replace 3 GBTs
Replace 1 GBT
Phase 1C
Phase 3
Digestion To be determined – no sooner than Phase 3
Dependent on decision: Class A vs Class B, desired gas production
Dewatering Class A: discontinue use of BFPs
Class B: None required
Class A: in conjunction with dryer implementation
Class B: Not applicable
Thermal Drying (Class A)
Installation of belt or drum drying technology potentially followed
by gasification in the future
Unknown at this time, may be required in the next several years,
pending composting facility availability and regulations
Summary of Solids Upgrades
31

• Economic analysis can’t be the only factor
• Conditions change and solutions need to be flexible
• There is inherent value in retaining control
• Cannot ignore needs for addressing existing infrastructure
Haifa – Lessons Learned
32

F. Wayne Hill WRF, Gwinnett County, GA
33

Biosolids Management
Solids Production
Thickening
Storage
Digestion
Gas Production/ Utilization
Gas Treatment
FOG Receiving/
Co-Digestion
Nutrient Recovery
This involved a comprehensive look into their whole process for a synergistic solution.
34

Pending new CHP system was to be added for beneficial use of digester gas.
35

… but the plant was “short” on digester gas production to meet maximum value solution.
36

Field testing confirmed a 50% increase in clarifier TSS removal from 31% to 48% after baffle installed
37

Digester gas production rates increased with increased primary sludge to digestion.
38

• BioWin calibration and special sampling verified “true” loadings much lower helping “capacity crisis”
• Improved primary clarifier performance reduced loads to secondary process
• Digesters were still short on capacity
• Recommended co-thickening to 5.5% on RDTs replacing high energy WAS thickening centrifuges
Other opportunities were also identified during the primary clarifier optimization study.
39

DG2E facility generates 2.1MW output power and saves over $1MM per year in purchased power.
40

FOG/HSW receiving added for co-digestion of select streams to boost gas production.
41

Construction underway for installation of on-site struvite recovery system using WASSTRIP
42

• A “digester problem” likely does not end at the digesters
• Strict discharge requirements can drive improvements throughout the facility
• Sometimes simple is best
• Innovative solutions also have their place
Lessons Learned from F. Wayne Hill
43

What Can Your Utility do to Plan for the Future?
44

There are lots of factors to consider in making plans for the future and each utility is unique.
45

There are no “cookie cutter” solutions that will “fit” each and every situation… except maybe…
• Generally, moving to higher levels of biosolids stabilization will cost you more…
• Some technologies can recover marginal capital costs (e.g., co-generation, struvite harvesting, Co-Digestion of FOG/HSW, etc.)
• Holistic solutions can be cheaper than silo solutions.
46


• Survey nearly ready for distribution • Looking for utilities in any stage of co-digestion planning
or implementation • Report expected in late 2015 or early 2016
WERF Research Operational Impacts of Co-Digestion
48
Send an email to [email protected] to get early notification of the survey!