the effects of six-weeks change of direction speed and
TRANSCRIPT

sports
Article
The Effects of Six-Weeks Change of Direction Speedand Technique Modification Training on CuttingPerformance and Movement Quality in Male YouthSoccer Players
Thomas Dos’Santos *, Alistair McBurnie, Paul Comfort and Paul A. Jones
Directorate of Sport, Exercise & Physiotherapy, University of Salford, Salford, Greater Manchester M6 6PU, UK* Correspondence: [email protected]; Tel.: +44-161-295-2371
Received: 12 August 2019; Accepted: 3 September 2019; Published: 6 September 2019�����������������
Abstract: Cutting manoeuvres are important actions associated with soccer performance and a keyaction associated with non-contact anterior cruciate ligament injury; thus, training interventionsthat can improve cutting performance and movement quality are of great interest. The aim ofthis study, therefore, was to determine the effects of a six-week change of dire[ction (COD) speedand technique modification training intervention on cutting performance and movement qualityin male youth soccer players (U17s, n = 8) in comparison to a control group (CG) (U18s, n = 11)who continued ‘normal’ training. Cutting performance was assessed based on completion time andCOD deficit, and the field-based cutting movement assessment score (CMAS) qualitative screeningtool was used to assess cutting movement quality. Significant main effects for time (pre-to-postchanges) (p ≤ 0.041, η2 = 0.224–0.839) and significant interaction effects of time and group wereobserved for cutting completion times, COD deficits, and CMASs. Improvements in completion time(p < 0.001, g = 1.63–1.90, −9% to −11% vs. −5% to 6%) and COD deficit (p ≤ 0.012, g = −1.63 to −2.43,−40–52% vs. −22% to −28%) for the COD intervention group (IG) were approximately two-timesgreater than the CG. Furthermore, lower CMASs (i.e., improved cutting movement quality) were onlyobserved in the IG (p ≤ 0.025, g = −0.85 to −1.46, −23% to −34% vs. 6–19%) compared to the CG. Thepositive changes in CMASs were attributed to improved cutting technique and reduced incidencesof high-risk deficits such as lateral trunk flexion, extended knee postures, knee valgus, hip internalrotation, and improved braking strategies. The results of this study indicate that COD speed andtechnique modification training, in addition to normal skills and strength training, improves cuttingperformance and movement quality in male youth soccer players. Practitioners working with maleyouth soccer players should implement COD speed and technique modification training to improvecutting performance and movement quality, which may decrease potential injury-risk.
Keywords: cutting movement assessment score; movement screening; anterior cruciate ligament;change of direction deficit; injury risk profiling
1. Introduction
Soccer players, on average, perform 609 ± 193 cuts of 0◦ to 90◦ to the left or right [1] during amatch, typically in response to an opponent, the ball, or to create space. Similarly, Robinson et al. [2]found 38.9 ± 13.3 and 36.3 ± 12 directional changes (45–135◦ movement 4 m/s or faster) per matchwere performed to the left and right, respectively, by soccer players. Moreover, change of direction(COD) actions (≥50◦) which are then followed by a sprint are associated with critical moments, such asgoal scoring and assists in soccer [3]. Consequently, given the frequency of COD actions performed in
Sports 2019, 7, 205; doi:10.3390/sports7090205 www.mdpi.com/journal/sports

Sports 2019, 7, 205 2 of 20
soccer, and its association with decisive moments (i.e., goal scoring), the ability to change directionrapidly can be considered an important quality to develop.
COD speed is defined as “the ability to accelerate, reverse, or change movement direction, andaccelerate again” [4], and as stated earlier, soccer players frequently perform rapid decelerations,directional changes, and sprints to create space, or to react to an opponent or ball. The determinants ofCOD speed are multifaceted [5] and influenced by physical (strength capacity), technical, and speedqualities [5]. Enhancements in COD speed have been demonstrated as a consequence of COD speedtraining interventions over 6–12 weeks (i.e., field-based sprint, deceleration, and COD drills) andare particularly effective in soccer players [6–8]. Moreover, a recent meta-analysis has confirmedthat COD speed and sprint training interventions elicit short-term improvements in COD speedperformance in soccer players [9]. Therefore, COD speed training provides practitioners with arelatively easy to perform field-based method to enhance COD performance in soccer players, requiringminimal equipment.
While CODs are important for successful performance in soccer, directional changes are also keyactions associated with non-contact anterior cruciate ligament (ACL) injury [10–12]. This occurrencecan be attributed to the propensity to generate large multi-planar knee joint loading [13,14] duringthe plant foot contact, which increases ACL load [15] and can potentially rupture the ACL [16].Moreover, greater knee joint loads are also associated with increased risk of developing patellofemoralpain (PFP) [17]; a common knee injury in soccer [18]. Despite the recent improvements in sportsmedicine and strength and conditioning practices in soccer, non-contact ACL injuries are not decliningand are still problematic [19]. ACL injuries can be career threatening, with a plethora of negativeeconomic, psychological, and health consequences [20,21]. Despite a high return-to-play rate in soccerfollowing an ACL injury within a year of injury (≥90%), only two-thirds of players play at the samecompetitive level three years later [19]. Consequently, knee injury mitigation is of high importance forsoccer players.
Non-modifiable ACL injury risk factors include hormones, anatomy, and the environment, butnotably biomechanical and neuromuscular control deficits are modifiable risk factors with appropriatetraining [20,21]. These “high-risk” deficits during COD include the following [14,22]: wide lateral footplant distances, greater hip abduction angles, increased internal hip and foot rotation angles, greaterknee valgus, reduced knee flexion, and greater lateral trunk flexion over the plant leg. Moreover,with the exception of lateral foot plant distance and limited knee flexion [14,22], the “high-risk” CODpostures offer no associated performance benefits [14], and in fact, reducing lateral trunk flexion andencouraging a trunk lean towards the direction of travel could be a faster technique [14,23,24]. CODtechnique modification training (i.e., coaching cues and feedback to reduce postures associated withincreased knee joint loads) can address the abovementioned “high-risk” deficits and reduce potentiallyhazardous knee joint loading when monitored with three-dimensional (3D) motion analysis [13,25,26].Therefore, addressing biomechanical and neuromuscular control deficits could be a viable strategy toreduce injury risk in soccer players [14,27,28]; however, no study, to date, has examined the effects ofCOD technique modification training on cutting movement quality in male youth soccer players.
One strategy to help reduce ACL injury risk in soccer players is evaluating movement qualityto identify athletes that display “high-risk” and abnormal mechanics so that individualised trainingprogrammes can be created [20,28]. 3D motion analysis is the gold standard for evaluating movementmechanics [20] and has previously been used to monitor changes in COD mechanics [13,25,26];however, this is a complex, time consuming, and expensive process, which is often restricted tolaboratory settings, thus limiting its application in field-based settings. Recently, the cutting movementassessment score (CMAS) qualitative screening tool has been created and validated against 3D motionanalysis [29,30], with strong relationships (ρ = 0.633–0.796, p < 0.001) observed between CMAS andpeak knee abduction moments (KAM) (which can load the ACL) and high reliability. As practitionerswill implement training interventions to reduce “high-risk” cutting mechanics, it is imperative that theeffectiveness of such interventions can be monitored using a valid and reliable screening tool. The

Sports 2019, 7, 205 3 of 20
CMAS provides practitioners a valid field-based screening tool to identify athletes who generate highknee joint loads and poor movement quality; however, to the best of our knowledge, no study hasmonitored the effectiveness of training interventions on cutting movement quality using a field-basedscreening tool.
The aim of this study, therefore, was to determine the effects of a six-week COD speed andtechnique modification training intervention on cutting performance and movement quality in maleyouth soccer players, using the field-based CMAS screening tool and timing gates to assess COD qualityand performance, respectively. Since the introduction of the elite performance player plan (EPPP),injury rates in adolescents have increased three-fold [31], and because youth players are striving forprofessional contracts, injury mitigation is paramount [31]. If athletes can reduce “high-risk” deficits(i.e., reduce the CMAS score) and improve performance (i.e., completion time and COD deficit), theCOD speed and technique intervention can be considered successful. However, if athletes can reduce“high-risk” deficits while maintaining cutting performance, it can still be viewed as a positive effect. Itwas hypothesised that a COD speed and technique modification intervention would result in fastercutting performance and improved cutting movement quality in comparison to a CG.
2. Materials and Methods
2.1. Research Design
A non-randomized, controlled 6-week intervention study with a repeated-measures pre-to-postdesign was used. Youth soccer players (U17s) from an English professional soccer club were recruitedfor the IG, which consisted of a 6-week COD speed and technique modification training programme(Table S1), consisting of two, 20-min sessions per week. These sessions replaced the soccer teams’normal warm-ups for two of the sessions, which consisted of mobilisation, low-level jump-landingand sprint drills. Conversely, youth soccer players from the same club (U18s) acted as the CG andcontinued their normal field-based warm-ups. Pre-to-post assessments of 70◦ cutting COD speedperformance, 10 m sprint times, and COD deficit were assessed to monitor the effectiveness of thetraining intervention, while cutting movement quality was assessed with the recently developed andvalidated CMAS screening tool [29,30].
2.2. Participants
A total of 26 male youth soccer players from an English professional soccer club (Under 18 steam, at the time of study, played in a regional league against youth teams of a similar standard,participated in the Football Association youth cup, and represented Manchester county; first teamplayed in the 5th tier in the English football league at the time of the study) were recruited andparticipated in this study. Based on an effect size of 1.15 for pre-to-post changes (dependent T-Test) inCOD speed performance in youth soccer players following COD speed training [7], a priori analysis,using G*Power (Version 3.1, University of Dusseldorf, Dusseldorf, Germany) [32], indicated that aminimum sample size of 8 was required to achieve a power of 0.80, and type 1 error or alpha level of0.05. This approach was in line with recommendations for estimating sample sizes in strength andconditioning research based on effect sizes for pre-to-post designs [33]. Thirteen soccer players fromthe U17s squad (consisting of defenders, midfielders, and attackers) (age: 16.9 ± 0.2 years; height:1.77 ± 0.05 m; mass: 69.2 ± 9.2 kg) were recruited for the IG. Conversely, thirteen soccer players fromthe U18s squad (age: 17.8 ± 0.3 years; height: 1.77 ± 0.07 m; mass: 73.3 ± 8.1 kg) acted as the CG andcontinued their normal field-based warm-ups (i.e., 5 min mobilisation exercises before progressing to15 min of low-level jump-landing and sprint drills). These sample sizes were in line with those used inprevious COD speed training [6–8] and COD technique modification studies [13,25,26]. Goalkeeperswere not included in this investigation [7]. The investigation was approved by the institutional ethicsreview board (HSR1617-131), and all participants were informed of the benefits and risks of theinvestigation prior to signing an institutionally approved consent form to participate in the study.
Sports 2019, 7, 205 4 of 20
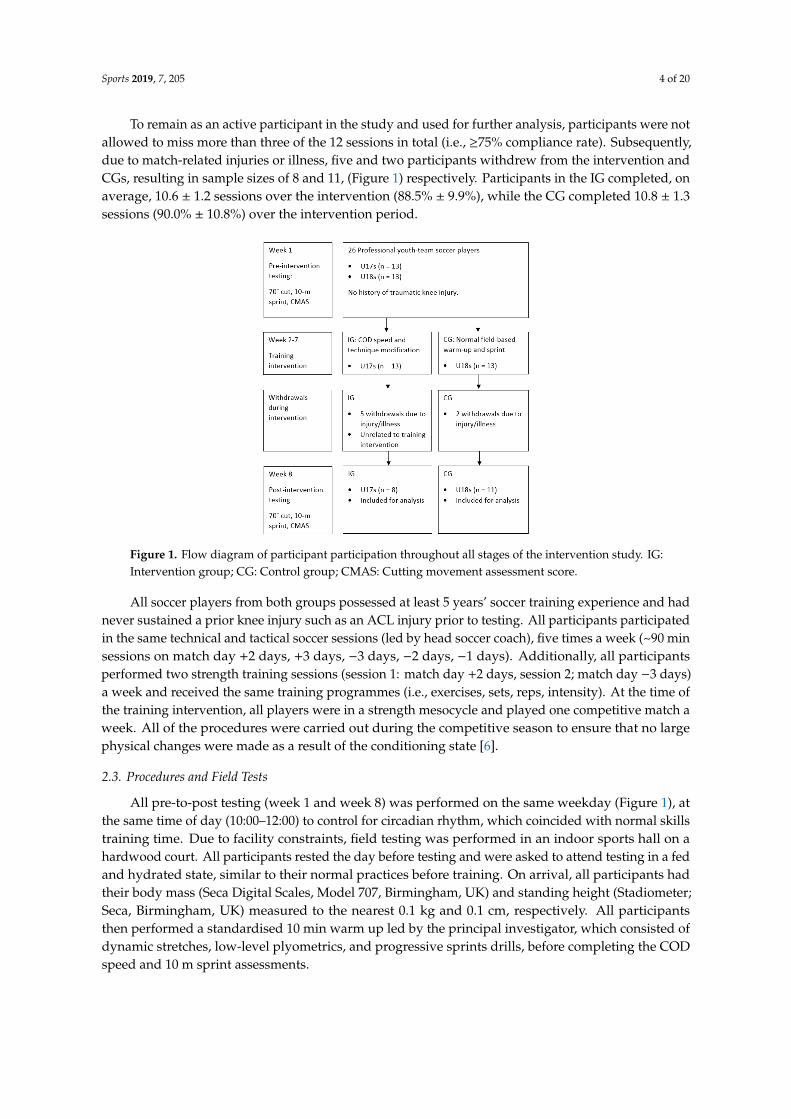
To remain as an active participant in the study and used for further analysis, participants were notallowed to miss more than three of the 12 sessions in total (i.e., ≥75% compliance rate). Subsequently,due to match-related injuries or illness, five and two participants withdrew from the intervention andCGs, resulting in sample sizes of 8 and 11, (Figure 1) respectively. Participants in the IG completed, onaverage, 10.6 ± 1.2 sessions over the intervention (88.5% ± 9.9%), while the CG completed 10.8 ± 1.3sessions (90.0% ± 10.8%) over the intervention period.
Sports 2018, 6, x FOR PEER REVIEW 4 of 20
Subsequently, due to match-related injuries or illness, five and two participants withdrew from the
intervention and CGs, resulting in sample sizes of 8 and 11, (Figure 1) respectively. Participants in
the IG completed, on average, 10.6 ± 1.2 sessions over the intervention (88.5% ± 9.9%), while the CG
completed 10.8 ± 1.3 sessions (90.0% ± 10.8%) over the intervention period.
All soccer players from both groups possessed at least 5 years’ soccer training experience and
had never sustained a prior knee injury such as an ACL injury prior to testing. All participants
participated in the same technical and tactical soccer sessions (led by head soccer coach), five times a
week (~90 min sessions on match day +2 days, +3 days, −3 days, −2 days, −1 days). Additionally, all
participants performed two strength training sessions (session 1: match day +2 days, session 2; match
day −3 days) a week and received the same training programmes (i.e., exercises, sets, reps, intensity).
At the time of the training intervention, all players were in a strength mesocycle and played one
competitive match a week. All of the procedures were carried out during the competitive season to
ensure that no large physical changes were made as a result of the conditioning state [6].
Figure 1. Flow diagram of participant participation throughout all stages of the intervention study.
IG: Intervention group; CG: Control group; CMAS: Cutting movement assessment score.
2.3. Procedures and Field Tests
All pre-to-post testing (week 1 and week 8) was performed on the same weekday (Figure 1), at
the same time of day (10:00–12:00) to control for circadian rhythm, which coincided with normal skills
training time. Due to facility constraints, field testing was performed in an indoor sports hall on a
hardwood court. All participants rested the day before testing and were asked to attend testing in a
fed and hydrated state, similar to their normal practices before training. On arrival, all participants
had their body mass (Seca Digital Scales, Model 707, Birmingham, UK) and standing height
(Stadiometer; Seca, Birmingham, UK) measured to the nearest 0.1 kg and 0.1 cm, respectively. All
participants then performed a standardised 10 min warm up led by the principal investigator, which
consisted of dynamic stretches, low-level plyometrics, and progressive sprints drills, before
completing the COD speed and 10 m sprint assessments.
2.3.1. 70° Cutting Task
The cutting task consisted of a 5 m approach, 70° cut, and 5 m exit towards the finish (Figure 2).
Completion time was measured using sets of single-beam (accuracy to 1/1000th of a second) Brower
photocell timing Gates (Draper, UT, USA), which were setup at the start and finish (Figure 2); time
was recorded to the nearest 0.001 s. Timing gates were placed at the approximate hip height for all
athletes, to ensure that only one body part breaks the beam. Participants started 0.5 m behind the first
Figure 1. Flow diagram of participant participation throughout all stages of the intervention study. IG:Intervention group; CG: Control group; CMAS: Cutting movement assessment score.
All soccer players from both groups possessed at least 5 years’ soccer training experience and hadnever sustained a prior knee injury such as an ACL injury prior to testing. All participants participatedin the same technical and tactical soccer sessions (led by head soccer coach), five times a week (~90 minsessions on match day +2 days, +3 days, −3 days, −2 days, −1 days). Additionally, all participantsperformed two strength training sessions (session 1: match day +2 days, session 2; match day −3 days)a week and received the same training programmes (i.e., exercises, sets, reps, intensity). At the time ofthe training intervention, all players were in a strength mesocycle and played one competitive match aweek. All of the procedures were carried out during the competitive season to ensure that no largephysical changes were made as a result of the conditioning state [6].
2.3. Procedures and Field Tests
All pre-to-post testing (week 1 and week 8) was performed on the same weekday (Figure 1), atthe same time of day (10:00–12:00) to control for circadian rhythm, which coincided with normal skillstraining time. Due to facility constraints, field testing was performed in an indoor sports hall on ahardwood court. All participants rested the day before testing and were asked to attend testing in a fedand hydrated state, similar to their normal practices before training. On arrival, all participants hadtheir body mass (Seca Digital Scales, Model 707, Birmingham, UK) and standing height (Stadiometer;Seca, Birmingham, UK) measured to the nearest 0.1 kg and 0.1 cm, respectively. All participantsthen performed a standardised 10 min warm up led by the principal investigator, which consisted ofdynamic stretches, low-level plyometrics, and progressive sprints drills, before completing the CODspeed and 10 m sprint assessments.
Sports 2019, 7, 205 5 of 20
2.3.1. 70◦ Cutting Task
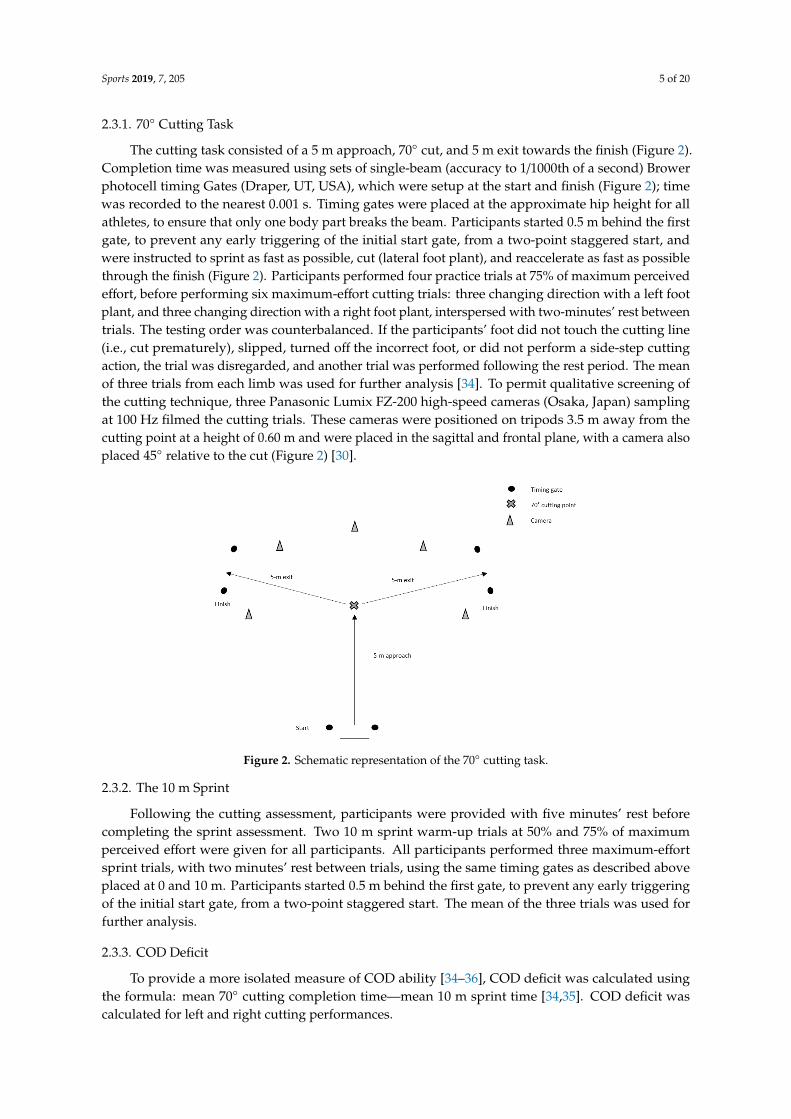
The cutting task consisted of a 5 m approach, 70◦ cut, and 5 m exit towards the finish (Figure 2).Completion time was measured using sets of single-beam (accuracy to 1/1000th of a second) Browerphotocell timing Gates (Draper, UT, USA), which were setup at the start and finish (Figure 2); timewas recorded to the nearest 0.001 s. Timing gates were placed at the approximate hip height for allathletes, to ensure that only one body part breaks the beam. Participants started 0.5 m behind the firstgate, to prevent any early triggering of the initial start gate, from a two-point staggered start, andwere instructed to sprint as fast as possible, cut (lateral foot plant), and reaccelerate as fast as possiblethrough the finish (Figure 2). Participants performed four practice trials at 75% of maximum perceivedeffort, before performing six maximum-effort cutting trials: three changing direction with a left footplant, and three changing direction with a right foot plant, interspersed with two-minutes’ rest betweentrials. The testing order was counterbalanced. If the participants’ foot did not touch the cutting line(i.e., cut prematurely), slipped, turned off the incorrect foot, or did not perform a side-step cuttingaction, the trial was disregarded, and another trial was performed following the rest period. The meanof three trials from each limb was used for further analysis [34]. To permit qualitative screening ofthe cutting technique, three Panasonic Lumix FZ-200 high-speed cameras (Osaka, Japan) samplingat 100 Hz filmed the cutting trials. These cameras were positioned on tripods 3.5 m away from thecutting point at a height of 0.60 m and were placed in the sagittal and frontal plane, with a camera alsoplaced 45◦ relative to the cut (Figure 2) [30].
Sports 2018, 6, x FOR PEER REVIEW 5 of 20
gate, to prevent any early triggering of the initial start gate, from a two-point staggered start, and
were instructed to sprint as fast as possible, cut (lateral foot plant), and reaccelerate as fast as possible
through the finish (Figure 2). Participants performed four practice trials at 75% of maximum
perceived effort, before performing six maximum-effort cutting trials: three changing direction with
a left foot plant, and three changing direction with a right foot plant, interspersed with two-minutes’
rest between trials. The testing order was counterbalanced. If the participants’ foot did not touch the
cutting line (i.e., cut prematurely), slipped, turned off the incorrect foot, or did not perform a side-
step cutting action, the trial was disregarded, and another trial was performed following the rest
period. The mean of three trials from each limb was used for further analysis [34]. To permit
qualitative screening of the cutting technique, three Panasonic Lumix FZ-200 high-speed cameras
(Osaka, Japan) sampling at 100 Hz filmed the cutting trials. These cameras were positioned on tripods
3.5 m away from the cutting point at a height of 0.60 m and were placed in the sagittal and frontal
plane, with a camera also placed 45° relative to the cut (Figure 2) [30].
Figure 2. Schematic representation of the 70˚ cutting task.
2.3.2. The 10 m Sprint
Following the cutting assessment, participants were provided with five minutes’ rest before
completing the sprint assessment. Two 10 m sprint warm-up trials at 50% and 75% of maximum
perceived effort were given for all participants. All participants performed three maximum-effort
sprint trials, with two minutes’ rest between trials, using the same timing gates as described above
placed at 0 and 10 m. Participants started 0.5 m behind the first gate, to prevent any early triggering
of the initial start gate, from a two-point staggered start. The mean of the three trials was used for
further analysis.
2.3.3. COD Deficit
To provide a more isolated measure of COD ability [34–36], COD deficit was calculated using
the formula: mean 70° cutting completion time—mean 10 m sprint time [34,35]. COD deficit was
calculated for left and right cutting performances.
2.3.4. CMAS Screening
Trials were screened against the 9-item CMAS screening tool [30]. If an athlete exhibited any of
the characteristics/deficits, they were awarded a score, with a higher score representative of poorer
technique and potentially greater peak KAMs [29,30]. All video footage was viewed in Kinovea
software (0.8.15 for Windows, Bordeaux, France), which is free, and was used for qualitative
screening using the CMAS. This software allowed videos to be played at various speeds and frame-
Figure 2. Schematic representation of the 70◦ cutting task.
2.3.2. The 10 m Sprint
Following the cutting assessment, participants were provided with five minutes’ rest beforecompleting the sprint assessment. Two 10 m sprint warm-up trials at 50% and 75% of maximumperceived effort were given for all participants. All participants performed three maximum-effortsprint trials, with two minutes’ rest between trials, using the same timing gates as described aboveplaced at 0 and 10 m. Participants started 0.5 m behind the first gate, to prevent any early triggeringof the initial start gate, from a two-point staggered start. The mean of the three trials was used forfurther analysis.
2.3.3. COD Deficit
To provide a more isolated measure of COD ability [34–36], COD deficit was calculated usingthe formula: mean 70◦ cutting completion time—mean 10 m sprint time [34,35]. COD deficit wascalculated for left and right cutting performances.
Sports 2019, 7, 205 6 of 20
2.3.4. CMAS Screening
Trials were screened against the 9-item CMAS screening tool [30]. If an athlete exhibited any ofthe characteristics/deficits, they were awarded a score, with a higher score representative of poorertechnique and potentially greater peak KAMs [29,30]. All video footage was viewed in Kinoveasoftware (0.8.15 for Windows, Bordeaux, France), which is free, and was used for qualitative screeningusing the CMAS. This software allowed videos to be played at various speeds and frame-by-frame.All videos were screened within two weeks pre- and post-testing. Two raters screened the videos:the principal investigator who possesses seven years’ strength and conditioning and biomechanicsexperience, viewed and graded each trial; the second rater was a graduate in Strength and Conditioningand possessed two years’ strength and conditioning experience. The second rater viewed and screenedone trial from each participant and these scores were compared to the lead researcher to establishinter-rater reliability. Raters were allowed to independently watch the videos as many times asnecessary [37,38], at whatever speeds they needed to score each test, and could also pause footage forevaluative purposes [38]. On average, qualitative screening of one cutting trial took ~3 min. Prior toqualitative screening, all raters attended a one-hour training session outlining how to grade the cuttingtrials using the CMAS, and to establish and uniformly agree on “low-risk” and “high-risk” movementpatterns using pilot video footage.
2.3.5. Six-Week COD Speed and Technique Modification Training Intervention
A six-week COD speed and technique modification intervention, described in Table S1, wasperformed by the IG twice a week (20 min per session) (session 1: match day +3 days; session 2:match day −2 days), with a minimum of 48 h between sessions. The six-week technique modificationintervention focused on pre-planned low-intensity decelerations and turns (weeks 1–2), beforeprogressing intensity via velocity and angle (weeks 3–4) [27,36,39], and introducing a stimuluswith increased intensity (weeks 3–6). The COD programme was in accordance with COD speedrecommendations from the National Strength and Conditioning Association [40], Nimphius [5], andrecent braking-strategy recommendations [41], and the duration, distances, and number of CODswere similar to previously successful 6-week COD speed [6–8] and COD technique modificationstudies [13,25]. The sessions were led by the principle investigator, who is a certified strength andconditioning specialist with extensive experience in coaching COD speed and agility drills. All CODspeed and technique modifications sessions took place at the soccer team’s training facility, with the firstsession of the week performed on a synthetic astro-turf and the second session of the week performedon a synthetic 3G rubber crumb field-turf. Players were given individual feedback regarding theirtechnique, and external verbal coaching cues such as “slam on the brakes” (to promote early braking),“push/punch the ground away” (to enhance medio-lateral force propulsion and encourage activeknee flexion), and “face towards the direction of travel” (to reduce lateral trunk flexion) were used topromote safer mechanics [42], promote faster performance [43], and facilitate better retention [42].
2.4. Statistical Analyses
All statistical analyses were performed using SPSS v 25 (SPSS Inc., Chicago, IL, USA) and MicrosoftExcel (version 2016, Microsoft Corp., Redmond, WA, USA). The primary outcome variables of thisstudy were cutting completion time, COD deficit, 10 m sprint times, and CMASs.
Within-session reliability for the primary outcome variables was assessed for each group andsession using Intraclass correlation coefficients (ICC) (two-way mixed effects, average measures,absolute agreement), coefficient of variation (CV %), and standard error of measurement (SEM). TheCV % was calculated as SD/mean ×100 for each participant and averaged across participants. The SEMwas calculated using the formula: SD (pooled) ×
√(1− ICC) [44], whereas the smallest detectable
difference (SDD) was calculated from the formula: (1.96 × (√(2)) × SEM [45]. ICCs were interpreted
based on the following scale presented by Koo and Li [46]: poor (<0.50), moderate (0.50–0.75), good

Sports 2019, 7, 205 7 of 20
(0.75–0.90), and excellent (>0.90). Minimum acceptable reliability was determined with an ICC >0.7and CV < 15% [47].
To determine intra-rater reliability, 26 trials (1 from trial from each participant) were randomlyselected by the lead researcher, and each trial was viewed and graded on two separate occasions,separated by 7 days, in line with previous research [38]. Similarly, for inter-rater reliability, 19 trialswere screened by the other researcher and these scores were compared to the lead researcher. ICCsand SEMs for total score were determined. For each item within the CMAS, percentage agreements(agreements/agreements + disagreements × 100) and Kappa coefficients were calculated [29]. Kappacoefficients were calculated using the formula: k = Pr(a) − Pr(e)/1 − Pr(e), where Pr(a) = relativeobserved agreement between raters; Pr(e) = hypothetic probability of chance agreement, whichdescribes the proportion of agreement between the two methods after any agreement by chance hasbeen removed [48]. The kappa coefficient was interpreted based on the following scale of Landis andKoch [49]: slight (0.01–0.20), fair (0.21–0.40), moderate (0.41–0.60), good (0.61–0.80), and excellent(0.81–1.00). Percentage agreements were interpreted in line with previous research [37] and the scalewas as follows: excellent (>80%), moderate (51–79%), and poor (≤50%) [37].
Normality was inspected for all variables using a Shapiro–Wilks test. A two-way mixed ANOVA(group; time) with group as a between-subjects factor measured at 2 levels (IG and CG), and time (pre-and post-training measures) the within-subject factor. This was used to identify any significant main(time) or interaction (group × time) effects for primary outcome variables between IG and CGs. ABonferroni-corrected pairwise comparison design was used to further analyse the effect of the groupwhen a significant interaction effect was observed for time and group. Partial eta squared effect sizeswere calculated for all ANOVAs with the values of 0.010–0.059, 0.060–0.149, and ≥0.150 consideredas small, medium, and large, respectively, according to Cohen [50]. Further, pre-to-post changes inprimary outcomes for each group were assessed using paired-sample t-tests for parametric data andWilcoxon-sign ranked tests for non-parametric data. Magnitudes of differences were assessed usingHedges’ g effect sizes, mean change, and percentage change ((post-pre)/pre × 100) with 95% confidenceintervals (CI). Hedges’ g effect sizes were calculated as described previously [51] and interpretedas trivial (≤0.19), small (0.20–0.59), moderate (0.60–1.19), large (1.20–1.99), very large (2.0–3.99), andextremely large (≥4.00) [52]. Comparisons in pre- and post-intervention primary outcomes and changein primary outcomes between IG and CGs were also assessed using independent sample t-tests orMann–Whitney U tests, with effect sizes outlined above. Statistical significance was defined p ≤ 0.05for all tests.
3. Results
3.1. Reliability
Within-session reliability for the IG and CG pre- and post-intervention primary outcomes arepresented in Table 1 containing ICCs, CV %, SEM, and SDD. All variables for the IG displayed good toexcellent ICCs pre- and post-intervention (Table 1). Cutting completion times and 10 m sprint timesdisplayed low levels of variance pre- and post-intervention. COD deficits and CMASs displayed highlevels of variance pre- and post-intervention (Table 1). All variables for the CG displayed moderateto excellent ICCs pre and post-intervention, excluding left cut completion time and COD deficitpre-intervention, which displayed lower ICCs (Table 1). Cutting completion times and 10 m sprinttimes displayed low levels of variance pre- and post-intervention. COD deficits and CMASs displayedhigh levels of variance pre- and post-intervention (Table 1).

Sports 2019, 7, 205 8 of 20
Table 1. Within-session reliability measures.
IG Pre-Intervention within-Session Reliability
Variable ICC LB UB CV% LB UB SEM SDD SDD%
Completion time Right Cut (s) 0.944 0.800 0.988 2.8 1.8 3.7 0.042 0.117 5.0Left Cut (s) 0.865 0.537 0.971 2.8 1.4 4.2 0.054 0.150 6.4
CODDRight CODD (s) 0.889 0.622 0.976 15.1 8.3 21.9 0.043 0.120 25.9Left CODD (s) 0.843 0.461 0.966 13.9 8.6 19.3 0.055 0.153 33.0
Sprint 10-m sprint (s) 0.861 0.561 0.969 2.1 0.9 3.4 0.034 0.093 5.0
CMASCMAS Right 0.934 0.776 0.986 11.4 5.2 17.6 0.49 1.36 21.7CMAS Left 0.865 0.526 0.971 15.7 9.3 22.2 0.67 1.84 29.3
IG post-intervention within-session reliability
Completion time Right Cut (s) 0.934 0.786 0.985 2.0 1.6 2.4 0.026 0.071 3.5Left Cut (s) 0.917 0.732 0.982 2.3 1.1 3.4 0.037 0.102 4.8
CODDRight CODD (s) 0.873 0.596 0.972 20.8 15.0 26.6 0.027 0.074 34.7Left CODD (s) 0.870 0.580 0.972 17.0 10.5 23.4 0.038 0.106 38.4
Sprint 10-m sprint (s) 0.932 0.776 0.985 1.8 0.7 2.9 0.027 0.076 4.1
CMASCMAS Right 0.870 0.553 0.972 18.3 12.4 24.3 0.59 1.63 33.9CMAS Left 0.817 0.373 0.961 22.2 16.0 28.3 0.63 1.74 42.6
CG pre-intervention within-session reliability
Completion time Right Cut (s) 0.878 0.671 0.964 3.0 2.1 3.9 0.051 0.141 5.9Left Cut (s) 0.693 0.180 0.909 2.9 1.9 4.0 0.061 0.168 6.9
CODDRight CODD (s) 0.847 0.585 0.955 14.9 9.6 20.3 0.052 0.145 28.3Left CODD (s) 0.661 0.096 0.899 13.2 8.7 17.7 0.062 0.172 31.5
Sprint 10-m sprint (s) 0.762 0.311 0.931 2.3 1.7 3.0 0.035 0.096 5.1
CMASCMAS Right 0.898 0.723 0.970 14.4 9.9 18.8 0.52 1.43 28.3CMAS Left 0.877 0.668 0.964 18.5 9.8 27.3 0.56 1.55 33.9
CG post-intervention within-session reliability
Completion time Right Cut (s) 0.727 0.214 0.921 3.1 2.2 4.1 0.059 0.163 7.2Left Cut (s) 0.903 0.738 0.972 2.0 1.3 2.7 0.033 0.092 4.0
CODDRight CODD (s) 0.721 0.197 0.920 18.8 14.1 23.6 0.059 0.163 44.7Left CODD (s) 0.932 0.816 0.980 11.6 7.4 15.7 0.032 0.089 21.3
Sprint 10-m sprint (s) 0.830 0.546 0.950 2.4 1.4 3.3 0.036 0.099 5.3
CMASCMAS Right 0.854 0.609 0.957 19.2 14.1 24.2 0.63 1.76 33.9CMAS Left 0.774 0.355 0.935 15.3 8.9 21.7 0.65 1.81 36.0
Key: IG: Intervention group; CG: Control group; CODD: Change of direction deficit; CMAS: Cutting movementassessment score; ICC: Intraclass correlation coefficients; CV %: Coefficient of variation; LB: Lower bound 95%confidence interval; UB: Upper bound 95% confidence interval; SEM: Standard error of measurement; SDD: Smallestdetectable difference.
Intra- and inter-rater percentage agreements and Kappa coefficients for intra-and inter-raterreliability are presented in Table 2.
• Excellent intra- (ICC = 0.972, SEM = 0.32, SDD = 0.88) and inter-rater reliability (ICC = 0.917,SEM = 0.38, SDD = 1.05) was observed for CMAS total score.
• Excellent intra- (≥92.3%, k ≥ 0.866) and inter-rater (≥89.5% k ≥ 0.872) percentage-agreements andkappa coefficients were demonstrated for all CMAS variables (Table 2), with the exception ofpenultimate foot contact (PFC) braking (k = 0.755) and initial knee valgus position (k = 0.789)which demonstrated good kappa coefficients.

Sports 2019, 7, 205 9 of 20
Table 2. Intra- and inter-rater reliability for CMAS criteria and total score.
Variable/CMAS Tool Criteria Intra-Rater Reliability Inter-Rater Reliability
% Agreement k % Agreement k
Clear PFC braking 92.3 0.755 94.7 0.894
Wide lateral leg plant 96.2 0.920 100.0 1.000
Hip in an initial internally rotated position 100.0 1.000 100.0 1.000
Initial knee ‘valgus’ position 96.2 0.866 89.5 0.789
Inwardly rotated foot position 96.2 0.922 100.0 1.000
Frontal plane trunk position relative to intended direction 96.2 0.935 94.7 0.906
Trunk upright or leaning back throughout contact 96.2 0.906 100.0 1.000
Limited Knee Flexion during final contact 96.2 0.923 94.7 0.872
Excessive Knee ‘valgus’ motion during contact 96.2 0.920 94.7 0.906
Average 96.2 0.905 96.5 0.930
Key: PFC: Penultimate foot contact; CMAS: Cutting movement assessment score.
Pre-to-post changes in primary outcomes for the IG and CG are presented in Tables 3 and 4,containing descriptives, p values, effect sizes, percentage differences, and mean differences. Nosignificant differences were observed in primary outcome variables between groups pre-intervention(p > 0.05); however, effect sizes indicated that the IG displayed faster right cut (p = 0.468, g = −0.33),left cut (p = 0.097, g = −0.78), right COD deficit (p = 0.432, g = −0.36), left COD deficit (p = 0.062,g = −0.77) and greater right (p = 0.171, g = 0.71) and left CMASs (p = 0.456, g = 1.09) compared to theCG. Trivial and non-significant (p = 0.844, g = −0.09) differences were observed in 10 m sprint timesbetween groups.

Sports 2019, 7, 205 10 of 20
Table 3. IG pre-to-post changes.
VariableIG Pre IG Post Hedges’ g Effect Size % Change Mean Difference
Mean SD Mean SD p g LB UB Mean SD LB UB Mean SD LB UB
R Cut (s) 2.344 0.172 2.065 0.095 <0.001 −1.90 −3.08 −0.72 −11.7 4.3 −16.2 −7.7 −0.279 0.115 −0.375 −0.182L Cut (s) 2.342 0.130 2.128 0.119 <0.001 −1.63 −2.76 −0.50 −9.1 3.8 −12.5 −5.8 −0.215 0.097 −0.296 −0.133
R CODD (s) 0.466 0.121 0.214 0.068 0.001 −2.43 −3.72 −1.14 −51.5 17.4 −72.8 −35.3 −0.252 0.129 −0.360 −0.144L CODD (s) 0.464 0.121 0.277 0.095 0.012 −1.63 −2.76 −0.50 −39.1 21.2 −54.3 −26.3 −0.187 0.123 −0.290 −0.084
10-m sprint (s) 1.878 0.081 1.850 0.098 0.328 −0.29 −1.27 0.70 −1.4 3.9 −2.6 −0.4 −0.027 0.075 −0.034 0.090R CMAS 6.3 1.8 4.8 1.4 0.025 −0.85 −1.88 0.17 −22.5 15.7 −31.5 −15.2 −1.5 1.1 −2.6 −0.4L CMAS 6.3 1.6 4.1 1.2 0.018 −1.46 −2.57 −0.36 −33.9 20.3 −47.3 −22.9 −2.2 1.5 −3.5 −1.0
Key: R: Right; L: left; IG: Intervention group; CODD: Change of direction deficit; CMAS: Cutting movement assessment score; LB: Lower-bound 95% confidence interval; UB: Upper-bound95% confidence interval. Note: italic denotes non-parametric.
Table 4. CG pre-to-post changes.
VariableCG Pre CG Post Hedges’ g Effect Size % Change Mean Difference
Mean SD Mean SD p g LB UB Mean SD LB UB Mean SD LB UB
R Cut (s) 2.395 0.131 2.251 0.089 <0.001 −1.21 −2.28 −0.15 −5.9 3.5 −8.3 −3.7 −0.144 0.089 −0.203 −0.084L Cut (s) 2.429 0.087 2.306 0.097 0.002 −1.27 −2.34 −0.19 −5.0 3.9 −7.1 −3.1 −0.123 0.099 −0.190 −0.057
R CODD (s) 0.510 0.117 0.365 0.088 <0.001 −1.32 −2.41 −0.24 −27.9 10.5 −38.3 −18.5 −0.145 0.057 −0.183 −0.106L CODD (s) 0.545 0.082 0.420 0.116 0.013 −1.17 −2.23 −0.11 −21.7 21.4 −30.8 −14.9 −0.124 0.136 −0.216 −0.032
10-m sprint (s) 1.885 0.058 1.885 0.075 0.957 0.01 −0.97 0.99 0.1 3.3 −0.9 1.0 0.001 0.061 −0.041 −0.040R CMAS 5.1 1.5 5.2 1.5 0.779 0.08 −0.90 1.06 5.6 28.2 −11.1 22.3 0.1 1.4 −0.9 1.1L CMAS 4.6 1.4 5.0 1.1 0.306 0.33 −0.65 1.32 18.5 39.8 −5.0 42.0 0.5 1.3 −0.5 1.4
Key: R: Right; L: left; CG: Control group; CODD: Change of direction deficit; CMAS: Cutting movement assessment score; LB: Lower-bound 95% confidence interval; UB: Upper-bound95% confidence interval. Note: italic denotes non-parametric.
Sports 2019, 7, 205 11 of 20
3.1.1. Right Cut
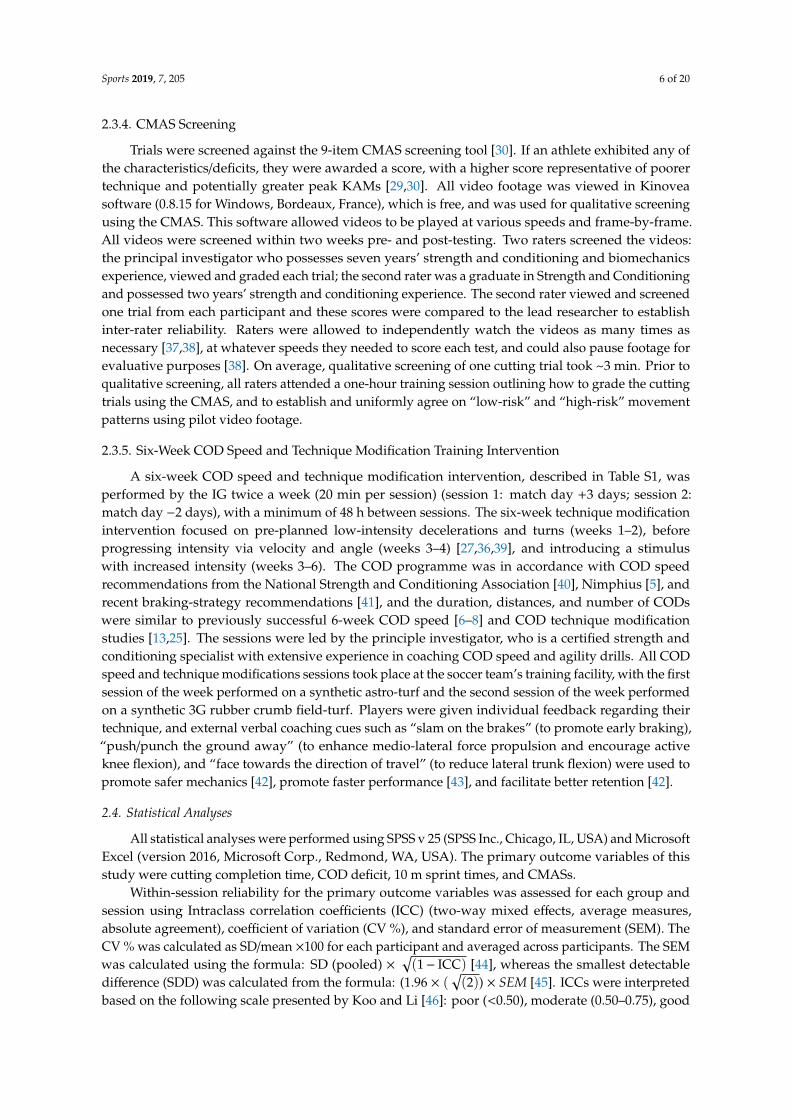
Large and significant main effects for time were found for right cut completion time (p < 0.001,η2 = 0.829, power = 1.000). In addition, a large and significant interaction effect of time and groupfor right cut completion time was also observed (p = 0.010, η2 = 0.330, power = 0.779), with the IGshowing significantly faster post-intervention completion times (p < 0.001, g = −1.94) compared to theCG. Moreover, large and significant improvements in right cut completion times were observed for theIG (p < 0.001, g = −1.90, −11.7%, −0.279 s) and CG (p < 0.001, g = −1.21, −5.9%, −0.144 s) (Tables 3 and 4,Figure 3) post-intervention, which were greater than the SEM and SDD. Mean (p = 0.010, g = −1.29)and percentage (p = 0.005, g = −1.41) improvements were significantly greater for the IG compared toCG, with large effect sizes (Figure 3).
Sports 2018, 6, x FOR PEER REVIEW 11 of 20
3.1.1. Right Cut
Large and significant main effects for time were found for right cut completion time (p < 0.001,
η2 = 0.829, power = 1.000). In addition, a large and significant interaction effect of time and group for
right cut completion time was also observed (p = 0.010, η2 = 0.330, power = 0.779), with the IG showing
significantly faster post-intervention completion times (p < 0.001, g = −1.94) compared to the CG.
Moreover, large and significant improvements in right cut completion times were observed for the
IG (p < 0.001, g = −1.90, −11.7%, −0.279 s) and CG (p < 0.001, g = −1.21, −5.9%, −0.144 s) (Tables 3 and 4,
Figure 3) post-intervention, which were greater than the SEM and SDD. Mean (p = 0.010, g = −1.29)
and percentage (p = 0.005, g = −1.41) improvements were significantly greater for the IG compared to
CG, with large effect sizes (Figure 3).
Figure 3. Individual plots illustrating pre-to-post changes in right cut completion times with
individual mean and percentage changes; IG: Intervention group CG: Control group. Black rectangle
denotes mean.
3.1.2. Left Cut
Large and significant main effects for time were found for left cut completion time (p < 0.001, η2
= 0.763, power = 1.000). In addition, a large, yet non-significant interaction effect of time and group
for left cut completion time was also observed (p = 0.062, η2 = 0.190, power = 0.470); however, the IG
demonstrated significantly faster post-intervention left cut completion times (p = 0.002, g = −1.57)
compared to the CG. Moreover, large and significant improvements in left cut completion times were
observed for the IG (p < 0.001, g = −1.63, −9.1%, −0.215 s) and CG (p = 0.002, g = −1.27, −5.0%, −0.123 s)
(Tables 3 and 4, Figure 4) post-intervention, but these improvements were greater than SDD for the
IG only. Mean (p = 0.062, g = −0.89) and percentage (p = 0.038, g = −1.00) improvements were greater
for the IG compared to CG, with moderate effect sizes (Figure 4).
Figure 4. Individual plots illustrating pre-to-post changes in left cut completion times with individual
mean and percentage changes; IG: Intervention group CG: Control group. Black rectangle denotes
mean.
Figure 3. Individual plots illustrating pre-to-post changes in right cut completion times with individualmean and percentage changes; IG: Intervention group CG: Control group. Black rectangle denotes mean.
3.1.2. Left Cut
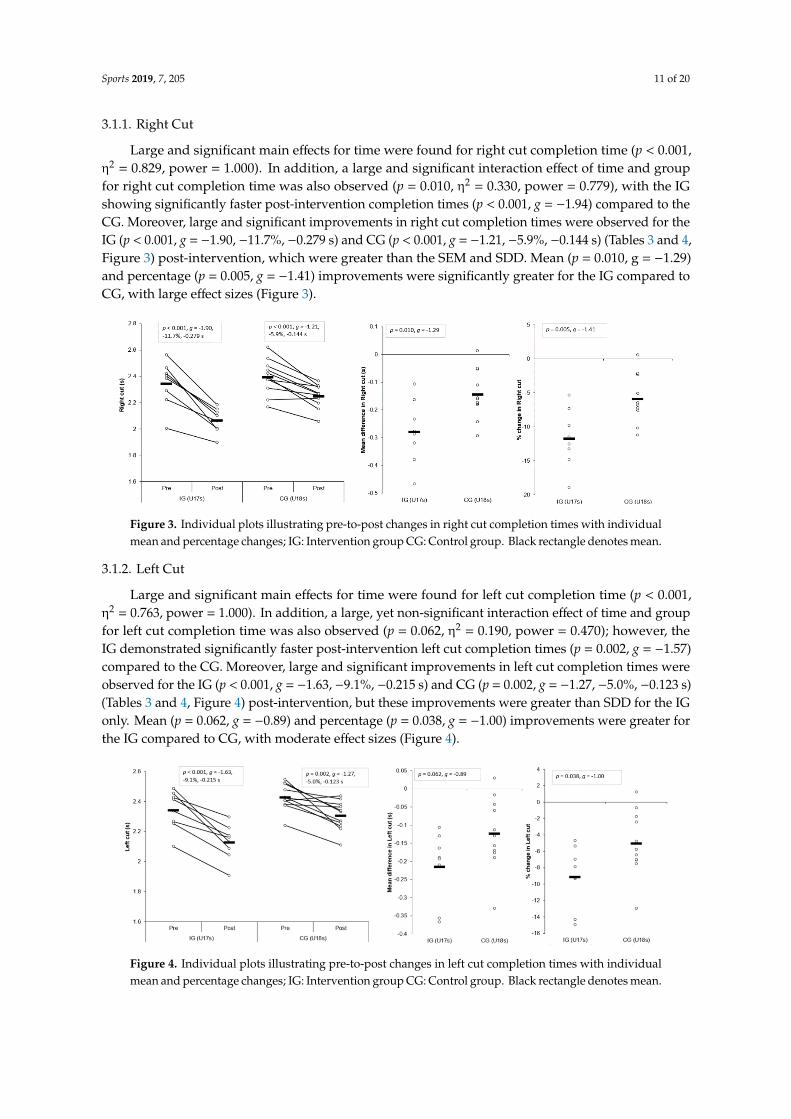
Large and significant main effects for time were found for left cut completion time (p < 0.001,η2 = 0.763, power = 1.000). In addition, a large, yet non-significant interaction effect of time and groupfor left cut completion time was also observed (p = 0.062, η2 = 0.190, power = 0.470); however, theIG demonstrated significantly faster post-intervention left cut completion times (p = 0.002, g = −1.57)compared to the CG. Moreover, large and significant improvements in left cut completion times wereobserved for the IG (p < 0.001, g = −1.63, −9.1%, −0.215 s) and CG (p = 0.002, g = −1.27, −5.0%, −0.123 s)(Tables 3 and 4, Figure 4) post-intervention, but these improvements were greater than SDD for the IGonly. Mean (p = 0.062, g = −0.89) and percentage (p = 0.038, g = −1.00) improvements were greater forthe IG compared to CG, with moderate effect sizes (Figure 4).
Sports 2018, 6, x FOR PEER REVIEW 11 of 20
3.1.1. Right Cut
Large and significant main effects for time were found for right cut completion time (p < 0.001,
η2 = 0.829, power = 1.000). In addition, a large and significant interaction effect of time and group for
right cut completion time was also observed (p = 0.010, η2 = 0.330, power = 0.779), with the IG showing
significantly faster post-intervention completion times (p < 0.001, g = −1.94) compared to the CG.
Moreover, large and significant improvements in right cut completion times were observed for the
IG (p < 0.001, g = −1.90, −11.7%, −0.279 s) and CG (p < 0.001, g = −1.21, −5.9%, −0.144 s) (Tables 3 and 4,
Figure 3) post-intervention, which were greater than the SEM and SDD. Mean (p = 0.010, g = −1.29)
and percentage (p = 0.005, g = −1.41) improvements were significantly greater for the IG compared to
CG, with large effect sizes (Figure 3).
Figure 3. Individual plots illustrating pre-to-post changes in right cut completion times with
individual mean and percentage changes; IG: Intervention group CG: Control group. Black rectangle
denotes mean.
3.1.2. Left Cut
Large and significant main effects for time were found for left cut completion time (p < 0.001, η2
= 0.763, power = 1.000). In addition, a large, yet non-significant interaction effect of time and group
for left cut completion time was also observed (p = 0.062, η2 = 0.190, power = 0.470); however, the IG
demonstrated significantly faster post-intervention left cut completion times (p = 0.002, g = −1.57)
compared to the CG. Moreover, large and significant improvements in left cut completion times were
observed for the IG (p < 0.001, g = −1.63, −9.1%, −0.215 s) and CG (p = 0.002, g = −1.27, −5.0%, −0.123 s)
(Tables 3 and 4, Figure 4) post-intervention, but these improvements were greater than SDD for the
IG only. Mean (p = 0.062, g = −0.89) and percentage (p = 0.038, g = −1.00) improvements were greater
for the IG compared to CG, with moderate effect sizes (Figure 4).
Figure 4. Individual plots illustrating pre-to-post changes in left cut completion times with individual
mean and percentage changes; IG: Intervention group CG: Control group. Black rectangle denotes
mean.
Figure 4. Individual plots illustrating pre-to-post changes in left cut completion times with individualmean and percentage changes; IG: Intervention group CG: Control group. Black rectangle denotes mean.

Sports 2019, 7, 205 12 of 20
3.1.3. Right COD Deficit (CODD)
Large and significant main effects for time were found for right CODDs (p < 0.001, η2 = 0.839,power = 1.000). In addition, a large and significant interaction effect of time and group for right CODDwas also observed (p = 0.025, η2 = 0.262, power = 0.639), with the IG displaying significantly shorterpost-intervention right CODDs (p = 0.001, g = −1.79) compared to the CG. Moreover, a very largeand large, significant improvement in right CODD was observed for IG (p = 0.001, g = −2.43, −51.5%,−0.252 s) and CG (p < 0.001, g = −1.32, −27.9%, −0.145 s) post-intervention, respectively (Tables 3 and 4,Figure 5). These changes were greater than the SDD for the IG only. Mean (p = 0.025, g = −1.09) andpercentage (p = 0.003, g = −1.57) improvements were significantly greater for the IG compared to theCG, with moderate and large effect sizes (Figure 5), respectively.
Sports 2018, 6, x FOR PEER REVIEW 12 of 20
3.1.3. Right COD Deficit (CODD)
Large and significant main effects for time were found for right CODDs (p < 0.001, η2 = 0.839,
power = 1.000). In addition, a large and significant interaction effect of time and group for right CODD
was also observed (p = 0.025, η2 = 0.262, power = 0.639), with the IG displaying significantly shorter
post-intervention right CODDs (p = 0.001, g = −1.79) compared to the CG. Moreover, a very large and
large, significant improvement in right CODD was observed for IG (p = 0.001, g = −2.43, −51.5%, −0.252
s) and CG (p < 0.001, g = −1.32, −27.9%, −0.145 s) post-intervention, respectively (Tables 3 and 4, Figure
5). These changes were greater than the SDD for the IG only. Mean (p = 0.025, g = −1.09) and percentage
(p = 0.003, g = −1.57) improvements were significantly greater for the IG compared to the CG, with
moderate and large effect sizes (Figure 5), respectively.
Figure 5. Individual plots illustrating pre-to-post changes in right CODDs with individual mean and
percentage changes; IG: Intervention group CG: Control group; CODD: Change of direction deficit.
Black rectangle denotes mean.
3.1.4. Left CODD
Large and significant main effects for time were found for left CODDs (p < 0.001, η2 = 0.606,
power = 0.998). Although a small, non-significant interaction effect of time and group for left CODD
was observed (p = 0.316, η2 = 0.059, power = 0.164), the IG displayed significantly shorter post-
intervention left CODDs (p = 0.011, g = −1.27) compared to the CG. Moreover, a large and moderate,
significant improvement in left CODDs was observed for the IG (p = 0.012, g = −1.63, −39.1%, −0.187
s) and CG (p = 0.013, g = −1.17, −21.7%, −0.124 s) post-intervention, respectively (Tables 3 and 4, Figure
6). These changes were greater than the SDD for the IG only. Although non-significant, mean (p =
0.316, g = −0.46) and percentage (p = 0.062, g = −0.78) improvements were slightly greater for the IG
compared to the CG, with a small and moderate effect size (Figure 6), respectively.
Figure 6. Individual plots illustrating pre-to-post changes in left CODDs with individual mean and
percentage changes; IG: Intervention group CG: Control group; CODD: Change of direction deficit.
Black rectangle denotes mean.
Figure 5. Individual plots illustrating pre-to-post changes in right CODDs with individual mean andpercentage changes; IG: Intervention group CG: Control group; CODD: Change of direction deficit.Black rectangle denotes mean.
3.1.4. Left CODD
Large and significant main effects for time were found for left CODDs (p < 0.001, η2 = 0.606,power = 0.998). Although a small, non-significant interaction effect of time and group for left CODD wasobserved (p = 0.316, η2 = 0.059, power = 0.164), the IG displayed significantly shorter post-interventionleft CODDs (p = 0.011, g = −1.27) compared to the CG. Moreover, a large and moderate, significantimprovement in left CODDs was observed for the IG (p = 0.012, g = −1.63, −39.1%, −0.187 s) andCG (p = 0.013, g = −1.17, −21.7%, −0.124 s) post-intervention, respectively (Tables 3 and 4, Figure 6).These changes were greater than the SDD for the IG only. Although non-significant, mean (p = 0.316,g =−0.46) and percentage (p = 0.062, g =−0.78) improvements were slightly greater for the IG comparedto the CG, with a small and moderate effect size (Figure 6), respectively.
Sports 2018, 6, x FOR PEER REVIEW 12 of 20
3.1.3. Right COD Deficit (CODD)
Large and significant main effects for time were found for right CODDs (p < 0.001, η2 = 0.839,
power = 1.000). In addition, a large and significant interaction effect of time and group for right CODD
was also observed (p = 0.025, η2 = 0.262, power = 0.639), with the IG displaying significantly shorter
post-intervention right CODDs (p = 0.001, g = −1.79) compared to the CG. Moreover, a very large and
large, significant improvement in right CODD was observed for IG (p = 0.001, g = −2.43, −51.5%, −0.252
s) and CG (p < 0.001, g = −1.32, −27.9%, −0.145 s) post-intervention, respectively (Tables 3 and 4, Figure
5). These changes were greater than the SDD for the IG only. Mean (p = 0.025, g = −1.09) and percentage
(p = 0.003, g = −1.57) improvements were significantly greater for the IG compared to the CG, with
moderate and large effect sizes (Figure 5), respectively.
Figure 5. Individual plots illustrating pre-to-post changes in right CODDs with individual mean and
percentage changes; IG: Intervention group CG: Control group; CODD: Change of direction deficit.
Black rectangle denotes mean.
3.1.4. Left CODD
Large and significant main effects for time were found for left CODDs (p < 0.001, η2 = 0.606,
power = 0.998). Although a small, non-significant interaction effect of time and group for left CODD
was observed (p = 0.316, η2 = 0.059, power = 0.164), the IG displayed significantly shorter post-
intervention left CODDs (p = 0.011, g = −1.27) compared to the CG. Moreover, a large and moderate,
significant improvement in left CODDs was observed for the IG (p = 0.012, g = −1.63, −39.1%, −0.187
s) and CG (p = 0.013, g = −1.17, −21.7%, −0.124 s) post-intervention, respectively (Tables 3 and 4, Figure
6). These changes were greater than the SDD for the IG only. Although non-significant, mean (p =
0.316, g = −0.46) and percentage (p = 0.062, g = −0.78) improvements were slightly greater for the IG
compared to the CG, with a small and moderate effect size (Figure 6), respectively.
Figure 6. Individual plots illustrating pre-to-post changes in left CODDs with individual mean and
percentage changes; IG: Intervention group CG: Control group; CODD: Change of direction deficit.
Black rectangle denotes mean.
Figure 6. Individual plots illustrating pre-to-post changes in left CODDs with individual mean andpercentage changes; IG: Intervention group CG: Control group; CODD: Change of direction deficit.Black rectangle denotes mean.

Sports 2019, 7, 205 13 of 20
3.1.5. The 10 m Sprint
No significant main effects (p = 0.400, η2 = 0.042, power = 0.129) or interactions (p = 0.367,η2 = 0.048, power = 0.141) were observed for 10 m sprint performance, and no significant differencesin post-intervention 10 m sprints times were demonstrated between groups (p = 0.390, g = −0.39).The IG displayed a non-significant, yet small improvement in 10 m sprints following the intervention(p = 0.328, g = −0.29, −1.4%, −0.027 s), while a non-significant, trivial difference was observed for theCG (p = 0.957, g = 0.01, +0.1%, +0.001 s) (Tables 3 and 4). These changes, however, were not greaterthan the SDD for both groups. Although non-significant, mean (p = 0.374, g = −0.41) and percentage(p = 0.370, g = −0.41) improvements were slightly greater for the IG compared to CG, with a smalleffect size.
3.1.6. CMAS Right
Large and significant main effects for time were found for right CMAS (p = 0.041, η2 = 0.224,power = 0.551). In addition, a large, significant interaction effect of time and group for right CMAS wasalso observed (p = 0.018, η2 = 0.287, power = 0.694), with the IG showing slightly lower post-interventionright CMASs (p = 0.001, g =−0.26) compared to the CG. A moderate and significant improvement in rightCMAS was observed for the IG (p = 0.025, g = −0.85, −22.5%, −1.46 score) following the intervention,whereas the CG demonstrated no significant and trivial changes in right CMAS post-intervention(p = 0.779, g = 0.08, +5.6%, +0.12 score) (Tables 3 and 4, Figure 7). These changes were greater than theSDD for the IG only. Although non-significant, mean (p = 0.122, g = −1.16) and percentage changes(p = 0.089, g = −1.12) were greater for the IG compared to CG, with moderate effect sizes (Figure 7).
Sports 2018, 6, x FOR PEER REVIEW 13 of 20
3.1.5. The 10 m Sprint
No significant main effects (p = 0.400, η2 = 0.042, power = 0.129) or interactions (p = 0.367, η2 =
0.048, power = 0.141) were observed for 10 m sprint performance, and no significant differences in
post-intervention 10 m sprints times were demonstrated between groups (p = 0.390, g = −0.39). The IG
displayed a non-significant, yet small improvement in 10 m sprints following the intervention (p =
0.328, g = −0.29, −1.4%, −0.027 s), while a non-significant, trivial difference was observed for the CG
(p = 0.957, g = 0.01, +0.1%, +0.001 s) (Tables 3 and 4). These changes, however, were not greater than
the SDD for both groups. Although non-significant, mean (p = 0.374, g = −0.41) and percentage (p =
0.370, g = −0.41) improvements were slightly greater for the IG compared to CG, with a small effect
size.
3.1.6. CMAS Right
Large and significant main effects for time were found for right CMAS (p = 0.041, η2 = 0.224,
power = 0.551). In addition, a large, significant interaction effect of time and group for right CMAS
was also observed (p = 0.018, η2 = 0.287, power = 0.694), with the IG showing slightly lower post-
intervention right CMASs (p = 0.001, g = −0.26) compared to the CG. A moderate and significant
improvement in right CMAS was observed for the IG (p = 0.025, g = −0.85, −22.5%, −1.46 score)
following the intervention, whereas the CG demonstrated no significant and trivial changes in right
CMAS post-intervention (p = 0.779, g = 0.08, +5.6%, +0.12 score) (Tables 3 and 4, Figure 7). These
changes were greater than the SDD for the IG only. Although non-significant, mean (p = 0.122, g =
−1.16) and percentage changes (p = 0.089, g = −1.12) were greater for the IG compared to CG, with
moderate effect sizes (Figure 7).
Figure 7. Individual plots illustrating pre-to-post changes in right CMAS with the individual mean
and percentage changes; IG: Intervention group CG: Control group; CMAS: Cutting movement
assessment score. Black rectangle denotes mean.
3.1.7. CMAS Left
Large and significant main effects for time were found for left CMAS (p = 0.015, η2 = 0.302, power
= 0.725). In addition, a large and significant interaction effect of time and group for left CMAS was
also observed (p = 0.001, η2 = 0.499, power = 0.972), with the IG showing lower post-intervention left
CMASs (p = 0.318, g = −0.77) compared to the CG. A large, significant improvement in left CMAS was
observed for the IG (p = 0.018, g = −1.46, −33.9%, −2.21 score) following the intervention, whereas the
CG demonstrated no significant and small changes in left CMAS post-intervention (p = 0.306, g = 0.33,
+18.5%, +0.45 score) (Tables 3 and 4). These changes were greater than the SDD for the IG only.
Although non-significant, mean (p = 0.089, g = −1.83) and percentage changes (p = 0.137, g = −1.51)
were substantially greater for the IG compared to CG, with large effect sizes (Figure 8).
Figure 7. Individual plots illustrating pre-to-post changes in right CMAS with the individual mean andpercentage changes; IG: Intervention group CG: Control group; CMAS: Cutting movement assessmentscore. Black rectangle denotes mean.
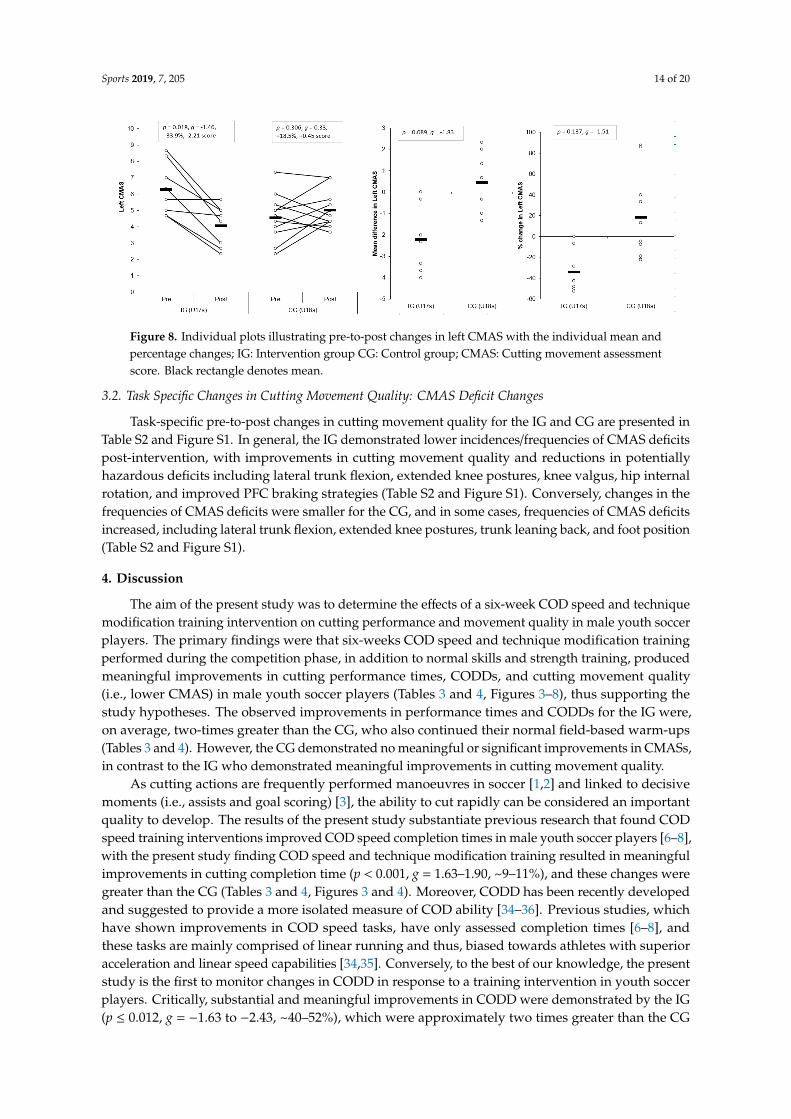
3.1.7. CMAS Left
Large and significant main effects for time were found for left CMAS (p = 0.015, η2 = 0.302,power = 0.725). In addition, a large and significant interaction effect of time and group for left CMASwas also observed (p = 0.001, η2 = 0.499, power = 0.972), with the IG showing lower post-interventionleft CMASs (p = 0.318, g = −0.77) compared to the CG. A large, significant improvement in left CMASwas observed for the IG (p = 0.018, g = −1.46, −33.9%, −2.21 score) following the intervention, whereasthe CG demonstrated no significant and small changes in left CMAS post-intervention (p = 0.306,g = 0.33, +18.5%, +0.45 score) (Tables 3 and 4). These changes were greater than the SDD for the IG only.Although non-significant, mean (p = 0.089, g = −1.83) and percentage changes (p = 0.137, g = −1.51)were substantially greater for the IG compared to CG, with large effect sizes (Figure 8).
Sports 2019, 7, 205 14 of 20Sports 2018, 6, x FOR PEER REVIEW 14 of 20
Figure 8. Individual plots illustrating pre-to-post changes in left CMAS with the individual mean and
percentage changes; IG: Intervention group CG: Control group; CMAS: Cutting movement
assessment score. Black rectangle denotes mean.
3.2. Task Specific Changes in Cutting Movement Quality: CMAS Deficit Changes
Task-specific pre-to-post changes in cutting movement quality for the IG and CG are presented
in Table S2 and Figure S1. In general, the IG demonstrated lower incidences/frequencies of CMAS
deficits post-intervention, with improvements in cutting movement quality and reductions in
potentially hazardous deficits including lateral trunk flexion, extended knee postures, knee valgus,
hip internal rotation, and improved PFC braking strategies (Table S2 and Figure S1). Conversely,
changes in the frequencies of CMAS deficits were smaller for the CG, and in some cases, frequencies
of CMAS deficits increased, including lateral trunk flexion, extended knee postures, trunk leaning
back, and foot position (Table S2 and Figure S1).
4. Discussion
The aim of the present study was to determine the effects of a six-week COD speed and
technique modification training intervention on cutting performance and movement quality in male
youth soccer players. The primary findings were that six-weeks COD speed and technique
modification training performed during the competition phase, in addition to normal skills and
strength training, produced meaningful improvements in cutting performance times, CODDs, and
cutting movement quality (i.e., lower CMAS) in male youth soccer players (Tables 3 and 4, Figures
3–8), thus supporting the study hypotheses. The observed improvements in performance times and
CODDs for the IG were, on average, two-times greater than the CG, who also continued their normal
field-based warm-ups (Tables 3 and 4). However, the CG demonstrated no meaningful or significant
improvements in CMASs, in contrast to the IG who demonstrated meaningful improvements in
cutting movement quality.
As cutting actions are frequently performed manoeuvres in soccer [1,2] and linked to decisive
moments (i.e., assists and goal scoring) [3], the ability to cut rapidly can be considered an important
quality to develop. The results of the present study substantiate previous research that found COD
speed training interventions improved COD speed completion times in male youth soccer players
[6–8], with the present study finding COD speed and technique modification training resulted in
meaningful improvements in cutting completion time (p < 0.001, g = 1.63–1.90, ~9–11%), and these
changes were greater than the CG (Tables 3 and 4, Figures 3 and 4). Moreover, CODD has been
recently developed and suggested to provide a more isolated measure of COD ability [34–36].
Previous studies, which have shown improvements in COD speed tasks, have only assessed
completion times [6–8], and these tasks are mainly comprised of linear running and thus, biased
towards athletes with superior acceleration and linear speed capabilities [34,35]. Conversely, to the
best of our knowledge, the present study is the first to monitor changes in CODD in response to a
training intervention in youth soccer players. Critically, substantial and meaningful improvements
Figure 8. Individual plots illustrating pre-to-post changes in left CMAS with the individual mean andpercentage changes; IG: Intervention group CG: Control group; CMAS: Cutting movement assessmentscore. Black rectangle denotes mean.
3.2. Task Specific Changes in Cutting Movement Quality: CMAS Deficit Changes
Task-specific pre-to-post changes in cutting movement quality for the IG and CG are presented inTable S2 and Figure S1. In general, the IG demonstrated lower incidences/frequencies of CMAS deficitspost-intervention, with improvements in cutting movement quality and reductions in potentiallyhazardous deficits including lateral trunk flexion, extended knee postures, knee valgus, hip internalrotation, and improved PFC braking strategies (Table S2 and Figure S1). Conversely, changes in thefrequencies of CMAS deficits were smaller for the CG, and in some cases, frequencies of CMAS deficitsincreased, including lateral trunk flexion, extended knee postures, trunk leaning back, and foot position(Table S2 and Figure S1).
4. Discussion
The aim of the present study was to determine the effects of a six-week COD speed and techniquemodification training intervention on cutting performance and movement quality in male youth soccerplayers. The primary findings were that six-weeks COD speed and technique modification trainingperformed during the competition phase, in addition to normal skills and strength training, producedmeaningful improvements in cutting performance times, CODDs, and cutting movement quality(i.e., lower CMAS) in male youth soccer players (Tables 3 and 4, Figures 3–8), thus supporting thestudy hypotheses. The observed improvements in performance times and CODDs for the IG were,on average, two-times greater than the CG, who also continued their normal field-based warm-ups(Tables 3 and 4). However, the CG demonstrated no meaningful or significant improvements in CMASs,in contrast to the IG who demonstrated meaningful improvements in cutting movement quality.
As cutting actions are frequently performed manoeuvres in soccer [1,2] and linked to decisivemoments (i.e., assists and goal scoring) [3], the ability to cut rapidly can be considered an importantquality to develop. The results of the present study substantiate previous research that found CODspeed training interventions improved COD speed completion times in male youth soccer players [6–8],with the present study finding COD speed and technique modification training resulted in meaningfulimprovements in cutting completion time (p < 0.001, g = 1.63–1.90, ~9–11%), and these changes weregreater than the CG (Tables 3 and 4, Figures 3 and 4). Moreover, CODD has been recently developedand suggested to provide a more isolated measure of COD ability [34–36]. Previous studies, whichhave shown improvements in COD speed tasks, have only assessed completion times [6–8], andthese tasks are mainly comprised of linear running and thus, biased towards athletes with superioracceleration and linear speed capabilities [34,35]. Conversely, to the best of our knowledge, the presentstudy is the first to monitor changes in CODD in response to a training intervention in youth soccerplayers. Critically, substantial and meaningful improvements in CODD were demonstrated by the IG(p ≤ 0.012, g = −1.63 to −2.43, ~40–52%), which were approximately two times greater than the CG
Sports 2019, 7, 205 15 of 20
(Tables 3 and 4, Figures 5 and 6). These findings highlight the effectiveness of field-based COD speedand technique modification training in youth soccer athletes, which can be achieved in-season withtwo, twenty-minute sessions per week. This form of training can be simply and easily integrated intothe warm-ups of field-based tactical/technical sessions in soccer, highlighting the applicability andfeasibility of COD speed and technique modification training.
Cutting is a key action associated with non-contact ACL injuries in soccer [10–12] due to thepropensity to generate large multi-planar joint loads that can strain and potentially rupture the ACL [16].COD technique modification training has been shown to be an effective modality for addressing“high-risk” postures (lateral trunk flexion, lateral foot plant distance, knee flexion angle, internal footrotation angles) and reducing potentially hazardous knee joint loading when assessed using 3D motionanalysis [13,25,26]. Although the present study used a qualitative screening tool (CMAS) to monitorchanges in cutting movement quality, the CMAS has been recently validated against the gold standardof 3D motion analysis [29,30] which presents as a more practical, less expensive screening tool toimplement in applied sporting environments. Nevertheless, the results of this study confirm that CODspeed and technique modification training (with feedback and externally directed verbal cues from acoach) resulted in meaningfully lower CMASs post-intervention, which were greater than the SDD(Tables 3 and 4, Figures 7 and 8) (p ≤ 0.025, g = −0.85 to 1.46, −23% to −34% vs. +6%–19%), while theCG remained unchanged.
Similar to Stroube et al. [53], which assessed task-specific changes in the tuck jump assessment (i.e.,changes in the frequencies of deficits demonstrated) following a neuromuscular training interventionwith task-specific feedback, the IG in the present study demonstrated improved cutting movementquality and reductions in frequencies in “high-risk” deficits including lateral trunk flexion, extendedknee postures, knee valgus, and improved PFC braking strategies (Table S2 and Figure S1). Thesefindings are noteworthy because the aforementioned “high-risk” postures are associated with increasedknee joint loading [14,22] which increases ACL [15,54] and PFP injury risk [55]. Furthermore, thesepostures are also characteristics of non-contact ACL injury [10,11,56]. As such, six-weeks COD speedtraining and technique modification with externally focused coaching cues and feedback from acoach is an effective training modality for reducing “high-risk” biomechanical and neuromuscularcontrol deficits, and overall, improving movement quality in male youth soccer players. It is worthnoting, however, that CMAS deficits are still demonstrated by youth soccer players (Table S2 andFigure S1) and thus, they should continue performing mitigation training interventions to addressthese deficits [20,28].
It has been suggested a “performance-injury trade-off” could exist when modifying the CODtechnique [14,24,27], whereby addressing “high-risk” postures could be detrimental to performance.While Dempsey et al. [13] reported reductions in knee joint loads due to changes in foot plantdistance and trunk position, the authors failed to consider the implications of such changes on cuttingperformance (i.e., completion time, ground contact time, and exit velocity). Jones et al. [25] foundchanges in pivoting technique resulted in lower KAMs and faster completion times in netball players.However, these studies have used 3D motion analysis to monitor changes in COD technique and moreimportantly, these studies have not contained a CG; therefore, the results should be interpreted withcaution. To the best of our knowledge, the present study is the first to consider the effect of CODspeed and technique modification training on both performance (completion times, COD deficit) andinjury-risk (CMAS) in comparison to a CG, using a field-based screening tool which was performed in areal-world setting. Notably, COD speed and technique modification training with feedback and externalverbal coaching cues was effective in improving cutting performance and improving cutting movementquality (Tables 3 and 4), and these were significantly and meaningfully greater than the CG and SDD(Figures 3–8). Collectively, these findings highlight that COD speed and technique modification inyouth soccer players is an effective training modality for enhancing performance and addressingmovement deficits associated with increased knee joint loading and potential injury-risk. This findingis noteworthy because, since the introduction of the EPPP, injury rates in youth-soccer have increased

Sports 2019, 7, 205 16 of 20
three-fold [31] and as such, reducing biomechanical and neuromuscular risk factors in youth-soccer isconsidered highly important, particularly as these players are striving for professional contracts.
The COD speed and training intervention focused on modifying biomechanical deficits associatedwith increased injury-risk [14,22,27] and promoting techniques required for faster performance [14,22–24].For example, the programme focused on several aspects: a wide foot-plant is required for medio-lateralpropulsive impulse generation and subsequent exit velocity during cutting [22,24]; faster performanceand lower knee joint loading has been associated with increased PFC braking forces [41]; and trunk leantowards the direction of travel and reduced lateral trunk flexion is associated with faster performanceand reduced knee joint loads [14,22,23]. Moreover, knee valgus is also a hazardous “high-risk”posture [56] with no associated performance benefits [14,23,24] and thus, was a further desiredtechnical change in response to the intervention. Consequently, the IG training programme consisted ofCOD drills and externally focused verbal coaching cues (“slam on the brakes early”, “push the groundaway” and “lean/face towards the direction of travel”) to promote safer mechanics [42], promote fasterperformance [43], and facilitate better retention [42]. These cues were used in order to evoke technicalchanges to encourage PFC braking and trunk lean towards the direction of travel, which are techniquesassociated with faster performance and reduced knee joint loads, while medio-lateral propulsiveimpulse was also emphasised to promote faster exit velocities. Interestingly, post-intervention, the IGdemonstrated lower CMASs (Table 3, Figures 7 and 8), which can be attributed to reduced incidencesof CMAS deficits, such as lateral trunk flexion, initial and excessive valgus, hip internal rotation, andlack of PFC braking (Table S2 and Figure S1), while a wide lateral foot plant remained unchanged.Although these were qualitative evaluations only, it is speculated that the IG demonstrated safercutting mechanics, and due to the strong relationship observed between CMAS and peak KAM [29],theoretically, the IG may demonstrate lower knee joint loading, which subsequently reduces non-contactACL [15,54,56] and PFP injury risk [17,55]. Further research is required to determine the effect of CODtechnique modification on knee joint loading and performance using 3D motion analysis to furthersubstantiate this claim.
Limitations
It should be noted that the present study only investigated a 70◦ side-step cutting task from ashort approach distance (5 m), and thus, is only reflective of low-entry velocity side-step cutting ability.As the biomechanical demands of COD are angle- and velocity-dependent [27,36], and other CODactions are also performed, such as crossover cuts, split-steps and pivots, further research is neededto determine the effects of COD speed and technique modification training on CODs from differentangles and approach distances, while also investigating different types of COD actions. Additionally,it is worth noting that male youth soccer players were only investigated, as such caution is advisedregarding the generalisation of these results to athletes from different athletic populations. Furtherinsight is required into the effects of COD speed and technique modification training in differentathletic populations where cutting is a highly prevalent action for performance and also, non-contactACL injury, such as rugby, American football, and handball. Moreover, it should be noted that therewere five dropouts for the IG (Figure 1) due to match-related injuries or illness. However, the presentstudy still achieved a priori sample size statistical power recommendation and dropouts reflect theenvironment of performing an in-season training intervention in a “real-world” professional soccersetting. Finally, while improved cutting movement quality was demonstrated following the CODspeed and technique modification training, it is unknown whether if and how long the improvedmotor skill performance can be maintained/ retained for, and is, therefore, a recommended area offuture research.
5. Conclusions
Six-weeks COD speed and technique modification training performed in-season (with the useof external verbal coaching cues and feedback), in addition to normal skills and strength training,

Sports 2019, 7, 205 17 of 20
resulted in significant and meaningful improvements in cutting completion time and CODDs in youthsoccer players. These changes in performance were approximately two-times greater than the CGand exceeded the SDD. Furthermore, COD speed and technique modification training resulted inlower CMASs and improved cutting movement quality, while the CG demonstrated no meaningfulor significant changes in CMAS. The improvements in cutting movement quality observed for theIG were attributed to technical improvements (reductions in deficits), such as lateral trunk flexion,knee valgus, PFC braking, and internal hip rotation and overall cutting movement quality. Thesefindings indicate that improvements in cutting performance and movement quality can be achievedin-season, in a real-world sporting environment. As such, practitioners working with male youth soccerplayers should consider implementing two, twenty-minute COD speed and technique modificationtraining sessions a week, in addition to normal skills and strength training, for improvements in cuttingmovement quality and performance.
Supplementary Materials: The following are available online at http://www.mdpi.com/2075-4663/7/9/205/s1,Table S1: 6-week COD speed and technique modification training programme, Table S2: Task-specific pre-to-postchanges in cutting movement quality (CMAS items); Figure S1. Cutting task-specific changes in CMAS deficits.IG: Intervention group; CG: Control group; CMAS: Cutting movement assessment score.
Author Contributions: T.D., A.M., P.C., and P.A.J. conceived and designed the experiments; T.D., and A.M.performed the experiments; T.D. and A.M. analysed the data; T.D., A.M., P.C., and P.A.J. wrote the paper.
Funding: This research received no external funding.
Acknowledgments: The authors sincerely thank the athletes who participated in this study and the coachingStaff at Salford City FC who made this project possible. There is no conflict of interest. There are no professionalrelationships with companies or manufacturers who will benefit from the results of the present study foreach author.
Conflicts of Interest: The authors declare no conflict of interest.
References
1. Bloomfield, J.; Polman, R.; Donoghue, P. Physical demands of different positions in fa premier league soccer.J. Sport Sci. Med. 2007, 6, 63–70.
2. Robinson, G.; O’Donoghue, P.; Nielson, P. Path changes and injury risk in english fa premier league soccer.Int. J. Perform. Anal. Sport 2011, 11, 40–56. [CrossRef]
3. Faude, O.; Koch, T.; Meyer, T. Straight sprinting is the most frequent action in goal situations in professionalfootball. J. Sports Sci. 2012, 30, 625–631. [CrossRef]
4. Jones, P.; Bampouras, T.M.; Marrin, K. An investigation into the physical determinants of change of directionspeed. J. Sports Med. Phys. Fit. 2009, 49, 97–104.
5. Nimphius, S. Training change of direction and agility. In Advanced Strength and Conditioning; Turner, A.,Comfort, P., Eds.; Routledge: Abdingdon, UK, 2018; pp. 291–308.
6. Chaouachi, A.; Chtara, M.; Hammami, R.; Chtara, H.; Turki, O.; Castagna, C. Multidirectional sprints andsmall-sided games training effect on agility and change of direction abilities in youth soccer. J. Strength Cond.Res. 2014, 28, 3121–3127. [CrossRef]
7. Chaalali, A.; Rouissi, M.; Chtara, M.; Owen, A.; Bragazzi, N.; Moalla, W.; Chaouachi, A.; Amri, M.; Chamari, K.Agility training in young elite soccer players: Promising results compared to change of direction drills. Biol.Sport 2016, 33, 345. [CrossRef]
8. Chtara, M.; Rouissi, M.; Haddad, M.; Chtara, H.; Chaalali, A.; Owen, A.; Chamari, K. Specific physicaltrainability in elite young soccer players: Efficiency over 6 weeks’ in-season training. Biol. Sport 2017, 34,137–148. [CrossRef]
9. Garcia-Ramos, A.; Haff, G.G.; Feriche, B.N.; Jaric, S. Effects of different conditioning programmes on theperformance of high-velocity soccer-related tasks: Systematic review and meta-analysis of controlled trials.Int. J. Sports Sci. Coach. 2017, 13, 129–151. [CrossRef]

Sports 2019, 7, 205 18 of 20
10. Grassi, A.; Smiley, S.P.; Roberti di Sarsina, T.; Signorelli, C.; Marcheggiani Muccioli, G.M.; Bondi, A.;Romagnoli, M.; Agostini, A.; Zaffagnini, S. Mechanisms and situations of anterior cruciate ligament injuriesin professional male soccer players: A youtube-based video analysis. Eur. J. Orthop. Surg. Traumatol. 2017,27, 697–981. [CrossRef]
11. Walden, M.; Krosshaug, T.; Bjorneboe, J.; Andersen, T.E.; Faul, O.; Hagglund, M. Three distinct mechanismspredominate in non-contact anterior cruciate ligament injuries in male professional football players: Asystematic video analysis of 39 cases. Br. J. Sports Med. 2015, 49, 1452–1460. [CrossRef]
12. Brophy, R.H.; Stepan, J.G.; Silvers, H.J.; Mandelbaum, B.R. Defending puts the anterior cruciate ligament atrisk during soccer: A gender-based analysis. Sports Health 2015, 7, 244–249. [CrossRef]
13. Dempsey, A.R.; Lloyd, D.G.; Elliott, B.C.; Steele, J.R.; Munro, B.J. Changing sidestep cutting technique reducesknee valgus loading. Am. J. Sport Med. 2009, 37, 2194–2200. [CrossRef]
14. Fox, A. Change-of-direction biomechanics: Is what’s best for anterior cruciate ligament injury preventionalso best for performance? Sports Med. 2018, 48, 1799–1807. [CrossRef]
15. Markolf, K.L.; Burchfield, D.M.; Shapiro, M.M.; Shepard, M.F.; Finerman, G.A.M.; Slauterbeck, J.L. Combinedknee loading states that generate high anterior cruciate ligament forces. J. Orthop. Res. 1995, 13, 930–935.[CrossRef]
16. Lloyd, D.G. Rationale for training programs to reduce anterior cruciate ligament injuries in australian football.J. Orthop. Sport Phys. 2001, 31, 645–654. [CrossRef]
17. Myer, G.D.; Ford, K.R.; Di Stasi, S.L.; Foss, K.D.B.; Micheli, L.J.; Hewett, T.E. High knee abduction momentsare common risk factors for patellofemoral pain (pfp) and anterior cruciate ligament (acl) injury in girls: Ispfp itself a predictor for subsequent acl injury? Br. J. Sports Med. 2015, 49, 118–122. [CrossRef]
18. O’Kane, J.W.; Neradilek, M.; Polissar, N.; Sabado, L.; Tencer, A.; Schiff, M.A. Risk factors for lower extremityoveruse injuries in female youth soccer players. Orthop. J. Sports Med. 2017, 5, 2325967117733963. [CrossRef]
19. Waldén, M.; Hägglund, M.; Magnusson, H.; Ekstrand, J. Acl injuries in men’s professional football: A 15-yearprospective study on time trends and return-to-play rates reveals only 65% of players still play at the toplevel 3 years after acl rupture. Br. J. Sports Med. 2016, 50, 744–750. [CrossRef]
20. Hewett, T. Preventive biomechanics: A paradigm shift with a translational approach to biomechanics. Am. J.Sports Med. 2017, 45, 2654–2664. [CrossRef]
21. Padua, D.A.; DiStefano, L.J.; Hewett, T.E.; Garrett, W.E.; Marshall, S.W.; Golden, G.M.; Shultz, S.J.;Sigward, S.M. National athletic trainers’ association position statement: Prevention of anterior cruciateligament injury. J. Athl. Train. 2018, 53, 5–19. [CrossRef]
22. Dos’Santos, T.; McBurnie, A.; Thomas, C.; Comfort, P.; Jones, P. Biomechanical comparison of cuttingtechniques: A review and practical applications. Strength Cond. J. 2019, 41, 40–54. [CrossRef]
23. Marshall, B.M.; Franklyn-Miller, A.D.; King, E.A.; Moran, K.A.; Strike, S.; Falvey, A. Biomechanical factorsassociated with time to complete a change of direction cutting maneuver. J. Strength Cond. Res. 2014, 28,2845–2851. [CrossRef]
24. Havens, K.; Sigward, S.M. Cutting mechanics: Relation to performance and anterior cruciate ligament injuryrisk. Med. Sci. Sports Exerc. 2015, 47, 818–824. [CrossRef]
25. Jones, P.A.; Barber, O.R.; Smith, L.C. Changing Pivoting Technique Reduces Knee Valgus Moments. FreeCommunication. J. Sports Sci. 2015, 33, S62.
26. Celebrini, R.G.; Eng, J.J.; Miller, W.C.; Ekegren, C.L.; Johnston, J.D.; MacIntyre, D.L. The effect of a novelmovement strategy in decreasing acl risk factors in female adolescent soccer players. J. Strength Cond. Res.2012, 26, 3406–3417. [CrossRef]
27. Dos’Santos, T.; Thomas, C.; Comfort, P.; Jones, P.A. The effect of angle and velocity on change of directionbiomechanics: An angle-velocity trade-off. Sports Med. 2018, 48, 2235–2253. [CrossRef]
28. Read, P.J.; Oliver, J.L.; Croix, M.B.D.S.; Myer, G.D.; Lloyd, R.S. Neuromuscular risk factors for knee and ankleligament injuries in male youth soccer players. Sports Med. 2016, 46, 1059–1066. [CrossRef]
29. Jones, P.A.; Donelon, T.; Dos’ Santos, T. A preliminary investigation into a qualitative assessment tool toidentify athletes with high knee abduction moments during cutting: Cutting movement assessment score(cmas). Prof. Strength Cond. 2017, 47, 37–42.
Sports 2019, 7, 205 19 of 20
30. Dos’Santos, T.; McBurnie, A.; Donelon, T.; Thomas, C.; Comfort, P.; Jones, P.A. A qualitative screening tool toidentify athletes with “high-risk” movement mechanics during cutting: The cutting movement assessmentscore (cmas). Phys. Sport 2019, 38, 152–161. [CrossRef]
31. Read, P.J.; Oliver, J.L.; De Ste Croix, M.B.; Myer, G.D.; Lloyd, R.S. An audit of injuries in six englishprofessional soccer academies. J. Sports Sci. 2018, 36, 1542–1548. [CrossRef]
32. Faul, F.; Erdfelder, E.; Buchner, A.; Lang, A.-G. Statistical power analyses using g* power 3.1: Tests forcorrelation and regression analyses. Behav. Res. Methods 2009, 41, 1149–1160. [CrossRef]
33. Beck, T.W. The importance of a priori sample size estimation in strength and conditioning research. J. StrengthCond. Res. 2013, 27, 2323–2337. [CrossRef]
34. Nimphius, S.; Callaghan, S.J.; Sptieri, T.; Lockie, R.G. Change of direction deficit: A more isolated measure ofchange of direction performance than total 505 time. J. Strength Cond. Res. 2016, 30, 3024–3032. [CrossRef]
35. Nimphius, S.; Geib, G.; Spiteri, T.; Carlisle, D. “Change of direction deficit” measurement in division iamerican football players. J. Aust. Strength Cond. 2013, 21, 115–117.
36. Nimphius, S.; Callaghan, S.J.; Bezodis, N.E.; Lockie, R.G. Change of direction and agility tests: Challengingour current measures of performance. Strength Cond. J. 2017, 40, 26–38. [CrossRef]
37. Onate, J.; Cortes, N.; Welch, C.; Van Lunen, B. Expert versus novice interrater reliability and criterion validityof the landing error scoring system. J. Sport Rehabil. 2010, 19, 41–56. [CrossRef]
38. Fort-Vanmeerhaeghe, A.; Montalvo, A.M.; Lloyd, R.S.; Read, P.; Myer, G.D. Intra-and inter-rater reliability ofthe modified tuck jump assessment. J. Sport Sci. Med. 2017, 16, 117–124.
39. DeWeese, B.H.; Nimphius, S. Program design technique for speed and agility training. In Essentials ofStrength Training and Conditioning; Haff, G.G., Triplett, N.T., Eds.; Human Kinetics: Champaign, IL, USA,2016; pp. 521–558.
40. Haff, G.G.; Triplett, N.T. Essentials of Strength Training and Conditioning, 4th ed.; Human Kinetics: Champaign,IL, USA, 2015.
41. Dos’Santos, T.; Thomas, C.; Comfort, P.; Jones, P. The role of the penultimate foot contact during change ofdirection: Implications on performance and risk of injury. Strength Cond. J. 2018. [CrossRef]
42. Welling, W.; Benjaminse, A.; Gokeler, A.; Otten, B. Enhanced retention of drop vertical jump landingtechnique: A randomized controlled trial. Hum. Mov. Sci. 2016, 45, 84–95. [CrossRef]
43. Porter, J.; Nolan, R.; Ostrowski, E.; Wulf, G. Directing attention externally enhances agility performance: Aqualitative and quantitative analysis of the efficacy of using verbal instructions to focus attention. Front.Psychol. 2010, 1, 216. [CrossRef]
44. Thomas, J.R.; Nelson, J.K.; Silverman, S.J. Research Methods in Physical Activity; Human Kinetics: Champaign,IL, USA, 2005.
45. Kropmans, T.J.B.; Dijkstra, P.U.; Stegenga, B.; Stewart, R.; De Bont, L.G.M. Smallest detectable differencein outcome variables related to painful restriction of the temporomandibular joint. J. Dent. Res. 1999, 78,784–789. [CrossRef]
46. Koo, T.K.; Li, M.Y. A guideline of selecting and reporting intraclass correlation coefficients for reliabilityresearch. J. Chiropr. Med. 2016, 15, 155–163. [CrossRef]
47. Baumgartner, T.A.; Chung, H. Confidence limits for intraclass reliability coefficients. Meas. Phys. Educ. Exerc.Sci. 2001, 5, 179–188. [CrossRef]
48. Viera, A.J.; Garrett, J.M. Understanding interobserver agreement: The kappa statistic. Fam. Med. 2005, 37,360–363.
49. Landis, J.R.; Koch, G.G. The measurement of observer agreement for categorical data. Biometrics 1977, 33,159–174. [CrossRef]
50. Cohen, J. Statistical Analysis for the Behavioral Sciences; Lawrance Erlbaum: Hillsdale, MI, USA, 1988.51. Hedges, L.; Olkin, I. Statistical Methods for Meta-Analysis; Acdemic Press: New York, NY, USA, 1985.52. Hopkins, W.G. A scale of magnitudes for effect statistics. New View Stat. 2002, 502, 411. Available online:
http://sportsci.org/resource/stats/effectmag.html (accessed on 15 June 2019).53. Stroube, B.W.; Myer, G.D.; Brent, J.L.; Ford, K.R.; Heidt, R.S., Jr.; Hewett, T.E. Effects of task-specific augmented
feedback on deficit modification during performance of the tuck-jump exercise. J. Sport Rehabil. 2013, 22,7–18. [CrossRef]

Sports 2019, 7, 205 20 of 20
54. Withrow, T.J.; Huston, L.J.; Wojtys, E.M.; Ashton-Miller, J.A. The effect of an impulsive knee valgus momenton in vitro relative acl strain during a simulated jump landing. Clin. Biomech. 2006, 21, 977–983. [CrossRef]
55. Waiteman, M.C.; Briani, R.V.; Pazzinatto, M.F.; Ferreira, A.S.; Ferrari, D.; de Oliveira Silva, D.; de Azevedo, F.M.Relationship between knee abduction moment with patellofemoral joint reaction force, stress and self-reportedpain during stair descent in women with patellofemoral pain. Clin. Biomech. 2018, 59, 110–116. [CrossRef]
56. Koga, H.; Nakamae, A.; Shima, Y.; Iwasa, J.; Myklebust, G.; Engebretsen, L.; Bahr, R.; Krosshaug, T.Mechanisms for noncontact anterior cruciate ligament injuries knee joint kinematics in 10 injury situationsfrom female team handball and basketball. Am. J. Sport Med. 2010, 38, 2218–2225. [CrossRef]
© 2019 by the authors. Licensee MDPI, Basel, Switzerland. This article is an open accessarticle distributed under the terms and conditions of the Creative Commons Attribution(CC BY) license (http://creativecommons.org/licenses/by/4.0/).