third quarter 2017 earnings | october 25,...
TRANSCRIPT

Third Quarter 2017 Earnings | October 25, 2017

Earnings Presentation | Third Quarter 2017
Forward-Looking Statements
Certain statements in these slides and made during this presentation may be considered forward-looking statements. These
statements reflect management’s current views and are subject to risks and uncertainties that could cause actual results to
differ materially from those expressed or implied in these statements. Factors which could cause actual results to differ include
but are not limited to: (i) the level of our indebtedness and changes in interest rates; (ii) industry conditions, including but not
limited to changes in the cost or availability of raw materials, energy and transportation costs, competition we face, cyclicality
and changes in consumer preferences, demand and pricing for our products; (iii) global economic conditions and political
changes, including but not limited to the impairment of financial institutions, changes in currency exchange rates, credit ratings
issued by recognized credit rating organizations, the amount of our future pension funding obligation, changes in tax laws and
pension and health care costs; (iv) unanticipated expenditures related to the cost of compliance with existing and new
environmental and other governmental regulations and to actual or potential litigation; (v) whether we experience a material
disruption at one of our manufacturing facilities; (vi) risks inherent in conducting business through joint ventures; (vii) the failure
to realize the expected synergies and cost-savings from our purchase of the pulp business of Weyerhaeuser Company or
delay in realization thereof; (viii) purchase price adjustments relating to our pending transaction to transfer our North American
consumer packaging business to Graphic Packaging Holding Company in exchange for, among other things, an equity interest
in an entity that will hold the assets for the combined business; (ix) receipt of regulatory approvals for the Graphic Packing
transaction and the successful fulfillment or waiver of all other closing conditions without unexpected delays or conditions;
(x) the successful closing of the Graphic Packing transaction within the estimated timeframe; (xi) the uncertainty of the
expected financial performance of the combined business following completion of the Graphic Packaging transaction; (xii) the
failure of the combined business to realize the expected synergies, cost-savings and other benefits from the Graphic
Packaging transaction or delay in realization thereof; (xiii) the successful financing of the Graphic Packaging transaction;
(ix) unforeseen tax treatment relating to the Graphic Packaging transaction, (xv) litigation related to the Graphic Packaging
transaction or limitations or restrictions imposed by regulatory authorities that may delay or negatively impact the Graphic
Packaging transaction; and (xvi) our ability to achieve the benefits we expect from all other strategic acquisitions, divestitures
and restructurings. These and other factors that could cause or contribute to actual results differing materially from such
forward- looking statements are discussed in greater detail in the Company’s Securities and Exchange Commission filings. We
undertake no obligation to publicly update any forward-looking statements, whether as a result of new information, future
events or otherwise.
2

Earnings Presentation | Third Quarter 2017
Statements Relating to Non-GAAP Financial Measures
During the course of this presentation, certain non U.S. GAAP financial measures
will be presented, such as Adjusted Operating EPS, Adjusted EBIT, Adjusted
EBITDA, Adjusted EBITDA Margin, Free Cash Flow and Adjusted ROIC.
A reconciliation of all presented non-GAAP measures (and their components) to
U.S. GAAP financial measures is available on the company’s website at
internationalpaper.com under Performance/Investors.
3

Earnings Presentation | Third Quarter 2017
Ilim JV Information
All financial information and statistical measures regarding our 50/50 Ilim joint
venture in Russia (“Ilim”), other than historical International Paper Equity Earnings
and dividends received by International Paper, have been prepared by the
management of Ilim. Any projected financial information and statistical measures
reflect the current views of Ilim management and are subject to risks and
uncertainties that could cause actual results to differ materially from those
expressed or implied by such projections. See “Forward-Looking Statements.”
4

Earnings Presentation | Third Quarter 2017
Third Quarter 2017 Results
1 Adjusted operating EPS based on Adjusted Operating Earnings (defined as Net Earnings (GAAP) from continuing operations before special items and non-operating
pension expense)
5
Continued solid global demand in Industrial
Packaging and Global Cellulose Fibers
1H price increases realized across
key businesses
Achieving more synergies faster in
Global Cellulose Fibers
Operations impacted by hurricanes
Record high OCC prices
Strong Ilim operational results; equity
earnings of $48MM
Increased dividend to $1.90/share
$0.91
$0.65
$1.08
3Q16 2Q17 3Q17
Adj. Operating EPS1

Earnings Presentation | Third Quarter 2017
International Paper | Value Creating Strategy and Portfolio
6
• Fiber-based Packaging, Pulp and Paper
• Advantaged positions in Attractive markets
Strategy
Focused Portfolio - Revenue1
Industrial Packaging2
Global Cellulose Fibers Printing Papers
1 3Q17 YTD excluding N.A. Consumer Packaging 2 Includes EMEA Coated Paperboard Packaging
70%
11% 19%

Earnings Presentation | Third Quarter 20177
Leading consumer packaging company
Broad product offering with complete fiber
substrate base
Innovative leader in consumer packaging and
foodservice
Long-standing relationships with leading consumer
packaged goods and food service partners
Significant free cash flow to reinvest to improve
returns and increase integration
Best-in-class management team to drive
growth and value creation
Graphic Packaging Post TransactionCompelling Investment
Maintains exposure and optionality in strategic fiber-
based consumer packaging space
Vehicle for meaningful value creation and growth
Excellent value for IP shareholders
Strong financial profile for the newly combined entity
Significant integration and cost synergies
Generates cash for debt reduction – leverage neutral
Highly efficient tax structure
Ongoing cash dividends to IP
EPS neutral to slightly accretive
IP is investing in a premier consumer
packaging platform, well positioned for
long-term shareholder value creation
Consumer Packaging Foodservice
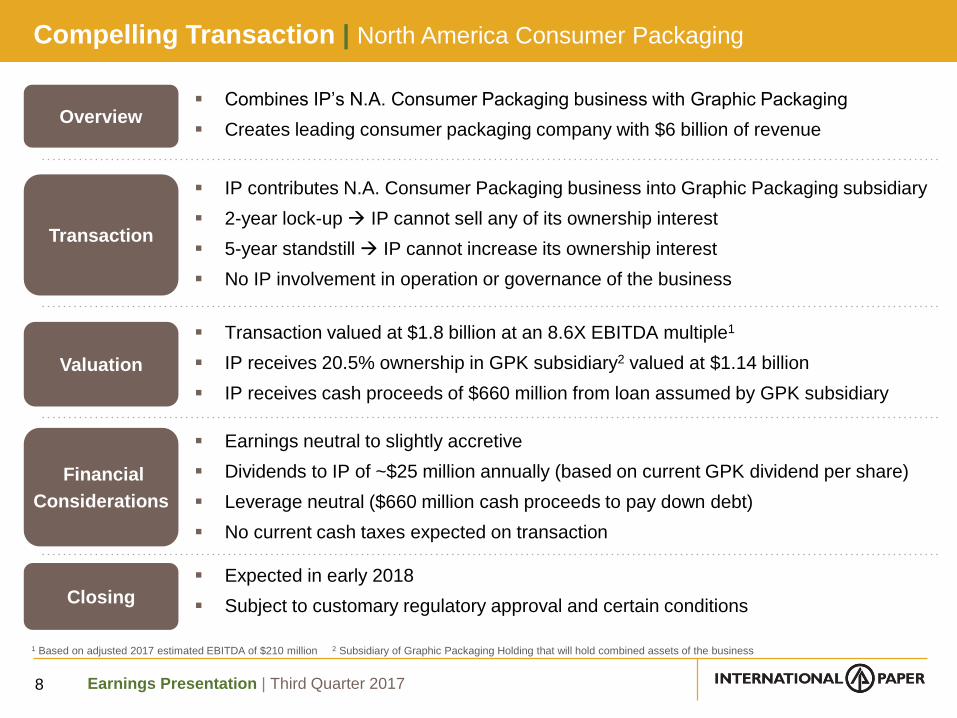
Investment Thesis | North America Consumer Packaging
Earnings Presentation | Third Quarter 2017
Combines IP’s N.A. Consumer Packaging business with Graphic Packaging
Creates leading consumer packaging company with $6 billion of revenue
IP contributes N.A. Consumer Packaging business into Graphic Packaging subsidiary
2-year lock-up IP cannot sell any of its ownership interest
5-year standstill IP cannot increase its ownership interest
No IP involvement in operation or governance of the business
Transaction valued at $1.8 billion at an 8.6X EBITDA multiple1
IP receives 20.5% ownership in GPK subsidiary2 valued at $1.14 billion
IP receives cash proceeds of $660 million from loan assumed by GPK subsidiary
Earnings neutral to slightly accretive
Dividends to IP of ~$25 million annually (based on current GPK dividend per share)
Leverage neutral ($660 million cash proceeds to pay down debt)
No current cash taxes expected on transaction
Expected in early 2018
Subject to customary regulatory approval and certain conditions
Overview
Transaction
Financial
Considerations
Valuation
Closing
1 Based on adjusted 2017 estimated EBITDA of $210 million 2 Subsidiary of Graphic Packaging Holding that will hold combined assets of the business
Compelling Transaction | North America Consumer Packaging
8

Earnings Presentation | Third Quarter 2017
3Q17 Financial Results
3Q16 2Q17 3Q17
Sales ($B) $5.3 $5.8 $5.9
Adj. EBIT1 ($MM) $613 $499 $711
Adj. Operating EPS2 $0.91 $0.65 $1.08
Operating EPS impact of Ilim F/X3 – IP Share
$0.01 ($0.04) $0.02
Adj. EBITDA1 ($MM) $927 $856 $1,074
Adj. EBITDA Margin1 17.6% 14.8% 18.2%
Free Cash Flow4 ($MM) $575 $355 $624
1 From continuing operations before special items and non-operating pension expense2 Adjusted operating EPS based on Adjusted Operating Earnings (defined as Net Earnings (GAAP) from continuing operations before special items and non-operating
pension expense)3 Represents F/X impact including that related to Ilim JV USD-denominated net debt (balance of ~$0.8B at end of 3Q17)4 See slide #22 for a reconciliation of cash provided by operations to free cash flow
9
927 856
1,074
3Q16 2Q17 3Q17
Adj. EBITDA1
($MM)

Earnings Presentation | Third Quarter 2017
.65
1.08
(.03)(.03)
(.04)(.02)
.19
.30 .06
2Q17 Price / Mix Volume Operations& Costs
MaintenanceOutages
Input Costs Corporate/Other
Ilim JV 3Q17
3Q17 vs. 2Q17 Adj. Operating EPS
10
Adjusted operating EPS based on Adjusted Operating Earnings (defined as Net Earnings (GAAP) from continuing operations before special items and non-operating
pension expense)

Earnings Presentation | Third Quarter 2017
407
484(14)(29)
(21)79
62
2Q17 Price / Mix Volume Operations& Costs
MaintenanceOutages
Input Costs 3Q17
Industrial Packaging | 3Q17 vs. 2Q17 Adj. EBIT1
11
$ M
illio
n
1 Segment adjusted operating profit before special items

Earnings Presentation | Third Quarter 2017
Riverdale Mill Conversion | Investment Overview
Strategic Rationale:
Supports growth in our strategic markets
Enhances world-class mill system and significantly improves our whitetop linerboard cost
Improves system flexibility
Improves our whitetop linerboard product offering
Investment: $300MM to convert No. 15 paper machine from uncoated freesheet to high quality whitetop virgin containerboard; will add 450k tons of capacity
Timing: Targeting to complete conversion mid-2019
12
N.A. Containerboard Mill System

Earnings Presentation | Third Quarter 2017
Global Cellulose Fibers | 3Q17 vs. 2Q17 Adj. EBIT1
13
1 Segment adjusted operating profit before special items
12
57
(1) (7)15
37 1
2Q17 Price / Mix Volume Operations &Costs
MaintenanceOutages
Input Costs 3Q17
$ M
illio
n
Earnings Presentation | Third Quarter 2017
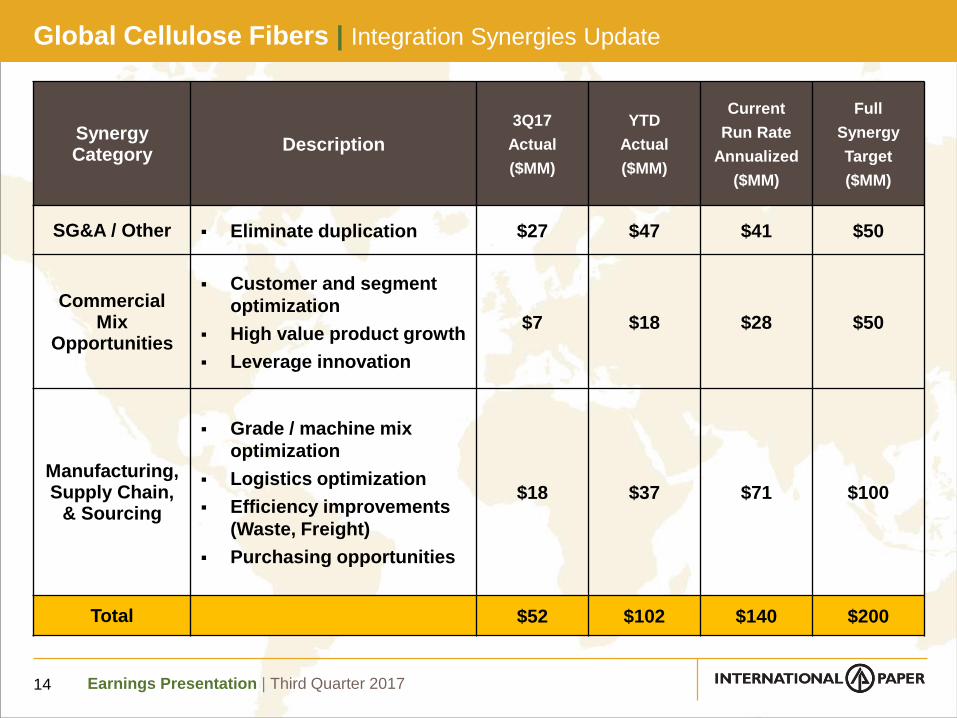
Global Cellulose Fibers | Integration Synergies Update
14
Synergy Category
Description
3Q17
Actual
($MM)
YTD
Actual
($MM)
Current
Run Rate
Annualized
($MM)
Full
Synergy
Target
($MM)
SG&A / Other Eliminate duplication $27 $47 $41 $50
Commercial Mix
Opportunities
Customer and segment
optimization
High value product growth
Leverage innovation
$7 $18 $28 $50
Manufacturing, Supply Chain,
& Sourcing
Grade / machine mix
optimization
Logistics optimization
Efficiency improvements
(Waste, Freight)
Purchasing opportunities
$18 $37 $71 $100
Total $52 $102 $140 $200

Earnings Presentation | Third Quarter 2017
88
135
(3)
(4)
10 2
42
2Q17 Price / Mix Volume Operations& Costs
MaintenanceOutages
Input Costs 3Q17
Printing Papers | 3Q17 vs. 2Q17 Adj. EBIT1
15
$ M
illio
n
1 Segment adjusted operating profit before special items

Earnings Presentation | Third Quarter 2017
(5)
54
4
3
16
35 1
2Q17 Price / Mix Volume Operations& Costs
MaintenanceOutages
Input Costs 3Q17
Consumer Packaging | 3Q17 vs. 2Q17 Adj. EBIT1
16
$ M
illio
n
1 Segment adjusted operating profit before special items

Earnings Presentation | Third Quarter 2017
Ilim Joint Venture | 3Q17 vs. 2Q17
$ Million$ 3Q16 2Q17 3Q17
Sales Volume (thousand metric tonnes)
770 817 772
Sales $473 $546 $523
EBITDA $172 $121 $184
F/X (Impact of USD Net Debt)1 $6 ($46) $18
Adj. Operational EBITDA2 $166 $167 $166
IP Equity Earnings (Loss)3 $46 $21 $48
Higher pricing offset by lower sales volumes from Bratsk outage
F/X gain (non-cash) on USD denominated net debt driven by ruble strengthening
4Q17 equity earnings projected to be $55MM-$60MM4 on strong, demand-driven
market fundamentals
17
Ilim JV results are on U.S. GAAP basis 1 Represents F/X impact including amounts related to Ilim JV USD-denominated net debt (balance of ~$0.8B at end of 3Q17); Ilim Group’s functional currency is the
Ruble (RUB); Non-functional-denominated currency balances are measured monthly using the month-end exchange rate2 Before F/X impact including USD-denominated net debt3 IP Equity Earnings (Loss) for 3Q16, 2Q17 and 3Q17 include after-tax F/X gains (losses) (primarily on USD-denominated net debt) of $3MM, $(18)MM and $7MM, respectively4 At September 30, 2017 RUB/USD exchange rate

Earnings Presentation | Third Quarter 2017
North America EMEA & Russia Brazil
Price / Mix
Packaging Realization Stable Stable
Cellulose Fibers Improving
Paper Stable Stable Seasonality
Volume
Packaging 1 Less Day Seasonality Stable
Cellulose Fibers Improved Seasonality
Paper Stable Stable Seasonality
Operations & Other
Packaging Non-Repeats Stable Stable
Cellulose Fibers Non-Repeat with Offsets
Paper Stable Stable Stable
Mill Maintenance Outages
Packaging Decrease $4MM Stable Stable
Cellulose Fibers Increase $5MM
Papers Increase $11MM Stable Stable
Inputs & FreightPackaging Lower OCC with Offsets Stable Stable
Cellulose Fibers Higher Wood
Printing Papers Stable Higher Wood & Energy Higher Fiber
Other Items
Corporate expense, ~$15MM-$20MM in 4Q17
Interest expense, in line with full-year outlook of ~$575MM-$600MM
Tax rate, ~33% in 4Q17
Ilim JV, forecasting Equity Earnings of ~$55MM-$60MM1
Fourth Quarter Outlook | Changes from 3Q17
18
1 At Sept. 30, 2017 RUB/USD exchange rate

Earnings Presentation | Third Quarter 2017
Capital Allocation | Competitive and Sustainable Dividend
19
$0
$100
$200
$300
$400
$500
$600
$700
$800
$900
$0.00
$0.20
$0.40
$0.60
$0.80
$1.00
$1.20
$1.40
$1.60
$1.80
$2.00
Dividends Paid Dividend / Share
Q317 Increase the Sixth Consecutive since Restoration Post Great Recession
Competitive: Payout ratio and yield
in line with market and peers
Sustainable: Pressure tested to
60% - 80% of U.S. trough FCF
Target: 40% - 50% of FCF
Incremental: Increase as financial
performance improves
Periodic: Annual review
PRINCIPLES HISTORYMM

Earnings Presentation | Third Quarter 2017
Positioned for strong 4Q results
Healthy demand outlook in Industrial Packaging and Global Cellulose Fibers
Flow through of 1H price increases and continued momentum
Global Cellulose Fibers synergies
Lower overall input costs
Seasonally light maintenance schedule
Anticipate strong operational results at Ilim
Remain confident in full year view of 10%+ YoY EBITDA growth
Full Year Outlook | Solid Second Half with Continued Momentum
20

Earnings Presentation | Third Quarter 2017
AppendixInvestor Relations Contacts
Guillermo Gutierrez 901-419-1731
Michele Vargas 901-419-7287
Media Contact
Tom Ryan 901-419-4333
21

Earnings Presentation | Third Quarter 2017
$ Million 3Q16 2Q17 3Q17
Cash Provided by Operations $341 $645 ($709)
Cash Invested in Capital Projects ($266) ($290) ($271)
Cash Contribution to Pension Plan $500 - $1,250
Kleen Products Settlement - - $354
Free Cash Flow $575 $355 $624
Free Cash Flow
22

Earnings Presentation | Third Quarter 2017
Maintenance Outages Expenses | 2017 Forecast
23
$ Million 1Q17A 2Q17A 3Q17A 4Q17F 2017F
Industrial Packaging $71 $100 $38 $30 $239
North America 69 100 38 30 237
Brazil 2 0 0 0 2
Global Cellulose Fibers $50 $44 $7 $12 $113
Printing Papers $23 $43 $1 $11 $78
North America 23 34 0 11 68
Europe 0 6 0 0 6
Brazil 0 3 0 0 3
India 0 0 1 0 1
Consumer Packaging $0 $35 $0 $4 $39
North America 0 33 0 4 37
Europe 0 2 0 0 2
Total Impact $144 $222 $46 $57 $469
Earnings Presentation | Third Quarter 2017
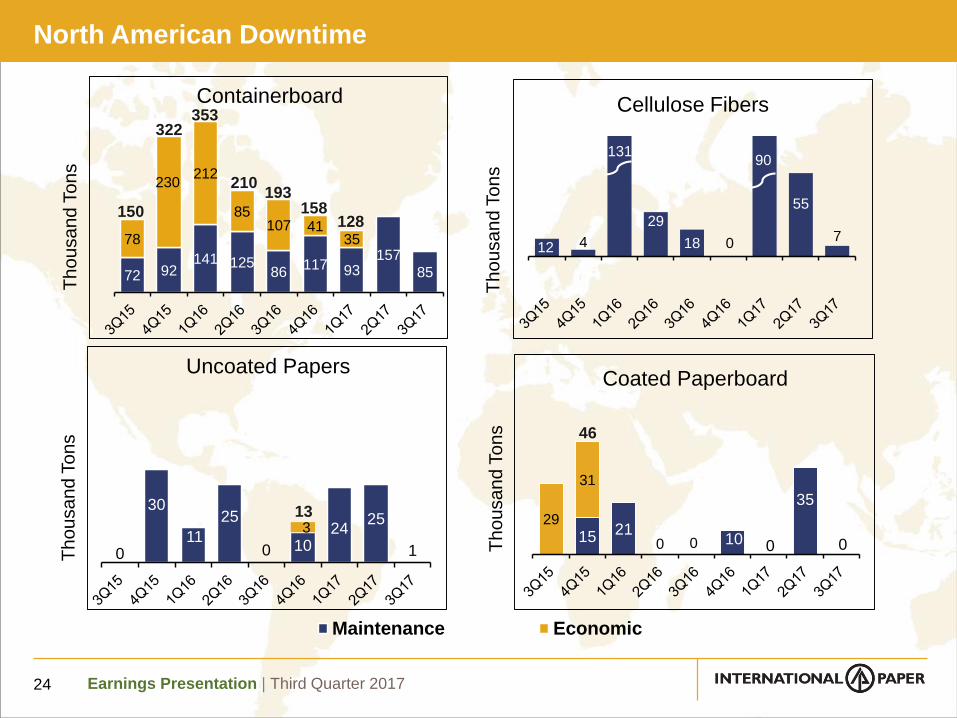
North American Downtime
24
72 92141 125
86117 93
157
85
78
212
85107 41
35
Maintenance Economic
15 21 2110 0
35
0
29
31
0 00
30
11
25
0 1024
25
1
3
12 4
29
18 0
55
7
13190
Containerboard
Uncoated Papers
Cellulose Fibers
Th
ou
sa
nd
To
ns
Thousand T
ons
Th
ou
sa
nd
To
ns
150
Coated Paperboard
322
46
353
210193
158
13
230
128
Th
ou
sa
nd
To
ns

Earnings Presentation | Third Quarter 2017
Special Items Pre-Tax ($ Million) 3Q16 2Q17 3Q17
Industrial Packaging
Brazil Packaging Intangible Asset Amort. ($10)
Kleen Products Settlement Agreement ($354)
Impairment of Asia Box & Restructuring ($5)
Other ($3) ($5)
Global Cellulose FibersPulp Business Acquisition ($7) ($5) ($6)
Other ($2)
Printing Papers Other ($2)
Consumer Pkg. Asia Foodservice Sale ($9)
Corporate ArborGen Sale $14
Debt Extinguishment ($29)
India Packaging Evaluation Write-off ($17)
Regulatory Pre-Engineering Write-off ($8)
Interest Income on Income Tax Refund Claims
$4
Other $2
Total Special Items Before Tax ($66) ($353) ($23)
Special Items Before Tax | Continuing Operations
25

Earnings Presentation | Third Quarter 2017
Special Items Net of Taxes
2Q17 3Q17
$ Million EPS $ Million EPS
Earnings Before Special Items $270 $0.65 $449 $1.08
Special Items Net of Taxes:
Tax Expense – International Investment Restructuring ($19)
Brazil Packaging Intangible Asset Amortization ($7)
Pulp Business Acquisition ($3) ($4)
Kleen Products Settlement Agreement ($219)
Asia Foodservice Sale ($4)
ArborGen Sale $9
Net Income Tax Refund Claims $47
Other $1 ($4)
Total Special Items Net of Taxes ($169) ($0.41) ($34) ($0.08)
Non-Operating Pension Expense ($21) ($0.05) ($20) ($0.05)
Net Earnings $80 $0.19 $395 $0.95
26

Earnings Presentation | Third Quarter 2017
Adj. Operating Profits by Industry Segment | Continuing Operations
27
$ Million$ 3Q16 2Q17 3Q17
Earnings (Loss) From Continuing Operations Before Income Taxes and Equity Earnings $373 ($29) $503
Interest Expense, Net $132 $1413
$152
Noncontrolling Interest / Equity Earnings Adjustment $1 ($1) -
Corporate Items, Net $11 $4 $19
Special Items, Net $66 $353 $23
Non-Operating Pension Expense $42 $34 $33
Adj. Operating Profit Before Special Items $625 $502 $730
Industrial Packaging1 $428 $407 $484
Global Cellulose Fibers1,2 ($31) $12 $57
Printing Papers1 $167 $88 $135
Consumer Packaging1 $61 ($5) $54
Total Adj. Industry Segment Operating Profit1,2 $625 $502 $730
Equity Earnings (Loss), net of taxes – Ilim $46 $21 $48
1 Excludes special items (Non-GAAP)2 Earnings from newly acquired pulp business are reflected beginning December 1, 20163 Excludes a special item of $4MM in interest income

Earnings Presentation | Third Quarter 2017
Geographic Business Segment Operating Results | Quarterly
28
$ MillionSales D & A Adj. Operating Profit1
3Q16 2Q17 3Q17 3Q17 3Q16 2Q17 3Q17
Industrial Packaging
North America $3,151 $3,336 $3,383 $174 $439 $408 $492
Europe $313 $341 $333 $10 $0 $5 ($5)
Brazil $62 $60 $68 $15 ($9) ($6) ($3)
Global Cellulose Fibers2
Global Cellulose Fibers $242 $612 $654 $69 ($31) $12 $57
Printing Papers
North America $477 $446 $470 $21 $81 $21 $54
Europe $278 $299 $292 $11 $40 $26 $38
Brazil $229 $232 $239 $26 $54 $43 $46
India $35 $47 $44 $5 ($8) ($2) ($3)
Consumer Packaging
North America $407 $395 $403 $24 $39 ($19) $33
Europe $87 $79 $88 $5 $22 $14 $21
Does not reflect total company sales1 Excludes special items (Non-GAAP)2 Sales and Earnings from newly acquired pulp business are reflected beginning December 1, 2016

Earnings Presentation | Third Quarter 2017
2017 Operating Earnings
29
Pre-Tax$MM
Tax$MM
Non-controlling
Interest$MM
EquityEarnings
Net Income$MM
Average Shares
MMDiluted EPS1
Net Earnings from Continuing Operations
1Q17 $244 ($83) - $48 $209 416 $0.50
2Q17 ($29) $89 - $20 $80 416 $0.19
3Q17 $503 ($153) - $45 $395 417 $0.95
Net Special Items
1Q17 $14 $7 - - $21 416 $0.05
2Q17 $353 ($184) - - $169 416 $0.41
3Q17 $23 $11 - - $34 417 $0.08
Non-Operating Pension Expense
1Q17 $31 ($12) - - $19 416 $0.05
2Q17 $34 ($13) - - $21 416 $0.05
3Q17 $33 ($13) - - $20 417 $0.05
Adj. Operating Earnings
1Q17 $289 ($88) - $48 $249 416 $0.60
2Q17 $358 ($108) - $20 $270 416 $0.65
3Q17 $559 ($155) - $45 $449 417 $1.08
1 A reconciliation to GAAP EPS is available at www.internationalpaper.com under the Performance tab, Investors section

Earnings Presentation | Third Quarter 2017
Adj. Operating EPS
30
2006 as originally reported
2007-2011 adjusted for elimination of the Ilim JV reporting lag
2006-2010 Net Earnings from continuing operations and before special items; 2010 onward reflects Operating Earnings
xpedx is reflected as a Discontinued Operation from 2010 onward
.12
.35
.40
.47.45
.52
.57
.73
.45.49
.41
.15
.07
.27
.38
.22
.05
.44
.85
.72.76.77 .78
.67
.58
.49
.77
.66.64
.61
1.01
.81
.60
.93.95
.53
.84
.97.97
.87
.80
.92.91
.73
.60.65
1.08
.42
.08
1Q
2Q
3Q
4Q
1Q
2Q
3Q
4Q
1Q
2Q
3Q
4Q
1Q
2Q
3Q
4Q
1Q
2Q
3Q
4Q
1Q
2Q
3Q
4Q
1Q
2Q
3Q
4Q
1Q
2Q
3Q
4Q
1Q
2Q
3Q
4Q
1Q
2Q
3Q
4Q
1Q
2Q
3Q
4Q
1Q
2Q
3Q
20172006 2007 20102008
Impact of Mineral
Rights Gain
2009
.83
2011
.93Final Land Sale
2012 2013 2014 2015 2016

Earnings Presentation | Third Quarter 2017
.91
1.08
(.01) (.18)
(.16)
(.03)
.40
.05
.01
.09
3Q16 Price / Mix Volume Operations& Costs
MaintenanceOutages
Input Costs Corporate& Other Items
Ilim JV PulpAcquisition
3Q17
3Q17 vs. 3Q16 Adj. Operating EPS
31
Adjusted operating EPS based on Adjusted Operating Earnings (defined as Net Earnings (GAAP) from continuing operations before special items and non-operating
pension expense)

Earnings Presentation | Third Quarter 2017
428
484
(14)(79)
(81)
224
6
3Q16 Price / Mix Volume Operations& Costs
MaintenanceOutages
Input Costs 3Q17
Industrial Packaging | 3Q17 vs. 3Q16 Adj. EBIT1
32
$ M
illio
n
1 Segment adjusted operating profit before special items

Earnings Presentation | Third Quarter 2017
3Q17 vs. 2Q17 3Q17 vs. 3Q16
Business VolumePrice / Mix
per TonVolume
Price / Mixper Ton
N.A. Container1 0.5% $30 1.6% $69
European Container (7%) €23 3% €26
Average IP volume and price realization (includes the impact of mix across all segments)1 On a per day FBA basis
Industrial Packaging | Volume and Pricing Trends
33
Earnings Presentation | Third Quarter 2017
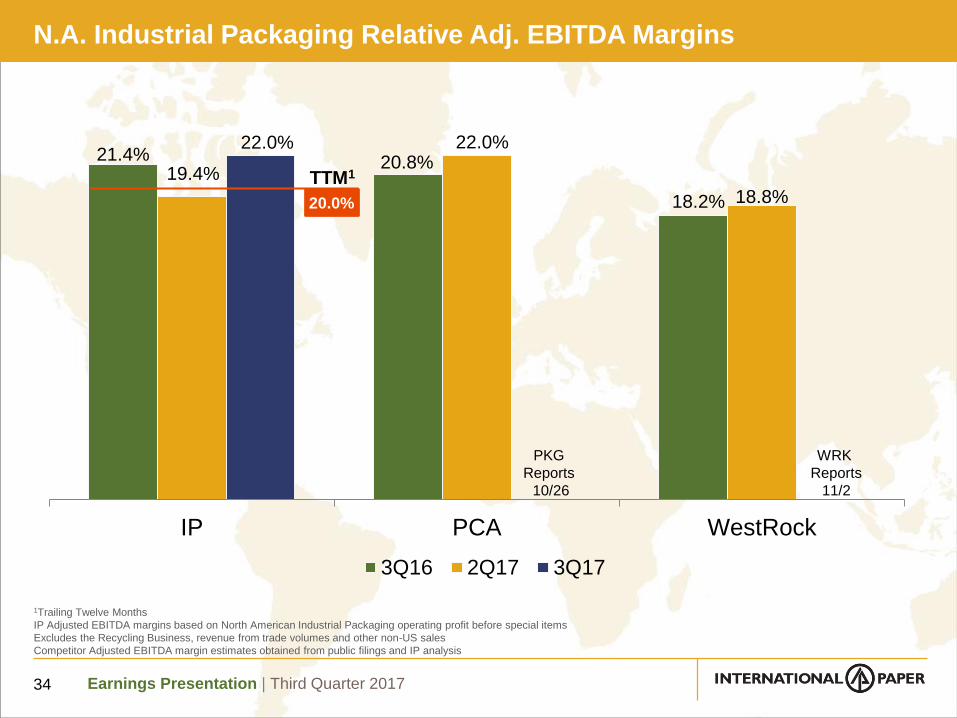
N.A. Industrial Packaging Relative Adj. EBITDA Margins
34
21.4% 20.8%
18.2%
19.4%
22.0%
18.8%
22.0%
IP PCA WestRock
3Q16 2Q17 3Q17
1Trailing Twelve Months
IP Adjusted EBITDA margins based on North American Industrial Packaging operating profit before special items
Excludes the Recycling Business, revenue from trade volumes and other non-US sales
Competitor Adjusted EBITDA margin estimates obtained from public filings and IP analysis
TTM1
20.0%
WRK
Reports
11/2
PKG
Reports
10/26

Earnings Presentation | Third Quarter 2017
Global Cellulose Fibers | 3Q17 vs. 3Q16 Adj. EBIT1
35
1 Segment adjusted operating profit before special items
(31)
57
(1)
(6)
29
13
1
52
3Q16 Price / Mix Volume Operations& Costs
MaintenanceOutages
Input Costs Pulp Acquisition 3Q17
$ M
illio
n
Earnings Presentation | Third Quarter 2017
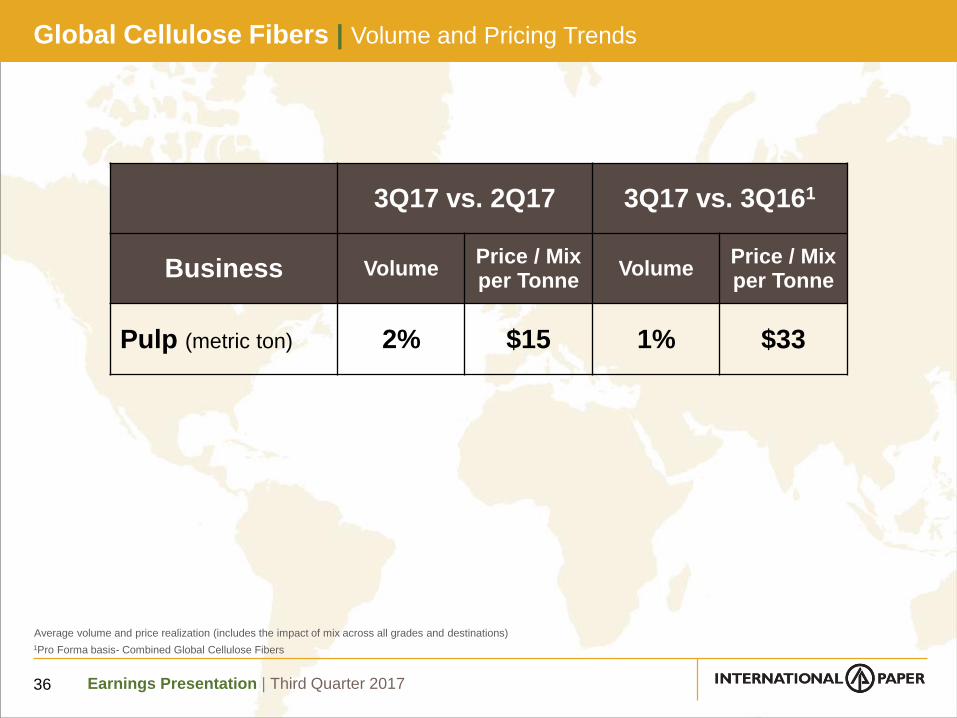
Global Cellulose Fibers | Volume and Pricing Trends
36
3Q17 vs. 2Q17 3Q17 vs. 3Q161
Business VolumePrice / Mixper Tonne
VolumePrice / Mixper Tonne
Pulp (metric ton) 2% $15 1% $33
Average volume and price realization (includes the impact of mix across all grades and destinations)
1Pro Forma basis- Combined Global Cellulose Fibers

Earnings Presentation | Third Quarter 2017
167
135
(19)
(18)
(12)8
9
3Q16 Price / Mix Volume Operations& Costs
MaintenanceOutages
Input Costs 3Q17
Printing Papers | 3Q17 vs. 3Q16 Adj. EBIT1
37
$ M
illio
n
1 Segment adjusted operating profit before special items

Earnings Presentation | Third Quarter 2017
3Q17 vs. 2Q17 3Q17 vs. 3Q16
Business VolumePrice / Mix
per TonVolume
Price / Mixper Ton
N.A. Printing Papers 7% ($8) 5% ($64)
European Papers1 (4%) €22 (2%) €18
Average IP volume and price realization (includes the impact of mix across all grades)1 Excludes Russia
Printing Papers | Volume and Pricing Trends
38

Earnings Presentation | Third Quarter 2017
N.A. Printing Papers Relative Adj. EBITDA Margins
39
21.6%
19.1%
17.3%
9.0%
15.5%
13.1%
16.0%
IP PCA Domtar
3Q16 2Q17 3Q17
UFS
Reports
10/27
1Trailing Twelve Months
IP Adjusted EBITDA margins based on operating profit from continuing operations before special items
Competitor Adjusted EBITDA margin estimates obtained from public filings and IP analysis
TTM1
12.4%
PKG
Reports
10/26

Earnings Presentation | Third Quarter 2017
Printing Papers | IP Brazil
40
$ Million 3Q16 2Q17 3Q17
Sales $229 $232 $239
Adj. Earnings $54 $43 $46
Adj. EBITDA Margin 35% 30% 30%
3Q17 vs. 2Q17 3Q17 vs. 3Q16
Uncoated Freesheet VolumePrice / Mix
per TonVolume
Price / Mixper Ton
Domestic (BRL) 26% (R$72) (2%) R$27
Export (USD) (22%) $22 1% $10
Segment adjusted operating profit before special items
IP Brazil results are reported in the Printing Papers segment
Average IP Brazil price realization (includes the impact of mix across all grades)

Earnings Presentation | Third Quarter 2017
61
54
(2)(4)
(4)
1
2
3Q16 Price / Mix Volume Operations& Costs
MaintenanceOutages
Input Costs 3Q17
Consumer Packaging | 3Q17 vs. 3Q16 Adj. EBIT1
41
$ M
illio
n
1 Segment adjusted operating profit before special items

Earnings Presentation | Third Quarter 2017
Average IP price realization (includes the impact of mix across all grades)
3Q17 vs. 2Q17 3Q17 vs. 3Q16
VolumePrice / Mix
per TonVolume
Price / Mixper Ton
N.A. Coated Paperboard1 4% $14 (2%) $10
Revenue Revenue
Foodservice (2%) (2%)
Consumer Packaging | Volume and Pricing Trends
42

Earnings Presentation | Third Quarter 2017
Ilim Joint Venture | Full Year Financials
43
2013 2014 2015 2016
Sales Volume (Million metric tonnes) 2.4 2.9 3.0 3.2
Sales ($B) 1.9 2.1 1.9 1.9
Debt ($B) 1.5 1.4 1.2 1.5
Adj. Operating EBITDA ($MM) 203 459 694 680
F/X Gain (Loss)1 ($MM) (80) (674) (188) 63
EBITDA ($MM) 123 (215) 506 743
Depreciation ($MM) 176 188 128 121
EBIT ($MM) (53) (403) 378 622
Interest Expense ($MM) 39 69 52 81
Net Income / (Loss) ($MM) (72) (359) 237 385
IP Equity Earnings / (Loss) ($MM) (46) (194) 131 199
Dividends (to IP) ($MM) 0 56 35 60
Ilim JV results are US GAAP basis 1 Represents F/X impact including that related to Ilim JV USD-denominated net debt (balance of ~$0.6B at year end 2016)

Earnings Presentation | Third Quarter 2017
Ilim Joint Venture | Volume and Pricing Trends
44
3Q17 vs. 2Q17 3Q17 vs. 3Q16
Business VolumePrice / Mixper Tonne
VolumePrice / Mixper Tonne
Pulp (metric ton) (10%) ($2) (6%) $49
Average Ilim JV (100%) volume and price realization (includes the impact of mix across all grades and destinations)

Earnings Presentation | Third Quarter 2017
Total Cash Cost Components | 3Q17 YTD
Fiber35%
Materials16%
Freight12%
Labor12%
Energy8%
Overhead10%
Chemicals7%
45
North American mills only (Excludes Newly Acquired Pulp Business)
Earnings Presentation | Third Quarter 2017
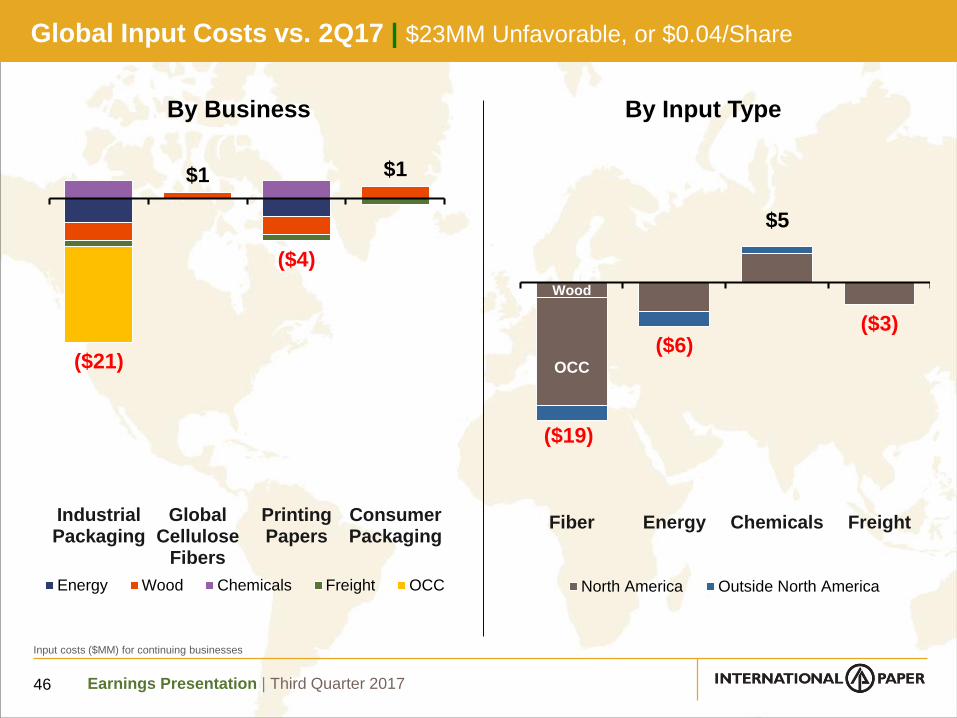
($19)
($6)
$5
($3)
Fiber Energy Chemicals Freight
North America Outside North America
($21)
$1
($4)
$1
IndustrialPackaging
GlobalCellulose
Fibers
PrintingPapers
ConsumerPackaging
Energy Wood Chemicals Freight OCC
By Business By Input Type
Input costs ($MM) for continuing businesses
Global Input Costs vs. 2Q17 | $23MM Unfavorable, or $0.04/Share
46
OCC
Wood

Earnings Presentation | Third Quarter 2017
($75)
($6) ($7) ($7)
Fiber Energy Chemicals Freight
North America Outside North America
($81)
$2
($12)($4)
IndustrialPackaging
GlobalCellulose
Fibers
PrintingPapers
ConsumerPackaging
Energy Wood Chemicals Freight OCC
By Business By Input Type
Global Input Costs vs. 3Q16 | $95MM Unfavorable, or $0.16/Share
47
OCC
Wood
Input costs ($MM) for continuing businesses

Earnings Presentation | Third Quarter 2017
90
95
100
105
110
115
120
125
130
2017
U.S. Mill Wood Delivered Cost Trend | 3Q17 Average Cost Flat vs. 2Q17
48
IP data, cost Indexed to January 2007 values
2008 2009 2010 2011 2012 2013 2014 2015 2016

Earnings Presentation | Third Quarter 2017
40
60
80
100
120
140
160
180
200
220
IP data, cost Indexed to January 2007 values
U.S. OCC Delivered Cost Trend | 3Q17 Average Cost Up 6% vs. 2Q17
49
2008 2009 2010 2011 2012 2013 2014 2015 2016 2017

Earnings Presentation | Third Quarter 2017
U.S. Natural Gas Cost Trend | 3Q17 Average Cost Down 4% vs. 2Q17
50
0
50
100
150
200
250
IP data, cost Indexed to January 2007 values
NYMEX Natural Gas closing prices
2008 2009 2010 2011 2012 2013 2014 2015 2016 2017

Earnings Presentation | Third Quarter 2017
0
50
100
150
200
250
300
U.S. Fuel Oil Cost Trend | 3Q17 Average Cost Up 4% vs. 2Q17
51
IP data, cost Indexed to January 2007 values
WTI Crude prices
2008 2009 2010 2011 2012 2013 2014 2015 2016 2017

Earnings Presentation | Third Quarter 2017
75
100
125
150
175
200
U.S. Chemical Composite Cost Trend | 3Q17 Average Cost up 3% vs. 2Q17
52
IP data, cost Indexed to January 2007 values
Delivered cost to US facilities: includes Caustic Soda, Sodium Chlorate, Starch and Sulfuric Acid 2007 - 2008 excludes WY PKG
2008 2009 2010 2011 2012 2013 2014 2015 2016 2017

Earnings Presentation | Third Quarter 2017
2017 Global Consumption | Annual Purchase Estimates for Key Inputs
53
CommodityNorth
AmericaNon – North
America
Energy
Natural Gas (MMBTUs) 85,000,000 11,000,000
Fuel Oil (Barrels) 450,000 400,000
Coal (Tons) 85,000 600,000
FiberWood (Tons) 60,000,000 8,000,000
Old Corrugated Containers / DLK (Tons) 4,900,000 300,000
Chemicals
Caustic Soda (Tons) 470,000 70,000
Starch (Tons) 390,000 110,000
Sodium Chlorate (Tons) 210,000 60,000
LD Polyethylene (Tons) 40,000 -
Latex (Tons) 10,000 10,000