united states agriculture grain - cornell university
TRANSCRIPT
Grain: World Markets and Trade
Approved by the World Agricultural Outlook Board - USDA
United States Department of Agriculture
Foreign Agricultural Service
Circular Series FG 08-13 August 2013
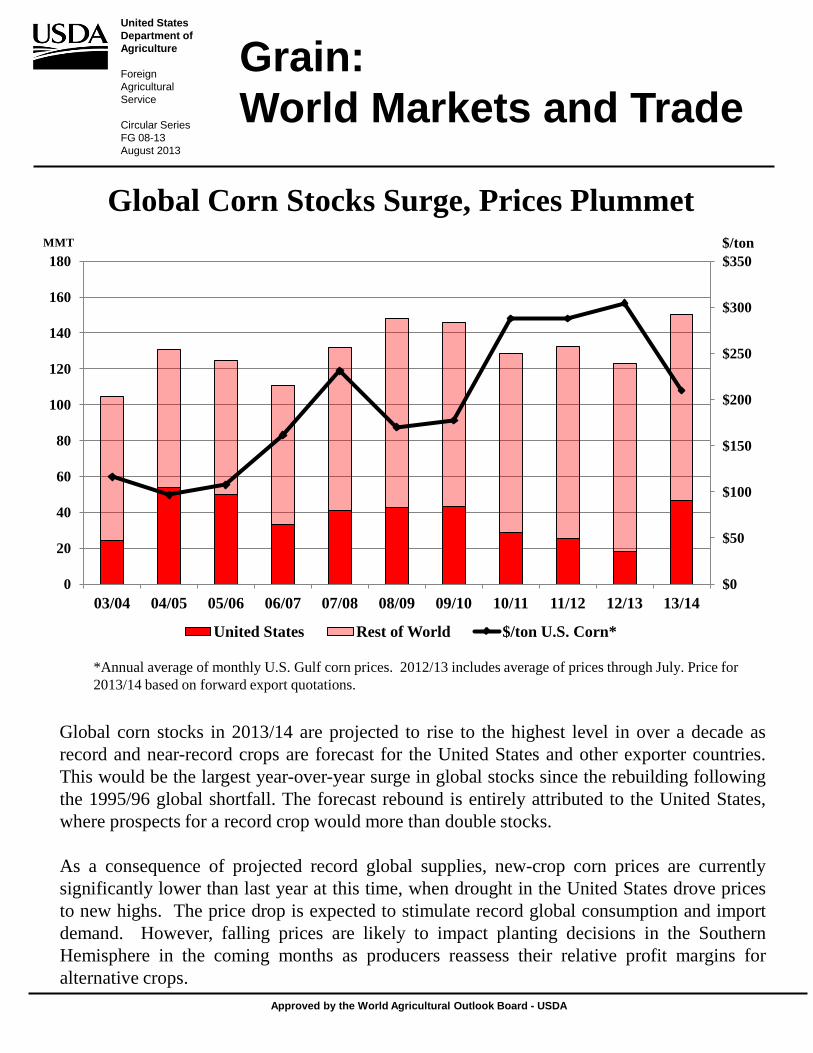
Global Corn Stocks Surge, Prices Plummet
Global corn stocks in 2013/14 are projected to rise to the highest level in over a decade as record and near-record crops are forecast for the United States and other exporter countries. This would be the largest year-over-year surge in global stocks since the rebuilding following the 1995/96 global shortfall. The forecast rebound is entirely attributed to the United States, where prospects for a record crop would more than double stocks. As a consequence of projected record global supplies, new-crop corn prices are currently significantly lower than last year at this time, when drought in the United States drove prices to new highs. The price drop is expected to stimulate record global consumption and import demand. However, falling prices are likely to impact planting decisions in the Southern Hemisphere in the coming months as producers reassess their relative profit margins for alternative crops.
$/ton
$0
$50
$100
$150
$200
$250
$300
$350
0
20
40
60
80
100
120
140
160
180
03/04 04/05 05/06 06/07 07/08 08/09 09/10 10/11 11/12 12/13 13/14
United States Rest of World $/ton U.S. Corn*
*Annual average of monthly U.S. Gulf corn prices. 2012/13 includes average of prices through July. Price for 2013/14 based on forward export quotations.
MMT

Grain: World Markets and Trade, August 2013
2
TABLE OF CONTENTS
World Markets and Trade: Commentary and Current Data Wheat ................................................................................................................. 4 Rice .................................................................................................................. 10 Coarse Grains ................................................................................................... 16 Historical Data Series for Selected Regions and Countries ............................ 37 Endnotes to Grain: World Markets and Trade ............................................... 56 The Foreign Agricultural Service (FAS) updates its production, supply and distribution database for cotton, oilseeds, and grains at 12:00 p.m. on the day the World Agricultural Supply and Demand Estimates (WASDE) report is released. It is available on the FAS website (http://www.fas.usda.gov/psdonline/). This circular is released at 12:30 p.m. on the same day, together with its downloadable data set.
August 2013
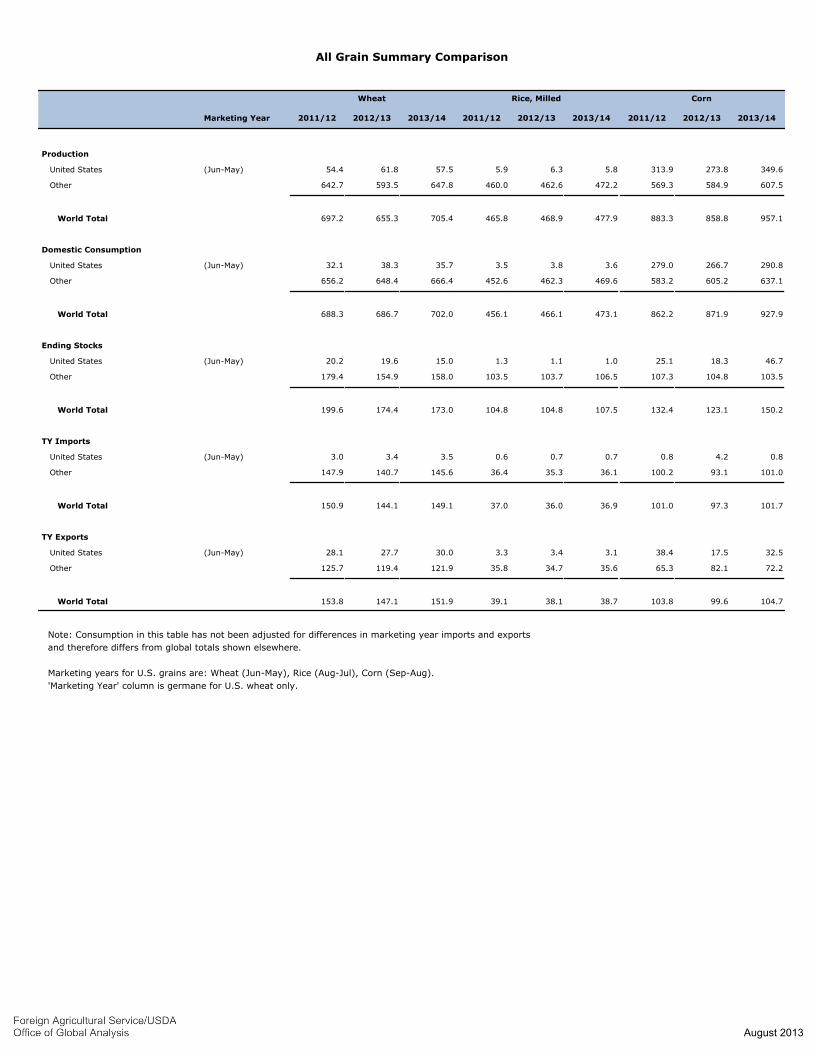
All Grain Summary Comparison
Marketing Year
Wheat Rice, Milled Corn
2013/142012/132011/122013/142012/132011/122013/142012/132011/12
Production
United States (Jun-May) 54.4 61.8 57.5 5.9 6.3 5.8 313.9 273.8 349.6
Other 642.7 593.5 647.8 460.0 462.6 472.2 569.3 584.9 607.5
World Total 697.2 655.3 705.4 465.8 468.9 477.9 883.3 858.8 957.1
Domestic Consumption
United States (Jun-May) 32.1 38.3 35.7 3.5 3.8 3.6 279.0 266.7 290.8
Other 656.2 648.4 666.4 452.6 462.3 469.6 583.2 605.2 637.1
World Total 688.3 686.7 702.0 456.1 466.1 473.1 862.2 871.9 927.9
Ending Stocks
United States (Jun-May) 20.2 19.6 15.0 1.3 1.1 1.0 25.1 18.3 46.7
Other 179.4 154.9 158.0 103.5 103.7 106.5 107.3 104.8 103.5
World Total 199.6 174.4 173.0 104.8 104.8 107.5 132.4 123.1 150.2
TY Imports
United States (Jun-May) 3.0 3.4 3.5 0.6 0.7 0.7 0.8 4.2 0.8
Other 147.9 140.7 145.6 36.4 35.3 36.1 100.2 93.1 101.0
World Total 150.9 144.1 149.1 37.0 36.0 36.9 101.0 97.3 101.7
TY Exports
United States (Jun-May) 28.1 27.7 30.0 3.3 3.4 3.1 38.4 17.5 32.5
Other 125.7 119.4 121.9 35.8 34.7 35.6 65.3 82.1 72.2
World Total 153.8 147.1 151.9 39.1 38.1 38.7 103.8 99.6 104.7
Note: Consumption in this table has not been adjusted for differences in marketing year imports and exports
and therefore differs from global totals shown elsewhere.
Marketing years for U.S. grains are: Wheat (Jun-May), Rice (Aug-Jul), Corn (Sep-Aug).
'Marketing Year' column is germane for U.S. wheat only.
August 2013
Grain: World Markets and Trade, August 2013 4
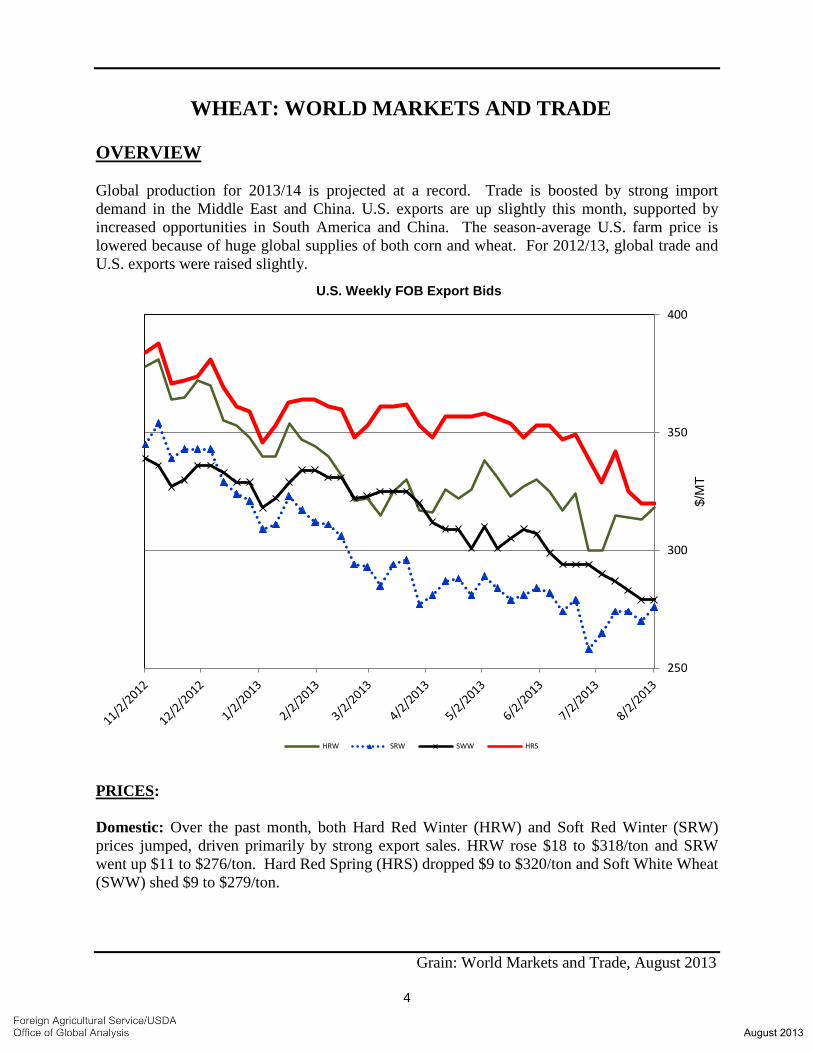
WHEAT: WORLD MARKETS AND TRADE OVERVIEW Global production for 2013/14 is projected at a record. Trade is boosted by strong import demand in the Middle East and China. U.S. exports are up slightly this month, supported by increased opportunities in South America and China. The season-average U.S. farm price is lowered because of huge global supplies of both corn and wheat. For 2012/13, global trade and U.S. exports were raised slightly.
PRICES: Domestic: Over the past month, both Hard Red Winter (HRW) and Soft Red Winter (SRW) prices jumped, driven primarily by strong export sales. HRW rose $18 to $318/ton and SRW went up $11 to $276/ton. Hard Red Spring (HRS) dropped $9 to $320/ton and Soft White Wheat (SWW) shed $9 to $279/ton.
250
300
350
400
$/M
T
U.S. Weekly FOB Export Bids
HRW SRW SWW HRS
August 2013
Grain: World Markets and Trade, August 2013 5
TRADE CHANGES IN 2013/14 Selected Exporters
• Argentina is cut 1.0 million tons to 5.0 million on lower production.
• Brazil is halved to 500,000 tons on lower production and reduced competitiveness.
• Canada is up 500,000 tons to 20.0 million on higher production and opportunities for sales to South America.
• EU is raised 2.0 million tons to 22.0 million based on a larger crop and growing demand in the Middle East.
• India is slashed 2.0 million tons to 5.0 million based on reduced competitiveness
vis-á-vis Black Sea prices.
• Kazakhstan is boosted 2.0 million tons to 9.0 million supported by larger production and expanding demand in the Middle East.
• Pakistan is cut 300,000 tons to 500,000 as a result of diminished competitiveness.
• Turkey is up 300,000 tons to 3.5 million on growing demand for their flour.
• Ukraine is raised 2.0 million tons to 10.0 million on larger production and strong sales.
• United States is up 500,000 tons to 30.0 million supported by robust sales and shipments to South America and China.
Selected Importers
• China is up 1.0 million tons to 9.5 million on reported purchases.
• EU is lowered 500,000 tons to 5.0 million with a larger crop.
• Iran is boosted 1.5 million tons to 4.0 million as the pace of recent purchases is expected to continue.
• Pakistan is up 500,000 tons to 900,000 because of tight supplies and high domestic prices.
• Syria is raised 500,000 tons to 1.1 million in view of recent Government tenders. • Turkey is up 500,000 tons to 3.5 million on account of larger exportable supplies in the
Black Sea Region.
August 2013
Grain: World Markets and Trade, August 2013 6
TRADE CHANGES IN 2012/13 Selected Exporters - based on trade data
• India is raised 300,000 tons to 8.3 million tons.
• United States is raised 295,000 tons to 27.7 million.
• Uruguay is lowered 300,000 tons to 900,000.
August 2013

World Wheat, Flour, and Products Trade
July/June Year, Thousand Metric Tons
2009/10 2010/11 2011/12 2012/13 2013/14
Jul
2013/14
Aug
none
TY Exports
5,0006,0007,44911,9517,7425,255 Argentina
19,00019,00021,30023,03118,45513,764 Australia
20,00019,50018,58117,60316,76818,992 Canada
22,00020,00022,20016,69123,08622,279 European Union
5,0007,0008,3001,7227360 India
9,0007,0007,00011,0695,5197,871 Kazakhstan
17,00017,00011,28921,6273,98318,556 Russia
3,5003,2003,4503,6782,9444,363 Turkey
10,0008,0007,2005,4364,3029,337 Ukraine
1,2001,2009001,7821,5311,039 Uruguay
10,17010,77011,70911,10213,6389,683 Others
121,870118,670119,378125,69298,041111,199 Subtotal
30,00029,50027,69528,14236,04624,143 United States
151,870148,170147,073153,834134,087135,342 World Total
none
TY Imports
2,0002,0001,9002,2002,0002,500 Afghanistan
6,0006,0006,2006,3506,5165,167 Algeria
3,0003,0002,6002,0163,9513,353 Bangladesh
7,5007,5007,5487,0526,7426,690 Brazil
9,5008,5002,9602,9339271,394 China
9,0009,0008,30011,65010,60010,500 Egypt
5,0005,5005,7007,3684,6225,357 European Union
7,1007,1006,9006,4576,6065,364 Indonesia
4,0002,5005,4002,7003503,650 Iran
3,2003,2003,9003,7853,6313,899 Iraq
6,0006,0006,5986,3545,8695,502 Japan
4,8004,8005,4395,1884,7614,470 Korea, South
3,9003,9003,8255,0203,4043,196 Mexico
2,0002,0003,8003,2054,0192,304 Morocco
4,0004,0004,1503,9314,0523,990 Nigeria
3,8003,8003,6004,0613,1923,196 Philippines
3,0003,0002,0002,9041,7421,909 Saudi Arabia
1,9001,9001,7001,5421,6271,358 South Africa
1,9001,9001,9002,3611,6041,901 Sudan
1,9002,1001,8002,6461,9431,614 Thailand
1,8501,8501,6001,4731,8181,531 Tunisia
3,5003,0003,3004,4143,5463,218 Turkey
1,9001,7251,9002,6981,6181,677 Uzbekistan
2,1002,2001,8002,7112,4601,927 Vietnam
3,1003,1003,1002,6372,9452,602 Yemen
43,67042,69542,74244,22937,99441,063 Others
145,620142,270140,662147,885128,539129,332 Subtotal
2,7502,4002,9682,9152,9502,775 Unaccounted
3,5003,5003,4433,0342,5983,235 United States
151,870148,170147,073153,834134,087135,342 World Total
TY=Trade Year, see Endnotes.
August 2013

World Wheat Production, Consumption, and Stocks
Local Marketing Years, Thousand Metric Tons
2009/10 2010/11 2011/12 2012/13 2013/14
Jul
2013/14
Aug
none
Production
12,00013,00010,00015,50017,20012,000 Argentina
25,50025,50022,07929,90527,41021,834 Australia
29,50029,00027,20025,28823,30026,950 Canada
121,000121,000121,000117,400115,180115,120 China
8,8008,8008,5008,4007,2008,523 Egypt
141,373138,604133,049138,081136,667139,720 European Union
92,46092,00094,88086,87080,80080,680 India
15,50015,50014,00013,50015,03013,485 Iran
17,00014,5009,84122,7329,63817,051 Kazakhstan
6,8006,8003,8705,8004,8876,400 Morocco
24,00024,00023,30025,00023,90024,000 Pakistan
54,00054,00037,72056,24041,50861,770 Russia
18,00017,60015,50018,80017,00018,450 Turkey
21,50019,50015,76122,32416,84420,866 Ukraine
6,7006,7006,7006,3006,5006,200 Uzbekistan
53,70953,77050,11550,60249,15953,328 Others
647,842640,274593,515642,742592,223626,377 Subtotal
57,53657,52461,75554,41360,06260,366 United States
705,378697,798655,270697,155652,285686,743 World Total
none
Total Consumption
9,4509,4509,2508,9508,7508,550 Algeria
11,20011,20010,90011,20010,80011,000 Brazil
9,7009,7009,9009,8527,5527,213 Canada
126,500125,500125,000122,500110,500107,000 China
18,70018,70018,70018,60017,70018,100 Egypt
122,700122,000121,000126,875122,844125,622 European Union
90,97089,01083,84081,40681,76078,150 India
17,00016,80016,40015,50016,20016,800 Iran
7,4007,2006,5007,4006,2007,600 Kazakhstan
8,7008,5008,3008,8007,8507,800 Morocco
24,00024,00023,90023,10023,00023,000 Pakistan
36,50036,50033,55038,00038,60039,600 Russia
17,75017,60017,50018,10017,30017,100 Turkey
11,50011,50011,80014,95011,60012,300 Ukraine
8,0507,9507,9758,0007,7007,500 Uzbekistan
146,240145,535143,871142,925134,625132,176 Others
671,134664,214642,078664,656624,203622,805 Subtotal
35,68035,67938,34132,11230,63930,977 United States
706,814699,893680,419696,768654,842653,782 World Total
none
Ending Stocks
3,6573,6573,5323,2073,0112,345 Algeria
5,1975,1974,9075,9327,3607,743 Canada
56,93757,14653,93755,94659,09154,425 China
11,03911,7419,36613,81711,93416,575 European Union
20,20020,20024,20019,95015,36016,120 India
7,4046,1045,1041,4742,7664,200 Iran
6,1806,2695,18010,89913,73614,722 Russia
47,36546,38848,64668,13562,46059,059 Others
157,979156,702154,872179,360175,718175,189 Subtotal
15,00715,67619,55020,21123,46626,552 United States
172,986172,378174,422199,571199,184201,741 World Total
August 2013
Regional Wheat Imports, Production, Consumption, and Stocks
Thousand Metric Tons
2009/10 2010/11 2011/12 2012/13
Jul
2013/14
Aug
2013/14
TY Imports none
6,834 North America 6,431 8,550 7,745 7,890 7,890
1,445 Central America 1,684 1,666 1,639 1,635 1,685
13,170 South America 13,158 13,778 14,424 14,440 14,440
5,357 European Union - 28 4,622 7,368 5,700 5,500 5,000
1,669 Other Europe 1,614 1,914 1,735 1,820 1,820
5,432 Former Soviet Union - 12 5,503 8,021 7,490 6,705 6,830
22,557 Middle East 17,637 23,337 23,880 21,015 23,515
21,592 North Africa 24,428 24,239 21,600 20,600 20,600
16,368 Sub-Saharan Africa 15,428 18,499 17,780 17,675 17,750
13,754 East Asia 13,903 16,877 17,350 21,675 22,675
7,608 South Asia 7,619 5,573 5,695 6,530 7,030
13,924 Southeast Asia 16,286 18,007 16,115 17,285 16,985
2,857 Others 2,824 3,090 2,952 3,000 2,900
132,567 Total 131,137 150,919 144,105 145,770 149,120
Production none
91,464 North America 87,038 83,329 92,186 90,024 90,455
22,213 South America 27,560 25,867 18,821 22,991 21,741
139,720 European Union - 28 136,667 138,081 133,049 138,604 141,373
3,734 Other Europe 3,178 3,634 3,489 3,991 3,991
114,012 Former Soviet Union - 12 81,068 115,032 77,212 102,260 106,960
38,940 Middle East 40,223 40,266 36,618 41,785 42,185
20,241 North Africa 15,914 18,311 17,232 20,412 20,412
6,414 Sub-Saharan Africa 5,300 6,255 6,132 6,283 6,283
116,449 East Asia 116,350 118,774 122,444 122,361 122,361
111,144 South Asia 110,949 117,132 125,336 122,996 123,526
22,238 Oceania 27,855 30,288 22,565 25,900 25,900
174 Others 183 186 186 191 191
686,743 Total 652,285 697,155 655,270 697,798 705,378
Domestic Consumption none
44,490 North America 44,641 49,564 54,866 51,879 51,880
25,738 South America 25,648 26,161 26,228 26,510 26,585
125,622 European Union - 28 122,844 126,875 121,000 122,000 122,700
4,884 Other Europe 4,733 4,933 4,730 5,001 5,101
78,207 Former Soviet Union - 12 75,051 79,840 71,370 74,910 75,445
54,641 Middle East 55,136 56,734 55,930 57,765 58,640
39,441 North Africa 38,806 40,872 40,887 41,362 41,562
21,001 Sub-Saharan Africa 20,630 22,651 23,236 23,426 23,486
120,187 East Asia 123,954 136,930 140,415 139,735 140,790
113,755 South Asia 117,008 115,841 120,426 125,801 127,761
13,086 Southeast Asia 14,980 16,719 16,375 16,795 16,495
6,141 Oceania 6,835 7,807 7,891 8,185 8,185
3,295 Others 3,354 3,343 3,373 3,455 3,410
650,488 Total 653,620 688,270 686,727 696,824 702,040
Ending Stocks none
34,803 North America 31,143 26,718 24,763 21,278 20,529
7,703 South America 8,437 4,275 3,904 4,456 4,485
16,575 European Union - 28 11,934 13,817 9,366 11,741 11,039
1,668 Other Europe 1,153 1,275 1,066 1,084 956
26,024 Former Soviet Union - 12 23,655 27,053 14,194 15,505 15,144
13,958 Middle East 12,651 12,057 13,270 14,310 15,815
11,038 North Africa 12,207 14,026 11,346 10,134 10,221
2,159 Sub-Saharan Africa 1,685 2,727 2,628 2,245 2,270
57,307 East Asia 62,168 59,398 57,296 60,496 60,037
21,536 South Asia 21,238 25,768 28,518 24,153 25,063
3,211 Southeast Asia 3,933 4,582 3,630 3,272 3,445
5,343 Oceania 8,598 7,440 4,018 3,277 3,568
416 Others 382 435 423 427 414
201,741 Total 199,184 199,571 174,422 172,378 172,986
NOTES: Regional definitions appear on last page of this circular. Imports are reported on a trade year basis. All other data are reported
using local marketing years.
August 2013
Grain: World Markets and Trade, August 2013
10
RICE: WORLD MARKETS AND TRADE
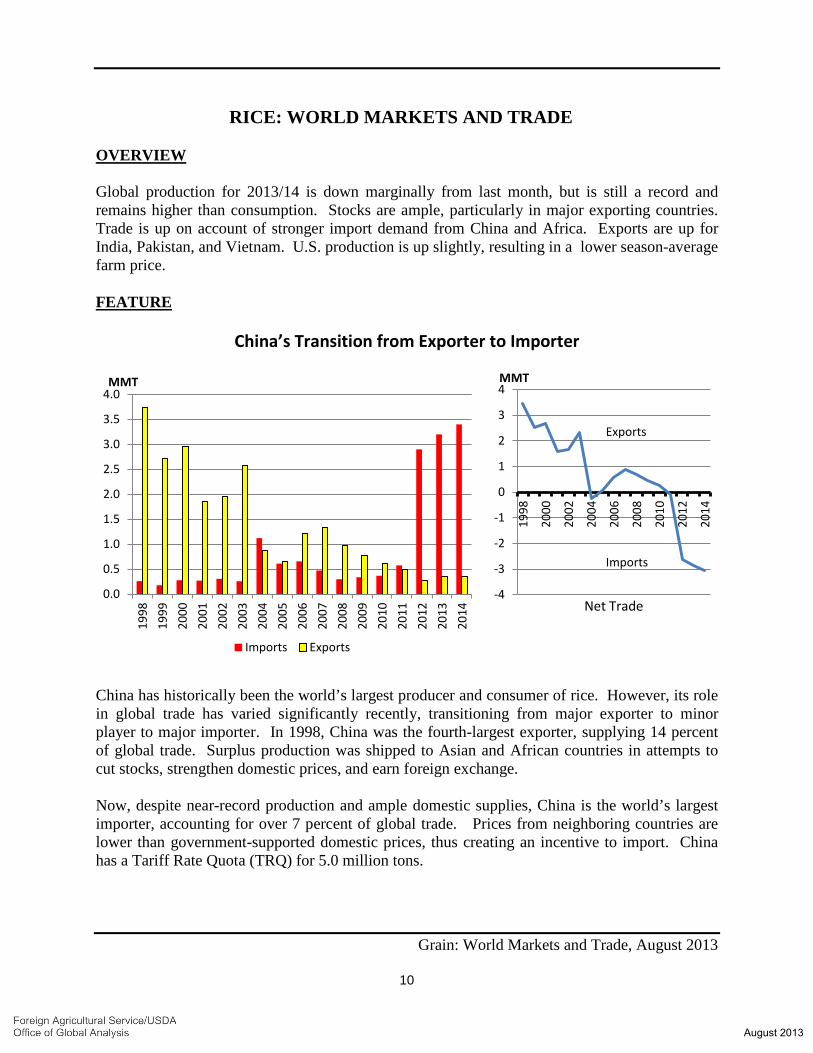
OVERVIEW Global production for 2013/14 is down marginally from last month, but is still a record and remains higher than consumption. Stocks are ample, particularly in major exporting countries. Trade is up on account of stronger import demand from China and Africa. Exports are up for India, Pakistan, and Vietnam. U.S. production is up slightly, resulting in a lower season-average farm price. FEATURE
China’s Transition from Exporter to Importer
China has historically been the world’s largest producer and consumer of rice. However, its role in global trade has varied significantly recently, transitioning from major exporter to minor player to major importer. In 1998, China was the fourth-largest exporter, supplying 14 percent of global trade. Surplus production was shipped to Asian and African countries in attempts to cut stocks, strengthen domestic prices, and earn foreign exchange. Now, despite near-record production and ample domestic supplies, China is the world’s largest importer, accounting for over 7 percent of global trade. Prices from neighboring countries are lower than government-supported domestic prices, thus creating an incentive to import. China has a Tariff Rate Quota (TRQ) for 5.0 million tons.
0.0
0.5
1.0
1.5
2.0
2.5
3.0
3.5
4.0
1998
1999
2000
2001
2002
2003
2004
2005
2006
2007
2008
2009
2010
2011
2012
2013
2014
MMT
Imports Exports
-4
-3
-2
-1
0
1
2
3
4
1998
2000
2002
2004
2006
2008
2010
2012
2014
MMT
Net Trade
Exports
Imports
August 2013
Grain: World Markets and Trade, August 2013
11
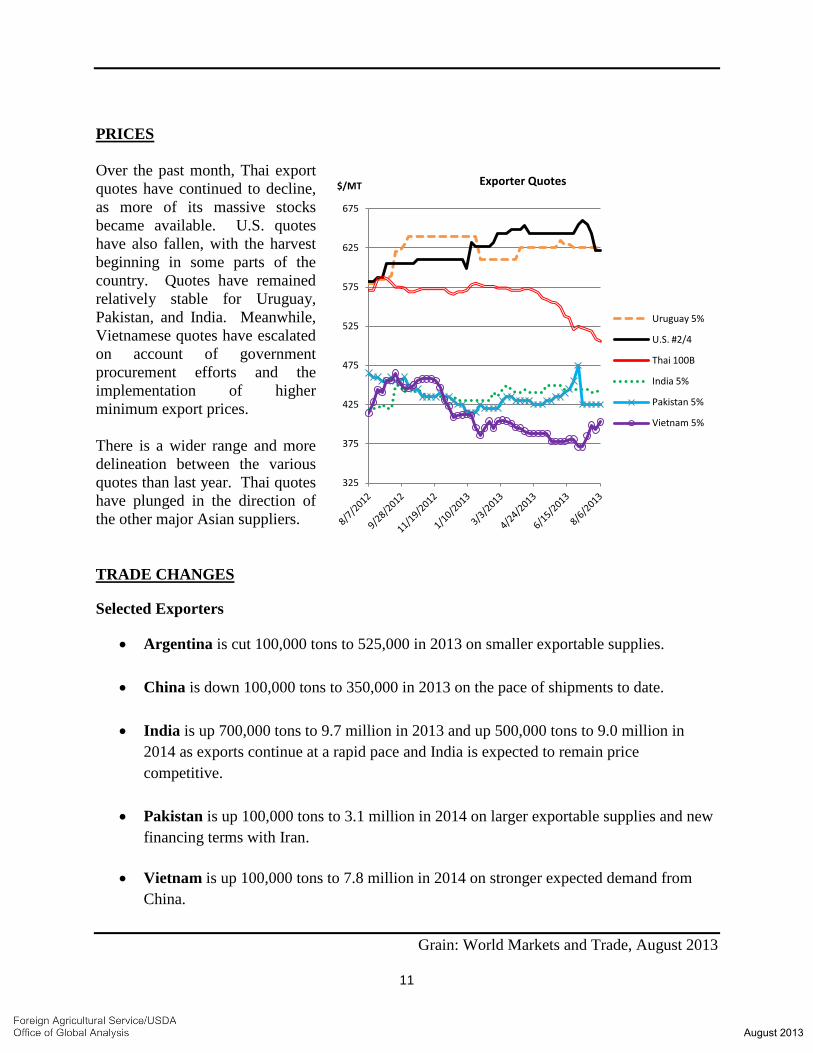
PRICES Over the past month, Thai export quotes have continued to decline, as more of its massive stocks became available. U.S. quotes have also fallen, with the harvest beginning in some parts of the country. Quotes have remained relatively stable for Uruguay, Pakistan, and India. Meanwhile, Vietnamese quotes have escalated on account of government procurement efforts and the implementation of higher minimum export prices. There is a wider range and more delineation between the various quotes than last year. Thai quotes have plunged in the direction of the other major Asian suppliers. TRADE CHANGES
Selected Exporters
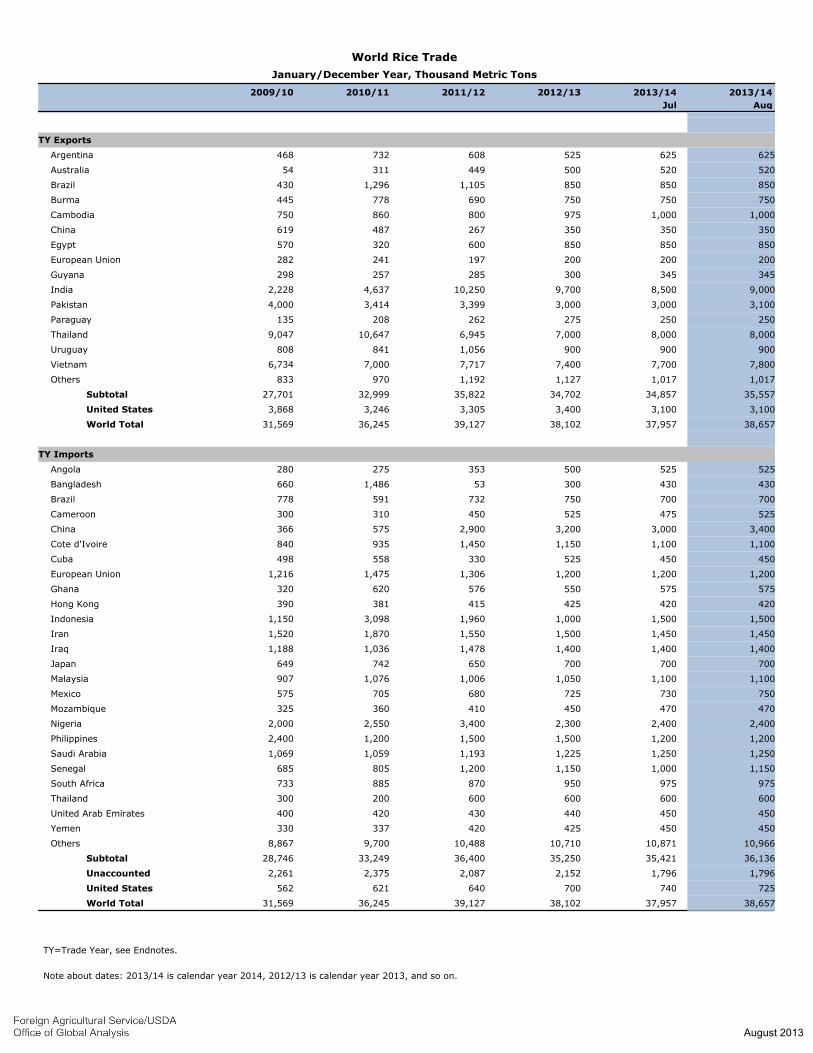
• Argentina is cut 100,000 tons to 525,000 in 2013 on smaller exportable supplies.
• China is down 100,000 tons to 350,000 in 2013 on the pace of shipments to date.
• India is up 700,000 tons to 9.7 million in 2013 and up 500,000 tons to 9.0 million in 2014 as exports continue at a rapid pace and India is expected to remain price competitive.
• Pakistan is up 100,000 tons to 3.1 million in 2014 on larger exportable supplies and new financing terms with Iran.
• Vietnam is up 100,000 tons to 7.8 million in 2014 on stronger expected demand from China.
325
375
425
475
525
575
625
675
$/MT Exporter Quotes
Uruguay 5%
U.S. #2/4
Thai 100B
India 5%
Pakistan 5%
Vietnam 5%
August 2013
Grain: World Markets and Trade, August 2013
12
Selected Importers
• China is boosted 200,000 tons to 3.2 million in 2013 and raised 400,000 tons to 3.4 million in 2014 on account of continued price disparity with neighboring countries.
• Senegal is raised 150,000 tons to 1.2 million in both 2013 and 2014 as strong imports are expected to continue, especially from India.
August 2013
World Rice Trade
January/December Year, Thousand Metric Tons
2009/10 2010/11 2011/12 2012/13 2013/14
Jul
2013/14
Aug
none
TY Exports
625625525608732468 Argentina
52052050044931154 Australia
8508508501,1051,296430 Brazil
750750750690778445 Burma
1,0001,000975800860750 Cambodia
350350350267487619 China
850850850600320570 Egypt
200200200197241282 European Union
345345300285257298 Guyana
9,0008,5009,70010,2504,6372,228 India
3,1003,0003,0003,3993,4144,000 Pakistan
250250275262208135 Paraguay
8,0008,0007,0006,94510,6479,047 Thailand
9009009001,056841808 Uruguay
7,8007,7007,4007,7177,0006,734 Vietnam
1,0171,0171,1271,192970833 Others
35,55734,85734,70235,82232,99927,701 Subtotal
3,1003,1003,4003,3053,2463,868 United States
38,65737,95738,10239,12736,24531,569 World Total
none
TY Imports
525525500353275280 Angola
430430300531,486660 Bangladesh
700700750732591778 Brazil
525475525450310300 Cameroon
3,4003,0003,2002,900575366 China
1,1001,1001,1501,450935840 Cote d'Ivoire
450450525330558498 Cuba
1,2001,2001,2001,3061,4751,216 European Union
575575550576620320 Ghana
420420425415381390 Hong Kong
1,5001,5001,0001,9603,0981,150 Indonesia
1,4501,4501,5001,5501,8701,520 Iran
1,4001,4001,4001,4781,0361,188 Iraq
700700700650742649 Japan
1,1001,1001,0501,0061,076907 Malaysia
750730725680705575 Mexico
470470450410360325 Mozambique
2,4002,4002,3003,4002,5502,000 Nigeria
1,2001,2001,5001,5001,2002,400 Philippines
1,2501,2501,2251,1931,0591,069 Saudi Arabia
1,1501,0001,1501,200805685 Senegal
975975950870885733 South Africa
600600600600200300 Thailand
450450440430420400 United Arab Emirates
450450425420337330 Yemen
10,96610,87110,71010,4889,7008,867 Others
36,13635,42135,25036,40033,24928,746 Subtotal
1,7961,7962,1522,0872,3752,261 Unaccounted
725740700640621562 United States
38,65737,95738,10239,12736,24531,569 World Total
TY=Trade Year, see Endnotes.
Note about dates: 2013/14 is calendar year 2014, 2012/13 is calendar year 2013, and so on.
August 2013

World Rice Production, Consumption, and Stocks
Local Marketing Years, Thousand Metric Tons
2009/10 2010/11 2011/12 2012/13 2013/14
Jul
2013/14
Aug
none
Milled Production
34,20034,20033,80033,70031,70031,000 Bangladesh
8,5008,5008,1607,8889,3007,929 Brazil
11,00011,00010,66610,81610,52811,642 Burma
4,9004,9004,6004,2684,2334,056 Cambodia
143,000144,000143,300140,700137,000136,570 China
4,8504,8504,6754,2503,1004,564 Egypt
108,000108,000104,400105,31095,98089,090 India
37,70037,70036,55036,50035,50036,370 Indonesia
7,7207,7207,7567,6467,7207,711 Japan
4,2204,2204,0064,2244,2954,916 Korea, South
3,1003,1002,3702,8772,8182,234 Nigeria
6,4006,2005,6006,2005,0006,800 Pakistan
11,70011,70011,35010,71010,5399,772 Philippines
21,10021,10020,20020,46020,26220,260 Thailand
27,67027,67027,37527,15226,37124,993 Vietnam
38,09038,11337,77837,25937,36035,598 Others
472,150472,973462,586459,960441,706433,505 Subtotal
5,7795,7206,3345,8667,5937,133 United States
477,929478,693468,920465,826449,299440,638 World Total
none
Consumption and Residual
34,60034,70034,45034,30032,40031,600 Bangladesh
7,8007,8007,9007,9288,2008,477 Brazil
10,25010,25010,20010,20010,10010,890 Burma
3,8003,8003,6153,4503,3703,270 Cambodia
146,500147,000144,000139,600135,000134,320 China
4,0004,0003,9003,6203,3003,940 Egypt
98,50098,50095,80093,33490,20685,508 India
39,80040,30039,55039,55039,00038,000 Indonesia
8,1508,1508,2508,0508,2008,200 Japan
4,4974,4974,6124,9055,1754,701 Korea, South
3,3503,3503,3203,2242,7133,060 Nepal
5,4005,4005,4005,4005,0004,350 Nigeria
12,90012,90012,85012,86012,90013,125 Philippines
10,70010,70010,60010,40010,30010,200 Thailand
20,50020,60020,10019,65019,40019,150 Vietnam
58,81158,44157,76356,16253,91252,360 Others
471,714472,495465,137456,218441,177434,094 Subtotal
3,5623,5633,8103,4934,3304,014 United States
475,276476,058468,947459,711445,507438,108 World Total
none
Ending Stocks
46,43246,52346,88245,02342,57440,534 China
24,50025,00024,00025,10023,50020,500 India
2,4852,4853,0855,0856,1756,577 Indonesia
2,8232,8232,7532,7472,7122,693 Japan
1,4091,4091,4091,5092,4593,520 Philippines
15,53015,53012,5309,3305,6156,100 Thailand
1,2711,2711,8011,8261,9411,470 Vietnam
12,04912,06411,25812,91912,23712,357 Others
106,499107,105103,718103,53997,21393,751 Subtotal
9699101,0971,3031,5141,184 United States
107,468108,015104,815104,84298,72794,935 World Total
Note: All data are reported on a milled basis.
August 2013
Regional Rice Imports, Production, Consumption, and Stocks
Thousand Metric Tons
2009/10 2010/11 2011/12 2012/13
Jul
2013/14
Aug
2013/14
TY Imports none
1,495 North America 1,654 1,664 1,765 1,820 1,825
969 Caribbean 1,099 845 1,080 1,010 1,010
1,354 South America 1,396 1,896 1,962 1,907 1,907
116 Other Europe 128 114 122 122 122
401 Former Soviet Union - 12 335 403 403 426 426
5,808 Middle East 5,989 6,351 6,255 6,350 6,330
345 North Africa 364 747 550 495 545
8,208 Sub-Saharan Africa 9,800 12,219 11,110 11,350 11,615
1,960 East Asia 2,444 4,389 5,151 4,716 5,116
1,016 South Asia 1,864 666 852 1,000 1,000
5,537 Southeast Asia 6,504 5,595 4,680 4,925 4,925
2,099 Others 2,293 2,151 2,020 2,040 2,040
29,308 Total 33,870 37,040 35,950 36,161 36,861
Production none
7,315 North America 7,739 5,979 6,462 5,845 5,901
954 Caribbean 938 1,024 885 991 991
15,664 South America 17,197 15,207 15,630 16,258 16,258
2,176 European Union - 28 2,172 2,105 2,101 2,107 2,107
1,144 Former Soviet Union - 12 1,321 1,294 1,286 1,254 1,254
2,049 Middle East 2,123 2,169 2,150 2,234 2,254
4,598 North Africa 3,139 4,289 4,704 4,889 4,889
11,159 Sub-Saharan Africa 13,032 12,419 12,350 12,895 12,895
151,828 East Asia 151,801 155,342 157,962 158,840 157,800
132,878 South Asia 138,116 151,656 149,935 154,620 154,820
110,063 Southeast Asia 110,476 112,992 113,917 117,321 117,321
810 Others 1,245 1,350 1,538 1,439 1,439
440,638 Total 449,299 465,826 468,920 478,693 477,929
Domestic Consumption none
5,158 North America 5,430 4,669 4,995 4,763 4,772
1,119 Central America 1,109 1,146 1,181 1,206 1,206
1,880 Caribbean 2,035 1,987 1,830 1,978 1,978
14,880 South America 14,457 14,195 14,286 14,321 14,321
3,150 European Union - 28 3,250 3,135 3,140 3,150 3,150
1,327 Former Soviet Union - 12 1,428 1,418 1,425 1,460 1,460
7,781 Middle East 8,183 8,399 8,500 8,700 8,685
4,307 North Africa 3,657 4,005 4,429 4,509 4,559
19,414 Sub-Saharan Africa 21,426 23,147 24,086 24,119 24,384
150,349 East Asia 151,733 155,911 160,367 163,147 162,607
126,275 South Asia 130,592 136,781 139,608 142,610 142,610
98,916 Southeast Asia 99,572 100,672 101,561 103,286 102,686
609 Others 634 661 712 702 702
435,165 Total 443,506 456,126 466,120 473,951 473,120
Ending Stocks none
1,322 North America 1,734 1,455 1,265 1,084 1,147
246 Central America 249 269 286 294 294
126 Caribbean 131 198 141 164 164
1,905 South America 2,168 1,509 1,667 1,991 1,986
1,122 European Union - 28 1,176 1,229 1,190 1,147 1,147
1,634 Middle East 1,723 1,492 1,367 1,161 1,196
498 North Africa 122 487 462 487 487
780 Sub-Saharan Africa 1,304 2,317 1,606 1,452 1,452
45,098 East Asia 46,690 48,874 50,734 50,579 50,488
22,561 South Asia 25,542 27,711 25,921 27,511 26,956
19,441 Southeast Asia 17,663 19,126 19,937 21,947 21,947
46 Oceania 27 40 120 84 90
156 Others 198 135 119 114 114
94,935 Total 98,727 104,842 104,815 108,015 107,468
NOTES: Regional definitions appear on last page of this circular. Imports are reported on a trade year basis. All other data are reported
using local marketing years.
August 2013
Grain: World Markets and Trade, August 2013
16
175
200
225
250
275
300
325
350
$/M
T
Corn Daily Export Bids
U.S. Gulf Black Sea Brazil Paranagua Argentina Up River
COARSE GRAINS: WORLD MARKETS AND TRADE
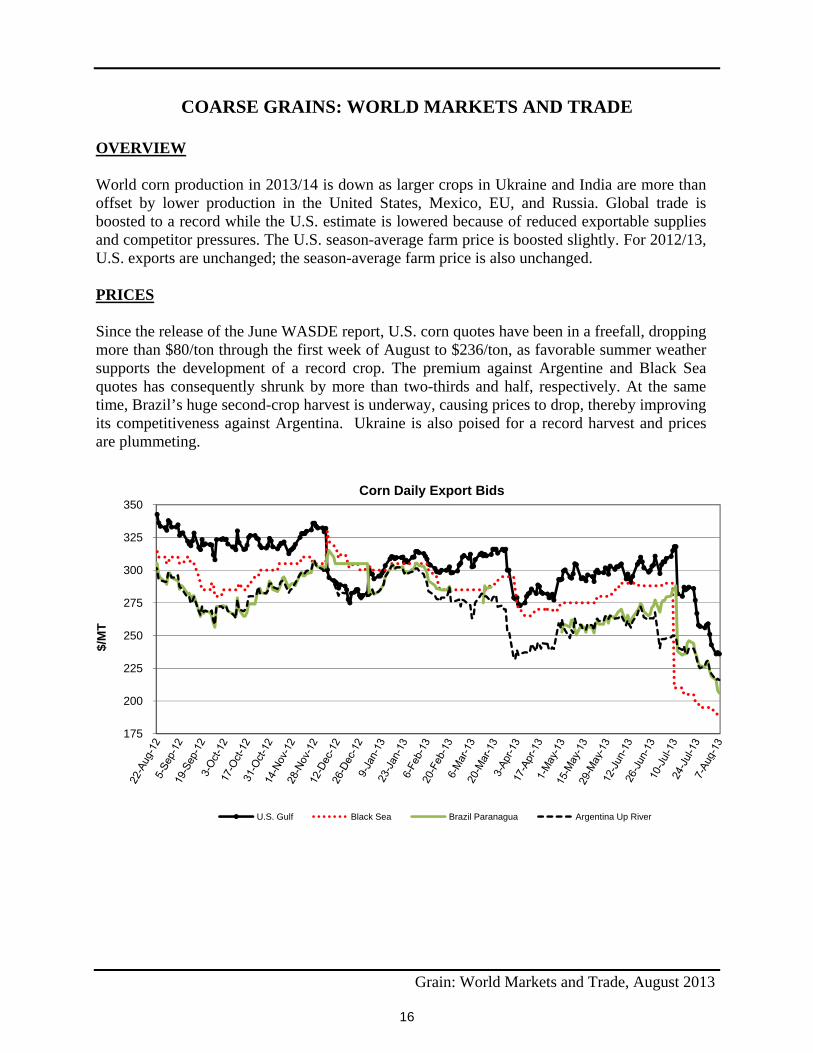
OVERVIEW World corn production in 2013/14 is down as larger crops in Ukraine and India are more than offset by lower production in the United States, Mexico, EU, and Russia. Global trade is boosted to a record while the U.S. estimate is lowered because of reduced exportable supplies and competitor pressures. The U.S. season-average farm price is boosted slightly. For 2012/13, U.S. exports are unchanged; the season-average farm price is also unchanged. PRICES Since the release of the June WASDE report, U.S. corn quotes have been in a freefall, dropping more than $80/ton through the first week of August to $236/ton, as favorable summer weather supports the development of a record crop. The premium against Argentine and Black Sea quotes has consequently shrunk by more than two-thirds and half, respectively. At the same time, Brazil’s huge second-crop harvest is underway, causing prices to drop, thereby improving its competitiveness against Argentina. Ukraine is also poised for a record harvest and prices are plummeting.
Grain: World Markets and Trade, August 2013
17
TRADE CHANGES IN 2013/14 Selected Exporters
• U.S. corn is lowered 500,000 tons to 32.5 million on reduced exportable supplies.
• Brazilian corn is raised 2.0 million tons to 20.0 million on larger old-crop supplies.
• EU corn is cut 200,000 tons to 2.5 million and Russian corn is slashed 500,000 tons to 2.0 million due to smaller crops and stronger competition from Ukraine.
• Ukrainian corn is raised 1.5 million tons to 18.0 million on prospects for a record crop.
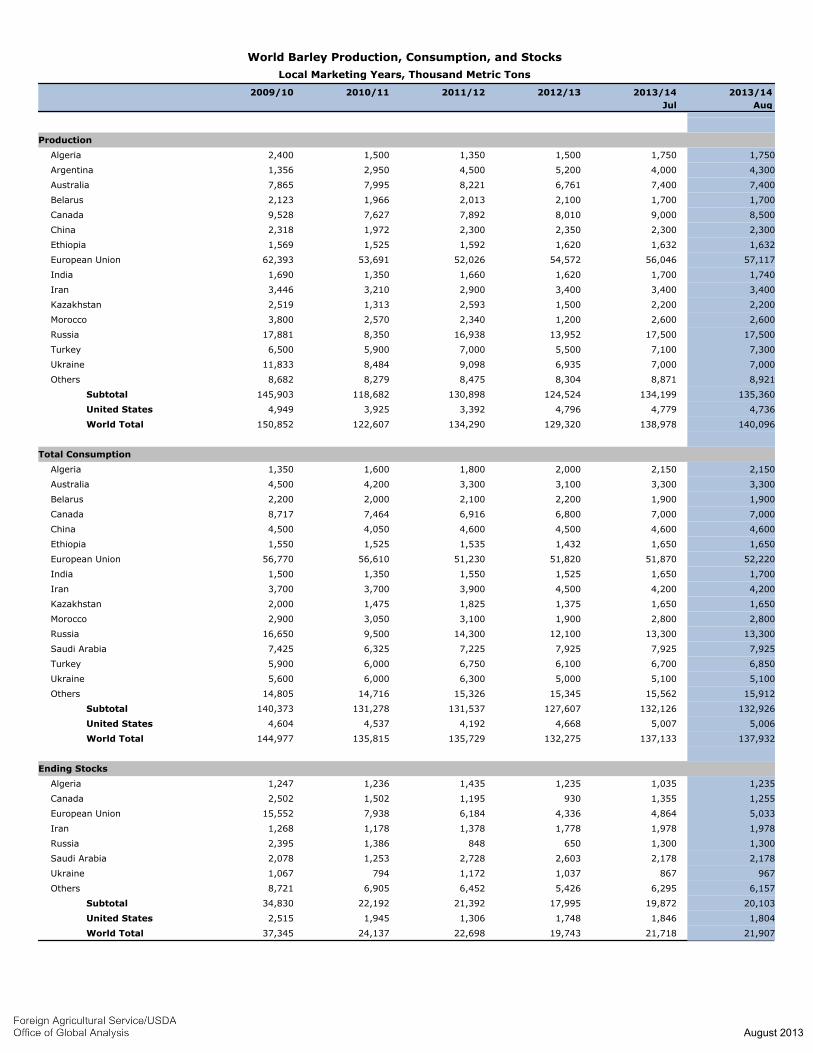
• Argentine barley is up 300,000 tons to 2.6 million on improved production prospects.
• Canadian barley is lowered 400,000 tons to 1.2 million due to reduced harvested area and strong competition from Europe and Argentina.
• EU barley is raised 500,000 tons to 4.3 million on a larger crop, restoring its position as the world’s largest barley exporter.
Selected Importers
• Egyptian corn is up 300,000 tons to 5.2 million based on higher feed use.
• EU corn is raised 500,000 tons to 7.5 million because of a smaller crop and ample Ukrainian supplies.
• Mexican corn is raised 1.5 million tons to 8.0 million based on a smaller crop.
• South Korean corn is raised 700,000 tons to 8.9 million on expanding feed demand.
• Turkish corn is lowered 200,000 tons to 500,000 on improved domestic supplies.
• Algerian barley is doubled to 400,000 tons based on the pace of purchases.
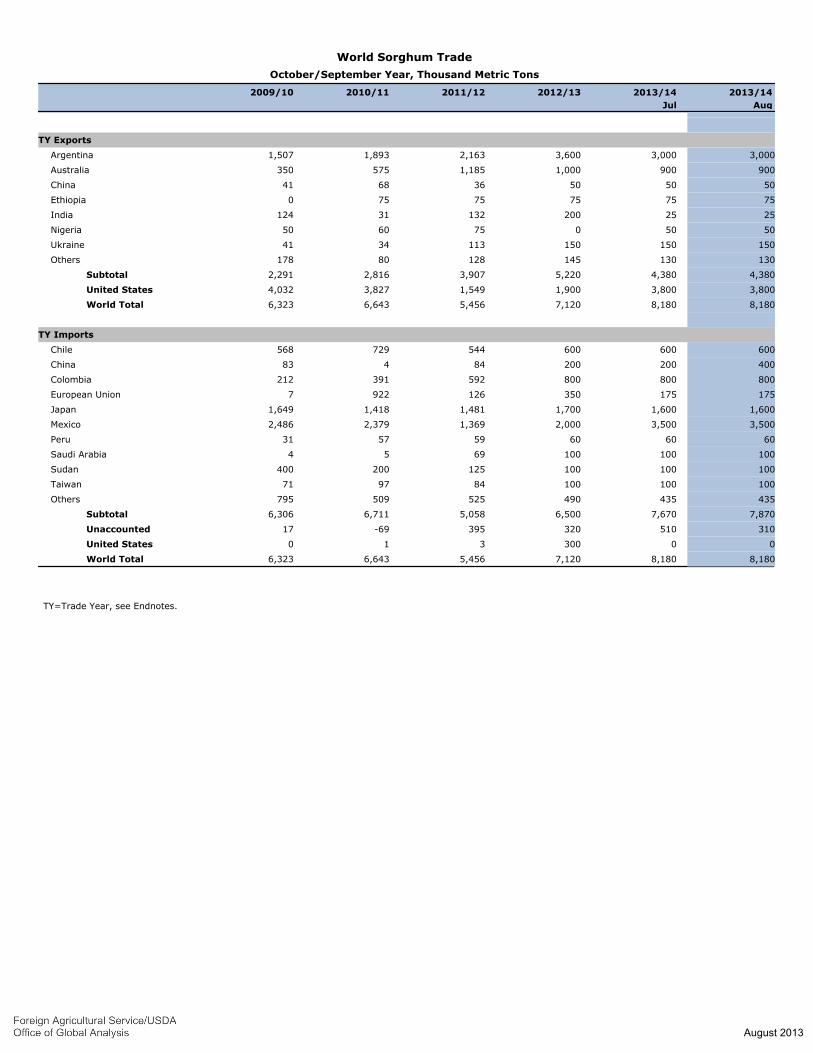
• Chinese sorghum is doubled to a record 400,000 tons on trade reports of purchases. TRADE CHANGES IN 2012/13 Selected Exporters
• Argentine corn is raised 1.5 million tons to 23.5 million due to a record export pace.
August 2013
Grain: World Markets and Trade, August 2013
18
• EU corn is boosted 200,000 tons to 1.7 million reflecting late-season export licenses.
• Argentine barley is lowered 300,000 tons to 3.7 million on account of smaller-than-expected old-crop supplies and the pace of shipments to date.
Selected Importers
• U.S. corn is boosted 200,000 tons to 4.2 million on continued imports for feed use (Canadian exports are raised 200,000 tons to 1.6 million).
• Egyptian and South Korean corn are boosted 500,000 tons each to 4.5 and 8.5 million,
respectively, based on trade data.
• EU, Indonesian, and Turkish corn are boosted 300,000 tons each on stronger-than-expected shipments.
• Mexican corn is slashed 1.0 million tons to 5.5 million and Mexican sorghum is cut 200,000 tons to 2.0 million on tight U.S. supplies (high prices) through late summer.
• Venezuelan corn is cut 200,000 tons to 2.3 million due to a slow pace of shipments.
August 2013
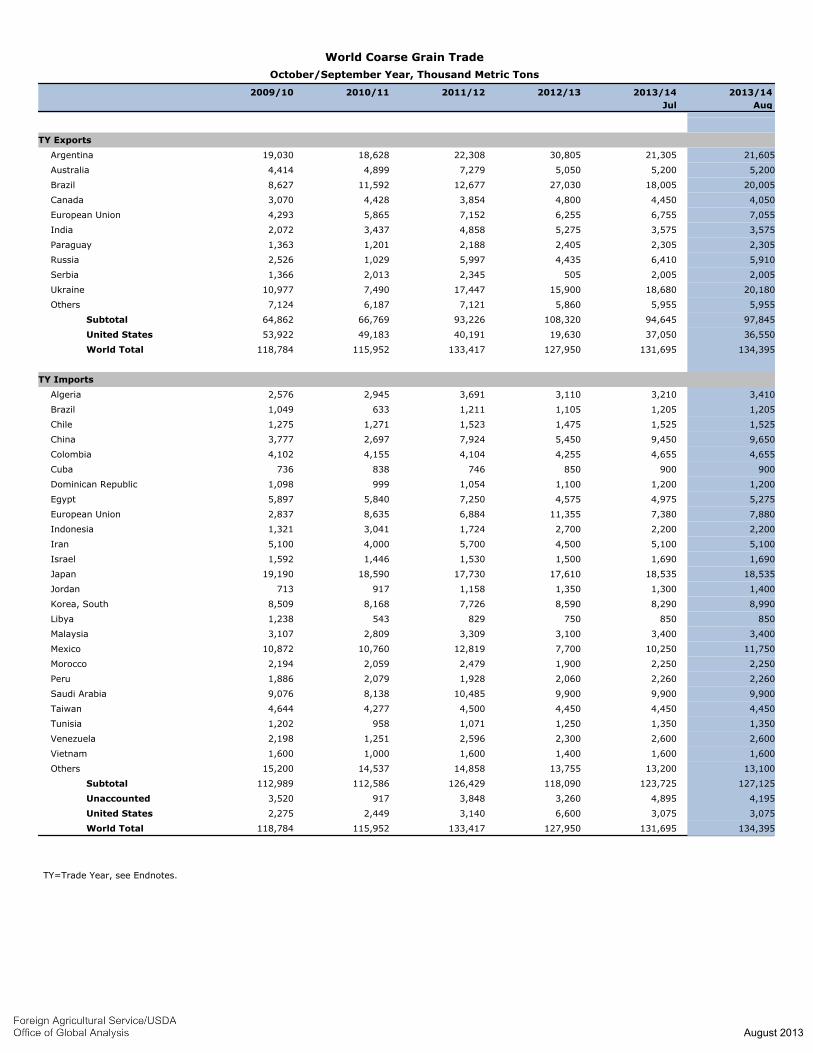
World Coarse Grain Trade
October/September Year, Thousand Metric Tons
2009/10 2010/11 2011/12 2012/13 2013/14
Jul
2013/14
Aug
none
TY Exports
21,60521,30530,80522,30818,62819,030 Argentina
5,2005,2005,0507,2794,8994,414 Australia
20,00518,00527,03012,67711,5928,627 Brazil
4,0504,4504,8003,8544,4283,070 Canada
7,0556,7556,2557,1525,8654,293 European Union
3,5753,5755,2754,8583,4372,072 India
2,3052,3052,4052,1881,2011,363 Paraguay
5,9106,4104,4355,9971,0292,526 Russia
2,0052,0055052,3452,0131,366 Serbia
20,18018,68015,90017,4477,49010,977 Ukraine
5,9555,9555,8607,1216,1877,124 Others
97,84594,645108,32093,22666,76964,862 Subtotal
36,55037,05019,63040,19149,18353,922 United States
134,395131,695127,950133,417115,952118,784 World Total
none
TY Imports
3,4103,2103,1103,6912,9452,576 Algeria
1,2051,2051,1051,2116331,049 Brazil
1,5251,5251,4751,5231,2711,275 Chile
9,6509,4505,4507,9242,6973,777 China
4,6554,6554,2554,1044,1554,102 Colombia
900900850746838736 Cuba
1,2001,2001,1001,0549991,098 Dominican Republic
5,2754,9754,5757,2505,8405,897 Egypt
7,8807,38011,3556,8848,6352,837 European Union
2,2002,2002,7001,7243,0411,321 Indonesia
5,1005,1004,5005,7004,0005,100 Iran
1,6901,6901,5001,5301,4461,592 Israel
18,53518,53517,61017,73018,59019,190 Japan
1,4001,3001,3501,158917713 Jordan
8,9908,2908,5907,7268,1688,509 Korea, South
8508507508295431,238 Libya
3,4003,4003,1003,3092,8093,107 Malaysia
11,75010,2507,70012,81910,76010,872 Mexico
2,2502,2501,9002,4792,0592,194 Morocco
2,2602,2602,0601,9282,0791,886 Peru
9,9009,9009,90010,4858,1389,076 Saudi Arabia
4,4504,4504,4504,5004,2774,644 Taiwan
1,3501,3501,2501,0719581,202 Tunisia
2,6002,6002,3002,5961,2512,198 Venezuela
1,6001,6001,4001,6001,0001,600 Vietnam
13,10013,20013,75514,85814,53715,200 Others
127,125123,725118,090126,429112,586112,989 Subtotal
4,1954,8953,2603,8489173,520 Unaccounted
3,0753,0756,6003,1402,4492,275 United States
134,395131,695127,950133,417115,952118,784 World Total
TY=Trade Year, see Endnotes.
August 2013

World Coarse Grains Production, Consumption, and Stocks
Local Marketing Years, Thousand Metric Tons
2009/10 2010/11 2011/12 2012/13 2013/14
Jul
2013/14
Aug
none
Production
37,15836,85837,35230,10533,25830,231 Argentina
11,13711,13710,05912,25711,48510,935 Australia
74,81374,81382,76775,88460,38058,182 Brazil
25,77526,27524,29622,92122,66822,780 Canada
217,480217,480212,390199,297183,771169,775 China
11,60211,60211,36311,43510,4698,046 Ethiopia
155,288154,220145,098149,986142,829157,547 European Union
41,54040,50039,91042,25043,37033,890 India
9,2009,2008,0008,8506,8006,900 Indonesia
29,46530,46528,02825,75329,22627,273 Mexico
21,90021,90021,27323,85023,25023,250 Nigeria
35,60036,10028,65833,07716,41631,843 Russia
13,49313,49312,71413,25611,32113,881 South Africa
12,87512,27510,57511,27510,18511,176 Turkey
37,47034,50029,52733,47621,50324,185 Ukraine
146,063146,253140,490137,139141,788136,928 Others
880,859877,071842,500830,811768,719766,822 Subtotal
364,764370,462286,005323,728330,236348,755 United States
1,245,6231,247,5331,128,5051,154,5391,098,9551,115,577 World Total
none
Domestic Consumption
12,45812,35811,30210,51011,03310,054 Argentina
57,13357,13356,08853,73852,73349,514 Brazil
21,30021,30020,58620,28121,20122,746 Canada
233,325233,125216,075196,992188,448173,251 China
12,32512,02512,33712,84913,57513,072 Egypt
11,62511,62511,30711,2609,9258,543 Ethiopia
155,270154,620153,605151,066154,657152,412 European Union
37,30036,75035,12537,85038,85032,000 India
18,73018,73017,81017,99018,87519,645 Japan
40,01540,21535,96538,04539,78540,815 Mexico
21,85021,85021,45023,75023,20023,050 Nigeria
29,10029,10025,03427,72818,13130,440 Russia
11,57311,57311,37811,25211,21310,833 South Africa
12,67512,52512,82511,72511,07510,865 Turkey
15,55015,08014,13615,55913,77212,994 Ukraine
217,767217,232212,330205,697205,196199,629 Others
911,438911,618863,423864,765832,396817,651 Subtotal
303,727305,887279,434290,047298,057295,404 United States
1,215,1651,217,5051,142,8571,154,8121,130,4531,113,055 World Total
none
Ending Stocks
13,63913,13912,7599,50510,60510,257 Brazil
3,7443,8442,7743,3943,5495,534 Canada
55,58755,58761,88760,23250,13452,302 China
13,11512,57312,27216,07916,73226,241 European Union
3,3993,3993,4193,6393,5594,063 Iran
3,3973,3973,3973,8813,5815,367 South Africa
3,9122,8122,0922,4212,1492,217 Ukraine
34,99234,40231,69238,60843,25543,236 Others
131,785129,153130,292137,759133,564149,217 Subtotal
49,90053,05720,93527,82032,28848,133 United States
181,685182,210151,227165,579165,852197,350 World Total
August 2013
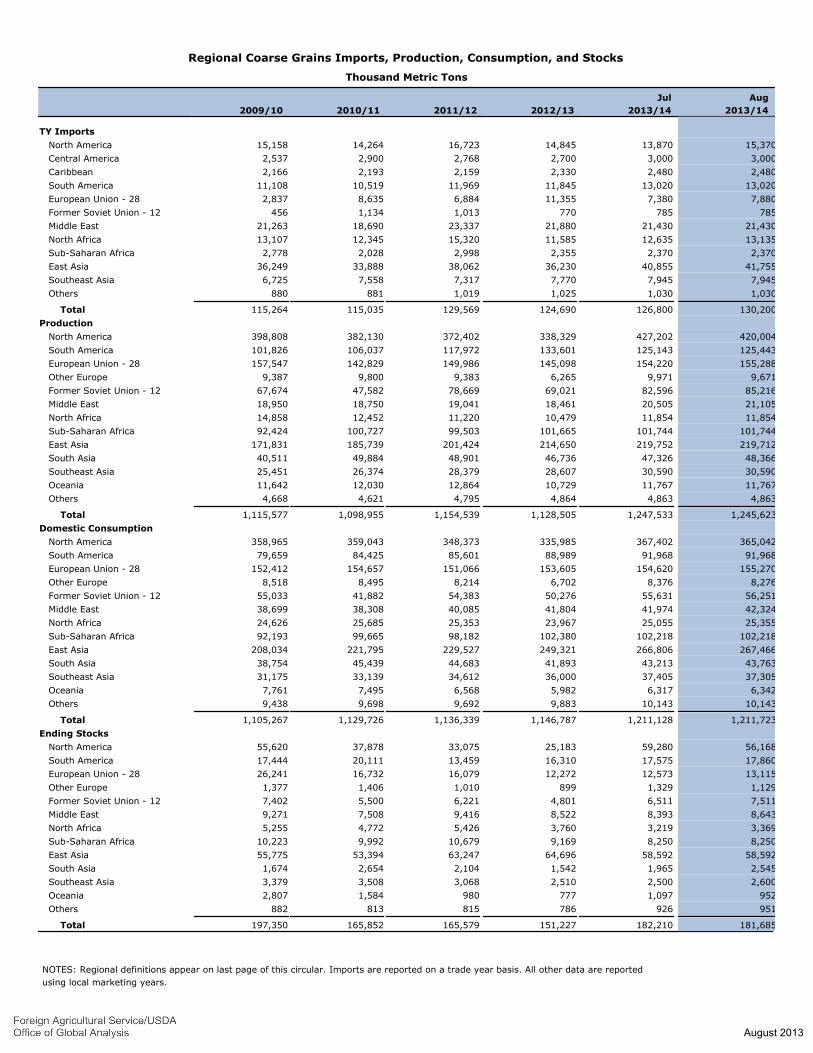
Regional Coarse Grains Imports, Production, Consumption, and Stocks
Thousand Metric Tons
2009/10 2010/11 2011/12 2012/13
Jul
2013/14
Aug
2013/14
TY Imports none
15,158 North America 14,264 16,723 14,845 13,870 15,370
2,537 Central America 2,900 2,768 2,700 3,000 3,000
2,166 Caribbean 2,193 2,159 2,330 2,480 2,480
11,108 South America 10,519 11,969 11,845 13,020 13,020
2,837 European Union - 28 8,635 6,884 11,355 7,380 7,880
456 Former Soviet Union - 12 1,134 1,013 770 785 785
21,263 Middle East 18,690 23,337 21,880 21,430 21,430
13,107 North Africa 12,345 15,320 11,585 12,635 13,135
2,778 Sub-Saharan Africa 2,028 2,998 2,355 2,370 2,370
36,249 East Asia 33,888 38,062 36,230 40,855 41,755
6,725 Southeast Asia 7,558 7,317 7,770 7,945 7,945
880 Others 881 1,019 1,025 1,030 1,030
115,264 Total 115,035 129,569 124,690 126,800 130,200
Production none
398,808 North America 382,130 372,402 338,329 427,202 420,004
101,826 South America 106,037 117,972 133,601 125,143 125,443
157,547 European Union - 28 142,829 149,986 145,098 154,220 155,288
9,387 Other Europe 9,800 9,383 6,265 9,971 9,671
67,674 Former Soviet Union - 12 47,582 78,669 69,021 82,596 85,216
18,950 Middle East 18,750 19,041 18,461 20,505 21,105
14,858 North Africa 12,452 11,220 10,479 11,854 11,854
92,424 Sub-Saharan Africa 100,727 99,503 101,665 101,744 101,744
171,831 East Asia 185,739 201,424 214,650 219,752 219,712
40,511 South Asia 49,884 48,901 46,736 47,326 48,366
25,451 Southeast Asia 26,374 28,379 28,607 30,590 30,590
11,642 Oceania 12,030 12,864 10,729 11,767 11,767
4,668 Others 4,621 4,795 4,864 4,863 4,863
1,115,577 Total 1,098,955 1,154,539 1,128,505 1,247,533 1,245,623
Domestic Consumption none
358,965 North America 359,043 348,373 335,985 367,402 365,042
79,659 South America 84,425 85,601 88,989 91,968 91,968
152,412 European Union - 28 154,657 151,066 153,605 154,620 155,270
8,518 Other Europe 8,495 8,214 6,702 8,376 8,276
55,033 Former Soviet Union - 12 41,882 54,383 50,276 55,631 56,251
38,699 Middle East 38,308 40,085 41,804 41,974 42,324
24,626 North Africa 25,685 25,353 23,967 25,055 25,355
92,193 Sub-Saharan Africa 99,665 98,182 102,380 102,218 102,218
208,034 East Asia 221,795 229,527 249,321 266,806 267,466
38,754 South Asia 45,439 44,683 41,893 43,213 43,763
31,175 Southeast Asia 33,139 34,612 36,000 37,405 37,305
7,761 Oceania 7,495 6,568 5,982 6,317 6,342
9,438 Others 9,698 9,692 9,883 10,143 10,143
1,105,267 Total 1,129,726 1,136,339 1,146,787 1,211,128 1,211,723
Ending Stocks none
55,620 North America 37,878 33,075 25,183 59,280 56,168
17,444 South America 20,111 13,459 16,310 17,575 17,860
26,241 European Union - 28 16,732 16,079 12,272 12,573 13,115
1,377 Other Europe 1,406 1,010 899 1,329 1,129
7,402 Former Soviet Union - 12 5,500 6,221 4,801 6,511 7,511
9,271 Middle East 7,508 9,416 8,522 8,393 8,643
5,255 North Africa 4,772 5,426 3,760 3,219 3,369
10,223 Sub-Saharan Africa 9,992 10,679 9,169 8,250 8,250
55,775 East Asia 53,394 63,247 64,696 58,592 58,592
1,674 South Asia 2,654 2,104 1,542 1,965 2,545
3,379 Southeast Asia 3,508 3,068 2,510 2,500 2,600
2,807 Oceania 1,584 980 777 1,097 952
882 Others 813 815 786 926 951
197,350 Total 165,852 165,579 151,227 182,210 181,685
NOTES: Regional definitions appear on last page of this circular. Imports are reported on a trade year basis. All other data are reported
using local marketing years.
August 2013
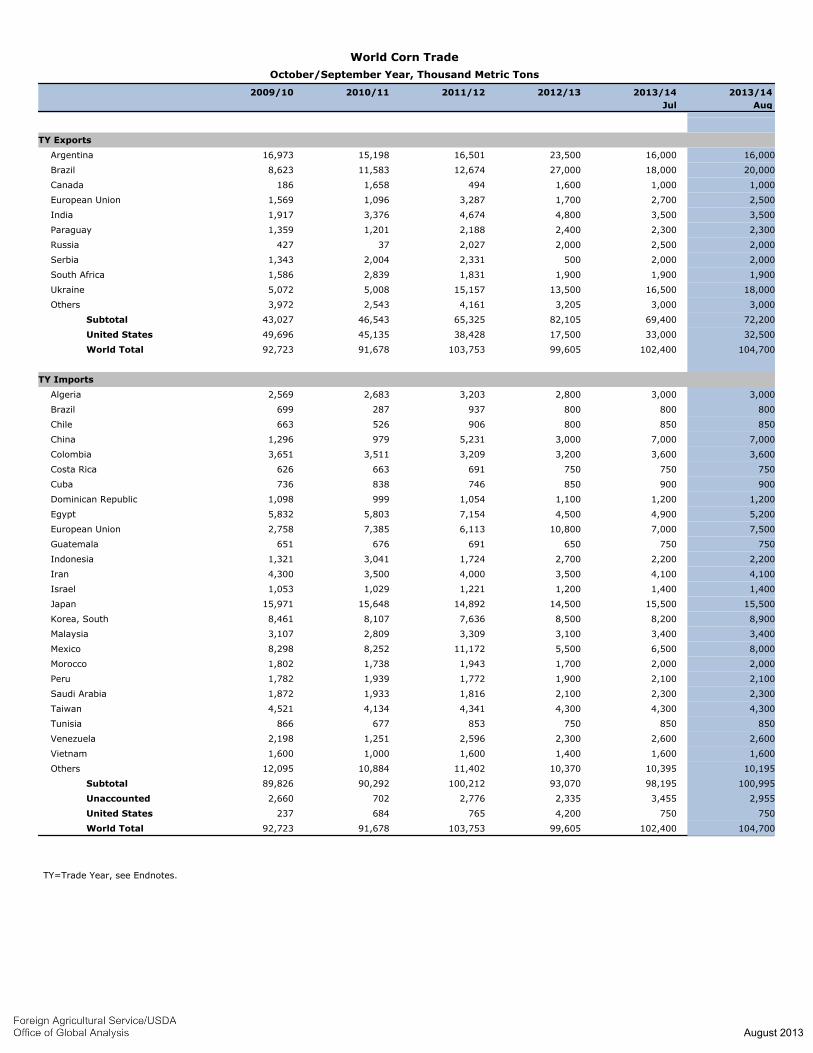
World Corn Trade
October/September Year, Thousand Metric Tons
2009/10 2010/11 2011/12 2012/13 2013/14
Jul
2013/14
Aug
none
TY Exports
16,00016,00023,50016,50115,19816,973 Argentina
20,00018,00027,00012,67411,5838,623 Brazil
1,0001,0001,6004941,658186 Canada
2,5002,7001,7003,2871,0961,569 European Union
3,5003,5004,8004,6743,3761,917 India
2,3002,3002,4002,1881,2011,359 Paraguay
2,0002,5002,0002,02737427 Russia
2,0002,0005002,3312,0041,343 Serbia
1,9001,9001,9001,8312,8391,586 South Africa
18,00016,50013,50015,1575,0085,072 Ukraine
3,0003,0003,2054,1612,5433,972 Others
72,20069,40082,10565,32546,54343,027 Subtotal
32,50033,00017,50038,42845,13549,696 United States
104,700102,40099,605103,75391,67892,723 World Total
none
TY Imports
3,0003,0002,8003,2032,6832,569 Algeria
800800800937287699 Brazil
850850800906526663 Chile
7,0007,0003,0005,2319791,296 China
3,6003,6003,2003,2093,5113,651 Colombia
750750750691663626 Costa Rica
900900850746838736 Cuba
1,2001,2001,1001,0549991,098 Dominican Republic
5,2004,9004,5007,1545,8035,832 Egypt
7,5007,00010,8006,1137,3852,758 European Union
750750650691676651 Guatemala
2,2002,2002,7001,7243,0411,321 Indonesia
4,1004,1003,5004,0003,5004,300 Iran
1,4001,4001,2001,2211,0291,053 Israel
15,50015,50014,50014,89215,64815,971 Japan
8,9008,2008,5007,6368,1078,461 Korea, South
3,4003,4003,1003,3092,8093,107 Malaysia
8,0006,5005,50011,1728,2528,298 Mexico
2,0002,0001,7001,9431,7381,802 Morocco
2,1002,1001,9001,7721,9391,782 Peru
2,3002,3002,1001,8161,9331,872 Saudi Arabia
4,3004,3004,3004,3414,1344,521 Taiwan
850850750853677866 Tunisia
2,6002,6002,3002,5961,2512,198 Venezuela
1,6001,6001,4001,6001,0001,600 Vietnam
10,19510,39510,37011,40210,88412,095 Others
100,99598,19593,070100,21290,29289,826 Subtotal
2,9553,4552,3352,7767022,660 Unaccounted
7507504,200765684237 United States
104,700102,40099,605103,75391,67892,723 World Total
TY=Trade Year, see Endnotes.
August 2013
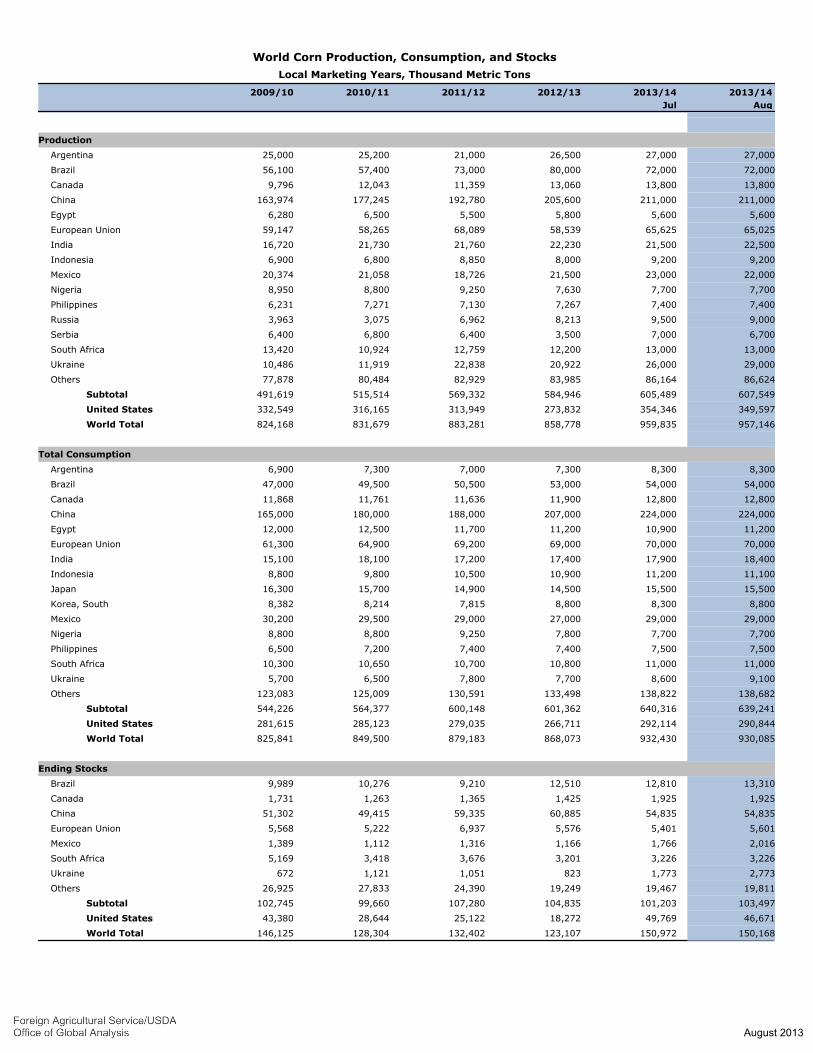
World Corn Production, Consumption, and Stocks
Local Marketing Years, Thousand Metric Tons
2009/10 2010/11 2011/12 2012/13 2013/14
Jul
2013/14
Aug
none
Production
27,00027,00026,50021,00025,20025,000 Argentina
72,00072,00080,00073,00057,40056,100 Brazil
13,80013,80013,06011,35912,0439,796 Canada
211,000211,000205,600192,780177,245163,974 China
5,6005,6005,8005,5006,5006,280 Egypt
65,02565,62558,53968,08958,26559,147 European Union
22,50021,50022,23021,76021,73016,720 India
9,2009,2008,0008,8506,8006,900 Indonesia
22,00023,00021,50018,72621,05820,374 Mexico
7,7007,7007,6309,2508,8008,950 Nigeria
7,4007,4007,2677,1307,2716,231 Philippines
9,0009,5008,2136,9623,0753,963 Russia
6,7007,0003,5006,4006,8006,400 Serbia
13,00013,00012,20012,75910,92413,420 South Africa
29,00026,00020,92222,83811,91910,486 Ukraine
86,62486,16483,98582,92980,48477,878 Others
607,549605,489584,946569,332515,514491,619 Subtotal
349,597354,346273,832313,949316,165332,549 United States
957,146959,835858,778883,281831,679824,168 World Total
none
Total Consumption
8,3008,3007,3007,0007,3006,900 Argentina
54,00054,00053,00050,50049,50047,000 Brazil
12,80012,80011,90011,63611,76111,868 Canada
224,000224,000207,000188,000180,000165,000 China
11,20010,90011,20011,70012,50012,000 Egypt
70,00070,00069,00069,20064,90061,300 European Union
18,40017,90017,40017,20018,10015,100 India
11,10011,20010,90010,5009,8008,800 Indonesia
15,50015,50014,50014,90015,70016,300 Japan
8,8008,3008,8007,8158,2148,382 Korea, South
29,00029,00027,00029,00029,50030,200 Mexico
7,7007,7007,8009,2508,8008,800 Nigeria
7,5007,5007,4007,4007,2006,500 Philippines
11,00011,00010,80010,70010,65010,300 South Africa
9,1008,6007,7007,8006,5005,700 Ukraine
138,682138,822133,498130,591125,009123,083 Others
639,241640,316601,362600,148564,377544,226 Subtotal
290,844292,114266,711279,035285,123281,615 United States
930,085932,430868,073879,183849,500825,841 World Total
none
Ending Stocks
13,31012,81012,5109,21010,2769,989 Brazil
1,9251,9251,4251,3651,2631,731 Canada
54,83554,83560,88559,33549,41551,302 China
5,6015,4015,5766,9375,2225,568 European Union
2,0161,7661,1661,3161,1121,389 Mexico
3,2263,2263,2013,6763,4185,169 South Africa
2,7731,7738231,0511,121672 Ukraine
19,81119,46719,24924,39027,83326,925 Others
103,497101,203104,835107,28099,660102,745 Subtotal
46,67149,76918,27225,12228,64443,380 United States
150,168150,972123,107132,402128,304146,125 World Total
August 2013
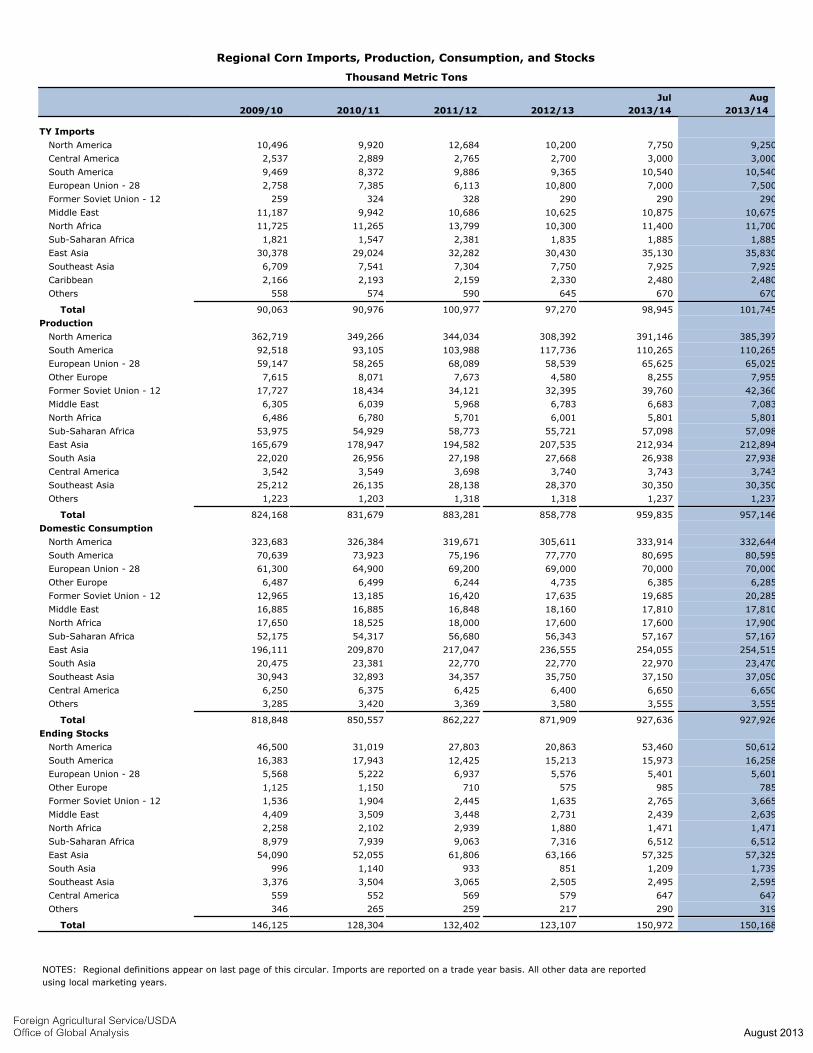
Regional Corn Imports, Production, Consumption, and Stocks
Thousand Metric Tons
2009/10 2010/11 2011/12 2012/13
Jul
2013/14
Aug
2013/14
TY Imports none
10,496 North America 9,920 12,684 10,200 7,750 9,250
2,537 Central America 2,889 2,765 2,700 3,000 3,000
9,469 South America 8,372 9,886 9,365 10,540 10,540
2,758 European Union - 28 7,385 6,113 10,800 7,000 7,500
259 Former Soviet Union - 12 324 328 290 290 290
11,187 Middle East 9,942 10,686 10,625 10,875 10,675
11,725 North Africa 11,265 13,799 10,300 11,400 11,700
1,821 Sub-Saharan Africa 1,547 2,381 1,835 1,885 1,885
30,378 East Asia 29,024 32,282 30,430 35,130 35,830
6,709 Southeast Asia 7,541 7,304 7,750 7,925 7,925
2,166 Caribbean 2,193 2,159 2,330 2,480 2,480
558 Others 574 590 645 670 670
90,063 Total 90,976 100,977 97,270 98,945 101,745
Production none
362,719 North America 349,266 344,034 308,392 391,146 385,397
92,518 South America 93,105 103,988 117,736 110,265 110,265
59,147 European Union - 28 58,265 68,089 58,539 65,625 65,025
7,615 Other Europe 8,071 7,673 4,580 8,255 7,955
17,727 Former Soviet Union - 12 18,434 34,121 32,395 39,760 42,360
6,305 Middle East 6,039 5,968 6,783 6,683 7,083
6,486 North Africa 6,780 5,701 6,001 5,801 5,801
53,975 Sub-Saharan Africa 54,929 58,773 55,721 57,098 57,098
165,679 East Asia 178,947 194,582 207,535 212,934 212,894
22,020 South Asia 26,956 27,198 27,668 26,938 27,938
3,542 Central America 3,549 3,698 3,740 3,743 3,743
25,212 Southeast Asia 26,135 28,138 28,370 30,350 30,350
1,223 Others 1,203 1,318 1,318 1,237 1,237
824,168 Total 831,679 883,281 858,778 959,835 957,146
Domestic Consumption none
323,683 North America 326,384 319,671 305,611 333,914 332,644
70,639 South America 73,923 75,196 77,770 80,695 80,595
61,300 European Union - 28 64,900 69,200 69,000 70,000 70,000
6,487 Other Europe 6,499 6,244 4,735 6,385 6,285
12,965 Former Soviet Union - 12 13,185 16,420 17,635 19,685 20,285
16,885 Middle East 16,885 16,848 18,160 17,810 17,810
17,650 North Africa 18,525 18,000 17,600 17,600 17,900
52,175 Sub-Saharan Africa 54,317 56,680 56,343 57,167 57,167
196,111 East Asia 209,870 217,047 236,555 254,055 254,515
20,475 South Asia 23,381 22,770 22,770 22,970 23,470
30,943 Southeast Asia 32,893 34,357 35,750 37,150 37,050
6,250 Central America 6,375 6,425 6,400 6,650 6,650
3,285 Others 3,420 3,369 3,580 3,555 3,555
818,848 Total 850,557 862,227 871,909 927,636 927,926
Ending Stocks none
46,500 North America 31,019 27,803 20,863 53,460 50,612
16,383 South America 17,943 12,425 15,213 15,973 16,258
5,568 European Union - 28 5,222 6,937 5,576 5,401 5,601
1,125 Other Europe 1,150 710 575 985 785
1,536 Former Soviet Union - 12 1,904 2,445 1,635 2,765 3,665
4,409 Middle East 3,509 3,448 2,731 2,439 2,639
2,258 North Africa 2,102 2,939 1,880 1,471 1,471
8,979 Sub-Saharan Africa 7,939 9,063 7,316 6,512 6,512
54,090 East Asia 52,055 61,806 63,166 57,325 57,325
996 South Asia 1,140 933 851 1,209 1,739
3,376 Southeast Asia 3,504 3,065 2,505 2,495 2,595
559 Central America 552 569 579 647 647
346 Others 265 259 217 290 319
146,125 Total 128,304 132,402 123,107 150,972 150,168
NOTES: Regional definitions appear on last page of this circular. Imports are reported on a trade year basis. All other data are reported
using local marketing years.
August 2013
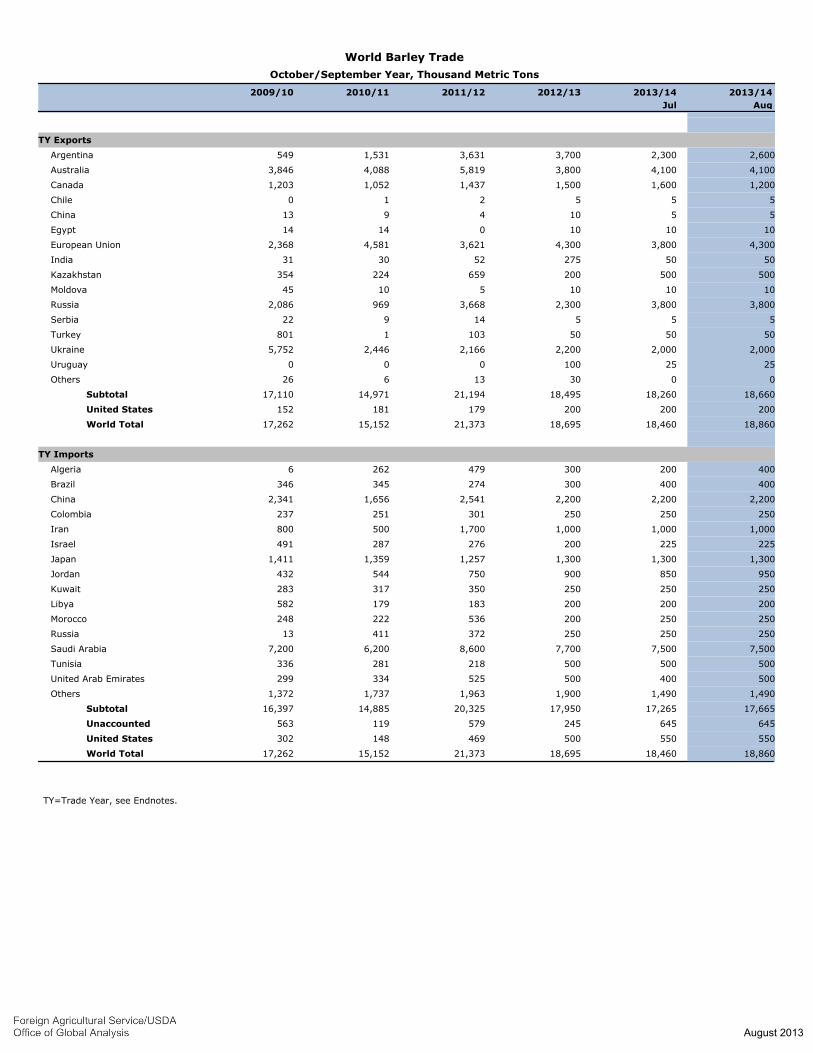
World Barley Trade
October/September Year, Thousand Metric Tons
2009/10 2010/11 2011/12 2012/13 2013/14
Jul
2013/14
Aug
none
TY Exports
2,6002,3003,7003,6311,531549 Argentina
4,1004,1003,8005,8194,0883,846 Australia
1,2001,6001,5001,4371,0521,203 Canada
555210 Chile
55104913 China
10101001414 Egypt
4,3003,8004,3003,6214,5812,368 European Union
5050275523031 India
500500200659224354 Kazakhstan
10101051045 Moldova
3,8003,8002,3003,6689692,086 Russia
55514922 Serbia
5050501031801 Turkey
2,0002,0002,2002,1662,4465,752 Ukraine
2525100000 Uruguay
003013626 Others
18,66018,26018,49521,19414,97117,110 Subtotal
200200200179181152 United States
18,86018,46018,69521,37315,15217,262 World Total
none
TY Imports
4002003004792626 Algeria
400400300274345346 Brazil
2,2002,2002,2002,5411,6562,341 China
250250250301251237 Colombia
1,0001,0001,0001,700500800 Iran
225225200276287491 Israel
1,3001,3001,3001,2571,3591,411 Japan
950850900750544432 Jordan
250250250350317283 Kuwait
200200200183179582 Libya
250250200536222248 Morocco
25025025037241113 Russia
7,5007,5007,7008,6006,2007,200 Saudi Arabia
500500500218281336 Tunisia
500400500525334299 United Arab Emirates
1,4901,4901,9001,9631,7371,372 Others
17,66517,26517,95020,32514,88516,397 Subtotal
645645245579119563 Unaccounted
550550500469148302 United States
18,86018,46018,69521,37315,15217,262 World Total
TY=Trade Year, see Endnotes.
August 2013
World Barley Production, Consumption, and Stocks
Local Marketing Years, Thousand Metric Tons
2009/10 2010/11 2011/12 2012/13 2013/14
Jul
2013/14
Aug
none
Production
1,7501,7501,5001,3501,5002,400 Algeria
4,3004,0005,2004,5002,9501,356 Argentina
7,4007,4006,7618,2217,9957,865 Australia
1,7001,7002,1002,0131,9662,123 Belarus
8,5009,0008,0107,8927,6279,528 Canada
2,3002,3002,3502,3001,9722,318 China
1,6321,6321,6201,5921,5251,569 Ethiopia
57,11756,04654,57252,02653,69162,393 European Union
1,7401,7001,6201,6601,3501,690 India
3,4003,4003,4002,9003,2103,446 Iran
2,2002,2001,5002,5931,3132,519 Kazakhstan
2,6002,6001,2002,3402,5703,800 Morocco
17,50017,50013,95216,9388,35017,881 Russia
7,3007,1005,5007,0005,9006,500 Turkey
7,0007,0006,9359,0988,48411,833 Ukraine
8,9218,8718,3048,4758,2798,682 Others
135,360134,199124,524130,898118,682145,903 Subtotal
4,7364,7794,7963,3923,9254,949 United States
140,096138,978129,320134,290122,607150,852 World Total
none
Total Consumption
2,1502,1502,0001,8001,6001,350 Algeria
3,3003,3003,1003,3004,2004,500 Australia
1,9001,9002,2002,1002,0002,200 Belarus
7,0007,0006,8006,9167,4648,717 Canada
4,6004,6004,5004,6004,0504,500 China
1,6501,6501,4321,5351,5251,550 Ethiopia
52,22051,87051,82051,23056,61056,770 European Union
1,7001,6501,5251,5501,3501,500 India
4,2004,2004,5003,9003,7003,700 Iran
1,6501,6501,3751,8251,4752,000 Kazakhstan
2,8002,8001,9003,1003,0502,900 Morocco
13,30013,30012,10014,3009,50016,650 Russia
7,9257,9257,9257,2256,3257,425 Saudi Arabia
6,8506,7006,1006,7506,0005,900 Turkey
5,1005,1005,0006,3006,0005,600 Ukraine
15,91215,56215,34515,32614,71614,805 Others
132,926132,126127,607131,537131,278140,373 Subtotal
5,0065,0074,6684,1924,5374,604 United States
137,932137,133132,275135,729135,815144,977 World Total
none
Ending Stocks
1,2351,0351,2351,4351,2361,247 Algeria
1,2551,3559301,1951,5022,502 Canada
5,0334,8644,3366,1847,93815,552 European Union
1,9781,9781,7781,3781,1781,268 Iran
1,3001,3006508481,3862,395 Russia
2,1782,1782,6032,7281,2532,078 Saudi Arabia
9678671,0371,1727941,067 Ukraine
6,1576,2955,4266,4526,9058,721 Others
20,10319,87217,99521,39222,19234,830 Subtotal
1,8041,8461,7481,3061,9452,515 United States
21,90721,71819,74322,69824,13737,345 World Total
August 2013
Regional Barley Imports, Production, Consumption, and Stocks
Thousand Metric Tons
2009/10 2010/11 2011/12 2012/13
Jul
2013/14
Aug
2013/14
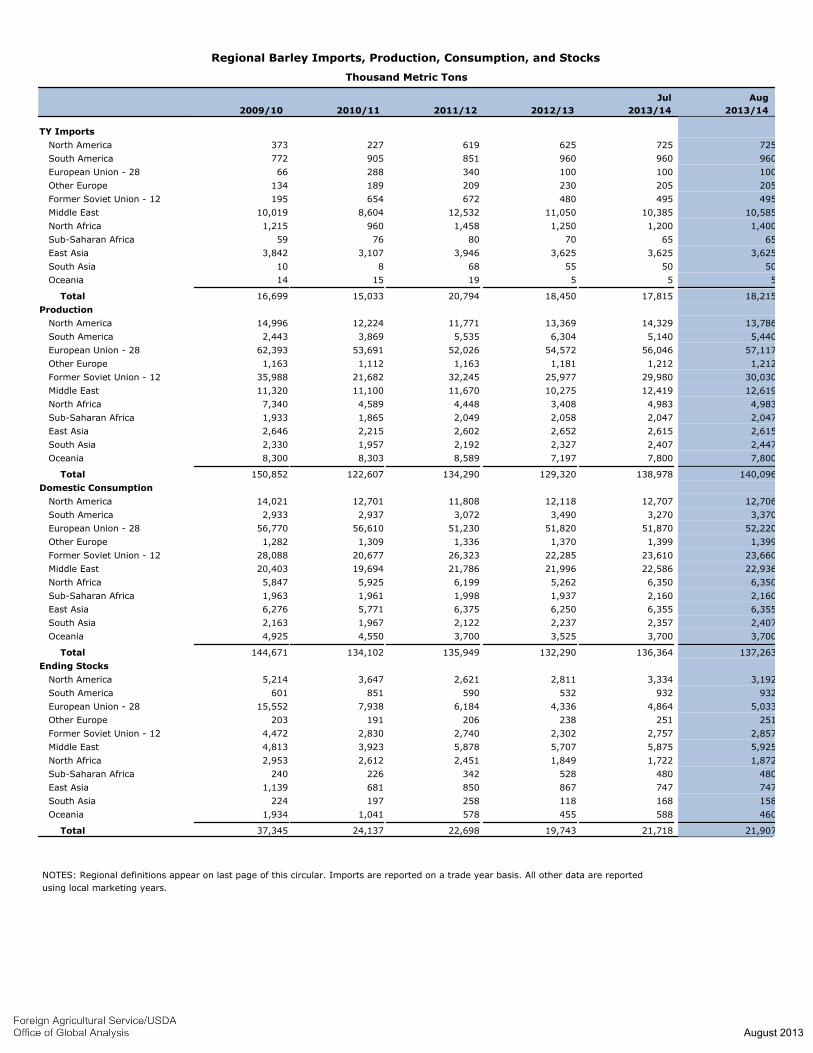
TY Imports none
373 North America 227 619 625 725 725
772 South America 905 851 960 960 960
66 European Union - 28 288 340 100 100 100
134 Other Europe 189 209 230 205 205
195 Former Soviet Union - 12 654 672 480 495 495
10,019 Middle East 8,604 12,532 11,050 10,385 10,585
1,215 North Africa 960 1,458 1,250 1,200 1,400
59 Sub-Saharan Africa 76 80 70 65 65
3,842 East Asia 3,107 3,946 3,625 3,625 3,625
10 South Asia 8 68 55 50 50
14 Oceania 15 19 5 5 5
16,699 Total 15,033 20,794 18,450 17,815 18,215
Production none
14,996 North America 12,224 11,771 13,369 14,329 13,786
2,443 South America 3,869 5,535 6,304 5,140 5,440
62,393 European Union - 28 53,691 52,026 54,572 56,046 57,117
1,163 Other Europe 1,112 1,163 1,181 1,212 1,212
35,988 Former Soviet Union - 12 21,682 32,245 25,977 29,980 30,030
11,320 Middle East 11,100 11,670 10,275 12,419 12,619
7,340 North Africa 4,589 4,448 3,408 4,983 4,983
1,933 Sub-Saharan Africa 1,865 2,049 2,058 2,047 2,047
2,646 East Asia 2,215 2,602 2,652 2,615 2,615
2,330 South Asia 1,957 2,192 2,327 2,407 2,447
8,300 Oceania 8,303 8,589 7,197 7,800 7,800
150,852 Total 122,607 134,290 129,320 138,978 140,096
Domestic Consumption none
14,021 North America 12,701 11,808 12,118 12,707 12,706
2,933 South America 2,937 3,072 3,490 3,270 3,370
56,770 European Union - 28 56,610 51,230 51,820 51,870 52,220
1,282 Other Europe 1,309 1,336 1,370 1,399 1,399
28,088 Former Soviet Union - 12 20,677 26,323 22,285 23,610 23,660
20,403 Middle East 19,694 21,786 21,996 22,586 22,936
5,847 North Africa 5,925 6,199 5,262 6,350 6,350
1,963 Sub-Saharan Africa 1,961 1,998 1,937 2,160 2,160
6,276 East Asia 5,771 6,375 6,250 6,355 6,355
2,163 South Asia 1,967 2,122 2,237 2,357 2,407
4,925 Oceania 4,550 3,700 3,525 3,700 3,700
144,671 Total 134,102 135,949 132,290 136,364 137,263
Ending Stocks none
5,214 North America 3,647 2,621 2,811 3,334 3,192
601 South America 851 590 532 932 932
15,552 European Union - 28 7,938 6,184 4,336 4,864 5,033
203 Other Europe 191 206 238 251 251
4,472 Former Soviet Union - 12 2,830 2,740 2,302 2,757 2,857
4,813 Middle East 3,923 5,878 5,707 5,875 5,925
2,953 North Africa 2,612 2,451 1,849 1,722 1,872
240 Sub-Saharan Africa 226 342 528 480 480
1,139 East Asia 681 850 867 747 747
224 South Asia 197 258 118 168 158
1,934 Oceania 1,041 578 455 588 460
37,345 Total 24,137 22,698 19,743 21,718 21,907
NOTES: Regional definitions appear on last page of this circular. Imports are reported on a trade year basis. All other data are reported
using local marketing years.
August 2013
World Sorghum Trade
October/September Year, Thousand Metric Tons
2009/10 2010/11 2011/12 2012/13 2013/14
Jul
2013/14
Aug
none
TY Exports
3,0003,0003,6002,1631,8931,507 Argentina
9009001,0001,185575350 Australia
505050366841 China
75757575750 Ethiopia
252520013231124 India
50500756050 Nigeria
1501501501133441 Ukraine
13013014512880178 Others
4,3804,3805,2203,9072,8162,291 Subtotal
3,8003,8001,9001,5493,8274,032 United States
8,1808,1807,1205,4566,6436,323 World Total
none
TY Imports
600600600544729568 Chile
40020020084483 China
800800800592391212 Colombia
1751753501269227 European Union
1,6001,6001,7001,4811,4181,649 Japan
3,5003,5002,0001,3692,3792,486 Mexico
606060595731 Peru
1001001006954 Saudi Arabia
100100100125200400 Sudan
100100100849771 Taiwan
435435490525509795 Others
7,8707,6706,5005,0586,7116,306 Subtotal
310510320395-6917 Unaccounted
00300310 United States
8,1808,1807,1205,4566,6436,323 World Total
TY=Trade Year, see Endnotes.
August 2013
World Sorghum Production, Consumption, and Stocks
Local Marketing Years, Thousand Metric Tons
2009/10 2010/11 2011/12 2012/13 2013/14
Jul
2013/14
Aug
none
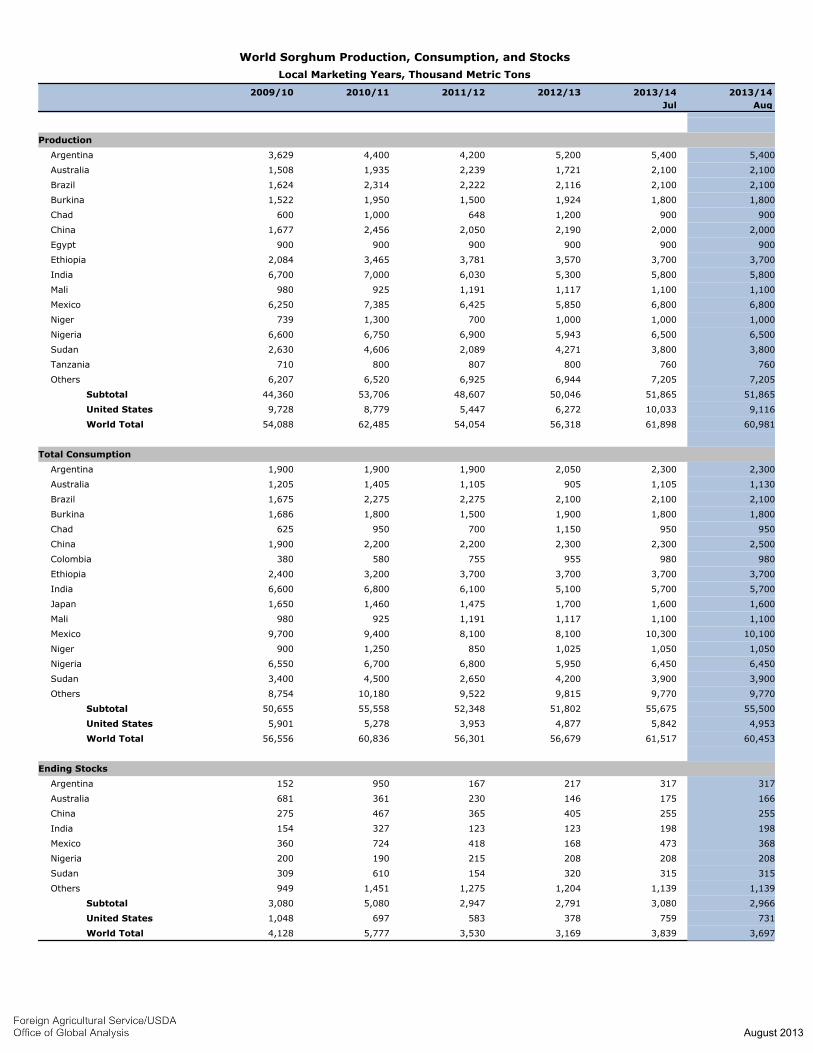
Production
5,4005,4005,2004,2004,4003,629 Argentina
2,1002,1001,7212,2391,9351,508 Australia
2,1002,1002,1162,2222,3141,624 Brazil
1,8001,8001,9241,5001,9501,522 Burkina
9009001,2006481,000600 Chad
2,0002,0002,1902,0502,4561,677 China
900900900900900900 Egypt
3,7003,7003,5703,7813,4652,084 Ethiopia
5,8005,8005,3006,0307,0006,700 India
1,1001,1001,1171,191925980 Mali
6,8006,8005,8506,4257,3856,250 Mexico
1,0001,0001,0007001,300739 Niger
6,5006,5005,9436,9006,7506,600 Nigeria
3,8003,8004,2712,0894,6062,630 Sudan
760760800807800710 Tanzania
7,2057,2056,9446,9256,5206,207 Others
51,86551,86550,04648,60753,70644,360 Subtotal
9,11610,0336,2725,4478,7799,728 United States
60,98161,89856,31854,05462,48554,088 World Total
none
Total Consumption
2,3002,3002,0501,9001,9001,900 Argentina
1,1301,1059051,1051,4051,205 Australia
2,1002,1002,1002,2752,2751,675 Brazil
1,8001,8001,9001,5001,8001,686 Burkina
9509501,150700950625 Chad
2,5002,3002,3002,2002,2001,900 China
980980955755580380 Colombia
3,7003,7003,7003,7003,2002,400 Ethiopia
5,7005,7005,1006,1006,8006,600 India
1,6001,6001,7001,4751,4601,650 Japan
1,1001,1001,1171,191925980 Mali
10,10010,3008,1008,1009,4009,700 Mexico
1,0501,0501,0258501,250900 Niger
6,4506,4505,9506,8006,7006,550 Nigeria
3,9003,9004,2002,6504,5003,400 Sudan
9,7709,7709,8159,52210,1808,754 Others
55,50055,67551,80252,34855,55850,655 Subtotal
4,9535,8424,8773,9535,2785,901 United States
60,45361,51756,67956,30160,83656,556 World Total
none
Ending Stocks
317317217167950152 Argentina
166175146230361681 Australia
255255405365467275 China
198198123123327154 India
368473168418724360 Mexico
208208208215190200 Nigeria
315315320154610309 Sudan
1,1391,1391,2041,2751,451949 Others
2,9663,0802,7912,9475,0803,080 Subtotal
7317593785836971,048 United States
3,6973,8393,1693,5305,7774,128 World Total
August 2013
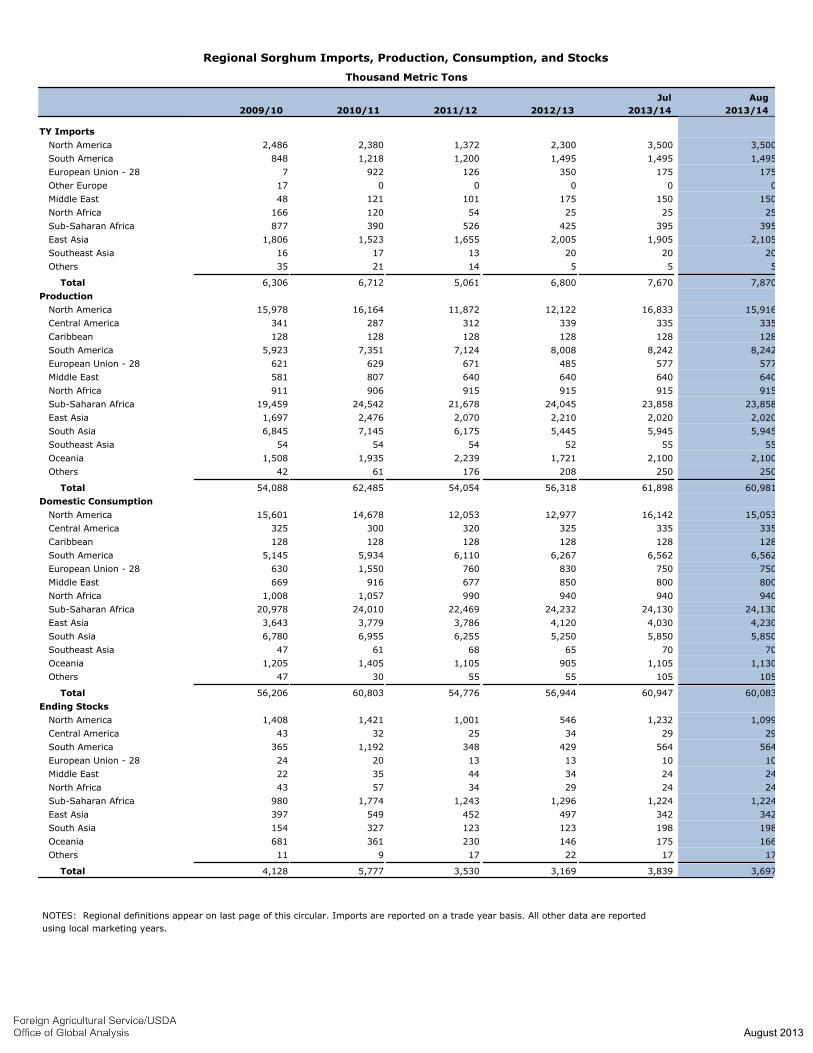
Regional Sorghum Imports, Production, Consumption, and Stocks
Thousand Metric Tons
2009/10 2010/11 2011/12 2012/13
Jul
2013/14
Aug
2013/14
TY Imports none
2,486 North America 2,380 1,372 2,300 3,500 3,500
848 South America 1,218 1,200 1,495 1,495 1,495
7 European Union - 28 922 126 350 175 175
17 Other Europe 0 0 0 0 0
48 Middle East 121 101 175 150 150
166 North Africa 120 54 25 25 25
877 Sub-Saharan Africa 390 526 425 395 395
1,806 East Asia 1,523 1,655 2,005 1,905 2,105
16 Southeast Asia 17 13 20 20 20
35 Others 21 14 5 5 5
6,306 Total 6,712 5,061 6,800 7,670 7,870
Production none
15,978 North America 16,164 11,872 12,122 16,833 15,916
341 Central America 287 312 339 335 335
128 Caribbean 128 128 128 128 128
5,923 South America 7,351 7,124 8,008 8,242 8,242
621 European Union - 28 629 671 485 577 577
581 Middle East 807 640 640 640 640
911 North Africa 906 915 915 915 915
19,459 Sub-Saharan Africa 24,542 21,678 24,045 23,858 23,858
1,697 East Asia 2,476 2,070 2,210 2,020 2,020
6,845 South Asia 7,145 6,175 5,445 5,945 5,945
54 Southeast Asia 54 54 52 55 55
1,508 Oceania 1,935 2,239 1,721 2,100 2,100
42 Others 61 176 208 250 250
54,088 Total 62,485 54,054 56,318 61,898 60,981
Domestic Consumption none
15,601 North America 14,678 12,053 12,977 16,142 15,053
325 Central America 300 320 325 335 335
128 Caribbean 128 128 128 128 128
5,145 South America 5,934 6,110 6,267 6,562 6,562
630 European Union - 28 1,550 760 830 750 750
669 Middle East 916 677 850 800 800
1,008 North Africa 1,057 990 940 940 940
20,978 Sub-Saharan Africa 24,010 22,469 24,232 24,130 24,130
3,643 East Asia 3,779 3,786 4,120 4,030 4,230
6,780 South Asia 6,955 6,255 5,250 5,850 5,850
47 Southeast Asia 61 68 65 70 70
1,205 Oceania 1,405 1,105 905 1,105 1,130
47 Others 30 55 55 105 105
56,206 Total 60,803 54,776 56,944 60,947 60,083
Ending Stocks none
1,408 North America 1,421 1,001 546 1,232 1,099
43 Central America 32 25 34 29 29
365 South America 1,192 348 429 564 564
24 European Union - 28 20 13 13 10 10
22 Middle East 35 44 34 24 24
43 North Africa 57 34 29 24 24
980 Sub-Saharan Africa 1,774 1,243 1,296 1,224 1,224
397 East Asia 549 452 497 342 342
154 South Asia 327 123 123 198 198
681 Oceania 361 230 146 175 166
11 Others 9 17 22 17 17
4,128 Total 5,777 3,530 3,169 3,839 3,697
NOTES: Regional definitions appear on last page of this circular. Imports are reported on a trade year basis. All other data are reported
using local marketing years.
August 2013
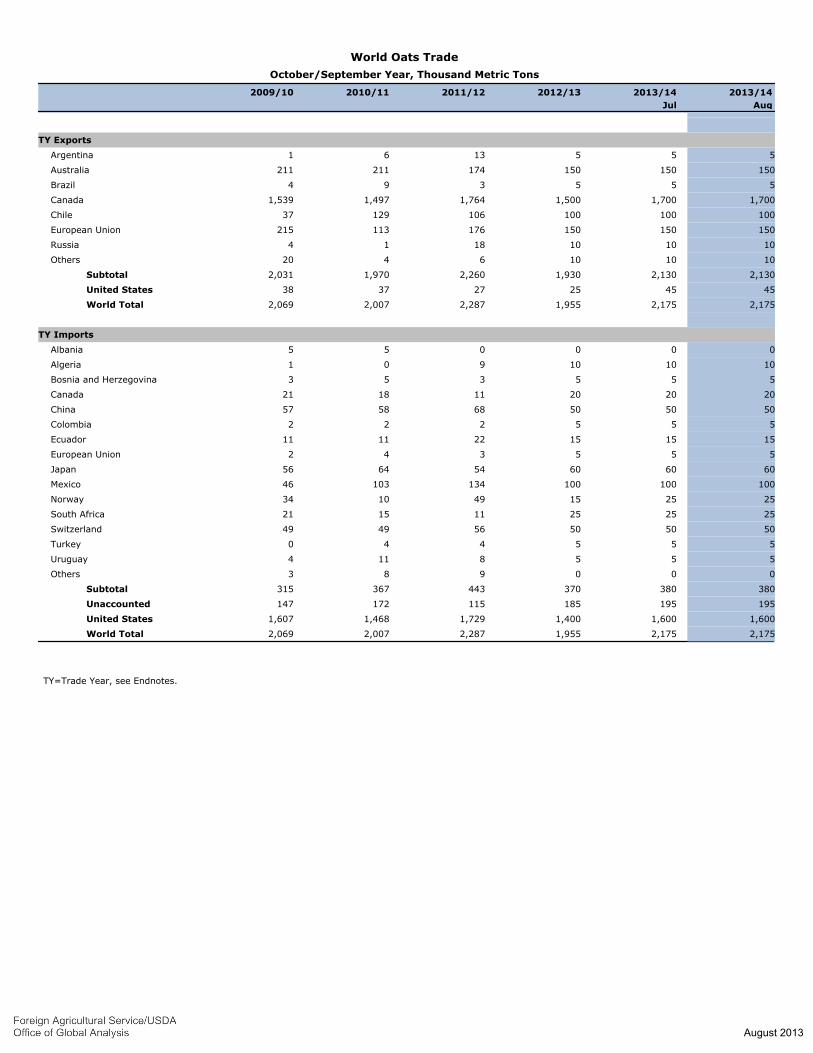
World Oats Trade
October/September Year, Thousand Metric Tons
2009/10 2010/11 2011/12 2012/13 2013/14
Jul
2013/14
Aug
none
TY Exports
5551361 Argentina
150150150174211211 Australia
555394 Brazil
1,7001,7001,5001,7641,4971,539 Canada
10010010010612937 Chile
150150150176113215 European Union
1010101814 Russia
1010106420 Others
2,1302,1301,9302,2601,9702,031 Subtotal
454525273738 United States
2,1752,1751,9552,2872,0072,069 World Total
none
TY Imports
000055 Albania
101010901 Algeria
555353 Bosnia and Herzegovina
202020111821 Canada
505050685857 China
555222 Colombia
151515221111 Ecuador
555342 European Union
606060546456 Japan
10010010013410346 Mexico
252515491034 Norway
252525111521 South Africa
505050564949 Switzerland
555440 Turkey
5558114 Uruguay
000983 Others
380380370443367315 Subtotal
195195185115172147 Unaccounted
1,6001,6001,4001,7291,4681,607 United States
2,1752,1751,9552,2872,0072,069 World Total
TY=Trade Year, see Endnotes.
August 2013
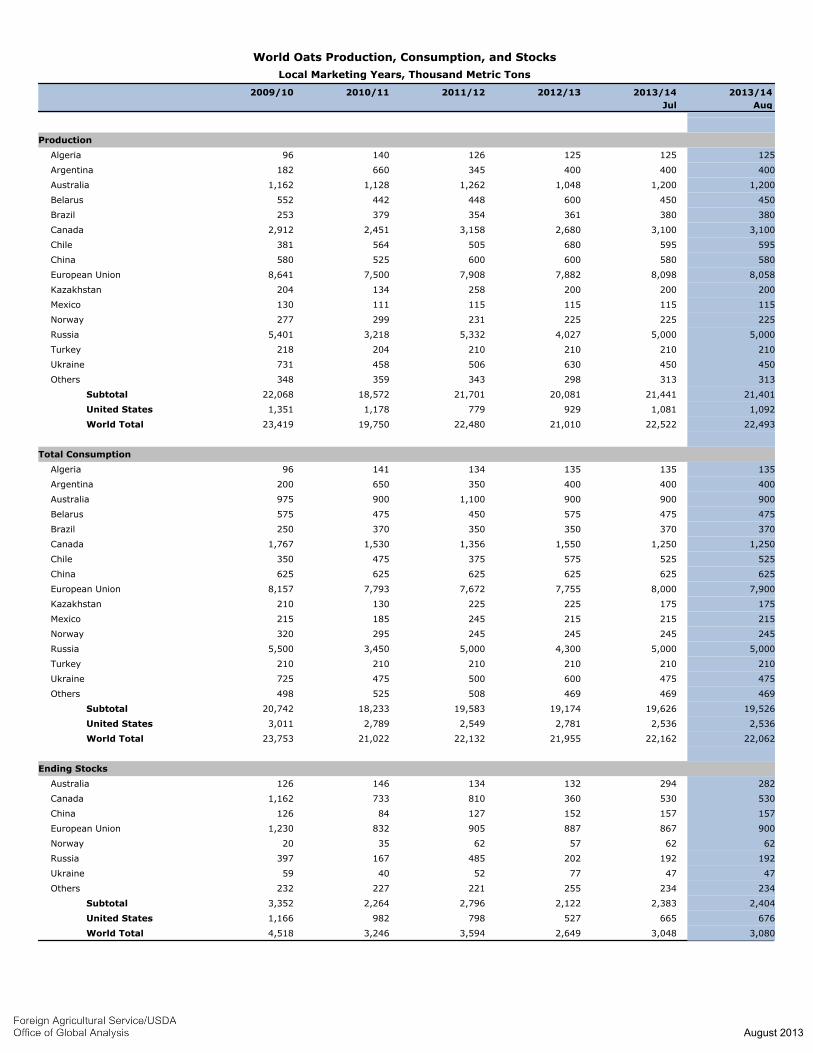
World Oats Production, Consumption, and Stocks
Local Marketing Years, Thousand Metric Tons
2009/10 2010/11 2011/12 2012/13 2013/14
Jul
2013/14
Aug
none
Production
12512512512614096 Algeria
400400400345660182 Argentina
1,2001,2001,0481,2621,1281,162 Australia
450450600448442552 Belarus
380380361354379253 Brazil
3,1003,1002,6803,1582,4512,912 Canada
595595680505564381 Chile
580580600600525580 China
8,0588,0987,8827,9087,5008,641 European Union
200200200258134204 Kazakhstan
115115115115111130 Mexico
225225225231299277 Norway
5,0005,0004,0275,3323,2185,401 Russia
210210210210204218 Turkey
450450630506458731 Ukraine
313313298343359348 Others
21,40121,44120,08121,70118,57222,068 Subtotal
1,0921,0819297791,1781,351 United States
22,49322,52221,01022,48019,75023,419 World Total
none
Total Consumption
13513513513414196 Algeria
400400400350650200 Argentina
9009009001,100900975 Australia
475475575450475575 Belarus
370370350350370250 Brazil
1,2501,2501,5501,3561,5301,767 Canada
525525575375475350 Chile
625625625625625625 China
7,9008,0007,7557,6727,7938,157 European Union
175175225225130210 Kazakhstan
215215215245185215 Mexico
245245245245295320 Norway
5,0005,0004,3005,0003,4505,500 Russia
210210210210210210 Turkey
475475600500475725 Ukraine
469469469508525498 Others
19,52619,62619,17419,58318,23320,742 Subtotal
2,5362,5362,7812,5492,7893,011 United States
22,06222,16221,95522,13221,02223,753 World Total
none
Ending Stocks
282294132134146126 Australia
5305303608107331,162 Canada
15715715212784126 China
9008678879058321,230 European Union
626257623520 Norway
192192202485167397 Russia
474777524059 Ukraine
234234255221227232 Others
2,4042,3832,1222,7962,2643,352 Subtotal
6766655277989821,166 United States
3,0803,0482,6493,5943,2464,518 World Total
August 2013
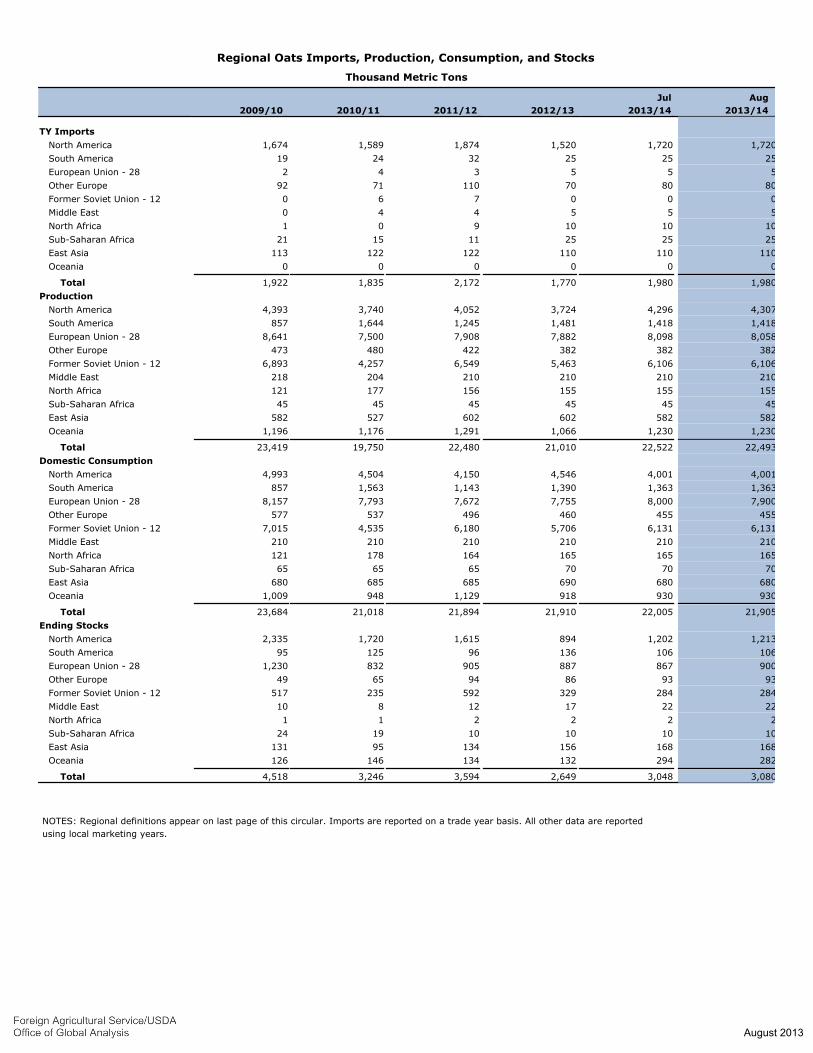
Regional Oats Imports, Production, Consumption, and Stocks
Thousand Metric Tons
2009/10 2010/11 2011/12 2012/13
Jul
2013/14
Aug
2013/14
TY Imports none
1,674 North America 1,589 1,874 1,520 1,720 1,720
19 South America 24 32 25 25 25
2 European Union - 28 4 3 5 5 5
92 Other Europe 71 110 70 80 80
0 Former Soviet Union - 12 6 7 0 0 0
0 Middle East 4 4 5 5 5
1 North Africa 0 9 10 10 10
21 Sub-Saharan Africa 15 11 25 25 25
113 East Asia 122 122 110 110 110
0 Oceania 0 0 0 0 0
1,922 Total 1,835 2,172 1,770 1,980 1,980
Production none
4,393 North America 3,740 4,052 3,724 4,296 4,307
857 South America 1,644 1,245 1,481 1,418 1,418
8,641 European Union - 28 7,500 7,908 7,882 8,098 8,058
473 Other Europe 480 422 382 382 382
6,893 Former Soviet Union - 12 4,257 6,549 5,463 6,106 6,106
218 Middle East 204 210 210 210 210
121 North Africa 177 156 155 155 155
45 Sub-Saharan Africa 45 45 45 45 45
582 East Asia 527 602 602 582 582
1,196 Oceania 1,176 1,291 1,066 1,230 1,230
23,419 Total 19,750 22,480 21,010 22,522 22,493
Domestic Consumption none
4,993 North America 4,504 4,150 4,546 4,001 4,001
857 South America 1,563 1,143 1,390 1,363 1,363
8,157 European Union - 28 7,793 7,672 7,755 8,000 7,900
577 Other Europe 537 496 460 455 455
7,015 Former Soviet Union - 12 4,535 6,180 5,706 6,131 6,131
210 Middle East 210 210 210 210 210
121 North Africa 178 164 165 165 165
65 Sub-Saharan Africa 65 65 70 70 70
680 East Asia 685 685 690 680 680
1,009 Oceania 948 1,129 918 930 930
23,684 Total 21,018 21,894 21,910 22,005 21,905
Ending Stocks none
2,335 North America 1,720 1,615 894 1,202 1,213
95 South America 125 96 136 106 106
1,230 European Union - 28 832 905 887 867 900
49 Other Europe 65 94 86 93 93
517 Former Soviet Union - 12 235 592 329 284 284
10 Middle East 8 12 17 22 22
1 North Africa 1 2 2 2 2
24 Sub-Saharan Africa 19 10 10 10 10
131 East Asia 95 134 156 168 168
126 Oceania 146 134 132 294 282
4,518 Total 3,246 3,594 2,649 3,048 3,080
NOTES: Regional definitions appear on last page of this circular. Imports are reported on a trade year basis. All other data are reported
using local marketing years.
August 2013
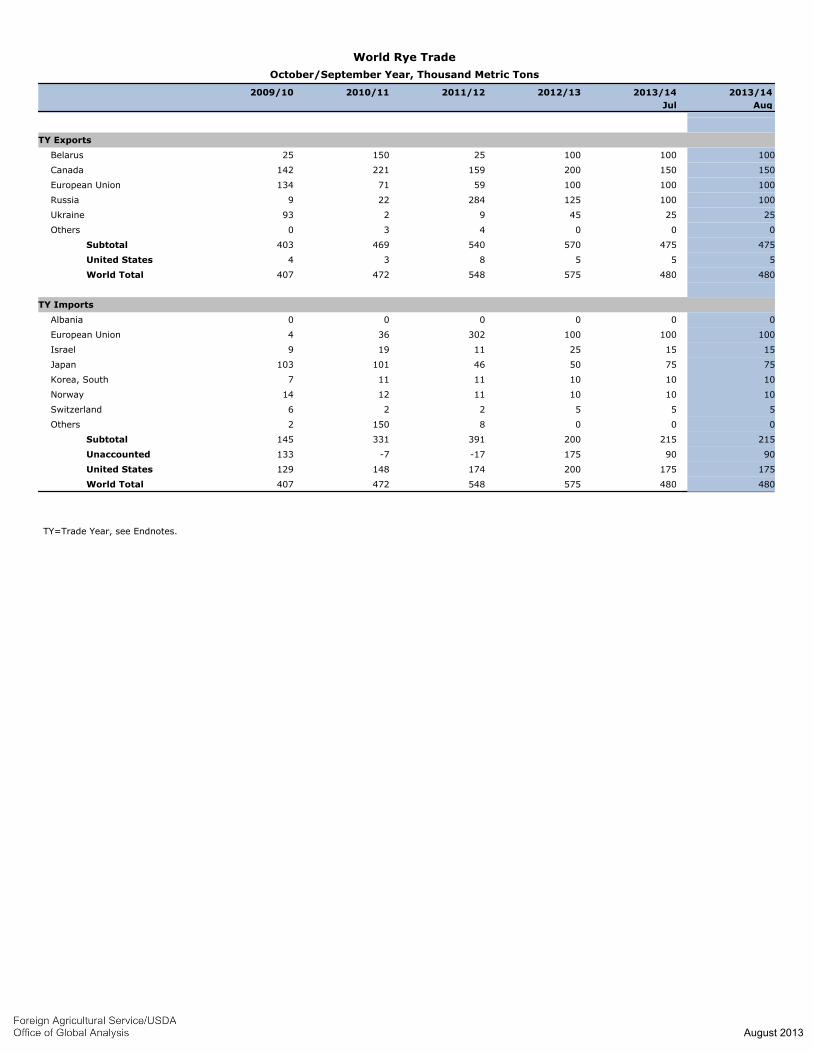
World Rye Trade
October/September Year, Thousand Metric Tons
2009/10 2010/11 2011/12 2012/13 2013/14
Jul
2013/14
Aug
none
TY Exports
1001001002515025 Belarus
150150200159221142 Canada
1001001005971134 European Union
100100125284229 Russia
2525459293 Ukraine
000430 Others
475475570540469403 Subtotal
555834 United States
480480575548472407 World Total
none
TY Imports
000000 Albania
100100100302364 European Union
15152511199 Israel
75755046101103 Japan
10101011117 Korea, South
101010111214 Norway
555226 Switzerland
00081502 Others
215215200391331145 Subtotal
9090175-17-7133 Unaccounted
175175200174148129 United States
480480575548472407 World Total
TY=Trade Year, see Endnotes.
August 2013
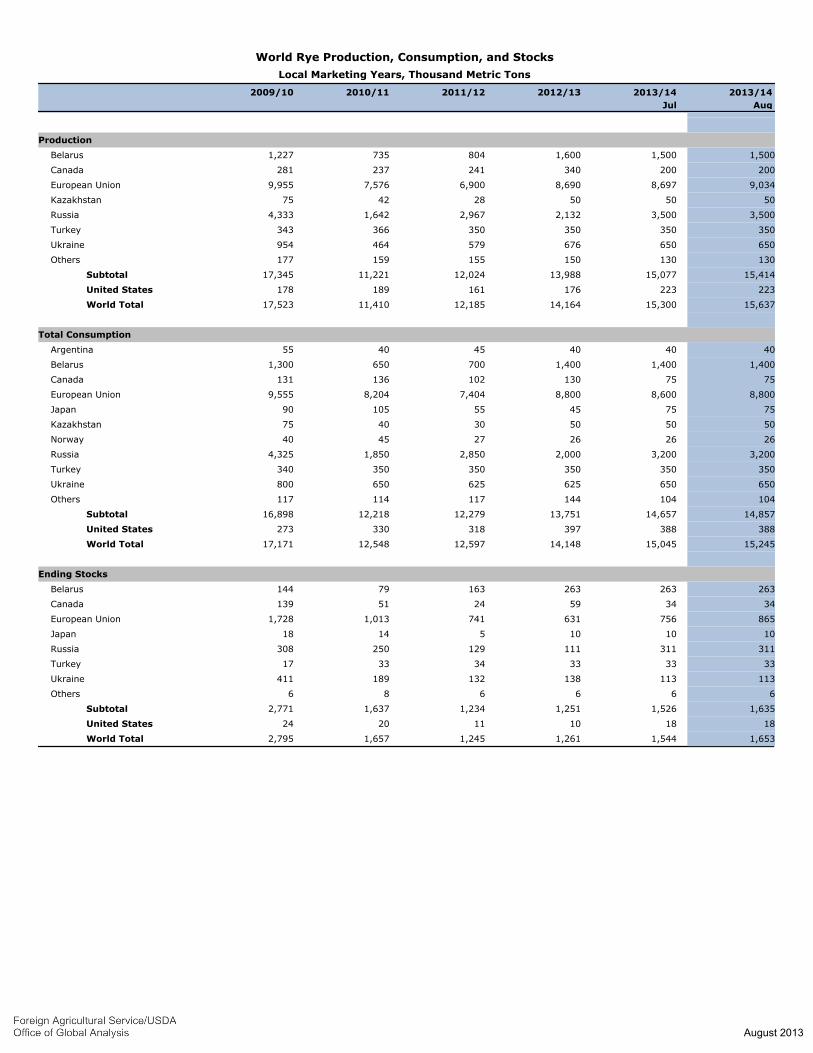
World Rye Production, Consumption, and Stocks
Local Marketing Years, Thousand Metric Tons
2009/10 2010/11 2011/12 2012/13 2013/14
Jul
2013/14
Aug
none
Production
1,5001,5001,6008047351,227 Belarus
200200340241237281 Canada
9,0348,6978,6906,9007,5769,955 European Union
505050284275 Kazakhstan
3,5003,5002,1322,9671,6424,333 Russia
350350350350366343 Turkey
650650676579464954 Ukraine
130130150155159177 Others
15,41415,07713,98812,02411,22117,345 Subtotal
223223176161189178 United States
15,63715,30014,16412,18511,41017,523 World Total
none
Total Consumption
404040454055 Argentina
1,4001,4001,4007006501,300 Belarus
7575130102136131 Canada
8,8008,6008,8007,4048,2049,555 European Union
7575455510590 Japan
505050304075 Kazakhstan
262626274540 Norway
3,2003,2002,0002,8501,8504,325 Russia
350350350350350340 Turkey
650650625625650800 Ukraine
104104144117114117 Others
14,85714,65713,75112,27912,21816,898 Subtotal
388388397318330273 United States
15,24515,04514,14812,59712,54817,171 World Total
none
Ending Stocks
26326326316379144 Belarus
3434592451139 Canada
8657566317411,0131,728 European Union
10101051418 Japan
311311111129250308 Russia
333333343317 Turkey
113113138132189411 Ukraine
666686 Others
1,6351,5261,2511,2341,6372,771 Subtotal
181810112024 United States
1,6531,5441,2611,2451,6572,795 World Total
August 2013
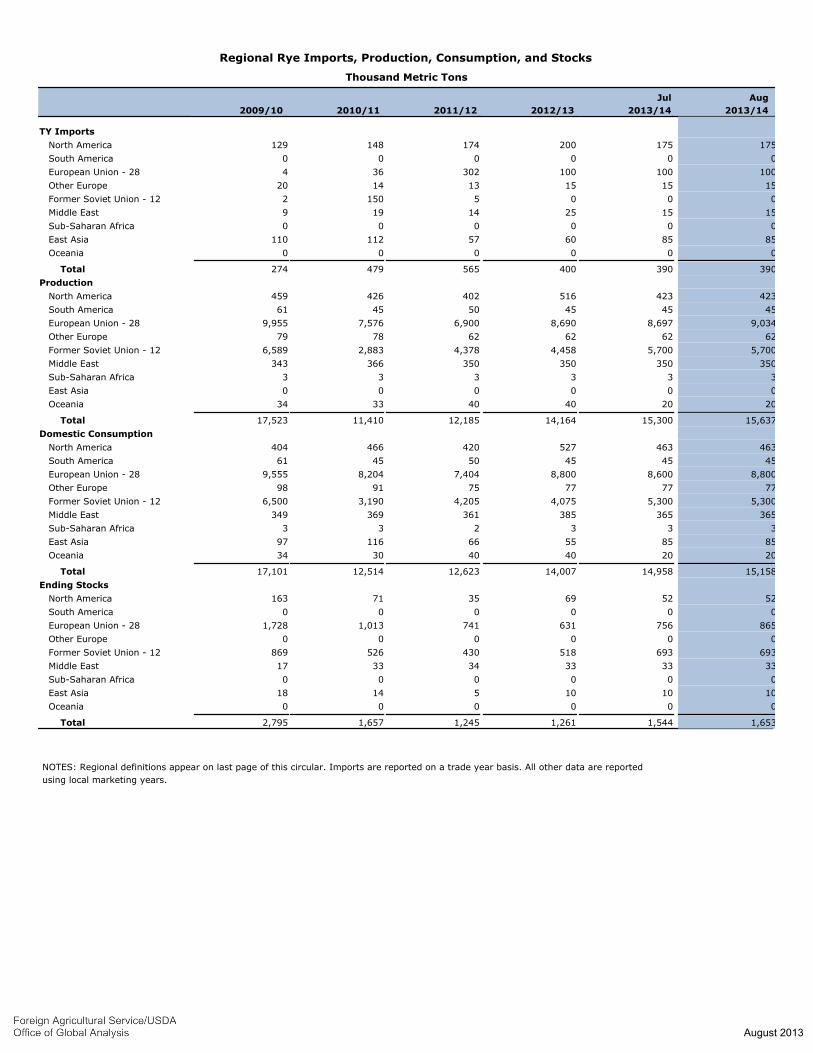
Regional Rye Imports, Production, Consumption, and Stocks
Thousand Metric Tons
2009/10 2010/11 2011/12 2012/13
Jul
2013/14
Aug
2013/14
TY Imports none
129 North America 148 174 200 175 175
0 South America 0 0 0 0 0
4 European Union - 28 36 302 100 100 100
20 Other Europe 14 13 15 15 15
2 Former Soviet Union - 12 150 5 0 0 0
9 Middle East 19 14 25 15 15
0 Sub-Saharan Africa 0 0 0 0 0
110 East Asia 112 57 60 85 85
0 Oceania 0 0 0 0 0
274 Total 479 565 400 390 390
Production none
459 North America 426 402 516 423 423
61 South America 45 50 45 45 45
9,955 European Union - 28 7,576 6,900 8,690 8,697 9,034
79 Other Europe 78 62 62 62 62
6,589 Former Soviet Union - 12 2,883 4,378 4,458 5,700 5,700
343 Middle East 366 350 350 350 350
3 Sub-Saharan Africa 3 3 3 3 3
0 East Asia 0 0 0 0 0
34 Oceania 33 40 40 20 20
17,523 Total 11,410 12,185 14,164 15,300 15,637
Domestic Consumption none
404 North America 466 420 527 463 463
61 South America 45 50 45 45 45
9,555 European Union - 28 8,204 7,404 8,800 8,600 8,800
98 Other Europe 91 75 77 77 77
6,500 Former Soviet Union - 12 3,190 4,205 4,075 5,300 5,300
349 Middle East 369 361 385 365 365
3 Sub-Saharan Africa 3 2 3 3 3
97 East Asia 116 66 55 85 85
34 Oceania 30 40 40 20 20
17,101 Total 12,514 12,623 14,007 14,958 15,158
Ending Stocks none
163 North America 71 35 69 52 52
0 South America 0 0 0 0 0
1,728 European Union - 28 1,013 741 631 756 865
0 Other Europe 0 0 0 0 0
869 Former Soviet Union - 12 526 430 518 693 693
17 Middle East 33 34 33 33 33
0 Sub-Saharan Africa 0 0 0 0 0
18 East Asia 14 5 10 10 10
0 Oceania 0 0 0 0 0
2,795 Total 1,657 1,245 1,261 1,544 1,653
NOTES: Regional definitions appear on last page of this circular. Imports are reported on a trade year basis. All other data are reported
using local marketing years.
August 2013
Grain: World Markets and Trade, August 2013
37
HISTORICAL DATA SERIES FOR SELECTED REGIONS AND COUNTRIES
CONTENTS
European Union: Grain Supply and Demand ............................................... 38 China: Grain Supply and Demand ................................................................ 39 Other Europe: Grain Supply and Demand .................................................... 40 Former Soviet Union: Grain Supply and Demand ........................................ 41 Wheat Supply and Disappearance: Selected Exporters ................................ 45 Corn Supply and Disappearance: Selected Exporters ................................... 47 Barley Supply and Disappearance: Selected Exporters ................................ 49 Sorghum Supply and Disappearance: Selected Exporters ............................ 50
U.S. Grains: Supply and Distribution……………………………. .... ……..51 Total Wheat and Coarse Grains: Supply and Demand ................................. 52 World Wheat and Coarse Grains: Supply and Demand ............................... 53 World Corn and Barley: Supply and Demand .............................................. 54 World Rice: Supply and Demand ................................................................. 55
DG F/SA &F
August 2013
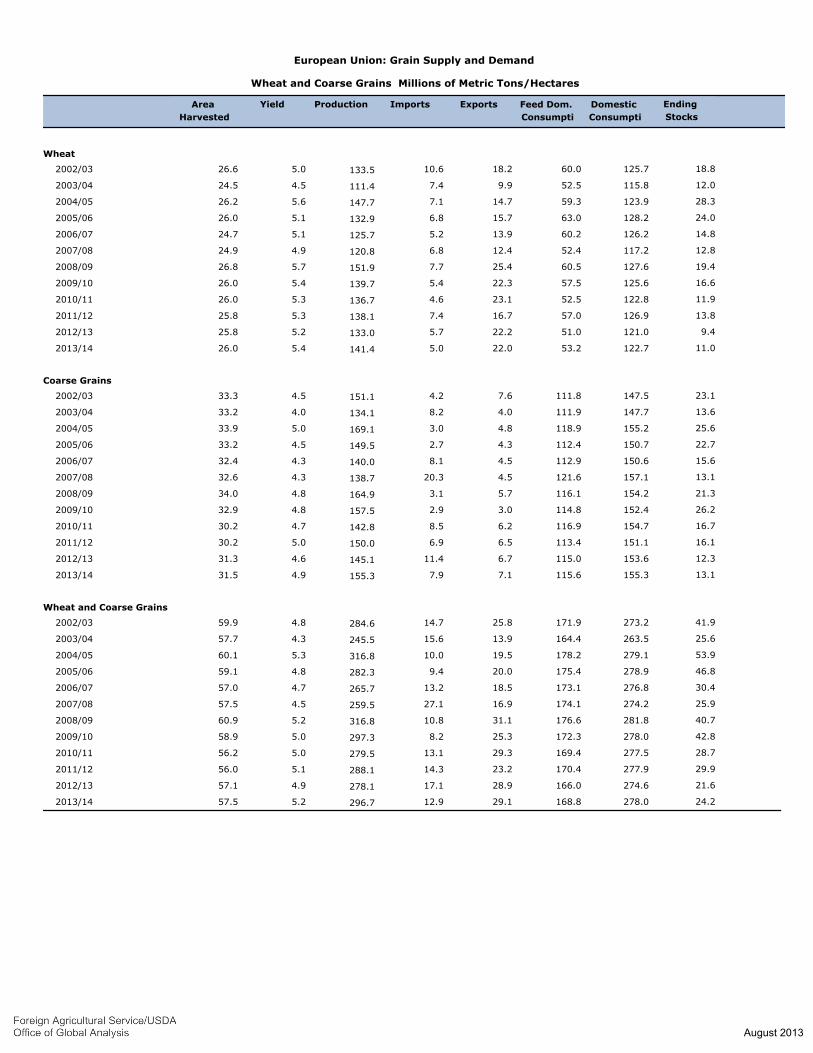
European Union: Grain Supply and Demand
Wheat and Coarse Grains Millions of Metric Tons/Hectares
Area
Harvested
Yield Production Imports Exports Feed Dom.
Consumpti
Domestic
Consumpti
Ending
Stocks
Wheat
133.5 125.760.018.210.65.026.6 2002/03 18.8
111.4 115.852.59.97.44.524.5 2003/04 12.0
147.7 123.959.314.77.15.626.2 2004/05 28.3
132.9 128.263.015.76.85.126.0 2005/06 24.0
125.7 126.260.213.95.25.124.7 2006/07 14.8
120.8 117.252.412.46.84.924.9 2007/08 12.8
151.9 127.660.525.47.75.726.8 2008/09 19.4
139.7 125.657.522.35.45.426.0 2009/10 16.6
136.7 122.852.523.14.65.326.0 2010/11 11.9
138.1 126.957.016.77.45.325.8 2011/12 13.8
133.0 121.051.022.25.75.225.8 2012/13 9.4
141.4 122.753.222.05.05.426.0 2013/14 11.0
Coarse Grains
151.1 147.5111.87.64.24.533.3 2002/03 23.1
134.1 147.7111.94.08.24.033.2 2003/04 13.6
169.1 155.2118.94.83.05.033.9 2004/05 25.6
149.5 150.7112.44.32.74.533.2 2005/06 22.7
140.0 150.6112.94.58.14.332.4 2006/07 15.6
138.7 157.1121.64.520.34.332.6 2007/08 13.1
164.9 154.2116.15.73.14.834.0 2008/09 21.3
157.5 152.4114.83.02.94.832.9 2009/10 26.2
142.8 154.7116.96.28.54.730.2 2010/11 16.7
150.0 151.1113.46.56.95.030.2 2011/12 16.1
145.1 153.6115.06.711.44.631.3 2012/13 12.3
155.3 155.3115.67.17.94.931.5 2013/14 13.1
Wheat and Coarse Grains
284.6 273.2171.925.814.74.859.9 2002/03 41.9
245.5 263.5164.413.915.64.357.7 2003/04 25.6
316.8 279.1178.219.510.05.360.1 2004/05 53.9
282.3 278.9175.420.09.44.859.1 2005/06 46.8
265.7 276.8173.118.513.24.757.0 2006/07 30.4
259.5 274.2174.116.927.14.557.5 2007/08 25.9
316.8 281.8176.631.110.85.260.9 2008/09 40.7
297.3 278.0172.325.38.25.058.9 2009/10 42.8
279.5 277.5169.429.313.15.056.2 2010/11 28.7
288.1 277.9170.423.214.35.156.0 2011/12 29.9
278.1 274.6166.028.917.14.957.1 2012/13 21.6
296.7 278.0168.829.112.95.257.5 2013/14 24.2
August 2013
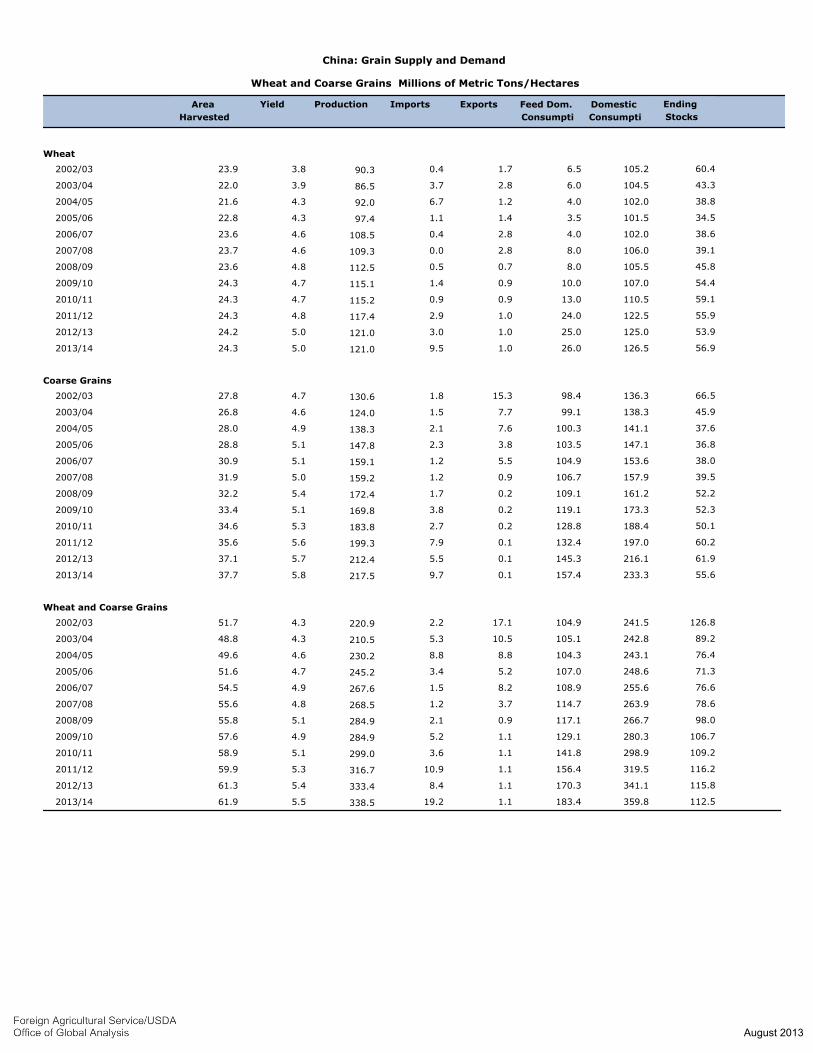
China: Grain Supply and Demand
Wheat and Coarse Grains Millions of Metric Tons/Hectares
Area
Harvested
Yield Production Imports Exports Feed Dom.
Consumpti
Domestic
Consumpti
Ending
Stocks
Wheat
90.3 105.26.51.70.43.823.9 2002/03 60.4
86.5 104.56.02.83.73.922.0 2003/04 43.3
92.0 102.04.01.26.74.321.6 2004/05 38.8
97.4 101.53.51.41.14.322.8 2005/06 34.5
108.5 102.04.02.80.44.623.6 2006/07 38.6
109.3 106.08.02.80.04.623.7 2007/08 39.1
112.5 105.58.00.70.54.823.6 2008/09 45.8
115.1 107.010.00.91.44.724.3 2009/10 54.4
115.2 110.513.00.90.94.724.3 2010/11 59.1
117.4 122.524.01.02.94.824.3 2011/12 55.9
121.0 125.025.01.03.05.024.2 2012/13 53.9
121.0 126.526.01.09.55.024.3 2013/14 56.9
Coarse Grains
130.6 136.398.415.31.84.727.8 2002/03 66.5
124.0 138.399.17.71.54.626.8 2003/04 45.9
138.3 141.1100.37.62.14.928.0 2004/05 37.6
147.8 147.1103.53.82.35.128.8 2005/06 36.8
159.1 153.6104.95.51.25.130.9 2006/07 38.0
159.2 157.9106.70.91.25.031.9 2007/08 39.5
172.4 161.2109.10.21.75.432.2 2008/09 52.2
169.8 173.3119.10.23.85.133.4 2009/10 52.3
183.8 188.4128.80.22.75.334.6 2010/11 50.1
199.3 197.0132.40.17.95.635.6 2011/12 60.2
212.4 216.1145.30.15.55.737.1 2012/13 61.9
217.5 233.3157.40.19.75.837.7 2013/14 55.6
Wheat and Coarse Grains
220.9 241.5104.917.12.24.351.7 2002/03 126.8
210.5 242.8105.110.55.34.348.8 2003/04 89.2
230.2 243.1104.38.88.84.649.6 2004/05 76.4
245.2 248.6107.05.23.44.751.6 2005/06 71.3
267.6 255.6108.98.21.54.954.5 2006/07 76.6
268.5 263.9114.73.71.24.855.6 2007/08 78.6
284.9 266.7117.10.92.15.155.8 2008/09 98.0
284.9 280.3129.11.15.24.957.6 2009/10 106.7
299.0 298.9141.81.13.65.158.9 2010/11 109.2
316.7 319.5156.41.110.95.359.9 2011/12 116.2
333.4 341.1170.31.18.45.461.3 2012/13 115.8
338.5 359.8183.41.119.25.561.9 2013/14 112.5
August 2013
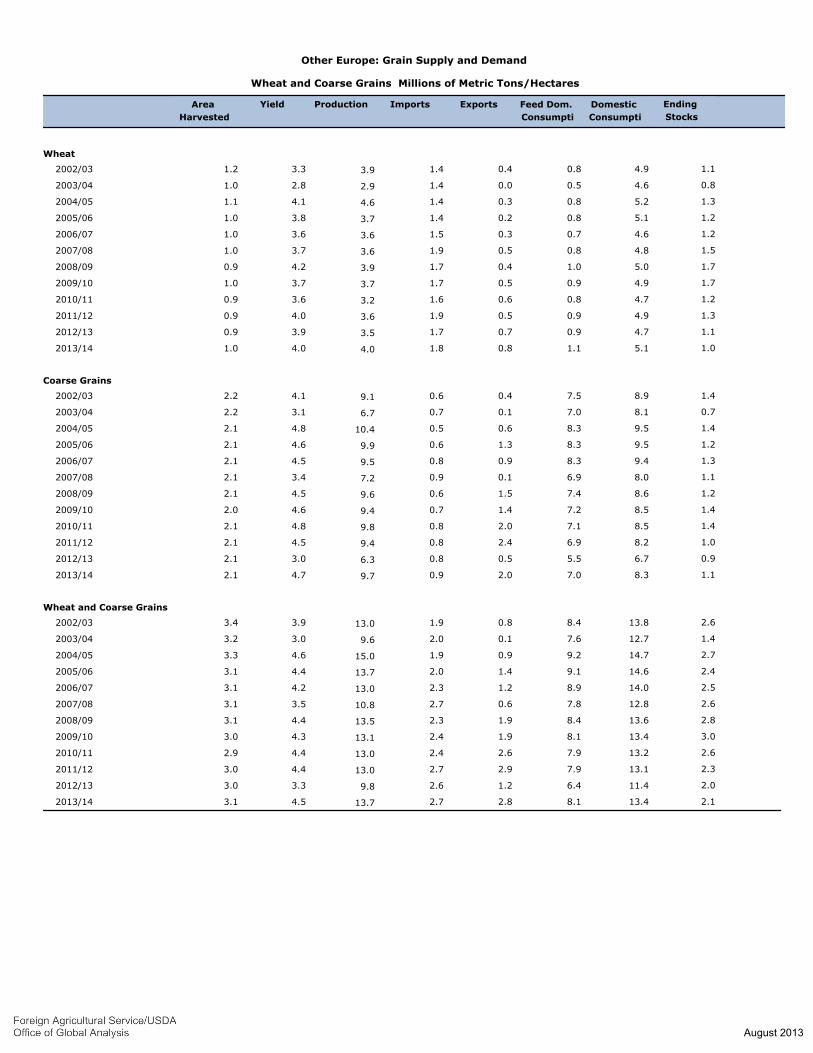
Other Europe: Grain Supply and Demand
Wheat and Coarse Grains Millions of Metric Tons/Hectares
Area
Harvested
Yield Production Imports Exports Feed Dom.
Consumpti
Domestic
Consumpti
Ending
Stocks
Wheat
3.9 4.90.80.41.43.31.2 2002/03 1.1
2.9 4.60.50.01.42.81.0 2003/04 0.8
4.6 5.20.80.31.44.11.1 2004/05 1.3
3.7 5.10.80.21.43.81.0 2005/06 1.2
3.6 4.60.70.31.53.61.0 2006/07 1.2
3.6 4.80.80.51.93.71.0 2007/08 1.5
3.9 5.01.00.41.74.20.9 2008/09 1.7
3.7 4.90.90.51.73.71.0 2009/10 1.7
3.2 4.70.80.61.63.60.9 2010/11 1.2
3.6 4.90.90.51.94.00.9 2011/12 1.3
3.5 4.70.90.71.73.90.9 2012/13 1.1
4.0 5.11.10.81.84.01.0 2013/14 1.0
Coarse Grains
9.1 8.97.50.40.64.12.2 2002/03 1.4
6.7 8.17.00.10.73.12.2 2003/04 0.7
10.4 9.58.30.60.54.82.1 2004/05 1.4
9.9 9.58.31.30.64.62.1 2005/06 1.2
9.5 9.48.30.90.84.52.1 2006/07 1.3
7.2 8.06.90.10.93.42.1 2007/08 1.1
9.6 8.67.41.50.64.52.1 2008/09 1.2
9.4 8.57.21.40.74.62.0 2009/10 1.4
9.8 8.57.12.00.84.82.1 2010/11 1.4
9.4 8.26.92.40.84.52.1 2011/12 1.0
6.3 6.75.50.50.83.02.1 2012/13 0.9
9.7 8.37.02.00.94.72.1 2013/14 1.1
Wheat and Coarse Grains
13.0 13.88.40.81.93.93.4 2002/03 2.6
9.6 12.77.60.12.03.03.2 2003/04 1.4
15.0 14.79.20.91.94.63.3 2004/05 2.7
13.7 14.69.11.42.04.43.1 2005/06 2.4
13.0 14.08.91.22.34.23.1 2006/07 2.5
10.8 12.87.80.62.73.53.1 2007/08 2.6
13.5 13.68.41.92.34.43.1 2008/09 2.8
13.1 13.48.11.92.44.33.0 2009/10 3.0
13.0 13.27.92.62.44.42.9 2010/11 2.6
13.0 13.17.92.92.74.43.0 2011/12 2.3
9.8 11.46.41.22.63.33.0 2012/13 2.0
13.7 13.48.12.82.74.53.1 2013/14 2.1
August 2013
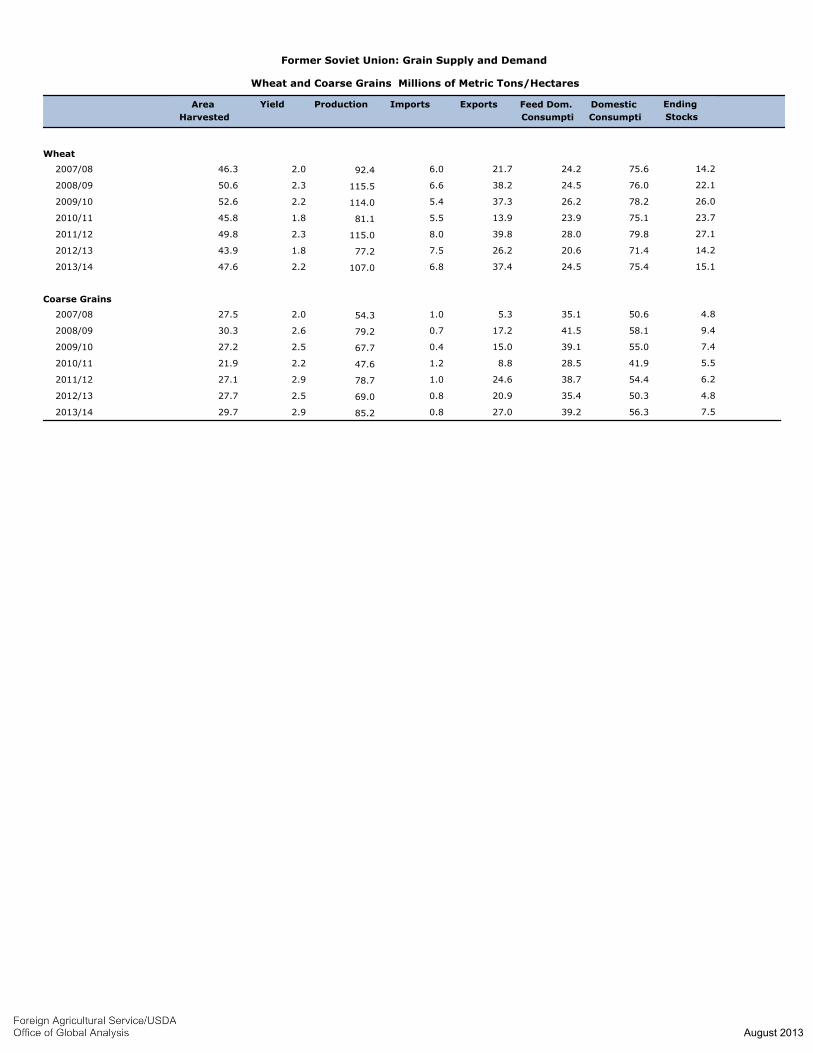
Former Soviet Union: Grain Supply and Demand
Wheat and Coarse Grains Millions of Metric Tons/Hectares
Area
Harvested
Yield Production Imports Exports Feed Dom.
Consumpti
Domestic
Consumpti
Ending
Stocks
Wheat
92.4 75.624.221.76.02.046.3 2007/08 14.2
115.5 76.024.538.26.62.350.6 2008/09 22.1
114.0 78.226.237.35.42.252.6 2009/10 26.0
81.1 75.123.913.95.51.845.8 2010/11 23.7
115.0 79.828.039.88.02.349.8 2011/12 27.1
77.2 71.420.626.27.51.843.9 2012/13 14.2
107.0 75.424.537.46.82.247.6 2013/14 15.1
Coarse Grains
54.3 50.635.15.31.02.027.5 2007/08 4.8
79.2 58.141.517.20.72.630.3 2008/09 9.4
67.7 55.039.115.00.42.527.2 2009/10 7.4
47.6 41.928.58.81.22.221.9 2010/11 5.5
78.7 54.438.724.61.02.927.1 2011/12 6.2
69.0 50.335.420.90.82.527.7 2012/13 4.8
85.2 56.339.227.00.82.929.7 2013/14 7.5
August 2013
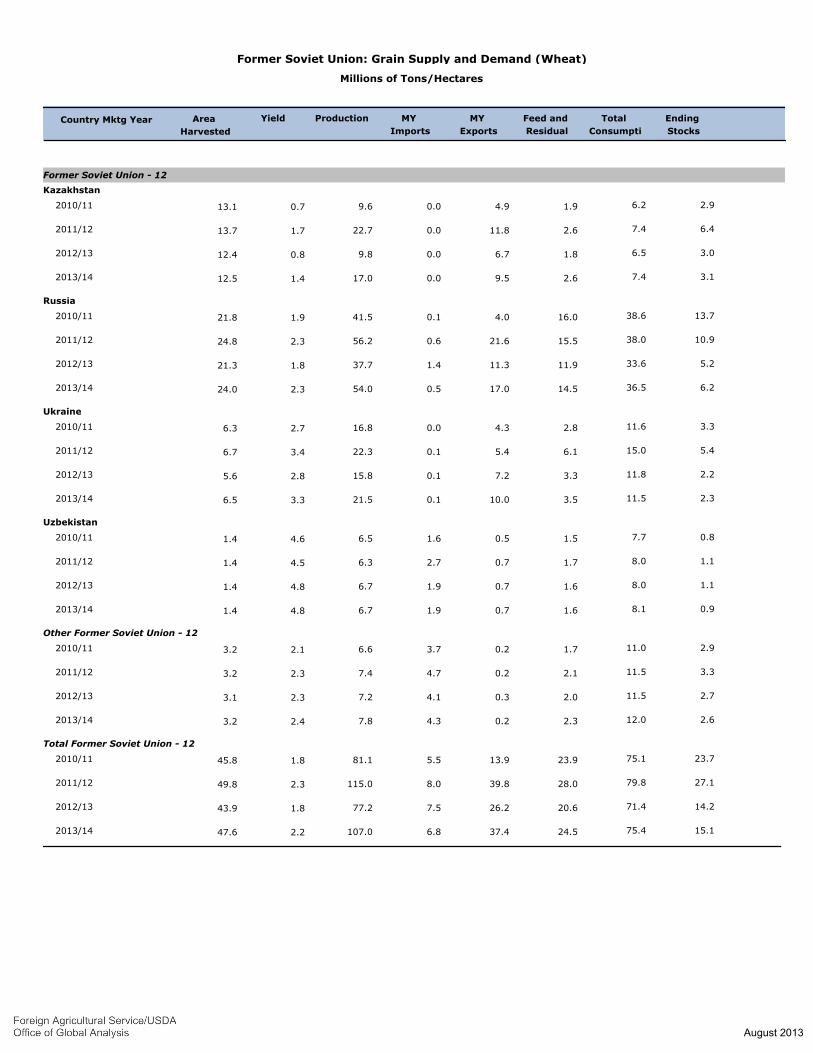
Millions of Tons/Hectares
Former Soviet Union: Grain Supply and Demand (Wheat)
Area
Harvested
Ending
Stocks
Total
Consumpti
Feed and
Residual
MY
Exports
MY
Imports
ProductionYieldCountry Mktg Year
Former Soviet Union - 12
Kazakhstan
9.6 6.21.94.90.00.713.1 2010/11 2.9
22.7 7.42.611.80.01.713.7 2011/12 6.4
9.8 6.51.86.70.00.812.4 2012/13 3.0
17.0 7.42.69.50.01.412.5 2013/14 3.1
Russia
41.5 38.616.04.00.11.921.8 2010/11 13.7
56.2 38.015.521.60.62.324.8 2011/12 10.9
37.7 33.611.911.31.41.821.3 2012/13 5.2
54.0 36.514.517.00.52.324.0 2013/14 6.2
Ukraine
16.8 11.62.84.30.02.76.3 2010/11 3.3
22.3 15.06.15.40.13.46.7 2011/12 5.4
15.8 11.83.37.20.12.85.6 2012/13 2.2
21.5 11.53.510.00.13.36.5 2013/14 2.3
Uzbekistan
6.5 7.71.50.51.64.61.4 2010/11 0.8
6.3 8.01.70.72.74.51.4 2011/12 1.1
6.7 8.01.60.71.94.81.4 2012/13 1.1
6.7 8.11.60.71.94.81.4 2013/14 0.9
Other Former Soviet Union - 12
6.6 11.01.70.23.72.13.2 2010/11 2.9
7.4 11.52.10.24.72.33.2 2011/12 3.3
7.2 11.52.00.34.12.33.1 2012/13 2.7
7.8 12.02.30.24.32.43.2 2013/14 2.6
Total Former Soviet Union - 12
81.1 75.123.913.95.51.845.8 2010/11 23.7
115.0 79.828.039.88.02.349.8 2011/12 27.1
77.2 71.420.626.27.51.843.9 2012/13 14.2
107.0 75.424.537.46.82.247.6 2013/14 15.1
August 2013
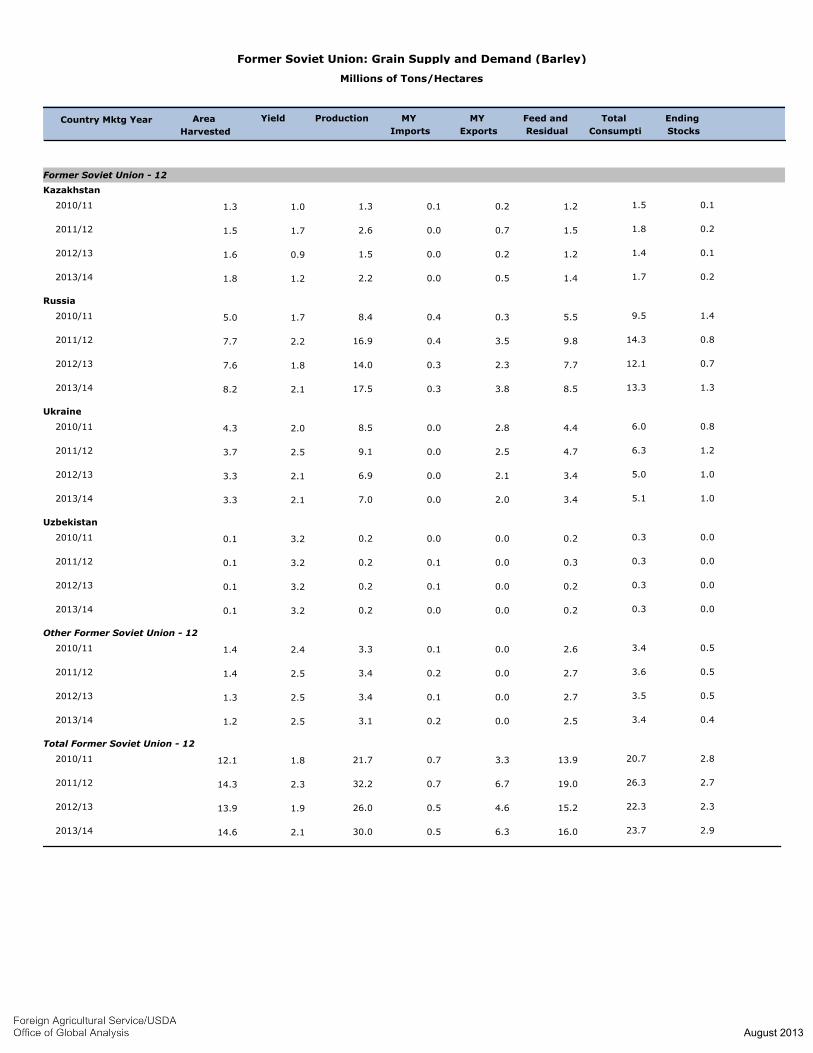
Millions of Tons/Hectares
Former Soviet Union: Grain Supply and Demand (Barley)
Area
Harvested
Ending
Stocks
Total
Consumpti
Feed and
Residual
MY
Exports
MY
Imports
ProductionYieldCountry Mktg Year
Former Soviet Union - 12
Kazakhstan
1.3 1.51.20.20.11.01.3 2010/11 0.1
2.6 1.81.50.70.01.71.5 2011/12 0.2
1.5 1.41.20.20.00.91.6 2012/13 0.1
2.2 1.71.40.50.01.21.8 2013/14 0.2
Russia
8.4 9.55.50.30.41.75.0 2010/11 1.4
16.9 14.39.83.50.42.27.7 2011/12 0.8
14.0 12.17.72.30.31.87.6 2012/13 0.7
17.5 13.38.53.80.32.18.2 2013/14 1.3
Ukraine
8.5 6.04.42.80.02.04.3 2010/11 0.8
9.1 6.34.72.50.02.53.7 2011/12 1.2
6.9 5.03.42.10.02.13.3 2012/13 1.0
7.0 5.13.42.00.02.13.3 2013/14 1.0
Uzbekistan
0.2 0.30.20.00.03.20.1 2010/11 0.0
0.2 0.30.30.00.13.20.1 2011/12 0.0
0.2 0.30.20.00.13.20.1 2012/13 0.0
0.2 0.30.20.00.03.20.1 2013/14 0.0
Other Former Soviet Union - 12
3.3 3.42.60.00.12.41.4 2010/11 0.5
3.4 3.62.70.00.22.51.4 2011/12 0.5
3.4 3.52.70.00.12.51.3 2012/13 0.5
3.1 3.42.50.00.22.51.2 2013/14 0.4
Total Former Soviet Union - 12
21.7 20.713.93.30.71.812.1 2010/11 2.8
32.2 26.319.06.70.72.314.3 2011/12 2.7
26.0 22.315.24.60.51.913.9 2012/13 2.3
30.0 23.716.06.30.52.114.6 2013/14 2.9
August 2013
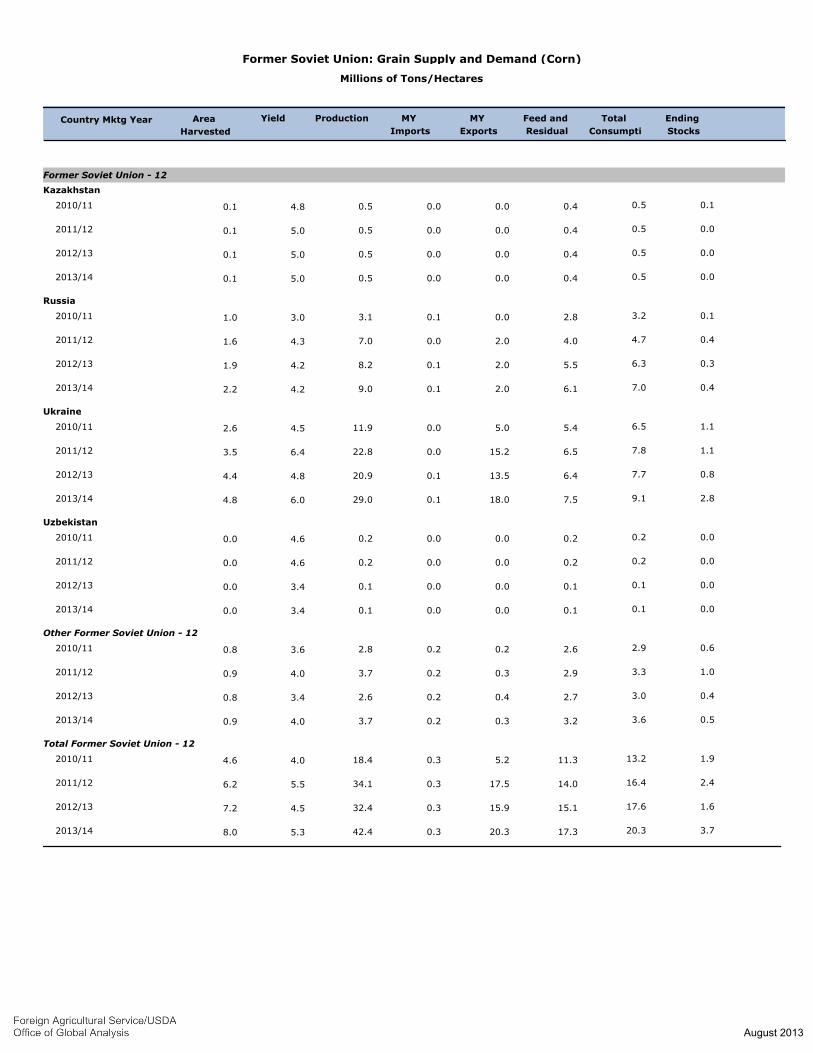
Millions of Tons/Hectares
Former Soviet Union: Grain Supply and Demand (Corn)
Area
Harvested
Ending
Stocks
Total
Consumpti
Feed and
Residual
MY
Exports
MY
Imports
ProductionYieldCountry Mktg Year
Former Soviet Union - 12
Kazakhstan
0.5 0.50.40.00.04.80.1 2010/11 0.1
0.5 0.50.40.00.05.00.1 2011/12 0.0
0.5 0.50.40.00.05.00.1 2012/13 0.0
0.5 0.50.40.00.05.00.1 2013/14 0.0
Russia
3.1 3.22.80.00.13.01.0 2010/11 0.1
7.0 4.74.02.00.04.31.6 2011/12 0.4
8.2 6.35.52.00.14.21.9 2012/13 0.3
9.0 7.06.12.00.14.22.2 2013/14 0.4
Ukraine
11.9 6.55.45.00.04.52.6 2010/11 1.1
22.8 7.86.515.20.06.43.5 2011/12 1.1
20.9 7.76.413.50.14.84.4 2012/13 0.8
29.0 9.17.518.00.16.04.8 2013/14 2.8
Uzbekistan
0.2 0.20.20.00.04.60.0 2010/11 0.0
0.2 0.20.20.00.04.60.0 2011/12 0.0
0.1 0.10.10.00.03.40.0 2012/13 0.0
0.1 0.10.10.00.03.40.0 2013/14 0.0
Other Former Soviet Union - 12
2.8 2.92.60.20.23.60.8 2010/11 0.6
3.7 3.32.90.30.24.00.9 2011/12 1.0
2.6 3.02.70.40.23.40.8 2012/13 0.4
3.7 3.63.20.30.24.00.9 2013/14 0.5
Total Former Soviet Union - 12
18.4 13.211.35.20.34.04.6 2010/11 1.9
34.1 16.414.017.50.35.56.2 2011/12 2.4
32.4 17.615.115.90.34.57.2 2012/13 1.6
42.4 20.317.320.30.35.38.0 2013/14 3.7
August 2013
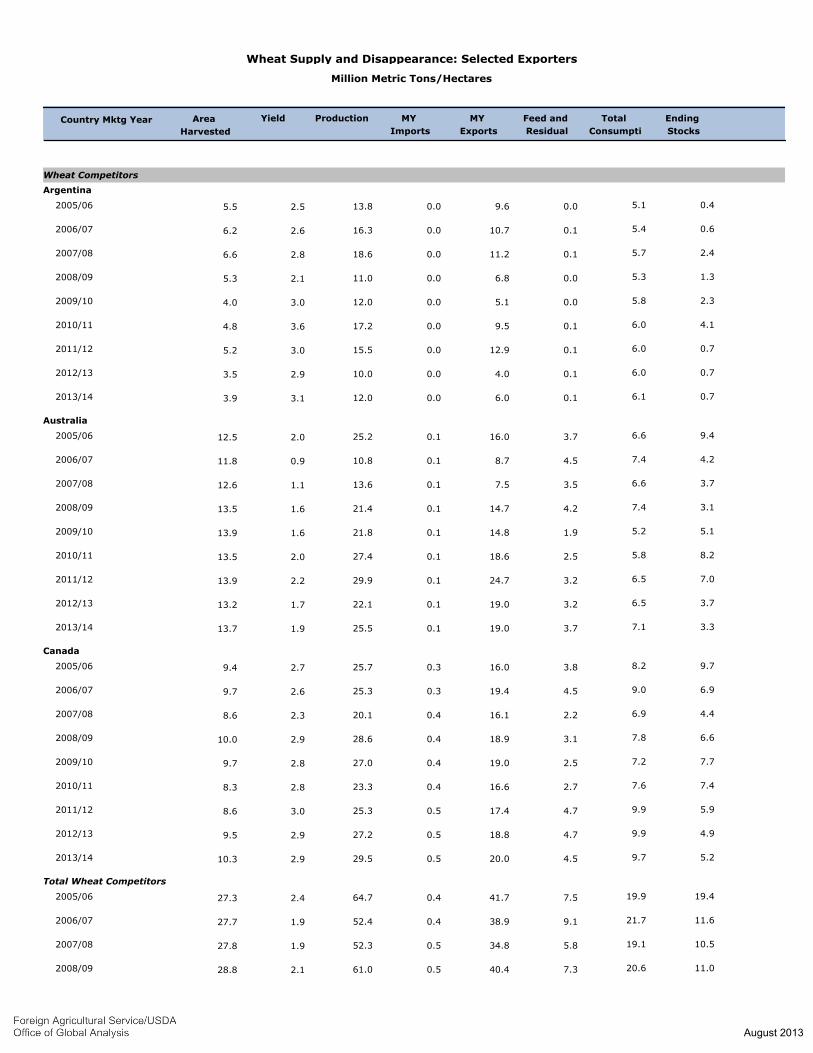
Million Metric Tons/Hectares
Wheat Supply and Disappearance: Selected Exporters
Area
Harvested
Ending
Stocks
Total
Consumpti
Feed and
Residual
MY
Exports
MY
Imports
ProductionYieldCountry Mktg Year
Wheat Competitors
Argentina
13.8 5.10.09.60.02.55.5 2005/06 0.4
16.3 5.40.110.70.02.66.2 2006/07 0.6
18.6 5.70.111.20.02.86.6 2007/08 2.4
11.0 5.30.06.80.02.15.3 2008/09 1.3
12.0 5.80.05.10.03.04.0 2009/10 2.3
17.2 6.00.19.50.03.64.8 2010/11 4.1
15.5 6.00.112.90.03.05.2 2011/12 0.7
10.0 6.00.14.00.02.93.5 2012/13 0.7
12.0 6.10.16.00.03.13.9 2013/14 0.7
Australia
25.2 6.63.716.00.12.012.5 2005/06 9.4
10.8 7.44.58.70.10.911.8 2006/07 4.2
13.6 6.63.57.50.11.112.6 2007/08 3.7
21.4 7.44.214.70.11.613.5 2008/09 3.1
21.8 5.21.914.80.11.613.9 2009/10 5.1
27.4 5.82.518.60.12.013.5 2010/11 8.2
29.9 6.53.224.70.12.213.9 2011/12 7.0
22.1 6.53.219.00.11.713.2 2012/13 3.7
25.5 7.13.719.00.11.913.7 2013/14 3.3
Canada
25.7 8.23.816.00.32.79.4 2005/06 9.7
25.3 9.04.519.40.32.69.7 2006/07 6.9
20.1 6.92.216.10.42.38.6 2007/08 4.4
28.6 7.83.118.90.42.910.0 2008/09 6.6
27.0 7.22.519.00.42.89.7 2009/10 7.7
23.3 7.62.716.60.42.88.3 2010/11 7.4
25.3 9.94.717.40.53.08.6 2011/12 5.9
27.2 9.94.718.80.52.99.5 2012/13 4.9
29.5 9.74.520.00.52.910.3 2013/14 5.2
Total Wheat Competitors
64.7 19.97.541.70.42.427.3 2005/06 19.4
52.4 21.79.138.90.41.927.7 2006/07 11.6
52.3 19.15.834.80.51.927.8 2007/08 10.5
61.0 20.67.340.40.52.128.8 2008/09 11.0
August 2013
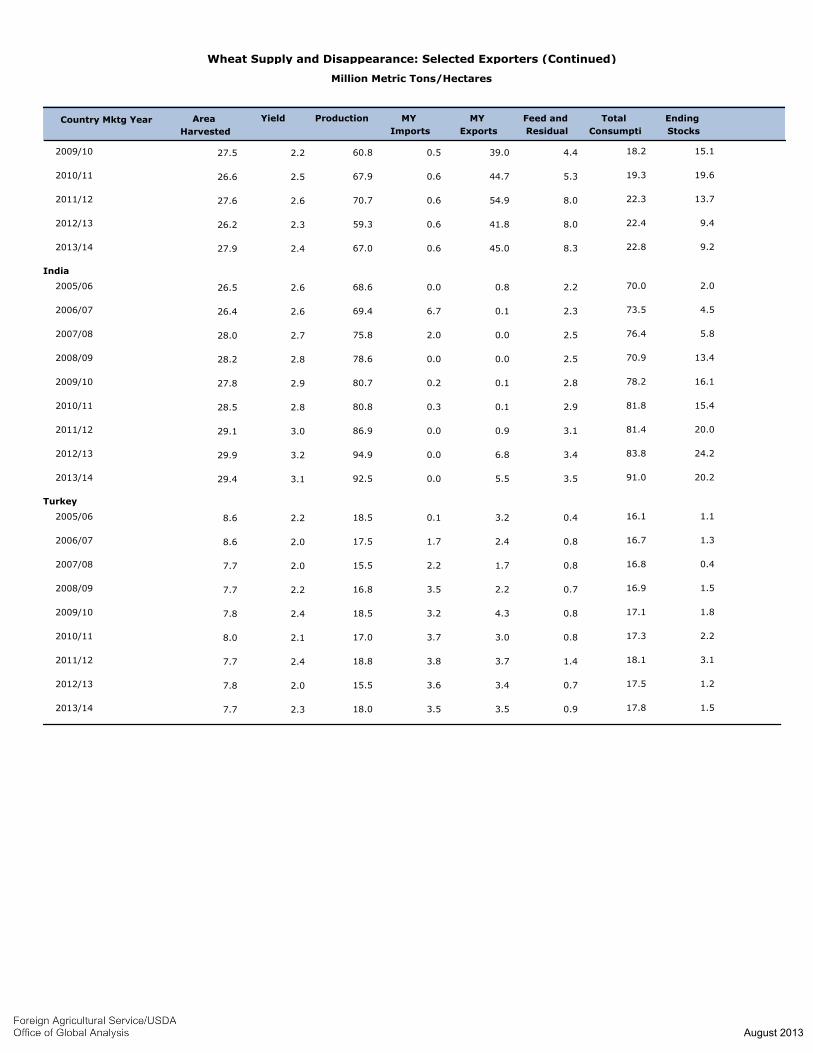
Million Metric Tons/Hectares
Wheat Supply and Disappearance: Selected Exporters (Continued)
Area
Harvested
Ending
Stocks
Total
Consumpti
Feed and
Residual
MY
Exports
MY
Imports
ProductionYieldCountry Mktg Year
60.8 18.24.439.00.52.227.5 2009/10 15.1
67.9 19.35.344.70.62.526.6 2010/11 19.6
70.7 22.38.054.90.62.627.6 2011/12 13.7
59.3 22.48.041.80.62.326.2 2012/13 9.4
67.0 22.88.345.00.62.427.9 2013/14 9.2
India
68.6 70.02.20.80.02.626.5 2005/06 2.0
69.4 73.52.30.16.72.626.4 2006/07 4.5
75.8 76.42.50.02.02.728.0 2007/08 5.8
78.6 70.92.50.00.02.828.2 2008/09 13.4
80.7 78.22.80.10.22.927.8 2009/10 16.1
80.8 81.82.90.10.32.828.5 2010/11 15.4
86.9 81.43.10.90.03.029.1 2011/12 20.0
94.9 83.83.46.80.03.229.9 2012/13 24.2
92.5 91.03.55.50.03.129.4 2013/14 20.2
Turkey
18.5 16.10.43.20.12.28.6 2005/06 1.1
17.5 16.70.82.41.72.08.6 2006/07 1.3
15.5 16.80.81.72.22.07.7 2007/08 0.4
16.8 16.90.72.23.52.27.7 2008/09 1.5
18.5 17.10.84.33.22.47.8 2009/10 1.8
17.0 17.30.83.03.72.18.0 2010/11 2.2
18.8 18.11.43.73.82.47.7 2011/12 3.1
15.5 17.50.73.43.62.07.8 2012/13 1.2
18.0 17.80.93.53.52.37.7 2013/14 1.5
August 2013
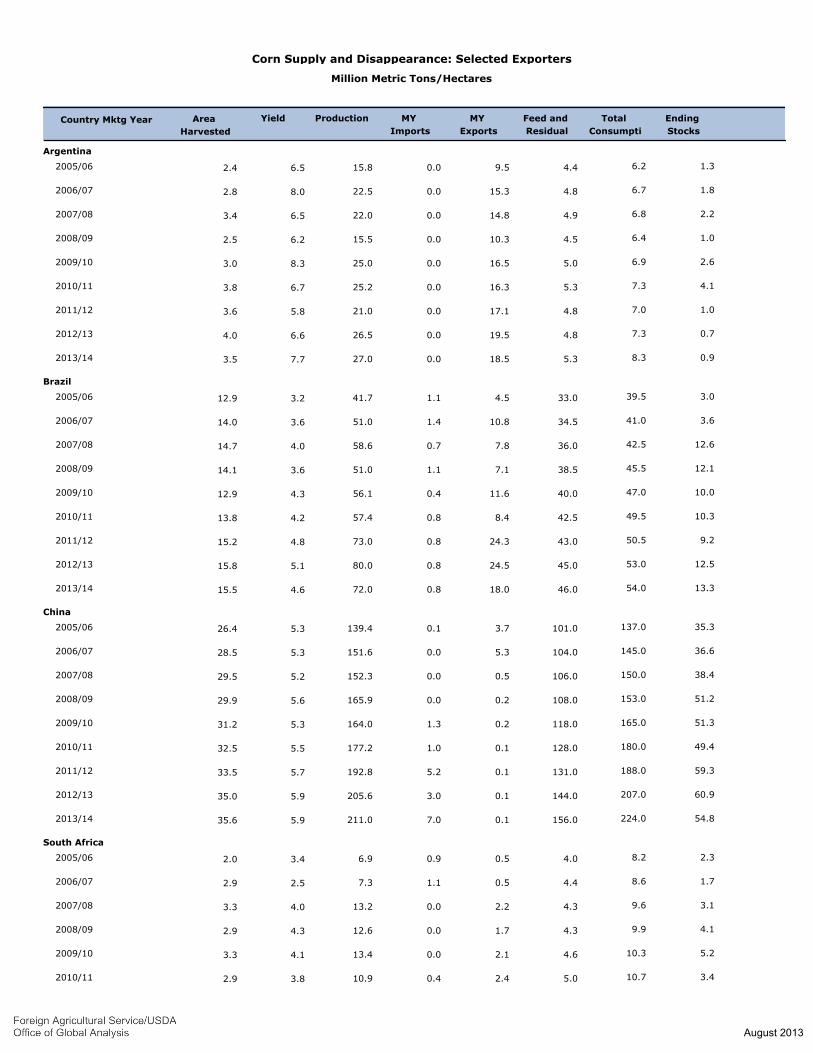
Million Metric Tons/Hectares
Corn Supply and Disappearance: Selected Exporters
Area
Harvested
Ending
Stocks
Total
Consumpti
Feed and
Residual
MY
Exports
MY
Imports
ProductionYieldCountry Mktg Year
Argentina
15.8 6.24.49.50.06.52.4 2005/06 1.3
22.5 6.74.815.30.08.02.8 2006/07 1.8
22.0 6.84.914.80.06.53.4 2007/08 2.2
15.5 6.44.510.30.06.22.5 2008/09 1.0
25.0 6.95.016.50.08.33.0 2009/10 2.6
25.2 7.35.316.30.06.73.8 2010/11 4.1
21.0 7.04.817.10.05.83.6 2011/12 1.0
26.5 7.34.819.50.06.64.0 2012/13 0.7
27.0 8.35.318.50.07.73.5 2013/14 0.9
Brazil
41.7 39.533.04.51.13.212.9 2005/06 3.0
51.0 41.034.510.81.43.614.0 2006/07 3.6
58.6 42.536.07.80.74.014.7 2007/08 12.6
51.0 45.538.57.11.13.614.1 2008/09 12.1
56.1 47.040.011.60.44.312.9 2009/10 10.0
57.4 49.542.58.40.84.213.8 2010/11 10.3
73.0 50.543.024.30.84.815.2 2011/12 9.2
80.0 53.045.024.50.85.115.8 2012/13 12.5
72.0 54.046.018.00.84.615.5 2013/14 13.3
China
139.4 137.0101.03.70.15.326.4 2005/06 35.3
151.6 145.0104.05.30.05.328.5 2006/07 36.6
152.3 150.0106.00.50.05.229.5 2007/08 38.4
165.9 153.0108.00.20.05.629.9 2008/09 51.2
164.0 165.0118.00.21.35.331.2 2009/10 51.3
177.2 180.0128.00.11.05.532.5 2010/11 49.4
192.8 188.0131.00.15.25.733.5 2011/12 59.3
205.6 207.0144.00.13.05.935.0 2012/13 60.9
211.0 224.0156.00.17.05.935.6 2013/14 54.8
South Africa
6.9 8.24.00.50.93.42.0 2005/06 2.3
7.3 8.64.40.51.12.52.9 2006/07 1.7
13.2 9.64.32.20.04.03.3 2007/08 3.1
12.6 9.94.31.70.04.32.9 2008/09 4.1
13.4 10.34.62.10.04.13.3 2009/10 5.2
10.9 10.75.02.40.43.82.9 2010/11 3.4
August 2013
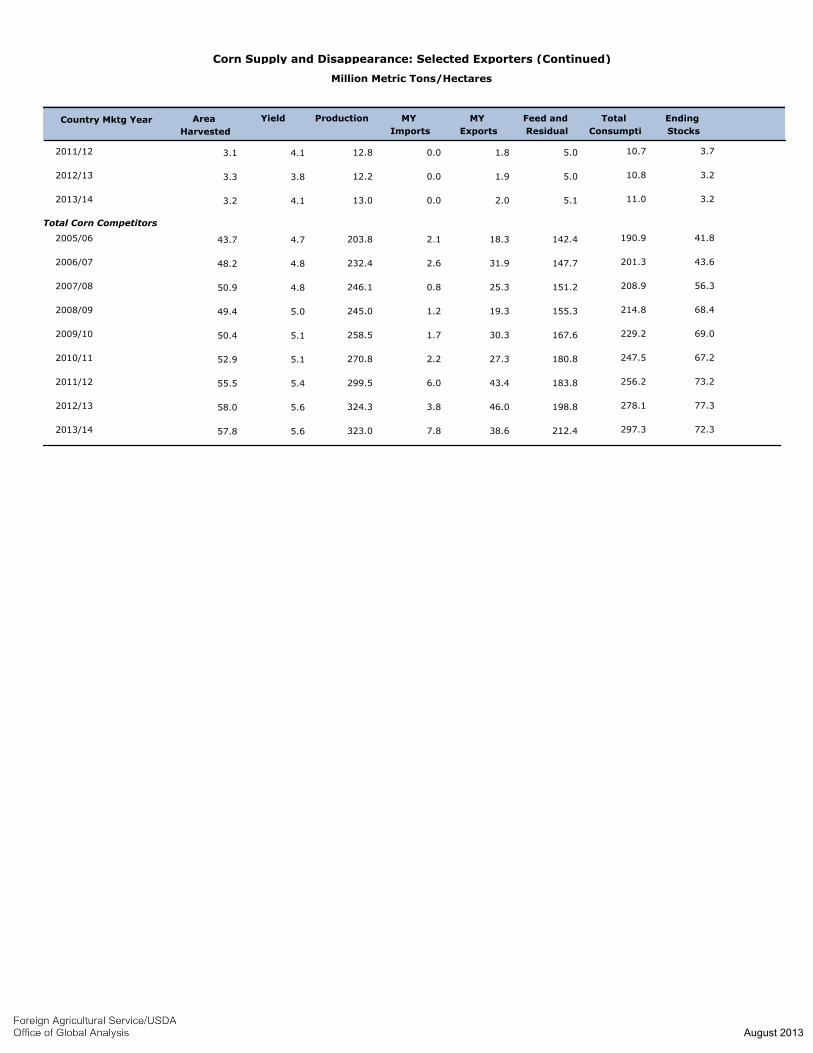
Million Metric Tons/Hectares
Corn Supply and Disappearance: Selected Exporters (Continued)
Area
Harvested
Ending
Stocks
Total
Consumpti
Feed and
Residual
MY
Exports
MY
Imports
ProductionYieldCountry Mktg Year
12.8 10.75.01.80.04.13.1 2011/12 3.7
12.2 10.85.01.90.03.83.3 2012/13 3.2
13.0 11.05.12.00.04.13.2 2013/14 3.2
Total Corn Competitors
203.8 190.9142.418.32.14.743.7 2005/06 41.8
232.4 201.3147.731.92.64.848.2 2006/07 43.6
246.1 208.9151.225.30.84.850.9 2007/08 56.3
245.0 214.8155.319.31.25.049.4 2008/09 68.4
258.5 229.2167.630.31.75.150.4 2009/10 69.0
270.8 247.5180.827.32.25.152.9 2010/11 67.2
299.5 256.2183.843.46.05.455.5 2011/12 73.2
324.3 278.1198.846.03.85.658.0 2012/13 77.3
323.0 297.3212.438.67.85.657.8 2013/14 72.3
August 2013
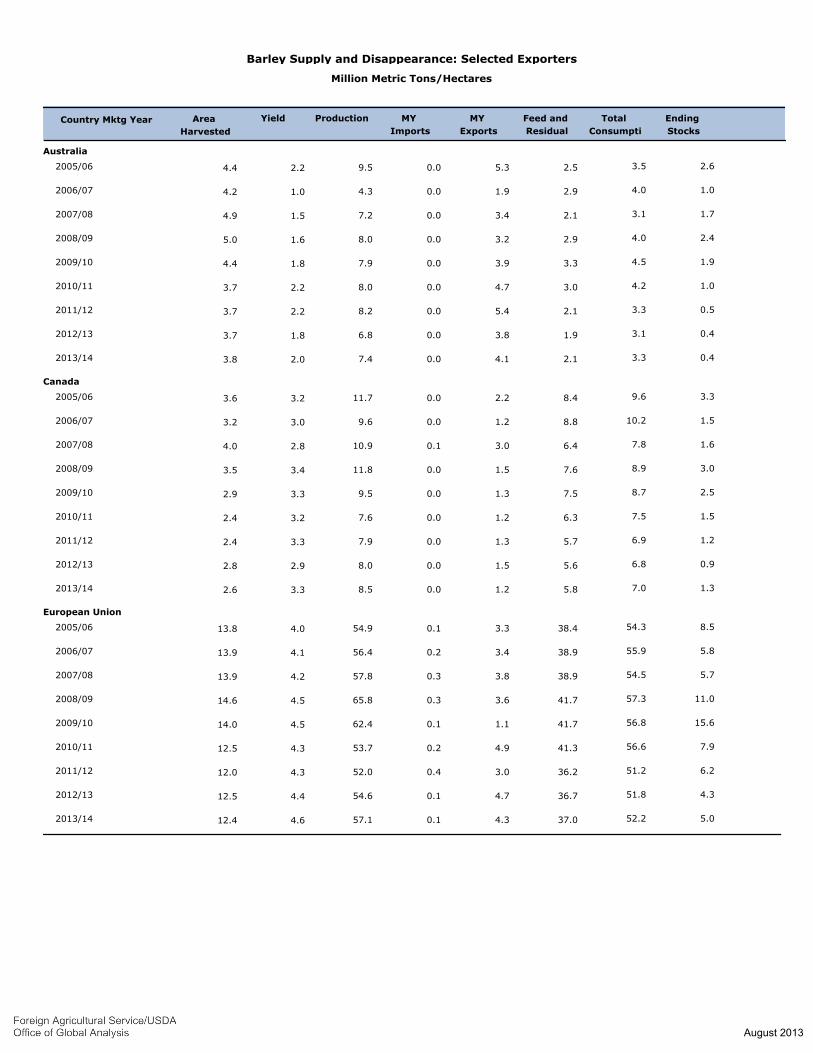
Million Metric Tons/Hectares
Barley Supply and Disappearance: Selected Exporters
Area
Harvested
Ending
Stocks
Total
Consumpti
Feed and
Residual
MY
Exports
MY
Imports
ProductionYieldCountry Mktg Year
Australia
9.5 3.52.55.30.02.24.4 2005/06 2.6
4.3 4.02.91.90.01.04.2 2006/07 1.0
7.2 3.12.13.40.01.54.9 2007/08 1.7
8.0 4.02.93.20.01.65.0 2008/09 2.4
7.9 4.53.33.90.01.84.4 2009/10 1.9
8.0 4.23.04.70.02.23.7 2010/11 1.0
8.2 3.32.15.40.02.23.7 2011/12 0.5
6.8 3.11.93.80.01.83.7 2012/13 0.4
7.4 3.32.14.10.02.03.8 2013/14 0.4
Canada
11.7 9.68.42.20.03.23.6 2005/06 3.3
9.6 10.28.81.20.03.03.2 2006/07 1.5
10.9 7.86.43.00.12.84.0 2007/08 1.6
11.8 8.97.61.50.03.43.5 2008/09 3.0
9.5 8.77.51.30.03.32.9 2009/10 2.5
7.6 7.56.31.20.03.22.4 2010/11 1.5
7.9 6.95.71.30.03.32.4 2011/12 1.2
8.0 6.85.61.50.02.92.8 2012/13 0.9
8.5 7.05.81.20.03.32.6 2013/14 1.3
European Union
54.9 54.338.43.30.14.013.8 2005/06 8.5
56.4 55.938.93.40.24.113.9 2006/07 5.8
57.8 54.538.93.80.34.213.9 2007/08 5.7
65.8 57.341.73.60.34.514.6 2008/09 11.0
62.4 56.841.71.10.14.514.0 2009/10 15.6
53.7 56.641.34.90.24.312.5 2010/11 7.9
52.0 51.236.23.00.44.312.0 2011/12 6.2
54.6 51.836.74.70.14.412.5 2012/13 4.3
57.1 52.237.04.30.14.612.4 2013/14 5.0
August 2013
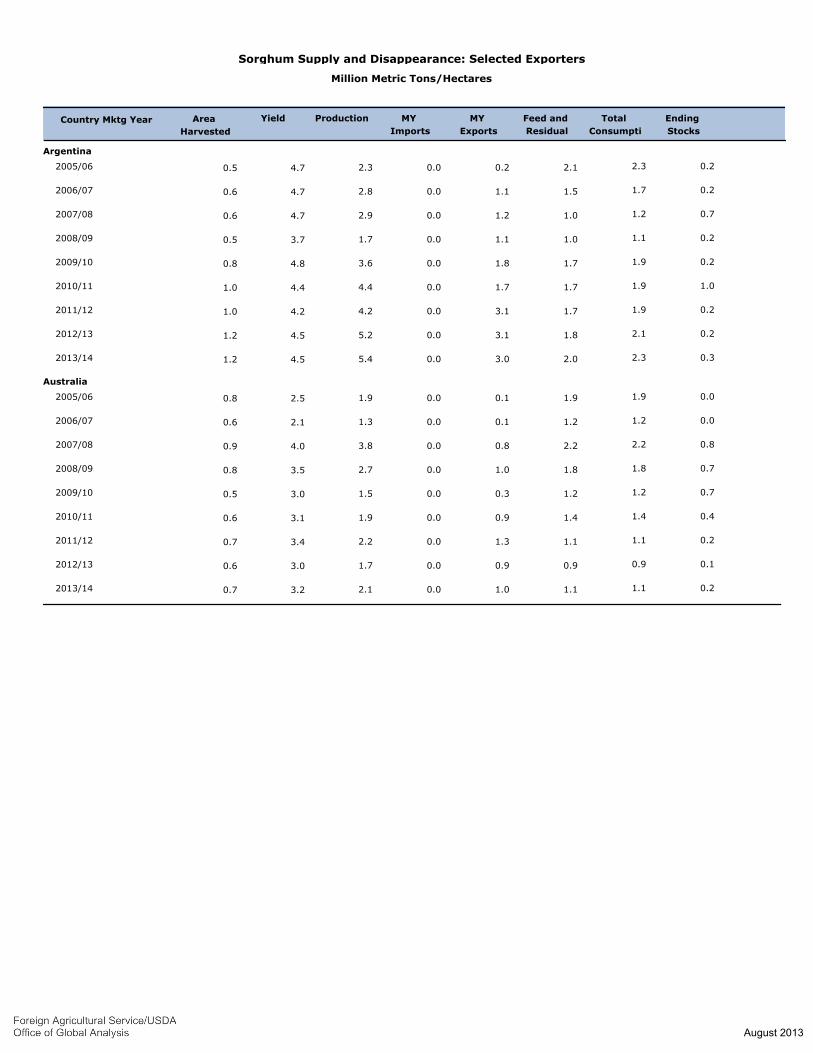
Million Metric Tons/Hectares
Sorghum Supply and Disappearance: Selected Exporters
Area
Harvested
Ending
Stocks
Total
Consumpti
Feed and
Residual
MY
Exports
MY
Imports
ProductionYieldCountry Mktg Year
Argentina
2.3 2.32.10.20.04.70.5 2005/06 0.2
2.8 1.71.51.10.04.70.6 2006/07 0.2
2.9 1.21.01.20.04.70.6 2007/08 0.7
1.7 1.11.01.10.03.70.5 2008/09 0.2
3.6 1.91.71.80.04.80.8 2009/10 0.2
4.4 1.91.71.70.04.41.0 2010/11 1.0
4.2 1.91.73.10.04.21.0 2011/12 0.2
5.2 2.11.83.10.04.51.2 2012/13 0.2
5.4 2.32.03.00.04.51.2 2013/14 0.3
Australia
1.9 1.91.90.10.02.50.8 2005/06 0.0
1.3 1.21.20.10.02.10.6 2006/07 0.0
3.8 2.22.20.80.04.00.9 2007/08 0.8
2.7 1.81.81.00.03.50.8 2008/09 0.7
1.5 1.21.20.30.03.00.5 2009/10 0.7
1.9 1.41.40.90.03.10.6 2010/11 0.4
2.2 1.11.11.30.03.40.7 2011/12 0.2
1.7 0.90.90.90.03.00.6 2012/13 0.1
2.1 1.11.11.00.03.20.7 2013/14 0.2
August 2013
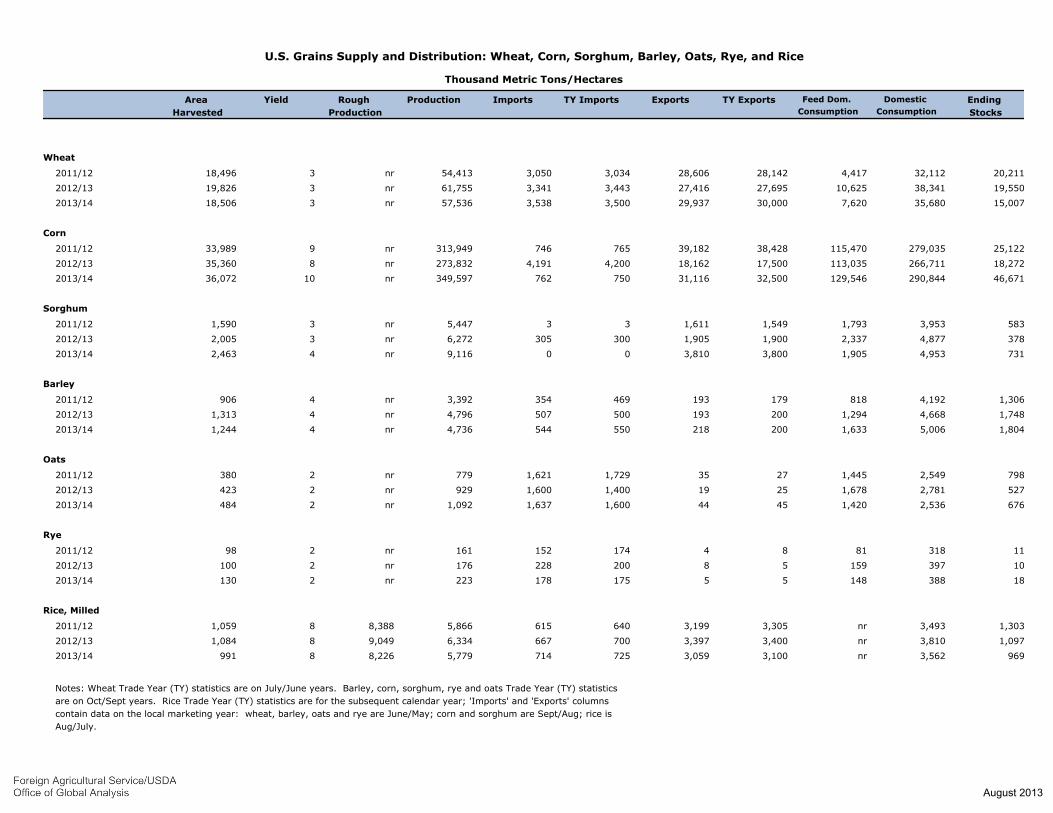
U.S. Grains Supply and Distribution: Wheat, Corn, Sorghum, Barley, Oats, Rye, and Rice
Thousand Metric Tons/Hectares
Area
Harvested
Yield Rough
Production
Production Imports TY Imports Exports TY Exports Feed Dom.
Consumption
Domestic
Consumption
Ending
Stocks
Wheat
20,21132,1124,41728,14228,6063,0343,05054,413nr318,496 2011/12
19,55038,34110,62527,69527,4163,4433,34161,755nr319,826 2012/13
15,00735,6807,62030,00029,9373,5003,53857,536nr318,506 2013/14
Corn
25,122279,035115,47038,42839,182765746313,949nr933,989 2011/12
18,272266,711113,03517,50018,1624,2004,191273,832nr835,360 2012/13
46,671290,844129,54632,50031,116750762349,597nr1036,072 2013/14
Sorghum
5833,9531,7931,5491,611335,447nr31,590 2011/12
3784,8772,3371,9001,9053003056,272nr32,005 2012/13
7314,9531,9053,8003,810009,116nr42,463 2013/14
Barley
1,3064,1928181791934693543,392nr4906 2011/12
1,7484,6681,2942001935005074,796nr41,313 2012/13
1,8045,0061,6332002185505444,736nr41,244 2013/14
Oats
7982,5491,44527351,7291,621779nr2380 2011/12
5272,7811,67825191,4001,600929nr2423 2012/13
6762,5361,42045441,6001,6371,092nr2484 2013/14
Rye
113188184174152161nr298 2011/12
1039715958200228176nr2100 2012/13
1838814855175178223nr2130 2013/14
Rice, Milled
1,3033,493nr3,3053,1996406155,8668,38881,059 2011/12
1,0973,810nr3,4003,3977006676,3349,04981,084 2012/13
9693,562nr3,1003,0597257145,7798,2268991 2013/14
Notes: Wheat Trade Year (TY) statistics are on July/June years. Barley, corn, sorghum, rye and oats Trade Year (TY) statistics
are on Oct/Sept years. Rice Trade Year (TY) statistics are for the subsequent calendar year; 'Imports' and 'Exports' columns
contain data on the local marketing year: wheat, barley, oats and rye are June/May; corn and sorghum are Sept/Aug; rice is
Aug/July.
August 2013
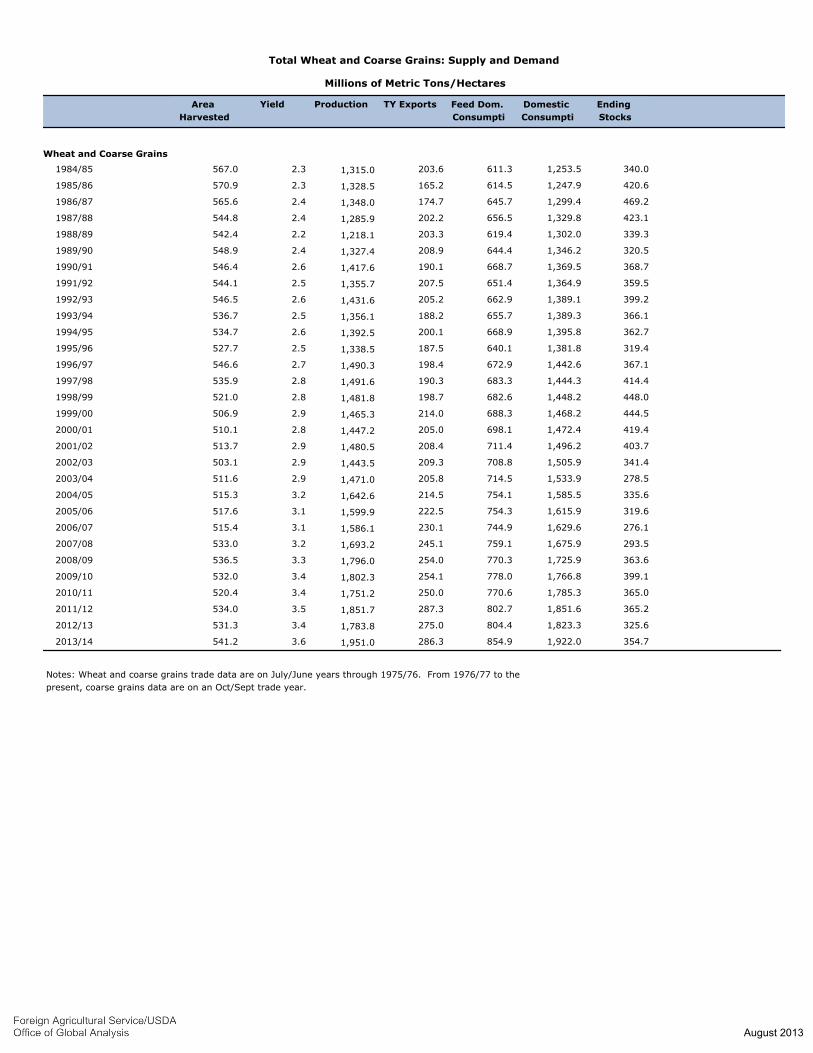
Total Wheat and Coarse Grains: Supply and Demand
Millions of Metric Tons/Hectares
Area
Harvested
Yield Production TY Exports Feed Dom.
Consumpti
Domestic
Consumpti
Ending
Stocks
Wheat and Coarse Grains
1,315.0 340.01,253.5611.3203.62.3567.0 1984/85
1,328.5 420.61,247.9614.5165.22.3570.9 1985/86
1,348.0 469.21,299.4645.7174.72.4565.6 1986/87
1,285.9 423.11,329.8656.5202.22.4544.8 1987/88
1,218.1 339.31,302.0619.4203.32.2542.4 1988/89
1,327.4 320.51,346.2644.4208.92.4548.9 1989/90
1,417.6 368.71,369.5668.7190.12.6546.4 1990/91
1,355.7 359.51,364.9651.4207.52.5544.1 1991/92
1,431.6 399.21,389.1662.9205.22.6546.5 1992/93
1,356.1 366.11,389.3655.7188.22.5536.7 1993/94
1,392.5 362.71,395.8668.9200.12.6534.7 1994/95
1,338.5 319.41,381.8640.1187.52.5527.7 1995/96
1,490.3 367.11,442.6672.9198.42.7546.6 1996/97
1,491.6 414.41,444.3683.3190.32.8535.9 1997/98
1,481.8 448.01,448.2682.6198.72.8521.0 1998/99
1,465.3 444.51,468.2688.3214.02.9506.9 1999/00
1,447.2 419.41,472.4698.1205.02.8510.1 2000/01
1,480.5 403.71,496.2711.4208.42.9513.7 2001/02
1,443.5 341.41,505.9708.8209.32.9503.1 2002/03
1,471.0 278.51,533.9714.5205.82.9511.6 2003/04
1,642.6 335.61,585.5754.1214.53.2515.3 2004/05
1,599.9 319.61,615.9754.3222.53.1517.6 2005/06
1,586.1 276.11,629.6744.9230.13.1515.4 2006/07
1,693.2 293.51,675.9759.1245.13.2533.0 2007/08
1,796.0 363.61,725.9770.3254.03.3536.5 2008/09
1,802.3 399.11,766.8778.0254.13.4532.0 2009/10
1,751.2 365.01,785.3770.6250.03.4520.4 2010/11
1,851.7 365.21,851.6802.7287.33.5534.0 2011/12
1,783.8 325.61,823.3804.4275.03.4531.3 2012/13
1,951.0 354.71,922.0854.9286.33.6541.2 2013/14
Notes: Wheat and coarse grains trade data are on July/June years through 1975/76. From 1976/77 to the
present, coarse grains data are on an Oct/Sept trade year.
August 2013
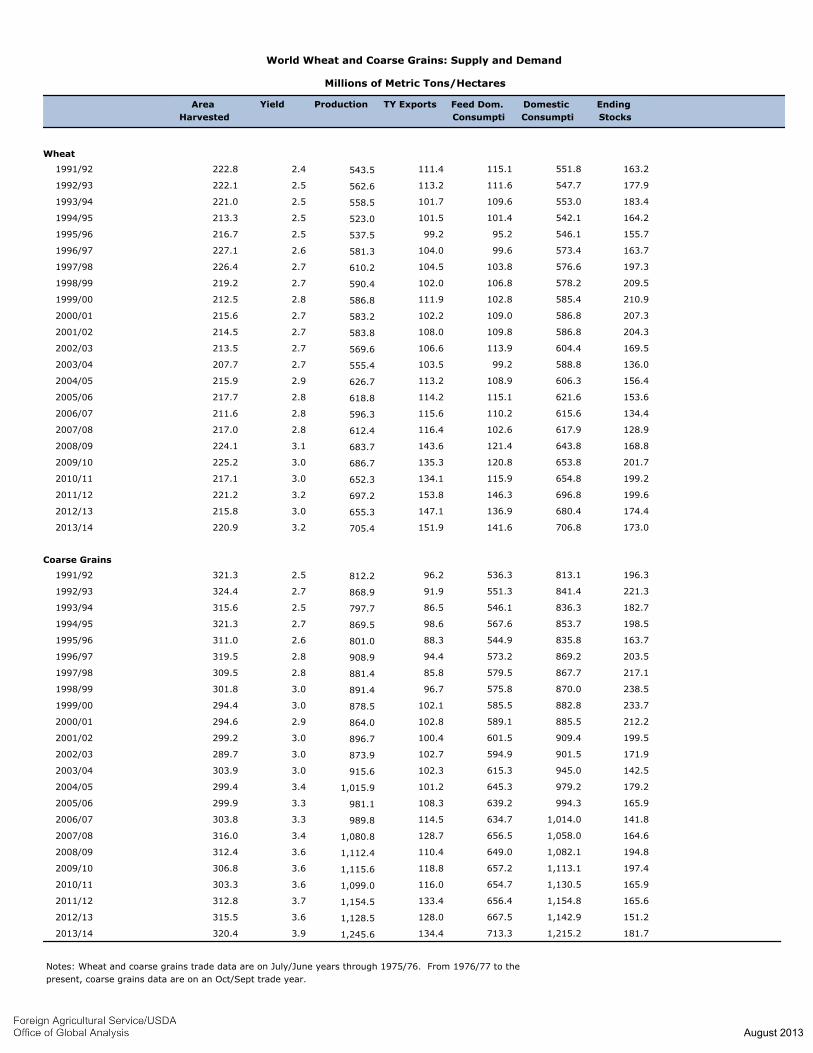
World Wheat and Coarse Grains: Supply and Demand
Millions of Metric Tons/Hectares
Area
Harvested
Yield Production TY Exports Feed Dom.
Consumpti
Domestic
Consumpti
Ending
Stocks
Wheat
543.5 163.2551.8115.1111.42.4222.8 1991/92
562.6 177.9547.7111.6113.22.5222.1 1992/93
558.5 183.4553.0109.6101.72.5221.0 1993/94
523.0 164.2542.1101.4101.52.5213.3 1994/95
537.5 155.7546.195.299.22.5216.7 1995/96
581.3 163.7573.499.6104.02.6227.1 1996/97
610.2 197.3576.6103.8104.52.7226.4 1997/98
590.4 209.5578.2106.8102.02.7219.2 1998/99
586.8 210.9585.4102.8111.92.8212.5 1999/00
583.2 207.3586.8109.0102.22.7215.6 2000/01
583.8 204.3586.8109.8108.02.7214.5 2001/02
569.6 169.5604.4113.9106.62.7213.5 2002/03
555.4 136.0588.899.2103.52.7207.7 2003/04
626.7 156.4606.3108.9113.22.9215.9 2004/05
618.8 153.6621.6115.1114.22.8217.7 2005/06
596.3 134.4615.6110.2115.62.8211.6 2006/07
612.4 128.9617.9102.6116.42.8217.0 2007/08
683.7 168.8643.8121.4143.63.1224.1 2008/09
686.7 201.7653.8120.8135.33.0225.2 2009/10
652.3 199.2654.8115.9134.13.0217.1 2010/11
697.2 199.6696.8146.3153.83.2221.2 2011/12
655.3 174.4680.4136.9147.13.0215.8 2012/13
705.4 173.0706.8141.6151.93.2220.9 2013/14
Coarse Grains
812.2 196.3813.1536.396.22.5321.3 1991/92
868.9 221.3841.4551.391.92.7324.4 1992/93
797.7 182.7836.3546.186.52.5315.6 1993/94
869.5 198.5853.7567.698.62.7321.3 1994/95
801.0 163.7835.8544.988.32.6311.0 1995/96
908.9 203.5869.2573.294.42.8319.5 1996/97
881.4 217.1867.7579.585.82.8309.5 1997/98
891.4 238.5870.0575.896.73.0301.8 1998/99
878.5 233.7882.8585.5102.13.0294.4 1999/00
864.0 212.2885.5589.1102.82.9294.6 2000/01
896.7 199.5909.4601.5100.43.0299.2 2001/02
873.9 171.9901.5594.9102.73.0289.7 2002/03
915.6 142.5945.0615.3102.33.0303.9 2003/04
1,015.9 179.2979.2645.3101.23.4299.4 2004/05
981.1 165.9994.3639.2108.33.3299.9 2005/06
989.8 141.81,014.0634.7114.53.3303.8 2006/07
1,080.8 164.61,058.0656.5128.73.4316.0 2007/08
1,112.4 194.81,082.1649.0110.43.6312.4 2008/09
1,115.6 197.41,113.1657.2118.83.6306.8 2009/10
1,099.0 165.91,130.5654.7116.03.6303.3 2010/11
1,154.5 165.61,154.8656.4133.43.7312.8 2011/12
1,128.5 151.21,142.9667.5128.03.6315.5 2012/13
1,245.6 181.71,215.2713.3134.43.9320.4 2013/14
Notes: Wheat and coarse grains trade data are on July/June years through 1975/76. From 1976/77 to the
present, coarse grains data are on an Oct/Sept trade year.
August 2013
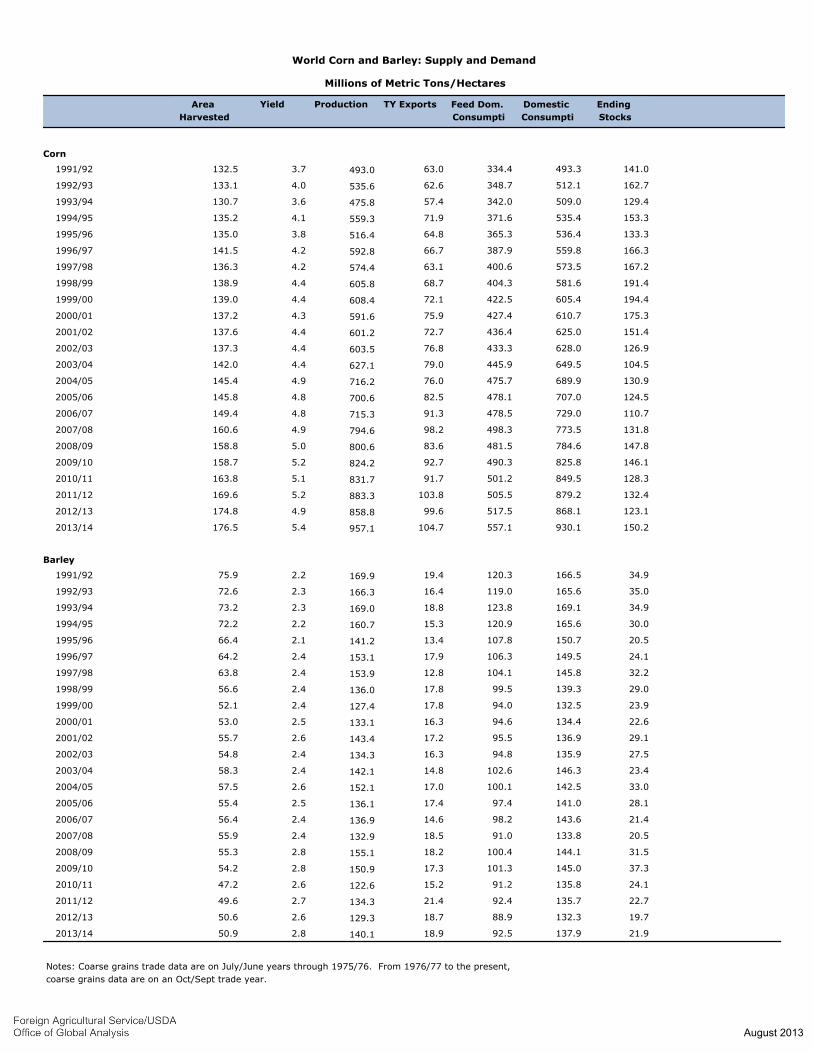
World Corn and Barley: Supply and Demand
Millions of Metric Tons/Hectares
Area
Harvested
Yield Production TY Exports Feed Dom.
Consumpti
Domestic
Consumpti
Ending
Stocks
Corn
493.0 141.0493.3334.463.03.7132.5 1991/92
535.6 162.7512.1348.762.64.0133.1 1992/93
475.8 129.4509.0342.057.43.6130.7 1993/94
559.3 153.3535.4371.671.94.1135.2 1994/95
516.4 133.3536.4365.364.83.8135.0 1995/96
592.8 166.3559.8387.966.74.2141.5 1996/97
574.4 167.2573.5400.663.14.2136.3 1997/98
605.8 191.4581.6404.368.74.4138.9 1998/99
608.4 194.4605.4422.572.14.4139.0 1999/00
591.6 175.3610.7427.475.94.3137.2 2000/01
601.2 151.4625.0436.472.74.4137.6 2001/02
603.5 126.9628.0433.376.84.4137.3 2002/03
627.1 104.5649.5445.979.04.4142.0 2003/04
716.2 130.9689.9475.776.04.9145.4 2004/05
700.6 124.5707.0478.182.54.8145.8 2005/06
715.3 110.7729.0478.591.34.8149.4 2006/07
794.6 131.8773.5498.398.24.9160.6 2007/08
800.6 147.8784.6481.583.65.0158.8 2008/09
824.2 146.1825.8490.392.75.2158.7 2009/10
831.7 128.3849.5501.291.75.1163.8 2010/11
883.3 132.4879.2505.5103.85.2169.6 2011/12
858.8 123.1868.1517.599.64.9174.8 2012/13
957.1 150.2930.1557.1104.75.4176.5 2013/14
Barley
169.9 34.9166.5120.319.42.275.9 1991/92
166.3 35.0165.6119.016.42.372.6 1992/93
169.0 34.9169.1123.818.82.373.2 1993/94
160.7 30.0165.6120.915.32.272.2 1994/95
141.2 20.5150.7107.813.42.166.4 1995/96
153.1 24.1149.5106.317.92.464.2 1996/97
153.9 32.2145.8104.112.82.463.8 1997/98
136.0 29.0139.399.517.82.456.6 1998/99
127.4 23.9132.594.017.82.452.1 1999/00
133.1 22.6134.494.616.32.553.0 2000/01
143.4 29.1136.995.517.22.655.7 2001/02
134.3 27.5135.994.816.32.454.8 2002/03
142.1 23.4146.3102.614.82.458.3 2003/04
152.1 33.0142.5100.117.02.657.5 2004/05
136.1 28.1141.097.417.42.555.4 2005/06
136.9 21.4143.698.214.62.456.4 2006/07
132.9 20.5133.891.018.52.455.9 2007/08
155.1 31.5144.1100.418.22.855.3 2008/09
150.9 37.3145.0101.317.32.854.2 2009/10
122.6 24.1135.891.215.22.647.2 2010/11
134.3 22.7135.792.421.42.749.6 2011/12
129.3 19.7132.388.918.72.650.6 2012/13
140.1 21.9137.992.518.92.850.9 2013/14
Notes: Coarse grains trade data are on July/June years through 1975/76. From 1976/77 to the present,
coarse grains data are on an Oct/Sept trade year.
August 2013
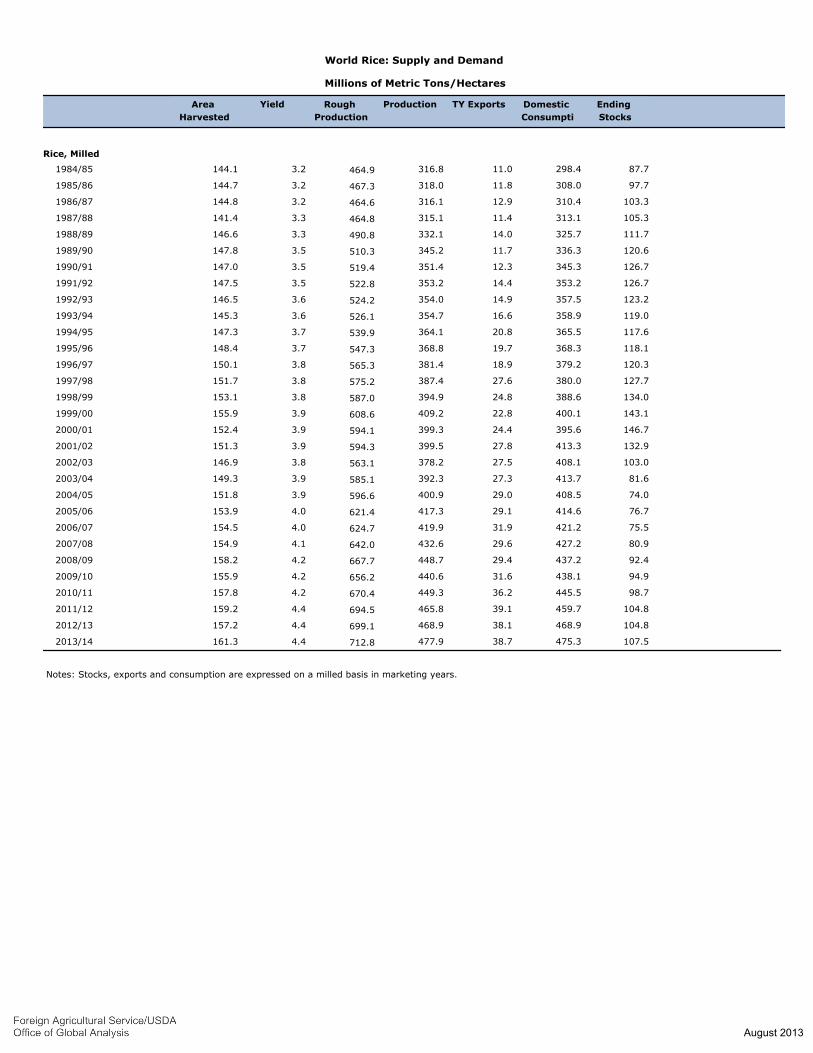
World Rice: Supply and Demand
Millions of Metric Tons/Hectares
Area
Harvested
Yield Rough
Production
Production TY Exports Domestic
Consumpti
Ending
Stocks
Rice, Milled
464.9 87.7298.411.0316.83.2144.1 1984/85
467.3 97.7308.011.8318.03.2144.7 1985/86
464.6 103.3310.412.9316.13.2144.8 1986/87
464.8 105.3313.111.4315.13.3141.4 1987/88
490.8 111.7325.714.0332.13.3146.6 1988/89
510.3 120.6336.311.7345.23.5147.8 1989/90
519.4 126.7345.312.3351.43.5147.0 1990/91
522.8 126.7353.214.4353.23.5147.5 1991/92
524.2 123.2357.514.9354.03.6146.5 1992/93
526.1 119.0358.916.6354.73.6145.3 1993/94
539.9 117.6365.520.8364.13.7147.3 1994/95
547.3 118.1368.319.7368.83.7148.4 1995/96
565.3 120.3379.218.9381.43.8150.1 1996/97
575.2 127.7380.027.6387.43.8151.7 1997/98
587.0 134.0388.624.8394.93.8153.1 1998/99
608.6 143.1400.122.8409.23.9155.9 1999/00
594.1 146.7395.624.4399.33.9152.4 2000/01
594.3 132.9413.327.8399.53.9151.3 2001/02
563.1 103.0408.127.5378.23.8146.9 2002/03
585.1 81.6413.727.3392.33.9149.3 2003/04
596.6 74.0408.529.0400.93.9151.8 2004/05
621.4 76.7414.629.1417.34.0153.9 2005/06
624.7 75.5421.231.9419.94.0154.5 2006/07
642.0 80.9427.229.6432.64.1154.9 2007/08
667.7 92.4437.229.4448.74.2158.2 2008/09
656.2 94.9438.131.6440.64.2155.9 2009/10
670.4 98.7445.536.2449.34.2157.8 2010/11
694.5 104.8459.739.1465.84.4159.2 2011/12
699.1 104.8468.938.1468.94.4157.2 2012/13
712.8 107.5475.338.7477.94.4161.3 2013/14
Notes: Stocks, exports and consumption are expressed on a milled basis in marketing years.
August 2013
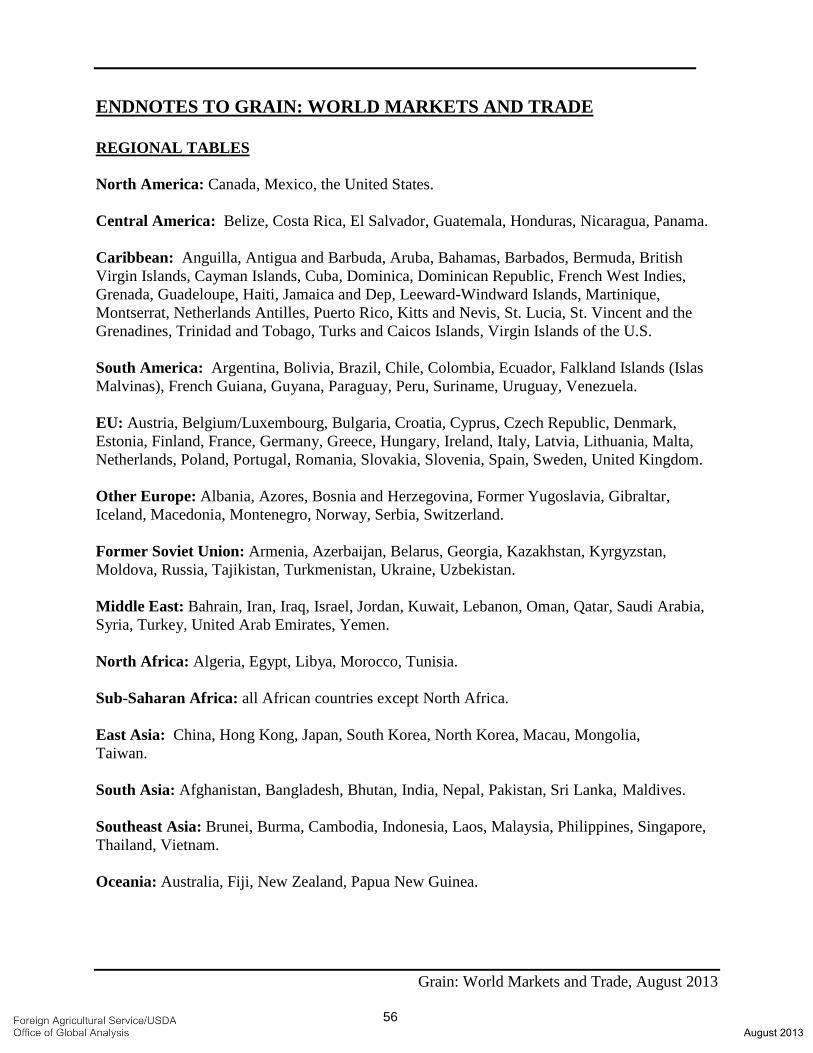
Grain: World Markets and Trade, August 2013
56
ENDNOTES TO GRAIN: WORLD MARKETS AND TRADE REGIONAL TABLES North America: Canada, Mexico, the United States. Central America: Belize, Costa Rica, El Salvador, Guatemala, Honduras, Nicaragua, Panama. Caribbean: Anguilla, Antigua and Barbuda, Aruba, Bahamas, Barbados, Bermuda, British Virgin Islands, Cayman Islands, Cuba, Dominica, Dominican Republic, French West Indies, Grenada, Guadeloupe, Haiti, Jamaica and Dep, Leeward-Windward Islands, Martinique, Montserrat, Netherlands Antilles, Puerto Rico, Kitts and Nevis, St. Lucia, St. Vincent and the Grenadines, Trinidad and Tobago, Turks and Caicos Islands, Virgin Islands of the U.S. South America: Argentina, Bolivia, Brazil, Chile, Colombia, Ecuador, Falkland Islands (Islas Malvinas), French Guiana, Guyana, Paraguay, Peru, Suriname, Uruguay, Venezuela. EU: Austria, Belgium/Luxembourg, Bulgaria, Croatia, Cyprus, Czech Republic, Denmark, Estonia, Finland, France, Germany, Greece, Hungary, Ireland, Italy, Latvia, Lithuania, Malta, Netherlands, Poland, Portugal, Romania, Slovakia, Slovenia, Spain, Sweden, United Kingdom. Other Europe: Albania, Azores, Bosnia and Herzegovina, Former Yugoslavia, Gibraltar, Iceland, Macedonia, Montenegro, Norway, Serbia, Switzerland. Former Soviet Union: Armenia, Azerbaijan, Belarus, Georgia, Kazakhstan, Kyrgyzstan, Moldova, Russia, Tajikistan, Turkmenistan, Ukraine, Uzbekistan. Middle East: Bahrain, Iran, Iraq, Israel, Jordan, Kuwait, Lebanon, Oman, Qatar, Saudi Arabia, Syria, Turkey, United Arab Emirates, Yemen. North Africa: Algeria, Egypt, Libya, Morocco, Tunisia. Sub-Saharan Africa: all African countries except North Africa. East Asia: China, Hong Kong, Japan, South Korea, North Korea, Macau, Mongolia, Taiwan. South Asia: Afghanistan, Bangladesh, Bhutan, India, Nepal, Pakistan, Sri Lanka, Maldives. Southeast Asia: Brunei, Burma, Cambodia, Indonesia, Laos, Malaysia, Philippines, Singapore, Thailand, Vietnam. Oceania: Australia, Fiji, New Zealand, Papua New Guinea.
August 2013
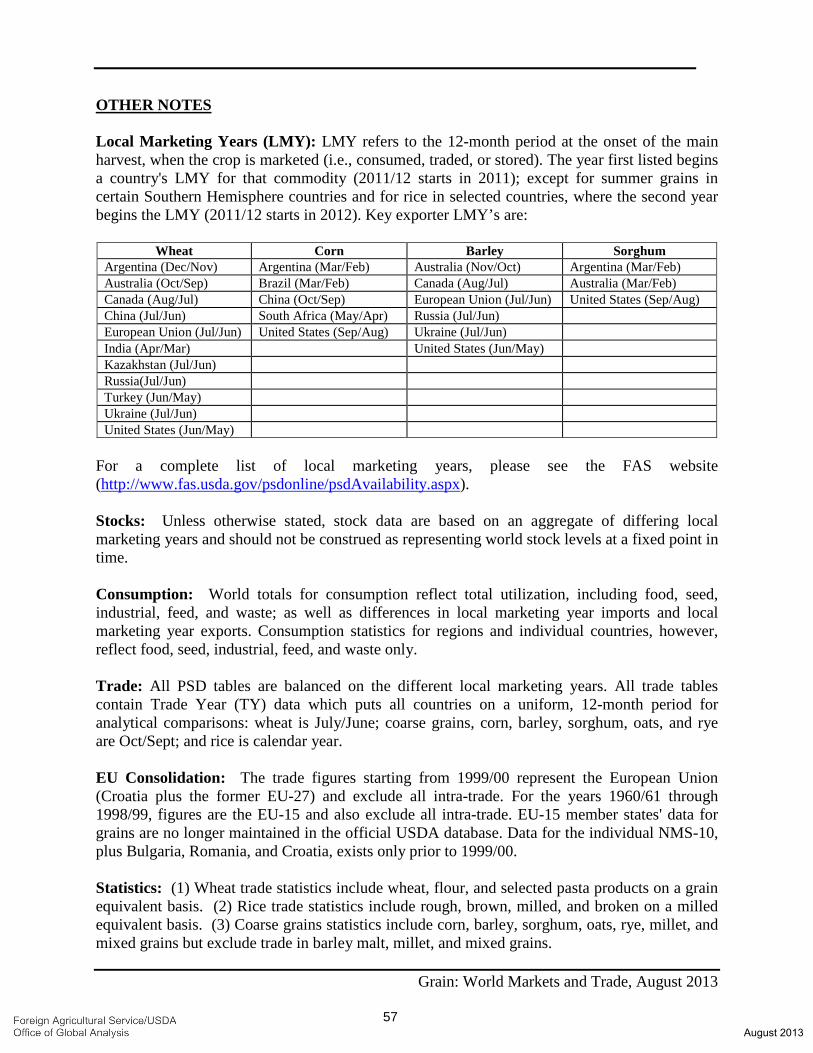
Grain: World Markets and Trade, August 2013
57
OTHER NOTES Local Marketing Years (LMY): LMY refers to the 12-month period at the onset of the main harvest, when the crop is marketed (i.e., consumed, traded, or stored). The year first listed begins a country's LMY for that commodity (2011/12 starts in 2011); except for summer grains in certain Southern Hemisphere countries and for rice in selected countries, where the second year begins the LMY (2011/12 starts in 2012). Key exporter LMY’s are:
Wheat Corn Barley Sorghum Argentina (Dec/Nov) Argentina (Mar/Feb) Australia (Nov/Oct) Argentina (Mar/Feb) Australia (Oct/Sep) Brazil (Mar/Feb) Canada (Aug/Jul) Australia (Mar/Feb) Canada (Aug/Jul) China (Oct/Sep) European Union (Jul/Jun) United States (Sep/Aug) China (Jul/Jun) South Africa (May/Apr) Russia (Jul/Jun) European Union (Jul/Jun) United States (Sep/Aug) Ukraine (Jul/Jun) India (Apr/Mar) United States (Jun/May) Kazakhstan (Jul/Jun) Russia(Jul/Jun) Turkey (Jun/May) Ukraine (Jul/Jun) United States (Jun/May)
For a complete list of local marketing years, please see the FAS website (http://www.fas.usda.gov/psdonline/psdAvailability.aspx). Stocks: Unless otherwise stated, stock data are based on an aggregate of differing local marketing years and should not be construed as representing world stock levels at a fixed point in time. Consumption: World totals for consumption reflect total utilization, including food, seed, industrial, feed, and waste; as well as differences in local marketing year imports and local marketing year exports. Consumption statistics for regions and individual countries, however, reflect food, seed, industrial, feed, and waste only. Trade: All PSD tables are balanced on the different local marketing years. All trade tables contain Trade Year (TY) data which puts all countries on a uniform, 12-month period for analytical comparisons: wheat is July/June; coarse grains, corn, barley, sorghum, oats, and rye are Oct/Sept; and rice is calendar year. EU Consolidation: The trade figures starting from 1999/00 represent the European Union (Croatia plus the former EU-27) and exclude all intra-trade. For the years 1960/61 through 1998/99, figures are the EU-15 and also exclude all intra-trade. EU-15 member states' data for grains are no longer maintained in the official USDA database. Data for the individual NMS-10, plus Bulgaria, Romania, and Croatia, exists only prior to 1999/00. Statistics: (1) Wheat trade statistics include wheat, flour, and selected pasta products on a grain equivalent basis. (2) Rice trade statistics include rough, brown, milled, and broken on a milled equivalent basis. (3) Coarse grains statistics include corn, barley, sorghum, oats, rye, millet, and mixed grains but exclude trade in barley malt, millet, and mixed grains.
August 2013
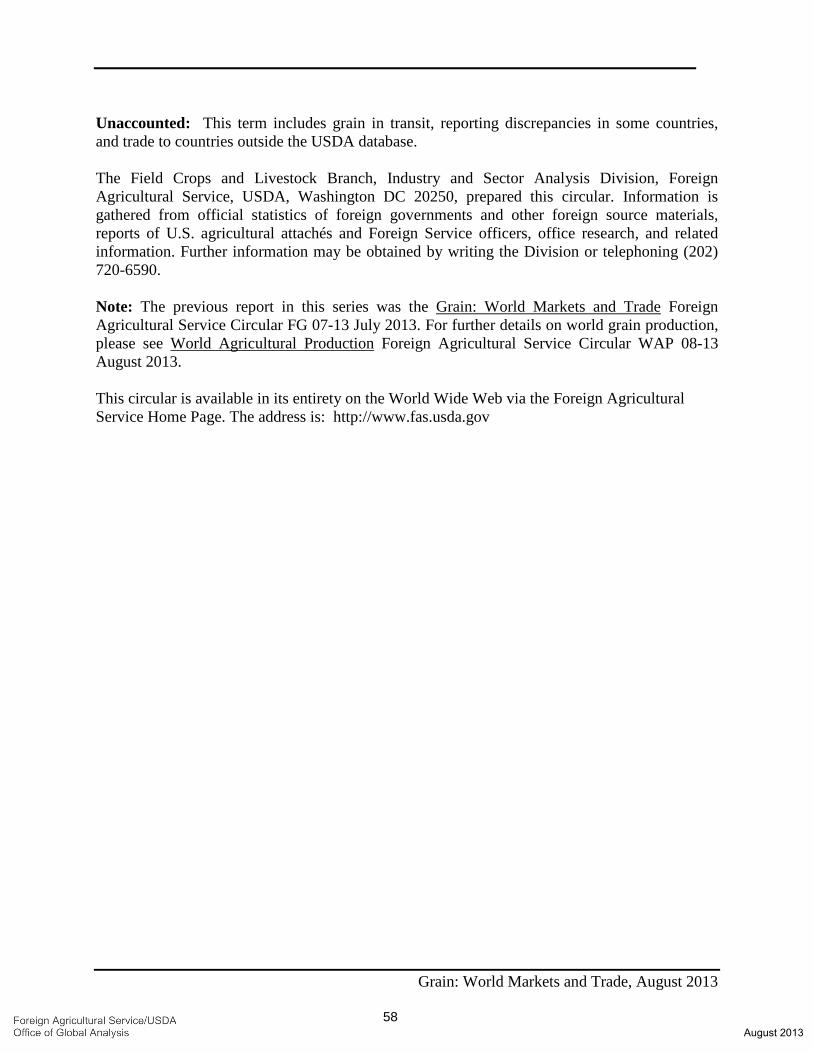
Grain: World Markets and Trade, August 2013
58
Unaccounted: This term includes grain in transit, reporting discrepancies in some countries, and trade to countries outside the USDA database. The Field Crops and Livestock Branch, Industry and Sector Analysis Division, Foreign Agricultural Service, USDA, Washington DC 20250, prepared this circular. Information is gathered from official statistics of foreign governments and other foreign source materials, reports of U.S. agricultural attachés and Foreign Service officers, office research, and related information. Further information may be obtained by writing the Division or telephoning (202) 720-6590. Note: The previous report in this series was the Grain: World Markets and Trade Foreign Agricultural Service Circular FG 07-13 July 2013. For further details on world grain production, please see World Agricultural Production Foreign Agricultural Service Circular WAP 08-13 August 2013. This circular is available in its entirety on the World Wide Web via the Foreign Agricultural Service Home Page. The address is: http://www.fas.usda.gov
August 2013