work quantity - hr-portal
TRANSCRIPT
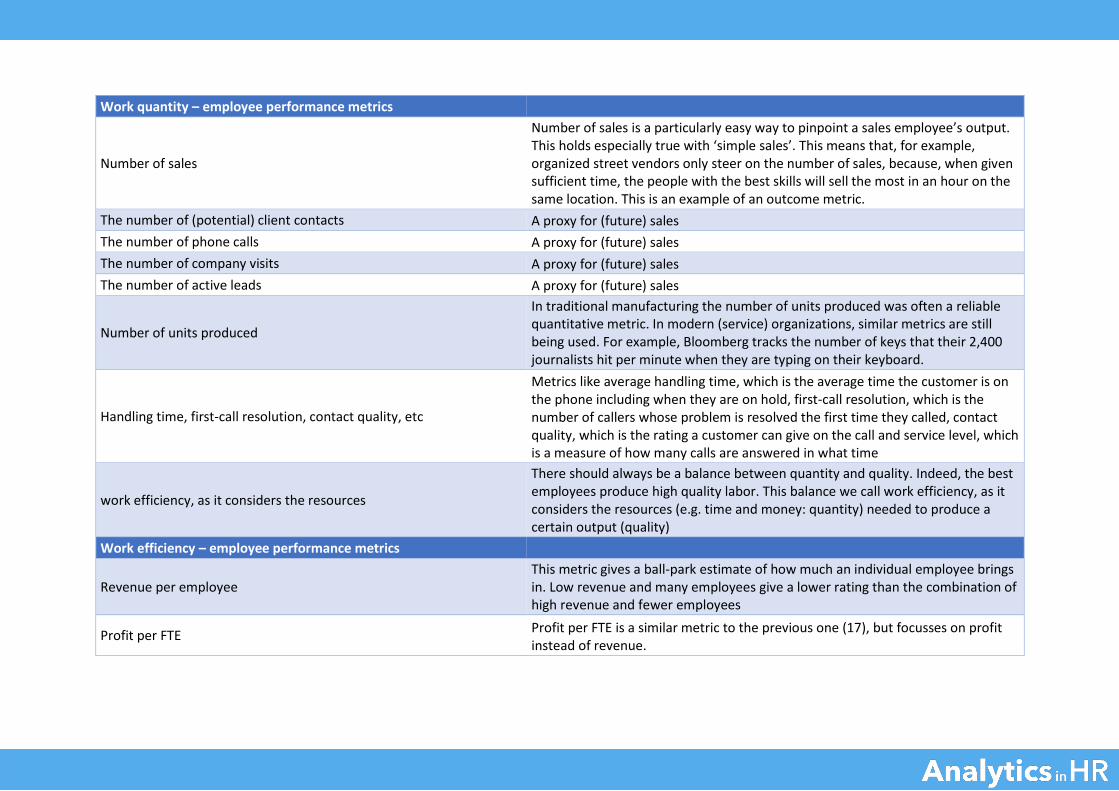
Work quantity – employee performance metrics
Number of sales
Number of sales is a particularly easy way to pinpoint a sales employee’s output. This holds especially true with ‘simple sales’. This means that, for example, organized street vendors only steer on the number of sales, because, when given sufficient time, the people with the best skills will sell the most in an hour on the same location. This is an example of an outcome metric.
The number of (potential) client contacts A proxy for (future) sales The number of phone calls A proxy for (future) sales The number of company visits A proxy for (future) sales The number of active leads A proxy for (future) sales
Number of units produced
In traditional manufacturing the number of units produced was often a reliable quantitative metric. In modern (service) organizations, similar metrics are still being used. For example, Bloomberg tracks the number of keys that their 2,400 journalists hit per minute when they are typing on their keyboard.
Handling time, first-call resolution, contact quality, etc
Metrics like average handling time, which is the average time the customer is on the phone including when they are on hold, first-call resolution, which is the number of callers whose problem is resolved the first time they called, contact quality, which is the rating a customer can give on the call and service level, which is a measure of how many calls are answered in what time
work efficiency, as it considers the resources
There should always be a balance between quantity and quality. Indeed, the best employees produce high quality labor. This balance we call work efficiency, as it considers the resources (e.g. time and money: quantity) needed to produce a certain output (quality)
Work efficiency – employee performance metrics
Revenue per employee This metric gives a ball-park estimate of how much an individual employee brings in. Low revenue and many employees give a lower rating than the combination of high revenue and fewer employees
Profit per FTE Profit per FTE is a similar metric to the previous one (17), but focusses on profit instead of revenue.
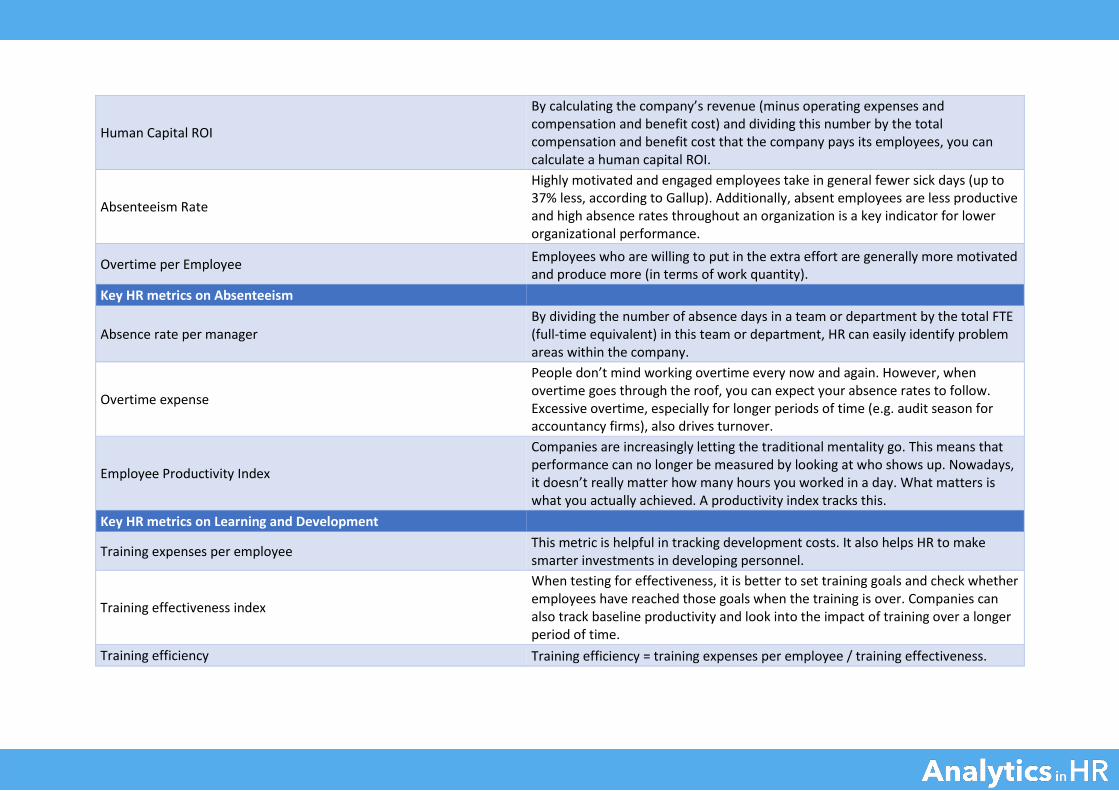
Human Capital ROI
By calculating the company’s revenue (minus operating expenses and compensation and benefit cost) and dividing this number by the total compensation and benefit cost that the company pays its employees, you can calculate a human capital ROI.
Absenteeism Rate
Highly motivated and engaged employees take in general fewer sick days (up to 37% less, according to Gallup). Additionally, absent employees are less productive and high absence rates throughout an organization is a key indicator for lower organizational performance.
Overtime per Employee Employees who are willing to put in the extra effort are generally more motivated and produce more (in terms of work quantity).
Key HR metrics on Absenteeism
Absence rate per manager By dividing the number of absence days in a team or department by the total FTE (full-time equivalent) in this team or department, HR can easily identify problem areas within the company.
Overtime expense
People don’t mind working overtime every now and again. However, when overtime goes through the roof, you can expect your absence rates to follow. Excessive overtime, especially for longer periods of time (e.g. audit season for accountancy firms), also drives turnover.
Employee Productivity Index
Companies are increasingly letting the traditional mentality go. This means that performance can no longer be measured by looking at who shows up. Nowadays, it doesn’t really matter how many hours you worked in a day. What matters is what you actually achieved. A productivity index tracks this.
Key HR metrics on Learning and Development
Training expenses per employee This metric is helpful in tracking development costs. It also helps HR to make smarter investments in developing personnel.
Training effectiveness index
When testing for effectiveness, it is better to set training goals and check whether employees have reached those goals when the training is over. Companies can also track baseline productivity and look into the impact of training over a longer period of time.
Training efficiency Training efficiency = training expenses per employee / training effectiveness.
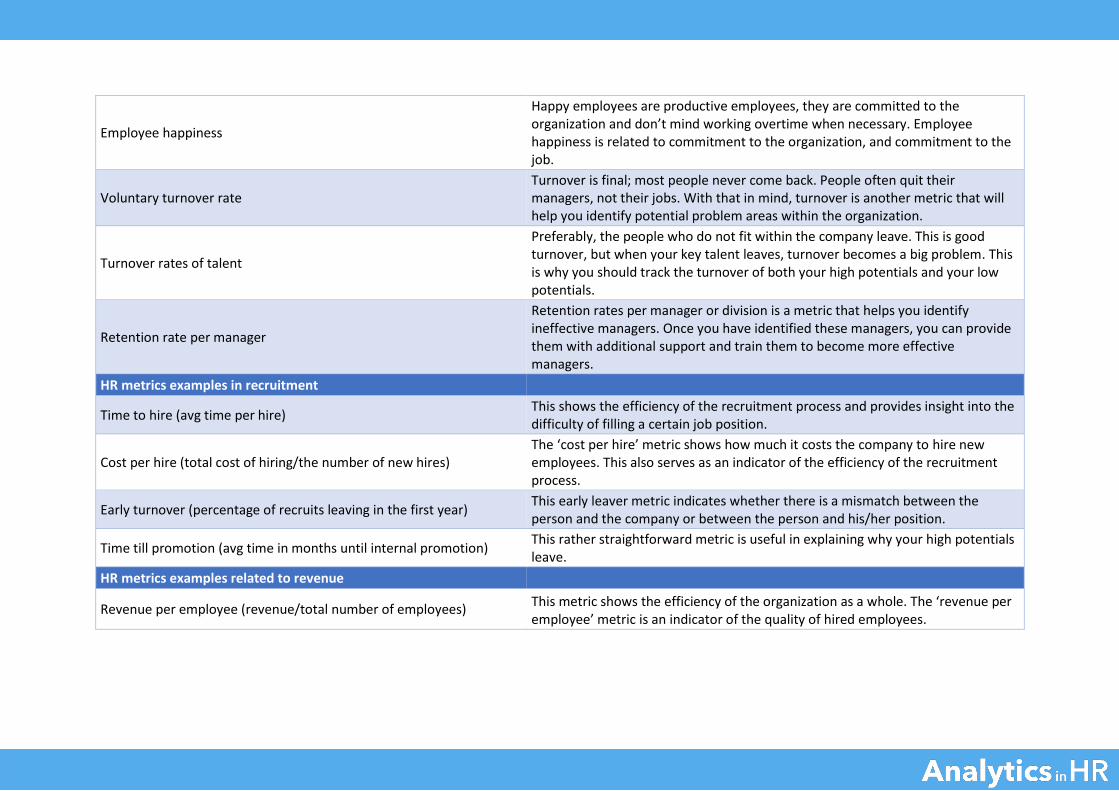
Employee happiness
Happy employees are productive employees, they are committed to the organization and don’t mind working overtime when necessary. Employee happiness is related to commitment to the organization, and commitment to the job.
Voluntary turnover rate Turnover is final; most people never come back. People often quit their managers, not their jobs. With that in mind, turnover is another metric that will help you identify potential problem areas within the organization.
Turnover rates of talent
Preferably, the people who do not fit within the company leave. This is good turnover, but when your key talent leaves, turnover becomes a big problem. This is why you should track the turnover of both your high potentials and your low potentials.
Retention rate per manager
Retention rates per manager or division is a metric that helps you identify ineffective managers. Once you have identified these managers, you can provide them with additional support and train them to become more effective managers.
HR metrics examples in recruitment
Time to hire (avg time per hire) This shows the efficiency of the recruitment process and provides insight into the difficulty of filling a certain job position.
Cost per hire (total cost of hiring/the number of new hires) The ‘cost per hire’ metric shows how much it costs the company to hire new employees. This also serves as an indicator of the efficiency of the recruitment process.
Early turnover (percentage of recruits leaving in the first year) This early leaver metric indicates whether there is a mismatch between the person and the company or between the person and his/her position.
Time till promotion (avg time in months until internal promotion) This rather straightforward metric is useful in explaining why your high potentials leave.
HR metrics examples related to revenue
Revenue per employee (revenue/total number of employees) This metric shows the efficiency of the organization as a whole. The ‘revenue per employee’ metric is an indicator of the quality of hired employees.
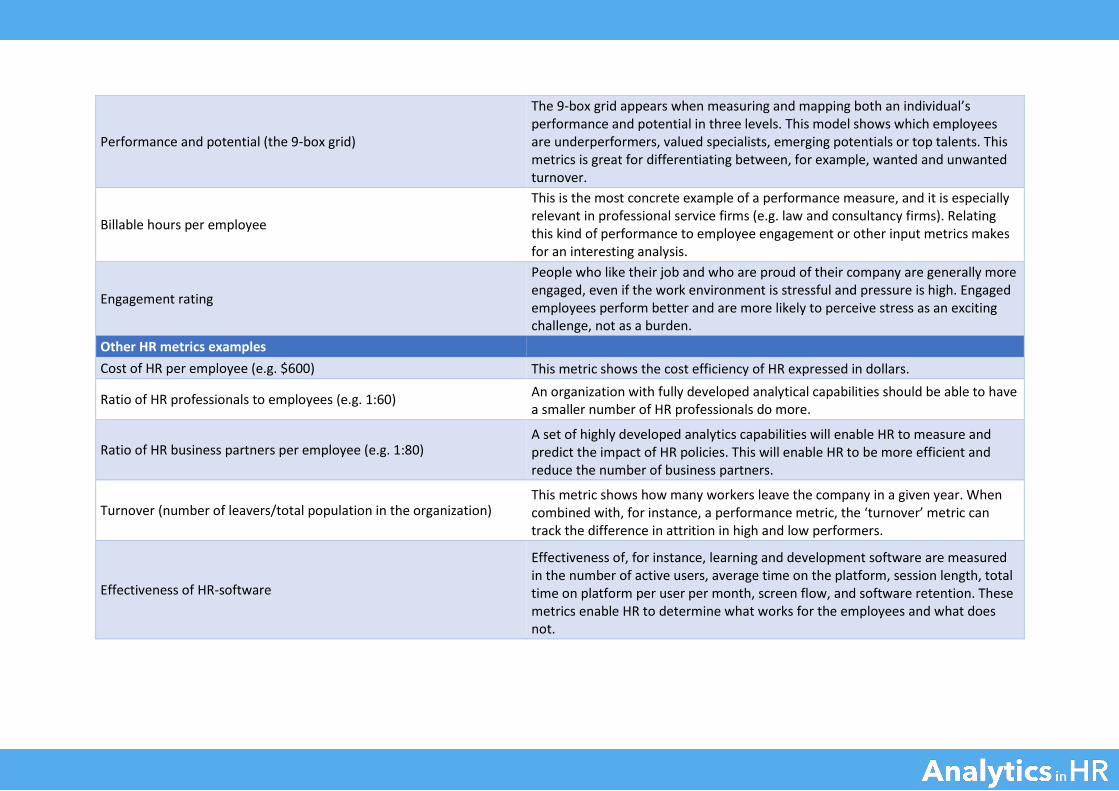
Performance and potential (the 9-box grid)
The 9-box grid appears when measuring and mapping both an individual’s performance and potential in three levels. This model shows which employees are underperformers, valued specialists, emerging potentials or top talents. This metrics is great for differentiating between, for example, wanted and unwanted turnover.
Billable hours per employee
This is the most concrete example of a performance measure, and it is especially relevant in professional service firms (e.g. law and consultancy firms). Relating this kind of performance to employee engagement or other input metrics makes for an interesting analysis.
Engagement rating
People who like their job and who are proud of their company are generally more engaged, even if the work environment is stressful and pressure is high. Engaged employees perform better and are more likely to perceive stress as an exciting challenge, not as a burden.
Other HR metrics examples Cost of HR per employee (e.g. $600) This metric shows the cost efficiency of HR expressed in dollars.
Ratio of HR professionals to employees (e.g. 1:60) An organization with fully developed analytical capabilities should be able to have a smaller number of HR professionals do more.
Ratio of HR business partners per employee (e.g. 1:80) A set of highly developed analytics capabilities will enable HR to measure and predict the impact of HR policies. This will enable HR to be more efficient and reduce the number of business partners.
Turnover (number of leavers/total population in the organization) This metric shows how many workers leave the company in a given year. When combined with, for instance, a performance metric, the ‘turnover’ metric can track the difference in attrition in high and low performers.
Effectiveness of HR-software
Effectiveness of, for instance, learning and development software are measured in the number of active users, average time on the platform, session length, total time on platform per user per month, screen flow, and software retention. These metrics enable HR to determine what works for the employees and what does not.
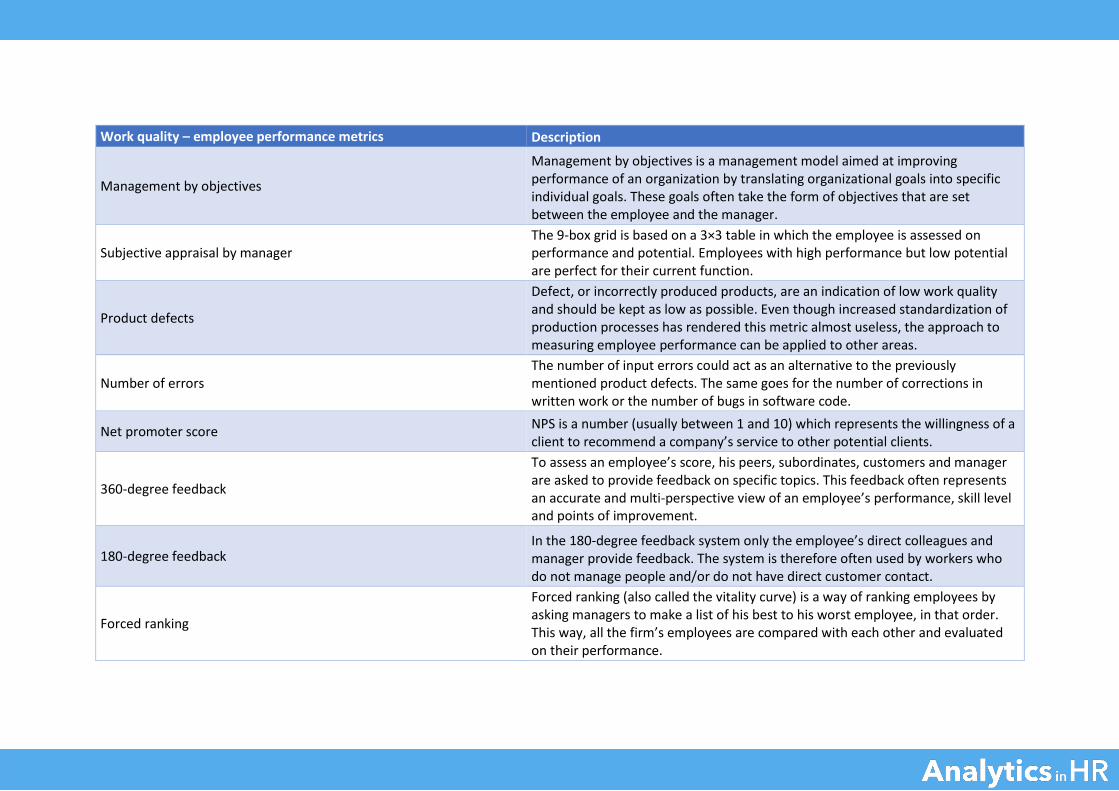
Work quality – employee performance metrics Description
Management by objectives
Management by objectives is a management model aimed at improving performance of an organization by translating organizational goals into specific individual goals. These goals often take the form of objectives that are set between the employee and the manager.
Subjective appraisal by manager The 9-box grid is based on a 3×3 table in which the employee is assessed on performance and potential. Employees with high performance but low potential are perfect for their current function.
Product defects
Defect, or incorrectly produced products, are an indication of low work quality and should be kept as low as possible. Even though increased standardization of production processes has rendered this metric almost useless, the approach to measuring employee performance can be applied to other areas.
Number of errors The number of input errors could act as an alternative to the previously mentioned product defects. The same goes for the number of corrections in written work or the number of bugs in software code.
Net promoter score NPS is a number (usually between 1 and 10) which represents the willingness of a client to recommend a company’s service to other potential clients.
360-degree feedback
To assess an employee’s score, his peers, subordinates, customers and manager are asked to provide feedback on specific topics. This feedback often represents an accurate and multi-perspective view of an employee’s performance, skill level and points of improvement.
180-degree feedback In the 180-degree feedback system only the employee’s direct colleagues and manager provide feedback. The system is therefore often used by workers who do not manage people and/or do not have direct customer contact.
Forced ranking
Forced ranking (also called the vitality curve) is a way of ranking employees by asking managers to make a list of his best to his worst employee, in that order. This way, all the firm’s employees are compared with each other and evaluated on their performance.