américa móvil’s fourth quarter of 4q17©rica móvil’s fourth quarter of 2017 financial and...
TRANSCRIPT
Carlos García-MorenoChief Financial [email protected]
Daniela Lecuona TorrasInvestor Relations [email protected]
América Móvil’s fourth quarter of 2017 financial and operating report
Mexico City, February 13, 2018 - América Móvil, S.A.B. de C.V. (“América Móvil”) [BMV: AMX]
[NYSE: AMX, AMOV], announced today its financial and operating results for the fourth
quarter of 2017.
• Our postpaid wireless subscriber base posted a solid increase of 6.4% year-on-year after net additions of 1.7 million in the quarter, including one million in Bra-zil and 206 thousand in Mexico. On the fixed-line platform broadband accesses were up 4.2% year-on-year after adding 321 thousand accesses in the quarter.
• Fourth quarter revenues of 264 billion pesos were down 2.0% in Mexican peso terms on account of FX movements, but at constant exchange rates they actually rose 0.5% with service revenues up 1.4%.
• Service revenue growth was driven by postpaid revenues, up 9.5%; prepaid data, up 9.7% and fixed-broadband revenues that rose 5.8%. Mobile ARPUs rose practi-cally across the board driven by strong data revenue growth.
• EBITDA totaled 70.2 billion pesos; it was up 6.8% in Mexican peso terms and 9.8% at constant exchange rates. South America and Mexico have shown great improvements with EBITDA rising 13.5% in each segment, at constant exchange rates. Most operations posted an increase in their EBITDA margin from a year before.
• Fourth quarter figures were affected by a major revenue loss in Puerto Rico in the aftermath of hurricane Maria that hit the island in September. Excluding this operation, our consolidated service revenues would have been 1.9% higher than a year before and EBITDA would have risen 12.0% (at constant exchange rates).
• We posted a comprehensive financing cost of 37.3 billion pesos in the quarter, almost wholly determined by foreign exchange losses arising from the deprecia-tion during the quarter of the Mexican peso vs. the U.S. dollar and the euro.
• Our operating profit came in at 28.6 billion pesos, having increased 10.9% from the year-earlier quarter. However, after financing costs we posted a net loss of 11.3 billion pesos in the quarter.
• Our cash flow enabled us to cover capital expenditures of 136.7 billion pesos and shareholder distributions (share buybacks and dividends paid out, net of divi-dends received from KPN) of 15.0 billion pesos and to reduce our net debt by 47.9 billion pesos throughout the year to 614.5 billion pesos (equivalent to 2.0 times LTM EBITDA).
CONTENT
Highlights
Relevant events
Subscribers
América Móvil Consolidated
Mexico
Argentina, Paraguay & Uruguay
Brazil
Chile
Colombia
Ecuador
Peru
Central America
Caribbean
USA
Austria & CEE
Glossary
Currency Exchange Rates
Postpaid net adds of 1.7M in 4Q
4Q17
Postpaid revenues +9.5% YoY
Excluding Puerto Rico EBITDA up 12% YoY at constant Fx
Service revenues up +1.4% YoY at constant Fx
EBITDA +9.8% YoY at constant Fx
Operating profit +11% YoY
We will host our conference call to discuss 4Q17 financial and operating results on February 14th at 9:00am
Mexico City time. To access the call please log on to www.americamovil.com/investors
Net debt to EBITDA ratio at 2.0x
CFC of MxP 37Bn
page 2
CONTENT
Highlights
Relevant events
Subscribers
América Móvil Consolidated
Mexico
Argentina, Paraguay & Uruguay
Brazil
Chile
Colombia
Ecuador
Peru
Central America
Caribbean
USA
Austria & CEE
Glossary
Currency Exchange Rates
Relevant Events
On November 13th, we made the second and final installment of our dividend payment of 30 Mexican peso cents per share corresponding to the year 2016. The second installment totaled 9.5 billion pesos in cash and 16.9 million series L shares equivalent to 2.9% of the eligible shares.
On November 30th, we announced we had entered into an agreement with the International Olympic Committee for the broadcast and exhibition rights for all countries in Latin America, except for Brazil, of the Summer and Winter Olympic Games for the period 2018-2024.
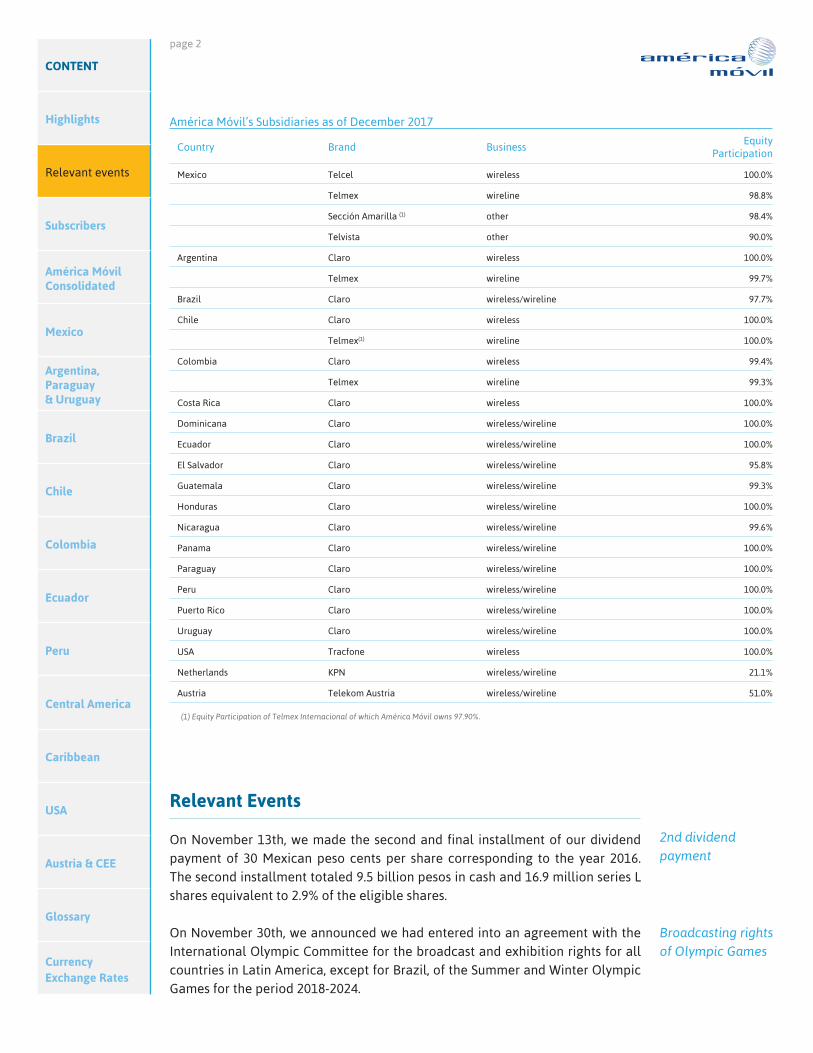
América Móvil’s Subsidiaries as of December 2017
Country Brand BusinessEquity
Participation
Mexico Telcel wireless 100.0%
Telmex wireline 98.8%
Sección Amarilla (1) other 98.4%
Telvista other 90.0%
Argentina Claro wireless 100.0%
Telmex wireline 99.7%
Brazil Claro wireless/wireline 97.7%
Chile Claro wireless 100.0%
Telmex(1) wireline 100.0%
Colombia Claro wireless 99.4%
Telmex wireline 99.3%
Costa Rica Claro wireless 100.0%
Dominicana Claro wireless/wireline 100.0%
Ecuador Claro wireless/wireline 100.0%
El Salvador Claro wireless/wireline 95.8%
Guatemala Claro wireless/wireline 99.3%
Honduras Claro wireless/wireline 100.0%
Nicaragua Claro wireless/wireline 99.6%
Panama Claro wireless/wireline 100.0%
Paraguay Claro wireless/wireline 100.0%
Peru Claro wireless/wireline 100.0%
Puerto Rico Claro wireless/wireline 100.0%
Uruguay Claro wireless/wireline 100.0%
USA Tracfone wireless 100.0%
Netherlands KPN wireless/wireline 21.1%
Austria Telekom Austria wireless/wireline 51.0%
(1) Equity Participation of Telmex Internacional of which América Móvil owns 97.90%.
2nd dividend payment
Broadcasting rights of Olympic Games

page 3
CONTENT
Highlights
Relevant events
Subscribers
América Móvil Consolidated
Mexico
Argentina, Paraguay & Uruguay
Brazil
Chile
Colombia
Ecuador
Peru
Central America
Caribbean
USA
Austria & CEE
Glossary
Currency Exchange Rates
Access Lines
We ended 2017 with 362 million accesses, slightly less than a year before, with our mobile postpaid and fixed-broadband accesses increasing 6.4% and 4.2%, and mobile prepaid and PayTV accesses falling by approximately 2.6% each. In fixed voice we lost 1.9% of our accesses as clients moved to triple play packages or to postpaid mobile services.
In mobile postpaid we added 1.7 million subscribers in the fourth quarter—one million in Brazil and 206 thousand in Mexico and 109 thousand in Austria—to fin-ish the year with 70.6 million subs. Our postpaid net adds surpassed those of the year-earlier quarter by 26.6%. In fixed broadband we gained 321 thousand clients in the quarter.
362M accesses
One million postpaid net adds in Brazil
América Móvil Fundamentals (IFRS)4Q17 4Q16
Earnings per Share (Mex$) (1) -0.17 -0.09
Earning per ADR (US$) (2) -0.18 -0.09
EBITDA per Share (Mex$) (3) 1.06 1.00
EBITDA per ADR (US$) 1.12 1.01
Net Income (millions of Mex$) -11,295 -5,972
Average Shares Outstanding (billion) 66.07 65.66 (1) Net Income / Average Shares Outstanding (2) 20 shares per ADR (3) EBITDA / Average Shares Outstanding

page 4
CONTENT
Highlights
Relevant events
Subscribers
América Móvil Consolidated
Mexico
Argentina, Paraguay & Uruguay
Brazil
Chile
Colombia
Ecuador
Peru
Central America
Caribbean
USA
Austria & CEE
Glossary
Currency Exchange Rates
Fixed-Line and Other Accesses (RGUs) as of December 2017Total(1) (Thousands)
Country Dec ’17 Sep ’17 Var.% Dec ’16 Var.%
Argentina, Paraguay and Uruguay 670 663 1.0% 618 8.3%
Austria & CEE 6,036 6,015 0.4% 5,900 2.3%
Brazil 35,904 35,962 -0.2% 36,717 -2.2%
Central America 5,811 5,698 2.0% 5,392 7.8%
Caribbean 2,700 2,721 -0.8% 2,663 1.4%
Chile 1,354 1,353 0.0% 1,324 2.2%
Colombia 6,753 6,679 1.1% 6,304 7.1%
Ecuador 367 362 1.3% 352 4.3%
Mexico 21,851 21,857 0.0% 22,178 -1.5%
Peru 1,398 1,408 -0.7% 1,468 -4.8%
Total RGUs 82,844 82,719 0.2% 82,915 -0.1%
(1) Fixed Line, Broadband and Television (Cable & DTH).
Wireless Subscribers as of December 2017Total(1) (Thousands)
Country Dec ’17 Sep ’17 Var.% Dec ’16 Var.%
Argentina, Paraguay and Uruguay 24,091 24,000 0.4% 23,749 1.4%
Austria & CEE 20,658 20,828 -0.8% 20,708 -0.2%
Brazil 59,022 60,398 -2.3% 60,171 -1.9%
Central America 15,927 15,653 1.7% 15,085 5.6%
Caribbean 5,637 5,583 1.0% 5,453 3.4%
Chile 6,985 6,880 1.5% 6,628 5.4%
Colombia 29,353 29,112 0.8% 28,954 1.4%
Ecuador 7,960 8,612 -7.6% 8,727 -8.8%
Mexico 73,855 73,315 0.7% 72,953 1.2%
Peru 12,392 12,238 1.3% 12,075 2.6%
USA 23,132 23,743 -2.6% 26,070 -11.3%
Total Wireless Lines 279,013 280,363 -0.5% 280,572 -0.6%
(1) Includes total subscribers of all companies in which América Móvil holds an economic interest; does not consider the date in which the companies started being consolidated.

page 5
América Móvil Consolidated Results
The last quarter of 2017 ended on a strong note, with inflation seemingly well contained and economic growth speeding up in most of the world, both in devel-oped and in emerging countries. With commodity prices firming up, several Latin American countries found new stimulus for expansion, particularly in Brazil that is recovering from a long and protracted recession. In Central and Eastern Eu-rope the region stood to benefit from the overall economic recovery in Western Europe that has been remarkably strong in bordering countries such as Germany and Austria.
The positive economic momentum had us posting good revenue and EBITDA growth very much across the board, with data services leading the way on both the mobile and the fixed-line platforms; mobile ARPUs rose practically every-where beefed up by data revenues. The investments we made over the last sever-al years on convergence, including the deployment of fiber optic and the expan-sion of our 4G footprint, have provided us with the fastest data networks in our region. That gives us a competitive edge on our main business segments, which in most countries has helped us strengthen our position.
Our revenues totaled 264 billion pesos in the fourth quarter. They were down 2.0% in Mexican peso terms on account of foreign exchange rate movements; at constant exchange rates, however, revenues were up 0.5%, with service revenues rising 1.4%. Service revenue growth was driven by postpaid revenues, up 9.5%; prepaid data, up 9.7% and fixed-broadband revenues that rose 5.8%.
By regions, the most dynamic one was the South American block, with service revenue growth of 4.5% (at constant exchange rates) followed by Mexico, with 3.3%.
Fourth quarter EBITDA totaled 70.2 billion pesos; it was up 6.8% in Mexican peso terms and 9.8% at constant exchange rates, compared to 1.3% in the prior quarter (not including the Colombia ruling), when EBITDA was hit by the natural disasters in Mexico and Puerto Rico. In South America EBITDA rose 13.5% at constant exchange rates, followed by Mexico with 13.5% and Central America with 7.8%.
EBITDA margins were up in most of our operations with Mexico’s increasing by 4.1 percentage points, Brazil’s by 2.9, Ecuador’s by 3.9 and Peru’s by 6.5.
25+38+11+16+10Wireless Voice
Wireline Voice
Wireless Data
Wireline Data
Pay TV
25.2
37.611.2
16.2
9.8
4Q17 Service Revenues (%)
CONTENT
Highlights
Relevant events
Subscribers
América Móvil Consolidated
Mexico
Argentina, Paraguay & Uruguay
Brazil
Chile
Colombia
Ecuador
Peru
Central America
Caribbean
USA
Austria & CEE
Glossary
Currency Exchange Rates
Mobile ARPUs increased in most of our operations
EBITDA of MxP 70Bn, +9.8% YoY at constant Fx
EBITDA margins up in most of our operations
Service revenues +1.4% YoY at constant Fx
South America service revenues +4.5% at constan Fx

page 6
CONTENT
Highlights
Relevant events
Subscribers
América Móvil Consolidated
Mexico
Argentina, Paraguay & Uruguay
Brazil
Chile
Colombia
Ecuador
Peru
Central America
Caribbean
USA
Austria & CEE
Glossary
Currency Exchange Rates
América Móvil’s Income Statement (IFRS) Millions of Mexican pesos
4Q17 4Q16 Var.% Jan-Dec 17 Jan-Dec 16 Var.%
Service Revenues 220,920 223,513 -1.2% 878,411 831,885 5.6%
Equipment Revenues 42,939 45,821 -6.3% 143,222 143,527 -0.2%
Total Revenues 263,859 269,335 -2.0% 1,021,634 975,412 4.7%
Cost of Service 81,854 86,042 -4.9% 327,745 314,580 4.2%
Cost of Equipment 49,540 53,158 -6.8% 170,154 172,495 -1.4%
Selling, General & Administrative Expenses 59,718 62,499 -4.5% 238,883 225,866 5.8%
Others 2,594 1,960 32.4% 7,549 6,350 18.9%
Total Costs and Expenses 193,706 203,659 -4.9% 744,332 719,291 3.5%
Adjusted EBITDA* 70,153 65,676 6.8% 277,302 256,122 8.3%
% of Total Revenues 26.6% 24.4% 27.1% 26.3%
Depreciation & Amortization 41,592 39,923 4.2% 158,612 146,511 8.3%
Adjusted EBIT* 28,560 25,752 10.9% 118,690 109,610 8.3%
% of Total Revenues 10.8% 9.6% 11.6% 11.2%
Net Interest Expense 7,080 7,466 -5.2% 27,375 29,669 -7.7%
Other Financial Expenses -6,995 4,339 -261.2% 1,944 16,226 -88.0%
Foreign Exchange Loss 37,244 16,407 127.0% 13,819 40,427 -65.8%
Comprehensive Financing Cost (Income) 37,329 28,212 32.3% 43,138 86,323 -50.0%
Income & Deferred Taxes 1,485 2,654 -44.0% 30,691 11,399 169.2%
Net Income before Minority Interest and Equity Participation in Results of Affiliates
-10,254 -5,114 -100.5% 44,861 11,889 277.3%
Equity Participation in Results of Affiliates 10 55 -81.3% 91 190 -51.9%
Minority Interest 326 -914 135.7% -2,829 -3,429 17.5%
Adjusted Net Income (Loss) -9,917 -5,972 -66.0% 42,123 8,649 387.0%
Net Income (Loss) -11,295 -5,972 -89.1% 29,326 8,649 239.1%
* Adjusted EBITDA and EBIT do not include the expense item associated with the arbitrage ruling in Colombia. For more details please visit https://www.bmv.com.mx/en/issuers/financialinformation/AMX-6024-CGEN_CAPIT
Our consolidated figures reflect the major loss of revenues in Puerto Rico, -16.1% year-on-year, in the aftermath of the hurricane that battered the island in Septem-ber. The revenue decline, mostly to do with the lack of electrical power through-out the island and its impact on fixed-line telephony, resulted in an even greater drag on consolidated EBITDA, as that operation’s EBITDA margin plummeted to -3.5% in the fourth quarter from 21.6% in the second one.
Excluding Puerto Rico our consolidated service revenues expanded 1.9% year-on-year and our EBITDA 12.0%.
Puerto Rico affected consolidated EBITDA

page 7
Balance Sheet (in accordance with IFRS) - América Móvil Consolidated Millions of Mexican PesosDec '17 Dec '16 Var.% Dec '17 Dec '16 Var.%
Current Assets Current LiabilitiesCash, Marketable Securities & Other Short Term Ivestments
83,391 78,076 6.8% Short Term Debt* 51,746 82,607 -37.4%
Accounts Receivable 201,814 206,684 -2.4% Accounts Payable 291,029 321,881 -9.6%
Other Current Assets 18,221 20,279 -10.1%Other Current Liabilities
70,562 65,515 7.7%
Inventories 38,810 36,871 5.3% 413,336 470,003 -12.1%342,235 341,909 0.1%
Non Current Assets Non Current LiabilitiesPlant & Equipment 676,343 701,190 -3.5% Long Term Debt 646,139 625,194 3.4%Investments in Affiliates 3,735 3,603 3.7% Other Liabilities 166,103 148,821 11.6%
812,242 774,015 4.9%Deferred AssetsGoodwill (Net) 151,463 152,633 -0.8%Intangible Assets 123,242 128,598 -4.2% Shareholder's Equity 260,634 271,024 -3.8%Deferred Assets 189,193 187,109 1.1%
Total Assets 1,486,212 1,515,042 -1.9%Total Liabilities and Equity
1,486,212 1,515,042 -1.9%
*Includes current portion of Long Term Debt.
CONTENT
Highlights
Relevant events
Subscribers
América Móvil Consolidated
Mexico
Argentina, Paraguay & Uruguay
Brazil
Chile
Colombia
Ecuador
Peru
Central America
Caribbean
USA
Austria & CEE
Glossary
Currency Exchange Rates
Our net debt was down by 15.2 billion pesos in 2017 to 614.5 billion pesos. This figure reflects the flow reduction in net debt of 47.9 billion pesos throughout the year; the Colombian ruling in July that added 18.5 billion pesos to our debt (a ruling that is being reviewed in an arbitration court); and the impact of foreign exchange variations (in Mexican peso terms) on our balance sheet.
Our cash flow enabled us to cover capital expenditures of 136.7 billion pesos and shareholder distributions (share buybacks and dividends paid out, net of divi-dends received from KPN) of 15.0 billion pesos. We acquired ownership interests in some companies investing 6.7 billion pesos and contributed 14.8 billion pesos to the reduction of outstanding pension liabilities.
Our operating profit came in at 28.6 billion pesos, having increased 10.9% from the year-earlier quarter. Relative to total revenues, it rose from 9.6% a year before to 10.8%.
We posted a comprehensive financing cost of 37.3 billion pesos in the quarter, al-most wholly determined by foreign exchange losses arising from the depreciation of the Mexican peso vs. the U.S. dollar and the euro in the quarter; a year before, comprehensive financing costs had totaled 28.2 billion pesos. For the full year 2017 our comprehensive financing costs were down 50% from the year before, to 43.1 billion pesos.
We had a net loss of 11.3 billion pesos in the fourth quarter, but a net profit of 29.3 billion pesos for the full year.
4Q EBIT margin at 11%
Full year CFC down 50% YoY
Net profit of MxP 29Bn in 2017
Net debt down MxP 15Bn in 2017
CapEx of MxP 137Bn

page 8
CONTENT
Highlights
Relevant events
Subscribers
América Móvil Consolidated
Mexico
Argentina, Paraguay & Uruguay
Brazil
Chile
Colombia
Ecuador
Peru
Central America
Caribbean
USA
Austria & CEE
Glossary
Currency Exchange Rates
Mexico
We added 206 thousand postpaid and 335 thousand prepaid subscribers in the fourth quarter to finish the year with 73.9 million wireless clients in Mexico, with our postpaid base rising 6.2% and our prepaid base roughly flat relative to the prior year. On the fixed-line platform we added 35 thousand broadband clients in the quarter to end the year with 9.3 million.
Our revenues of 72 billion pesos were similar to those of the year-earlier quar-ter, but service revenues increased 3.3% on the back of mobile service revenues that were up 8.3%. Prepaid data revenues have made an important contribution to revenue growth, with an 18.9% increase. Our blended mobile ARPU was up 7.2% year-on-year, marking its third consecutive quarterly increase. MBOUs rose 65% year-on-year, while MOUs increased 6.0% to 494 minutes, the highest level in Latin America.
Financial Debt of América Móvil* Millions
Dec -17 Dec -16
Peso - denominated debt (MxP) 83,192 87,527
Bonds and other securities 70,692 72,416
Banks and others 12,500 15,111
U.S. Dollar - denominated debt (USD) 10,084 10,656
Bonds and other securities 9,353 9,936
Banks and others 732 720
Euro - denominated Debt (EUR) 12,564 13,867
Bonds and other securities 12,564 13,845
Banks and others 0 23
Sterling - denominated Debt (GBP) 2,750 2,750
Bonds and other securities 2,750 2,750
Reais - denominated Debt (BRL) 4,234 545
Bonds and other securities 3,500 0
Banks and others 734 545
Debt denominated in other currencies (MxP) 17,864 23,195
Bonds and other securities 17,765 23,069
Banks and others 99 126
Total Debt (MxP) 697,885 707,801
Cash, Marketable Securities and Short Term Financial Investments (MxP)
83,391 78,076
Net Debt (MxP) 614,494 629,726
* This table does not include the effect of forwards and derivatives used to hedge the foreign exchange exposure. The debt figures include the face value amount of the outstanding América Móvil hybrid bonds (1,450M euros and 550M sterling), but do not include the TKA hybrid bond (600M euros).
206k postpaid adds
Wireless service revenues +8.3% YoY
page 9
CONTENT
Highlights
Relevant events
Subscribers
América Móvil Consolidated
Mexico
Argentina, Paraguay & Uruguay
Brazil
Chile
Colombia
Ecuador
Peru
Central America
Caribbean
USA
Austria & CEE
Glossary
Currency Exchange Rates
Mexico Operating Data (IFRS)
4Q17 4Q16 Var.%
Wireless Subscribers (thousands) 73,855 72,953 1.2%
Postpaid 12,766 12,015 6.2%
Prepaid 61,090 60,938 0.2%
MOU 494 466 6.0%
ARPU (MxP) 142 132 7.2%
Churn (%) 4.5% 4.9% (0.4)
Revenue Generating Units (RGUs) * 21,851 22,178 -1.5%
Fixed Lines 12,584 12,949 -2.8%
Broadband 9,267 9,229 0.4%* Fixed Line and Broadband.
INCOME STATEMENT (IFRS) - Mexico Millions of MxP
4Q17 4Q16 Var.% Jan - Dec 17 Jan - Dec 16 Var.%
Total Revenues 72,036 72,722 -0.9% 267,586 269,136 -0.6%
Total Service Revenues 51,921 50,256 3.3% 202,980 200,568 1.2%
Wireless Revenues 49,781 49,364 0.8% 177,868 175,794 1.2%
Service Revenues 31,225 28,824 8.3% 119,973 114,096 5.2%
Equipment Revenues 18,500 20,370 -9.2% 57,374 60,449 -5.1%
Fixed Line and Other Revenues 24,104 25,527 -5.6% 97,174 101,012 -3.8%
EBITDA 23,097 20,347 13.5% 84,996 85,727 -0.9%
% total revenues 32.1% 28.0% 31.8% 31.9%
EBIT 15,535 13,121 18.4% 55,195 58,500 -5.6%
% 21.6% 18.0% 20.6% 21.7%
*Total Revenues reflect eliminations derived from both the overlap of fixed and mobile operations as well as international intercompany transactions; Wireless Revenues and Fixed Line and Other Revenues only exclude intercompany transactions with foreign subsidiaries. The sum of the parts will not equal Total Revenues.
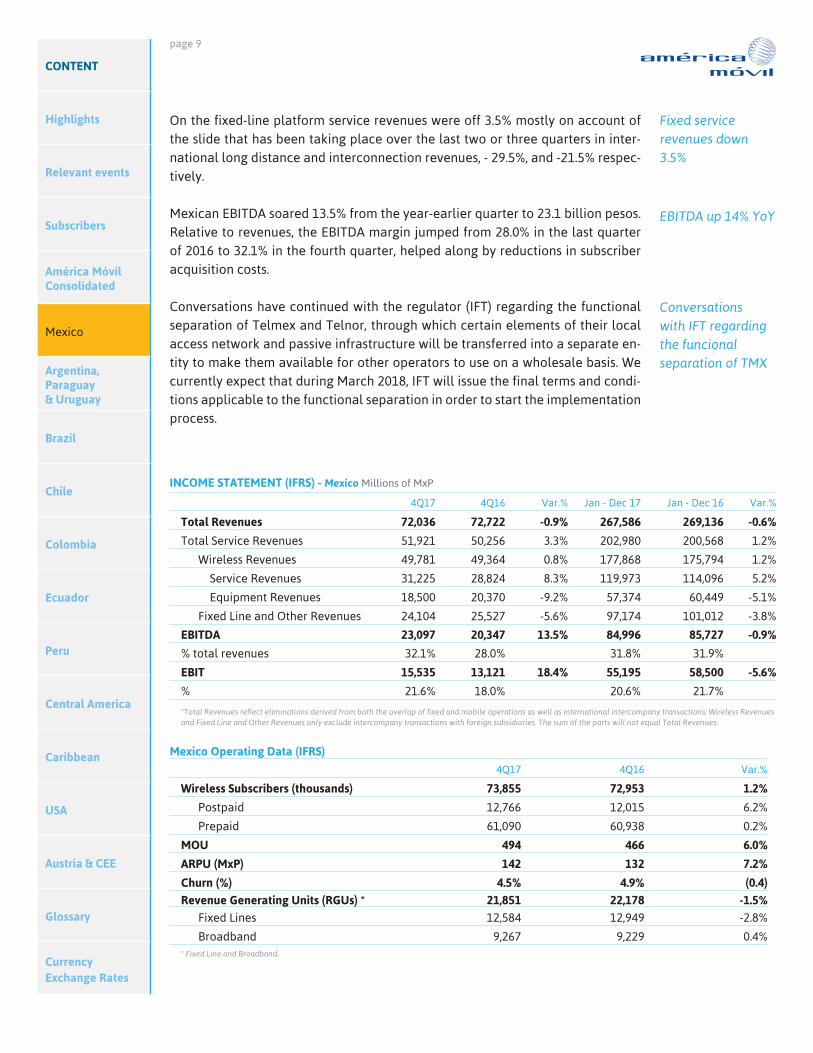
On the fixed-line platform service revenues were off 3.5% mostly on account of the slide that has been taking place over the last two or three quarters in inter-national long distance and interconnection revenues, - 29.5%, and -21.5% respec-tively.
Mexican EBITDA soared 13.5% from the year-earlier quarter to 23.1 billion pesos. Relative to revenues, the EBITDA margin jumped from 28.0% in the last quarter of 2016 to 32.1% in the fourth quarter, helped along by reductions in subscriber acquisition costs.
Conversations have continued with the regulator (IFT) regarding the functional separation of Telmex and Telnor, through which certain elements of their local access network and passive infrastructure will be transferred into a separate en-tity to make them available for other operators to use on a wholesale basis. We currently expect that during March 2018, IFT will issue the final terms and condi-tions applicable to the functional separation in order to start the implementation process.
Fixed service revenues down 3.5%
EBITDA up 14% YoY
Conversations with IFT regarding the funcional separation of TMX
page 10
CONTENT
Highlights
Relevant events
Subscribers
América Móvil Consolidated
Mexico
Argentina, Paraguay & Uruguay
Brazil
Chile
Colombia
Ecuador
Peru
Central America
Caribbean
USA
Austria & CEE
Glossary
Currency Exchange Rates
Argentina, Paraguay & Uruguay Operating Data (IFRS)
4Q17 4Q16 Var.%
Wireless Subscribers (thousands) 24,091 23,749 1.4%
Postpaid 2,394 2,454 -2.4%
Prepaid 21,697 21,295 1.9%
MOU 86 97 -12.1%
ARPU (ARP) 140 111 26.7%
Churn (%) 2.0% 2.0% 0.1
Revenue Generating Units (RGUs) * 670 618 8.3%
* Fixed Line, Broadband and Television.
INCOME STATEMENT (IFRS) - Argentina, Paraguay & Uruguay Millions of ARP
4Q17 4Q16 Var.% Jan - Dec 17 Jan - Dec 16 Var.%
Total Revenues 13,943 11,091 25.7% 49,700 39,869 24.7%
Total Service Revenues 11,058 8,445 30.9% 40,792 30,741 32.7%
Wireless Revenues 13,151 10,439 26.0% 46,723 37,446 24.8%
Service Revenues 10,259 7,770 32.0% 37,769 28,282 33.5%
Equipment Revenues 2,885 2,647 9.0% 8,908 9,128 -2.4%
Fixed Line and Other Revenues 864 739 17.0% 3,242 2,710 19.6%
EBITDA 4,569 3,514 30.0% 17,188 13,343 28.8%
% total revenues 32.8% 31.7% 34.6% 33.5%
EBIT 3,518 2,660 32.2% 13,341 10,281 29.8%
% 25.2% 24.0% 26.8% 25.8%
*Total Revenues reflect eliminations derived from both the overlap of fixed and mobile operations as well as international intercompany transactions; Wireless Revenues and Fixed Line and Other Revenues only exclude intercompany transactions with foreign subsidiaries. The sum of the parts will not equal Total Revenues.
Argentina, Paraguay and Uruguay
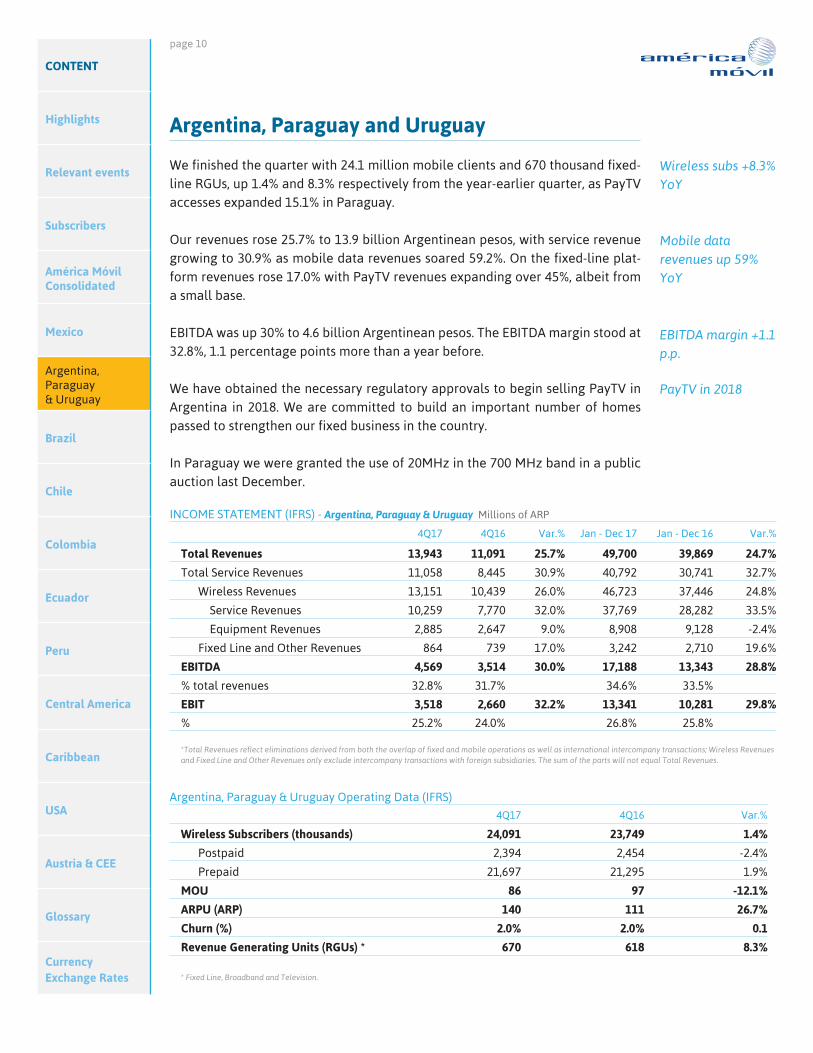
We finished the quarter with 24.1 million mobile clients and 670 thousand fixed-line RGUs, up 1.4% and 8.3% respectively from the year-earlier quarter, as PayTV accesses expanded 15.1% in Paraguay.
Our revenues rose 25.7% to 13.9 billion Argentinean pesos, with service revenue growing to 30.9% as mobile data revenues soared 59.2%. On the fixed-line plat-form revenues rose 17.0% with PayTV revenues expanding over 45%, albeit from a small base.
EBITDA was up 30% to 4.6 billion Argentinean pesos. The EBITDA margin stood at 32.8%, 1.1 percentage points more than a year before.
We have obtained the necessary regulatory approvals to begin selling PayTV in Argentina in 2018. We are committed to build an important number of homes passed to strengthen our fixed business in the country.
In Paraguay we were granted the use of 20MHz in the 700 MHz band in a public auction last December.
Wireless subs +8.3% YoY
Mobile data revenues up 59% YoY
EBITDA margin +1.1 p.p.
PayTV in 2018
page 11
CONTENT
Highlights
Relevant events
Subscribers
América Móvil Consolidated
Mexico
Argentina, Paraguay & Uruguay
Brazil
Chile
Colombia
Ecuador
Peru
Central America
Caribbean
USA
Austria & CEE
Glossary
Currency Exchange Rates
Brazil
In the fourth quarter we added almost one million postpaid clients—our post-paid base was up 11.1% year-on-year—and disconnected 2.4 million prepaid sub-scribers to finish the year with just over 59 million wireless subscribers. Over the last quarters we have consistently increased our share of postpaid net adds in the market, nearly doubling it to 32% in the fourth quarter from the year-earlier quarter on the back of our new commercial plans that provide unlimited voice in all segments; the fastest mobile internet connections; and a major investment program to modernize and expand network coverage. We are currently the only mobile operator in the country delivering 4.5G services—which provides speeds up to 10x faster than regular 4G.
Fixed RGUs, almost 36 million, were down 2.2% after net disconnections of 170 thousand PayTV units, but broadband accesses continued to grow at a healthy pace—we connected 130 thousand accesses in the quarter and led the market growth in 2017, sustaining our leading position. It is important to note that in the “ultrabroadband” segment, we are the leader with over two million accesses thanks to our advanced fiber network capillarity that can deliver speeds of more than 34 Mbps.
Our revenues, 8.9 billion reais, were up 0.8% from the year-earlier quarter, with mobile service revenues rising 7.8% on the back of very strong data-revenue growth—42.3% in the quarter—which contributed greatly to the 10.2% increase in our mobile ARPU.
On the fixed-line platform service revenues declined 2.7% mostly on account of falling long-distance revenues—down 19.4%— but also of PayTV revenues, down 3.3%. On the other hand, fixed-broadband revenues continued to expand, increas-ing 3.8% year-on-year.
EBITDA rose 11.6% year-on-year to 2.7 billion reais as a result of revenue improve-ments but also due to cost reductions in all areas of the company. The EBITDA margin expanded 2.9 percentage-points to 30.1%.
Claro has been changing the dynamics of the Brazilian market through innova-tion and constructing a unique value proposition focused on convergent solutions to connect people, households and companies. We are developing corporate so-lutions that combine advanced connectivity with cloud and IT, helping customers accelerate their digital transformation, lowering costs, improving time to market and creating positive impacts over their entire business.
Postpaid base +11% YoY
130k new brodaband accesses
Mobile data revenues +42% YoY
Fixed broadband revenues +3.8% YoY
EBITDA margin of 30%, +2.9p.p. YoY

page 12
CONTENT
Highlights
Relevant events
Subscribers
América Móvil Consolidated
Mexico
Argentina, Paraguay & Uruguay
Brazil
Chile
Colombia
Ecuador
Peru
Central America
Caribbean
USA
Austria & CEE
Glossary
Currency Exchange Rates
Brazil Operating Data (IFRS)
4Q17 4Q16 Var.%
Wireless Subscribers (thousands) 59,022 60,171 -1.9%
Postpaid 20,335 18,310 11.1%
Prepaid 38,687 41,861 -7.6%
MOU(1) 103 96 7.3%
ARPU (BrL) 16 14 10.2%
Churn (%) 4.7% 5.5% (0.8)
Revenue Generating Units (RGUs) * 35,904 36,717 -2.2%* Fixed Line, Broadband and Television. (1) We modified the methodology for calculating MOUs. We no longer include M2M subscribers.
INCOME STATEMENT (IFRS) - Brazil Millions of BrL
4Q17 4Q16 Var.% Jan - Dec 17 Jan - Dec 16 Var.%
Total Revenues 8,937 8,870 0.8% 35,478 35,982 -1.4%
Total Service Revenues 8,769 8,680 1.0% 34,864 34,959 -0.3%
Wireless Revenues 3,051 2,842 7.3% 11,674 11,704 -0.3%
Service Revenues 2,860 2,652 7.8% 11,017 10,689 3.1%
Equipment Revenues 168 190 -11.5% 614 1,019 -39.7%
Fixed Line and Other Revenues 5,887 6,029 -2.4% 23,805 24,278 -1.9%
EBITDA 2,689 2,410 11.6% 10,130 9,554 6.0%
% total revenues 30.1% 27.2% 28.6% 26.6%
EBIT 577 255 126.3% 1,484 820 81.1%
% 6.5% 2.9% 4.2% 2.3%
*Revenues reflect eliminations derived from both the overlap of fixed and mobile operations as well as international intercompany transactions.
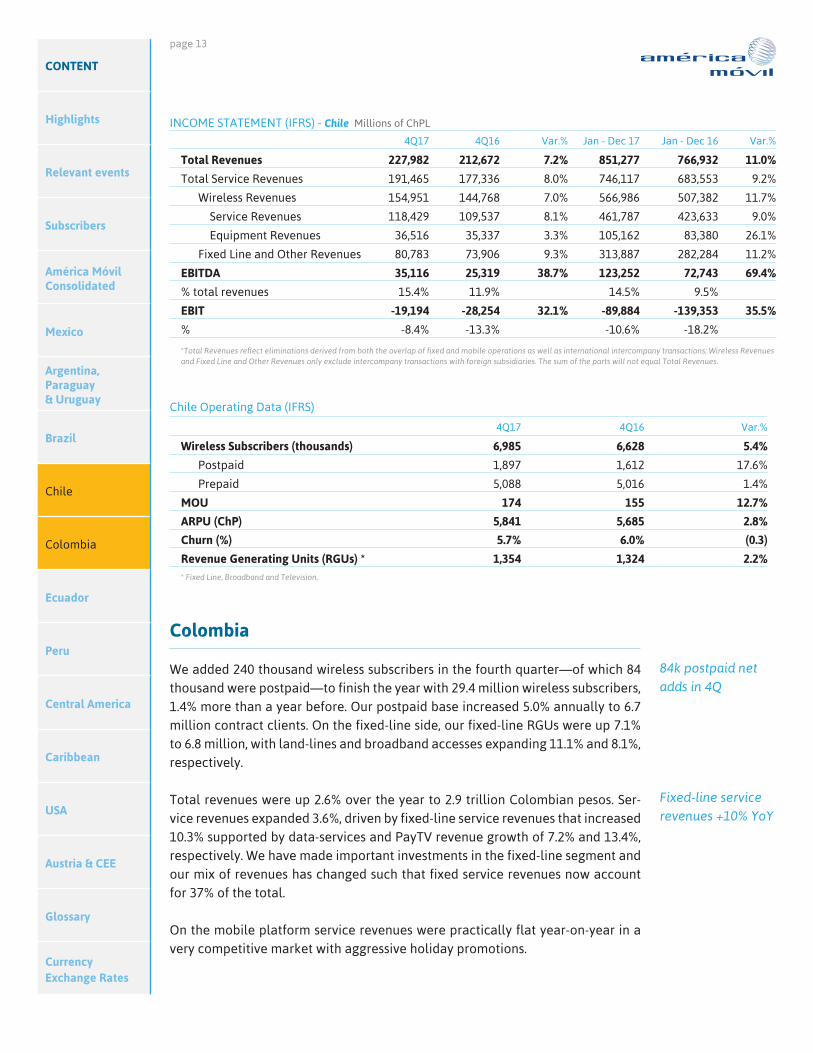
Chile
We had nearly seven million wireless subscribers in Chile at the end of the year, 5.4% more than a year before, after adding 105 thousand subscribers in the last quarter, 70% of which were postpaid subscribers. Fixed RGUs increased 2.2% relative to the prior year, with broadband accesses rising 10.9%.
Revenues increased 7.2% year-on-year to reach 228 billion Chilean pesos as service revenues increased 8.0%. Mobile and fixed data revenues led the way, expanding in the period 31.8% and 20.8%, respectively. Revenues on the fixed platform account for 35% of total revenues.
Our constant efforts to control costs in the face of good revenue growth has allowed EBITDA to continue to expand rapidly, increasing 38.7% over the prior year to 35.1 billion Chilean pesos. The EBITDA margin, equivalent to 15.4% of revenues, was up 3.5 percentage points in the year.
Wireless subs +5.4% YoY
Service revenues +8.0% YoY
EBITDA margin of 15%, +3.5 p.p. YoY
page 13
CONTENT
Highlights
Relevant events
Subscribers
América Móvil Consolidated
Mexico
Argentina, Paraguay & Uruguay
Brazil
Chile
Colombia
Ecuador
Peru
Central America
Caribbean
USA
Austria & CEE
Glossary
Currency Exchange Rates
Chile Operating Data (IFRS)
4Q17 4Q16 Var.%
Wireless Subscribers (thousands) 6,985 6,628 5.4%
Postpaid 1,897 1,612 17.6%
Prepaid 5,088 5,016 1.4%
MOU 174 155 12.7%
ARPU (ChP) 5,841 5,685 2.8%
Churn (%) 5.7% 6.0% (0.3)
Revenue Generating Units (RGUs) * 1,354 1,324 2.2%* Fixed Line, Broadband and Television.
INCOME STATEMENT (IFRS) - Chile Millions of ChPL
4Q17 4Q16 Var.% Jan - Dec 17 Jan - Dec 16 Var.%
Total Revenues 227,982 212,672 7.2% 851,277 766,932 11.0%
Total Service Revenues 191,465 177,336 8.0% 746,117 683,553 9.2%
Wireless Revenues 154,951 144,768 7.0% 566,986 507,382 11.7%
Service Revenues 118,429 109,537 8.1% 461,787 423,633 9.0%
Equipment Revenues 36,516 35,337 3.3% 105,162 83,380 26.1%
Fixed Line and Other Revenues 80,783 73,906 9.3% 313,887 282,284 11.2%
EBITDA 35,116 25,319 38.7% 123,252 72,743 69.4%
% total revenues 15.4% 11.9% 14.5% 9.5%
EBIT -19,194 -28,254 32.1% -89,884 -139,353 35.5%
% -8.4% -13.3% -10.6% -18.2%
*Total Revenues reflect eliminations derived from both the overlap of fixed and mobile operations as well as international intercompany transactions; Wireless Revenues and Fixed Line and Other Revenues only exclude intercompany transactions with foreign subsidiaries. The sum of the parts will not equal Total Revenues.
Colombia
We added 240 thousand wireless subscribers in the fourth quarter—of which 84 thousand were postpaid—to finish the year with 29.4 million wireless subscribers, 1.4% more than a year before. Our postpaid base increased 5.0% annually to 6.7 million contract clients. On the fixed-line side, our fixed-line RGUs were up 7.1% to 6.8 million, with land-lines and broadband accesses expanding 11.1% and 8.1%, respectively.
Total revenues were up 2.6% over the year to 2.9 trillion Colombian pesos. Ser-vice revenues expanded 3.6%, driven by fixed-line service revenues that increased 10.3% supported by data-services and PayTV revenue growth of 7.2% and 13.4%, respectively. We have made important investments in the fixed-line segment and our mix of revenues has changed such that fixed service revenues now account for 37% of the total.
On the mobile platform service revenues were practically flat year-on-year in a very competitive market with aggressive holiday promotions.
84k postpaid net adds in 4Q
Fixed-line service revenues +10% YoY

page 14
CONTENT
Highlights
Relevant events
Subscribers
América Móvil Consolidated
Mexico
Argentina, Paraguay & Uruguay
Brazil
Chile
Colombia
Ecuador
Peru
Central America
Caribbean
USA
Austria & CEE
Glossary
Currency Exchange Rates
Colombia Operating Data (IFRS)
4Q17 4Q16 Var.%
Wireless Subscribers* (thousands) 29,353 28,954 1.4%
Postpaid 6,688 6,372 5.0%
Prepaid 22,665 22,582 0.4%
MOU(1) 202 212 -4.8%
ARPU (COP) 16,915 17,205 -1.7%
Churn (%) 4.7% 4.6% 0.1
Revenue Generating Units (RGUs)** 6,753 6,304 7.1%
*Due to differences in the policy for accounting active subscribers, the figures in this report are different from those published by the Ministry of Communications of Colombia (MinTIC).** Fixed Line, Broadband and Television**Fixed Line, Broadband and Television. (1) We modified the methodology for calculating MOUs. We no longer include M2M subscribers.
INCOME STATEMENT (IFRS) - Colombia Billions of COP
4Q17 4Q16 Var.% Jan - Dec 17 Jan - Dec 16 Var.%
Total Revenues 2,918 2,844 2.6% 11,290 10,978 2.8%
Total Service Revenues 2,300 2,220 3.6% 9,109 8,771 3.9%
Wireless Revenues 2,118 2,116 0.1% 8,178 8,095 1.0%
Service Revenues 1,492 1,488 0.3% 5,948 5,847 1.7%
Equipment Revenues 609 615 -1.0% 2,152 2,177 -1.1%
Fixed Line and Other Revenues 859 790 8.8% 3,340 3,023 10.5%
Adjusted EBITDA* 1,163 1,102 5.5% 4,499 4,069 10.6%
% 39.8% 38.8% 39.8% 37.1%
Adjusted EBIT* 664 601 10.5% 2,589 2,248 15.2%
% 22.8% 21.1% 22.9% 20.5%*Total Revenues reflect eliminations derived from both the overlap of fixed and mobile operations as well as international intercompany transactions; Wireless Revenues and Fixed Line and Other Revenues only exclude intercompany transactions with foreign subsidiaries. The sum of the parts will not equal Total Revenues. The full-year adjusted EBITDA does not include a cash payment of 3,155 billion Colombian pesos associated to the reversal of telecom assets under our concession titles.
EBITDA was up 5.5% vs. the year-earlier quarter to 1.2 trillion Colombian pesos; the EBITDA margin, 39.8%, was up one percentage point from a year before.
On December 20th, 2017, we submitted our memorial in the arbitration claim against the Republic of Colombia, initiated in August 2016, requesting compensa-tion pursuant to the Mexico-Colombia Free Trade Agreement in relation to cer-tain measures adopted by Colombia since August 2013, including a decision from the Colombian Constitutional Court holding that certain laws eliminating the re-version of telecommunication assets did not apply to Comcel’s concessions. As a result, the Colombian Government refused to recognize Comcel’s property rights over those assets and obligated Comcel to pay an amount equivalent to the value of said assets.
EBITDA +5.5% YoY
page 15
CONTENT
Highlights
Relevant events
Subscribers
América Móvil Consolidated
Mexico
Argentina, Paraguay & Uruguay
Brazil
Chile
Colombia
Ecuador
Peru
Central America
Caribbean
USA
Austria & CEE
Glossary
Currency Exchange Rates
Ecuador Operating Data (IFRS)
4Q17 4Q16 Var.%
Wireless Subscribers (thousands) 7,960 8,727 -8.8%
Postpaid 2,547 2,439 4.4%
Prepaid 5,413 6,288 -13.9%
MOU 353 240 46.8%
ARPU (US$) 10 10 1.3%
Churn (%) 7.3% 4.5% 2.8
Revenue Generating Units (RGUs) * 367 352 4.3%* Fixed Line, Broadband and Television.
INCOME STATEMENT (IFRS) - Ecuador Millions of Dollars
4Q17 4Q16 Var.% Jan - Dec 17 Jan - Dec 16 Var.%
Total Revenues 320 353 -9.4% 1,311 1,438 -8.9%
Total Service Revenues 280 291 -3.9% 1,130 1,225 -7.8%
Wireless Revenues 299 336 -11.0% 1,228 1,366 -10.1%
Service Revenues 260 275 -5.6% 1,052 1,157 -9.1%
Equipment Revenues 39 60 -36.0% 176 209 -15.8%
Fixed Line and Other Revenues 21 17 23.6% 83 72 15.3%
EBITDA 143 145 -0.8% 522 603 -13.3%
% total revenues 44.9% 41.0% 39.8% 41.9%
EBIT 88 93 -4.7% 310 395 -21.4%
% 27.7% 26.3% 23.7% 27.5%
*Revenues reflect eliminations derived from both the overlap of fixed and mobile operations as well as international intercompany transactions.
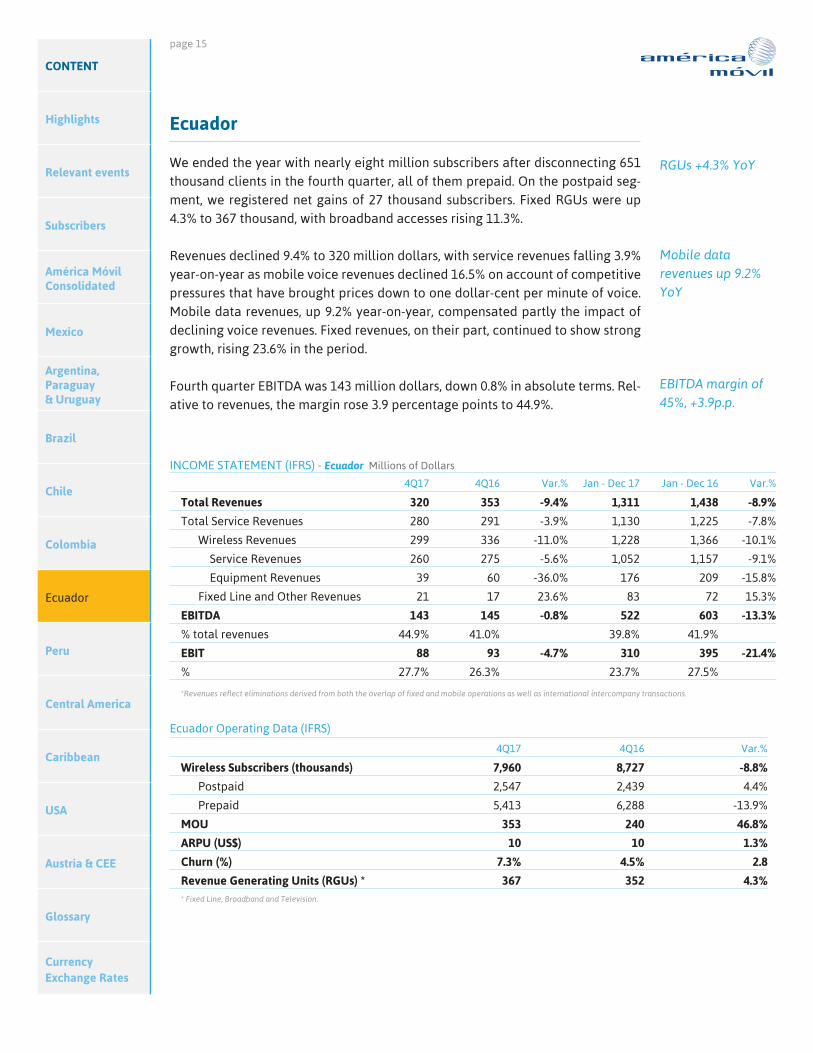
Ecuador
We ended the year with nearly eight million subscribers after disconnecting 651 thousand clients in the fourth quarter, all of them prepaid. On the postpaid seg-ment, we registered net gains of 27 thousand subscribers. Fixed RGUs were up 4.3% to 367 thousand, with broadband accesses rising 11.3%.
Revenues declined 9.4% to 320 million dollars, with service revenues falling 3.9% year-on-year as mobile voice revenues declined 16.5% on account of competitive pressures that have brought prices down to one dollar-cent per minute of voice. Mobile data revenues, up 9.2% year-on-year, compensated partly the impact of declining voice revenues. Fixed revenues, on their part, continued to show strong growth, rising 23.6% in the period.
Fourth quarter EBITDA was 143 million dollars, down 0.8% in absolute terms. Rel-ative to revenues, the margin rose 3.9 percentage points to 44.9%.
RGUs +4.3% YoY
Mobile data revenues up 9.2% YoY
EBITDA margin of 45%, +3.9p.p.

page 16
CONTENT
Highlights
Relevant events
Subscribers
América Móvil Consolidated
Mexico
Argentina, Paraguay & Uruguay
Brazil
Chile
Colombia
Ecuador
Peru
Central America
Caribbean
USA
Austria & CEE
Glossary
Currency Exchange Rates
INCOME STATEMENT (IFRS) - Peru Millions of Soles
4Q17 4Q16 Var.% Jan - Dec 17 Jan - Dec 16 Var.%
Total Revenues 1,389 1,379 0.7% 5,436 5,244 3.7%
Total Service Revenues 1,180 1,175 0.4% 4,694 4,551 3.1%
Wireless Revenues 1,177 1,162 1.2% 4,590 4,387 4.6%
Service Revenues 960 943 1.7% 3,812 3,650 4.4%
Equipment Revenues 209 203 2.8% 739 684 8.1%
Fixed Line and Other Revenues 213 217 -2.0% 846 857 -1.3%
EBITDA 307 214 43.2% 1,275 925 37.8%
% total revenues 22.1% 15.5% 23.4% 17.6%
EBIT 124 28 345.8% 531 222 138.7%
% 8.9% 2.0% 9.8% 4.2%
*Revenues reflect eliminations derived from both the overlap of fixed and mobile operations as well as international intercompany transactions.
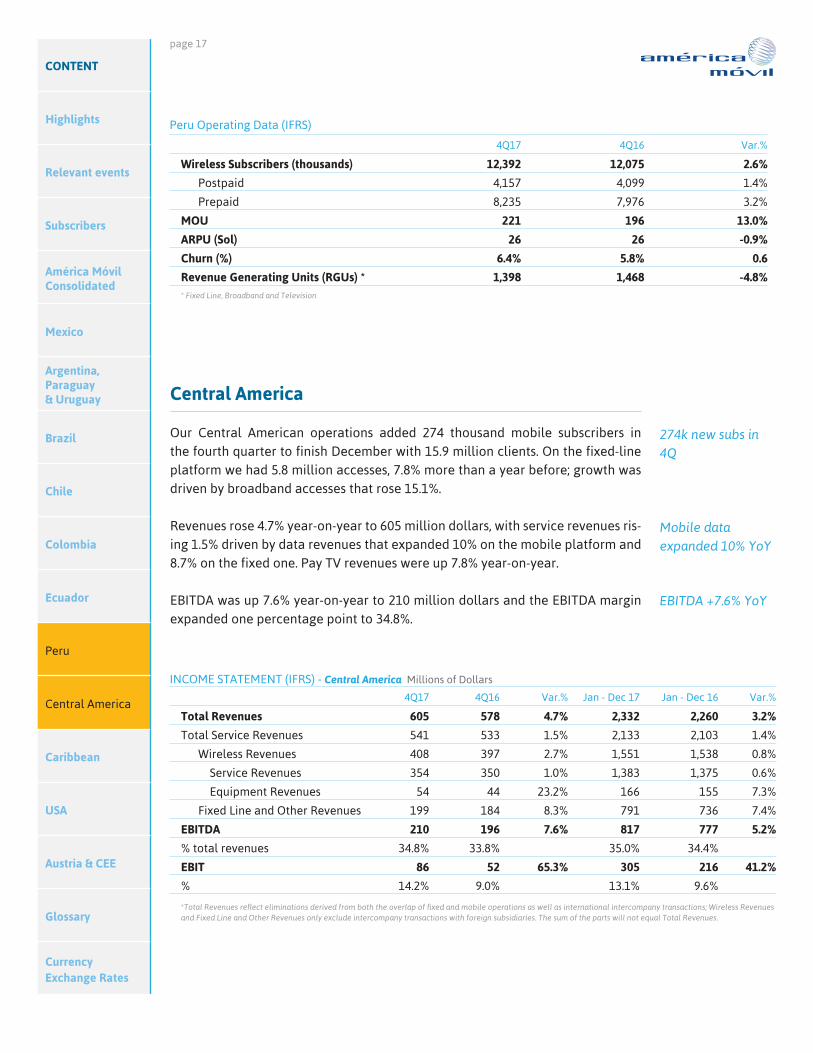
Peru
Our wireless subscriber base ended 2017 with 12.4 million subscribers, 2.6% more than a year before, after net additions of 153 thousand clients in the fourth quar-ter, including 76 thousand postpaid subscribers. After eight months of being net gainers form mobile number portability, in December we became the leader in portability by a difference of 28% vs. the second place. Additionally, we had 1.4 million fixed-line RGUs, a 4.8% reduction from a year before mostly due to the disconnection of land-line subscriptions.
The quarter’s revenues were up 0.7% to 1.4 billion soles with service revenues increasing 0.4%. Mobile service revenues grew 1.7% with mobile data revenues rising 14.7%. Wireless voice prices have fallen by 30% as we introduced unlimited calling in some of our plans.
EBITDA rose 43.2% annually to 307 million soles basically on the back of our cost-reduction efforts that led total costs and expenses to fall by 7.1% year-on-year. The EBITDA margin rose to 22.1% of revenues up from 15.5% in the last quarter of 2016.
We continue to expand the coverage of our 4G-LTE networks. In addition, in De-cember we won in a public bidding, a project to roll out almost 1,800 Km of fiber optic networks in 264 cities and towns. The project has a cost of 96.7 million dol-lars and is government sponsored.
153k net additions in 4Q
Mobile data revenues +15% YoY
EBITDA up 43% YoY
Expansion of 4G-LTE network
page 17
CONTENT
Highlights
Relevant events
Subscribers
América Móvil Consolidated
Mexico
Argentina, Paraguay & Uruguay
Brazil
Chile
Colombia
Ecuador
Peru
Central America
Caribbean
USA
Austria & CEE
Glossary
Currency Exchange Rates
Peru Operating Data (IFRS)
4Q17 4Q16 Var.%
Wireless Subscribers (thousands) 12,392 12,075 2.6%
Postpaid 4,157 4,099 1.4%
Prepaid 8,235 7,976 3.2%
MOU 221 196 13.0%
ARPU (Sol) 26 26 -0.9%
Churn (%) 6.4% 5.8% 0.6
Revenue Generating Units (RGUs) * 1,398 1,468 -4.8%* Fixed Line, Broadband and Television
Central America
Our Central American operations added 274 thousand mobile subscribers in the fourth quarter to finish December with 15.9 million clients. On the fixed-line platform we had 5.8 million accesses, 7.8% more than a year before; growth was driven by broadband accesses that rose 15.1%.
Revenues rose 4.7% year-on-year to 605 million dollars, with service revenues ris-ing 1.5% driven by data revenues that expanded 10% on the mobile platform and 8.7% on the fixed one. Pay TV revenues were up 7.8% year-on-year.
EBITDA was up 7.6% year-on-year to 210 million dollars and the EBITDA margin expanded one percentage point to 34.8%.
INCOME STATEMENT (IFRS) - Central America Millions of Dollars
4Q17 4Q16 Var.% Jan - Dec 17 Jan - Dec 16 Var.%
Total Revenues 605 578 4.7% 2,332 2,260 3.2%
Total Service Revenues 541 533 1.5% 2,133 2,103 1.4%
Wireless Revenues 408 397 2.7% 1,551 1,538 0.8%
Service Revenues 354 350 1.0% 1,383 1,375 0.6%
Equipment Revenues 54 44 23.2% 166 155 7.3%
Fixed Line and Other Revenues 199 184 8.3% 791 736 7.4%
EBITDA 210 196 7.6% 817 777 5.2%
% total revenues 34.8% 33.8% 35.0% 34.4%
EBIT 86 52 65.3% 305 216 41.2%
% 14.2% 9.0% 13.1% 9.6%
*Total Revenues reflect eliminations derived from both the overlap of fixed and mobile operations as well as international intercompany transactions; Wireless Revenues and Fixed Line and Other Revenues only exclude intercompany transactions with foreign subsidiaries. The sum of the parts will not equal Total Revenues.
274k new subs in 4Q
Mobile data expanded 10% YoY
EBITDA +7.6% YoY

page 18
CONTENT
Highlights
Relevant events
Subscribers
América Móvil Consolidated
Mexico
Argentina, Paraguay & Uruguay
Brazil
Chile
Colombia
Ecuador
Peru
Central America
Caribbean
USA
Austria & CEE
Glossary
Currency Exchange Rates
Central America Operating Data (IFRS)
4Q17 4Q16 Var.%
Wireless Subscribers (thousands) 15,927 15,085 5.6%
Postpaid 2,400 2,250 6.7%
Prepaid 13,527 12,835 5.4%
MOU(1) 162 162 0.1%
ARPU (US$) 8 7 2.4%
Churn (%) 6.8% 8.5% (1.7)
Revenue Generating Units (RGUs) * 5,811 5,392 7.8%* Fixed Line, Broadband and Television. (1) We modified the methodology for calculating MOUs. We no longer include M2M subscribers.
Caribbean
We had 5.6 million wireless subscribers in the Caribbean at the end of 2017, 3.4% more a year ago. Net subscriber additions were 54 thousand, 24 thousand of them in Puerto Rico. The postpaid subscriber base increased 4.1%, mostly in the Do-minican Republic, to 1.9 million. Fixed-line RGUs reached 2.7 million accesses, up 1.4% year-on-year.
The situation in Puerto Rico following the damage that occurred after hurricane Maria hit the island in September remains very complicated. Roughly 50% of the territory still lacks electrical power, which has made the restoration of the tele-communication services difficult. We worked rapidly to reestablish service on our networks; almost all our wireless base stations are now operating but more than half are being powered by diesel making it more expensive and complex for them to operate. As regards our fixed-line infrastructure, around 75% of the infrastruc-ture is operational; however, we have had to credit back the rents of clients that can’t use the service because they don’t have electricity.
Revenues in the Caribbean declined 9.0% year-on-year, basically because of the 16.1% revenue drop in Puerto Rico in the quarter. In the Dominican Republic, revenues were up 2.9% year-on-year on the back of data revenues that expanded 13.4% on the mobile platform and 11.6% on the fixed one. It is important to note that wireless service revenues in Puerto Rico have practically returned to their “normal” level—they were down 3% from a year before—but those on the fixed-line platform were over 40% lower than in the year-earlier quarter because of the inability of our clients to use the service given the lack of power in the island.
EBITDA declined 37.2% year-on-year to 100 million dollars, which is explained by the EBITDA loss of eight million dollars posted by Puerto Rico due to the impor-tant decline in revenues and extraordinary expenses related to the reconstruc-tion and operation of our networks since the hurricane. In the Dominican Repub-lic EBITDA rose 9.3% over the year.
Postpaid sub base +4.1% YoY
Lack of electrical power in 50% of Puerto Rico
Dominican Republic revenues +2.9% YoY
EBITDA +9.3% YoY in Dominicana

page 19
CONTENT
Highlights
Relevant events
Subscribers
América Móvil Consolidated
Mexico
Argentina, Paraguay & Uruguay
Brazil
Chile
Colombia
Ecuador
Peru
Central America
Caribbean
USA
Austria & CEE
Glossary
Currency Exchange Rates
Caribbean Operating Data (IFRS)
4Q17 4Q16 Var.%
Wireless Subscribers (thousands) 5,637 5,453 3.4%
Postpaid 1,865 1,792 4.1%
Prepaid 3,772 3,661 3.0%
MOU(1) 234 280 -16.6%
ARPU (US$) 13 13 -3.7%
Churn (%) 3.9% 4.0% (0.0)
Revenue Generating Units (RGUs) * 2,700 2,663 1.4%* Fixed Line, Broadband and Television. (1) We modified the methodology for calculating MOUs. We no longer include M2M subscribers.
INCOME STATEMENT (IFRS) - Caribbean Millions of Dollars
4Q17 4Q16 Var.% Jan - Dec 17 Jan - Dec 16 Var.%
Total Revenues 448 492 -9.0% 1,847 1,954 -5.5%
Total Service Revenues 376 427 -11.9% 1,611 1,723 -6.5%
Wireless Revenues 277 276 0.3% 1,046 1,096 -4.5%
Service Revenues 210 217 -2.8% 835 888 -6.0%
Equipment Revenues 69 60 13.6% 219 211 4.0%
Fixed Line and Other Revenues 171 216 -20.9% 801 858 -6.6%
EBITDA 100 158 -37.2% 534 613 -13.0%
% total revenues 22.2% 32.2% 28.9% 31.4%
EBIT 26 95 -72.7% 256 336 -23.8%
% 5.8% 19.4% 13.8% 17.2%
*Total Revenues reflect eliminations derived from both the overlap of fixed and mobile operations as well as international intercompany transactions; Wireless Revenues and Fixed Line and Other Revenues only exclude intercompany transactions with foreign subsidiaries. The sum of the parts will not equal Total Revenues.
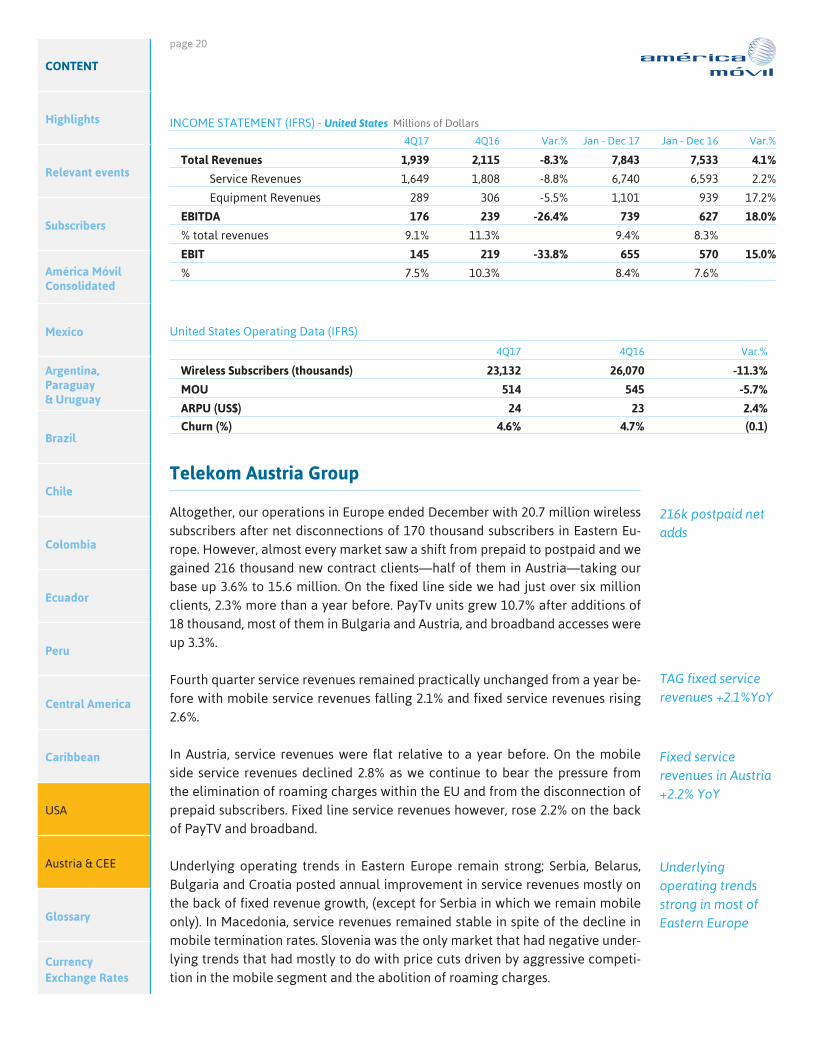
United States
We finished the year with 23.1 million subscribers—11.3% less than a year be-fore—after net disconnections of 685 thousand Safelink subscribers in the quar-ter and net gains of 74 thousand clients in our other brands.
Total revenues declined 8.3% to 1.9 billion dollars as a result of the important number of disconnections. Other brands with higher ARPU such as StraightTalk and Total Wireless registered net gains in the period so the client mix resulted in an 11.9% increase in our blended ARPU.
The aforementioned disconnections, aggressive competition in our segment, and a new blend of clients, brought EBITDA down 26.4% relative to last year to 176 million dollars and the EBITDA margin came in at 9.1%, down from 11.3%.
74k net adds ex-Safelink
Blended ARPU +12% YoY
EBITDA margin at 9.1%
page 20
CONTENT
Highlights
Relevant events
Subscribers
América Móvil Consolidated
Mexico
Argentina, Paraguay & Uruguay
Brazil
Chile
Colombia
Ecuador
Peru
Central America
Caribbean
USA
Austria & CEE
Glossary
Currency Exchange Rates
United States Operating Data (IFRS)
4Q17 4Q16 Var.%
Wireless Subscribers (thousands) 23,132 26,070 -11.3%
MOU 514 545 -5.7%
ARPU (US$) 24 23 2.4%
Churn (%) 4.6% 4.7% (0.1)
INCOME STATEMENT (IFRS) - United States Millions of Dollars
4Q17 4Q16 Var.% Jan - Dec 17 Jan - Dec 16 Var.%
Total Revenues 1,939 2,115 -8.3% 7,843 7,533 4.1%
Service Revenues 1,649 1,808 -8.8% 6,740 6,593 2.2%
Equipment Revenues 289 306 -5.5% 1,101 939 17.2%
EBITDA 176 239 -26.4% 739 627 18.0%
% total revenues 9.1% 11.3% 9.4% 8.3%
EBIT 145 219 -33.8% 655 570 15.0%
% 7.5% 10.3% 8.4% 7.6%
Telekom Austria Group
Altogether, our operations in Europe ended December with 20.7 million wireless subscribers after net disconnections of 170 thousand subscribers in Eastern Eu-rope. However, almost every market saw a shift from prepaid to postpaid and we gained 216 thousand new contract clients—half of them in Austria—taking our base up 3.6% to 15.6 million. On the fixed line side we had just over six million clients, 2.3% more than a year before. PayTv units grew 10.7% after additions of 18 thousand, most of them in Bulgaria and Austria, and broadband accesses were up 3.3%.
Fourth quarter service revenues remained practically unchanged from a year be-fore with mobile service revenues falling 2.1% and fixed service revenues rising 2.6%.
In Austria, service revenues were flat relative to a year before. On the mobile side service revenues declined 2.8% as we continue to bear the pressure from the elimination of roaming charges within the EU and from the disconnection of prepaid subscribers. Fixed line service revenues however, rose 2.2% on the back of PayTV and broadband.
Underlying operating trends in Eastern Europe remain strong; Serbia, Belarus, Bulgaria and Croatia posted annual improvement in service revenues mostly on the back of fixed revenue growth, (except for Serbia in which we remain mobile only). In Macedonia, service revenues remained stable in spite of the decline in mobile termination rates. Slovenia was the only market that had negative under-lying trends that had mostly to do with price cuts driven by aggressive competi-tion in the mobile segment and the abolition of roaming charges.
216k postpaid net adds
TAG fixed service revenues +2.1%YoY
Fixed service revenues in Austria +2.2% YoY
Underlying operating trends strong in most of Eastern Europe

page 21
CONTENT
Highlights
Relevant events
Subscribers
América Móvil Consolidated
Mexico
Argentina, Paraguay & Uruguay
Brazil
Chile
Colombia
Ecuador
Peru
Central America
Caribbean
USA
Austria & CEE
Glossary
Currency Exchange Rates
A1 Telekom Austria Group Operating Data (IFRS) - Proforma
4Q17 4Q16 Var.%
Wireless Subscribers (thousands) 20,658 20,708 -0.2%
Postpaid 15,581 15,041 3.6%
Prepaid 5,077 5,667 -10.4%
MOU(1) 342 328 4.1%
ARPU (Euros) 8 9 -2.2%
Churn (%) 2.2% 2.2% 0.0
Revenue Generating Units (RGUs) * 6,036 6,076 -0.6%*Fixed Line, Broadband and Television. (1) We modified the methodology for calculating MOUs. We no longer include M2M subscribers.
INCOME STATEMENT (IFRS) - A1 Telekom Austria Group - Proforma Millions of Euros
4Q17 4Q16 Var.% Jan - Dec 17 Jan - Dec 16 Var.%
Total Revenues* 1,158 1,139 1.7% 4,485 4,344 3.3%
Total service revenues 940 941 -0.1% 3,775 3,716 1.6%
Wireless service revenues 525 536 -2.1% 2,139 2,146 -0.3%
Fixed-line service revenues 415 405 2.6% 1,636 1,570 4.2%
Equipment revenues 161 141 14.2% 504 450 12.0%
EBITDA 288 279 3.5% 1,397 1,370 2.0%
% total revenues 25.5% 25.1% 31.9% 32.2%
EBIT -20 54 n.m. 444 496 -10.5%
% total revenues -1.8% 4.9% 10.1% 11.7%
*Total Revenues include other operating income. For further detail please visit www.a1.group/en/investor-relations n.m Not meaningful.
The elimination of roaming charges within the EU for voice and data has resulted in very important increases in usage. In the fourth quarter, incoming voice traffic in Austria, Bulgaria, Croatia and Slovenia increased around 90% relative to 2016 while outgoing traffic rose even further. Net roaming voice traffic grew more than 1.5 times in Bulgaria, Croatia and Slovenia and nearly 50% in Austria. In Belarus, Macedonia and Serbia, traffic has remained more stable. We observed a similar effect on data. The rate of decline of roaming revenues has decelerated over the year.
EBITDA was up 3.5% (proforma) to 288 million Euros and was equivalent to 25.5% of revenues, 0.4 percentage points higher than a year before as a result of restruc-turing charges in Austria, positive foreign exchange effects and positive one off effects in Eastern Europe.
We have made important efforts to reduce costs across the board and have seen good results in several lines including maintenance costs, leased links, and out-sourcing costs amongst others. On the other hand, higher subscriber acquisition and retention costs in Austria, greater operating costs associated to A1 Digital, and net roaming charges have weighed on EBITDA.
Increase in roaming traffic
EBITDA margin at 25.5%
Cost improvements

page 22
CONTENT
Highlights
Relevant events
Subscribers
América Móvil Consolidated
Mexico
Argentina, Paraguay & Uruguay
Brazil
Chile
Colombia
Ecuador
Peru
Central America
Caribbean
USA
Austria & CEE
Glossary
Currency Exchange Rates
Glossary of Terms
ARPU Average Revenue per User. The ratio of service revenues in a given period to the average number of wireless subscribers in the same period. It is pre-sented on a monthly basis.
ARPM Average Revenue per Minute. The ratio of service revenues to airtime traffic.
Capex Capital Expenditure. Accrued capital expenditures related to the expansion of the telecommunications infrastructure.
Churn Disconnection Rate. The ratio of wireless subscribers disconnected during a given period to the number of wireless subscribers at the beginning of that period.
EBIT Earnings Before Interest and Taxes, also known as Operating Profit.
EBIT margin The ratio of EBIT to total operating revenue.
EBITDA Earnings Before Interest, Taxes, Depreciation, and Amortization.
EBITDA margin The ratio of EBITDA to total operating revenue.
EPS (Mexican pesos) Earnings per share. Total earnings in Mexican pesos divided by total shares.
Earnings per ADR (US$) Total earnings in U.S. dollars divided by total ADRs equivalent.
Equity subscribers Subscribers weighted by the economic interest held in each company.
Gross additions Total number of subscribers acquired during the period.
Licensed pops Licensed population. Population covered by the licenses that each of the
companies manage.
LTE Long-term evolution is a 4th generation standard for wireless communica-tion of high-speed data for mobile phones and data terminals.
Market share A company’s subscriber base divided by the total number of subscribers in
that country.
MBOU Megabytes of Use per subscriber. The ratio of wireless data in a given period to the average number of wireless subscribers in that same period. It is pre-sented on a monthly basis.
MOU Minutes of Use per subscriber. The ratio of wireless traffic in a given period to the average number of wireless subscribers in that same period. It is pre-sented on a monthly basis.

page 23
CONTENT
Highlights
Relevant events
Subscribers
América Móvil Consolidated
Mexico
Argentina, Paraguay & Uruguay
Brazil
Chile
Colombia
Ecuador
Peru
Central America
Caribbean
USA
Austria & CEE
Glossary
Currency Exchange Rates
Net subscriber additions The difference in the subscriber base from one period to another. It is the
different between gross additions and disconnections.
Net debt Total short and long term debt minus cash and marketable securities.
Net debt / EBITDA The ratio of total short and long term debt minus cash and securities to trail-
ing 12-month income before interest, taxes, depreciation and amortization.
Prepaid Subscriber that may purchase airtime to recharge a cellular phone. The cli-ent does not hold a contract with the company for voice and data services.
Postpaid Subscriber that has a contract for the use of airtime. The client has no need of activating airtime, it is done so immediately.
SMS Short Message Service.
SAC Subscriber Acquisition Cost. The sum of handset subsidies, marketing ex-penses and commissions to distributors for handset activation. Handset sub-sidy is calculated as the difference between equipment cost and equipment revenues.
Wireless penetration The ratio of total wireless subscribers in any given country divided by the
total population in that country.

page 24
CONTENT
Highlights
Relevant events
Subscribers
América Móvil Consolidated
Mexico
Argentina, Paraguay & Uruguay
Brazil
Chile
Colombia
Ecuador
Peru
Central America
Caribbean
USA
Austria & CEE
Glossary
Currency Exchange Rates
Exchange Rates Local Currency Units per USD
4Q17 4Q16 Var.% Jan - Dec 17 Jan - Dec 16 Var.%
Mexico
EoP 19.79 20.73 -4.6% 19.79 20.73 -4.6%
Average 18.93 19.79 -4.4% 18.94 18.65 1.5%
Brazil
EoP 3.31 3.26 1.5% 3.31 3.26 1.5%
Average 3.25 3.30 -1.5% 3.19 3.49 -8.5%
Argentina
EoP 18.65 15.89 17.4% 18.65 15.89 17.4%
Average 17.56 15.47 13.5% 16.56 14.77 12.1%
Chile
EoP 615 669 -8.2% 615 669 -8.2%
Average 633 665 -4.8% 649 676 -4.1%
Colombia
EoP 2,984 3,001 -0.6% 2,984 3,001 -0.6%
Average 2,987 3,017 -1.0% 2,952 3,053 -3.3%
Guatemala
EoP 7.34 7.52 -2.4% 7.34 7.52 -2.4%
Average 7.34 7.50 -2.2% 7.35 7.60 -3.3%
Honduras
EoP 23.75 23.67 0.4% 23.75 23.67 0.4%
Average 23.69 23.40 1.2% 23.65 22.99 2.9%
Nicaragua
EoP 30.78 29.32 5.0% 30.78 29.32 5.0%
Average 30.60 29.15 5.0% 30.05 28.62 5.0%
Costa Rica
EoP 573 561 2.0% 573 561 2.0%
Average 571 560 2.1% 572 551 3.8%
Peru
EoP 3.25 3.36 -3.4% 3.25 3.36 -3.4%
Average 3.25 3.40 -4.4% 3.26 3.38 -3.4%
Paraguay
EoP 5,590 5,767 -3.1% 5,590 5,767 -3.1%
Average 5,642 5,730 -1.5% 5,618 5,671 -0.9%
Uruguay
EoP 28.81 29.34 -1.8% 28.81 29.34 -1.8%
Average 29.16 28.58 2.0% 28.68 30.16 -4.9%
Dominican Republic
EoP 48.32 46.71 3.4% 48.32 46.71 3.4%
Average 48.08 46.58 3.2% 47.57 46.07 3.3%
Austria & CEE
EoP 0.83 0.95 -12.4% 0.83 0.95 -12.4%
Average 0.85 0.93 -8.4% 0.89 0.90 -2.0%
page 25
For further information please visit our website at: www.americamovil.com
América Móvil, S.A.B. de C.V. (the “Company”) quarterly reports and all other written materials may from time to time contain forward-looking statements that reflect the current views and/or expectations of the Company and its management with respect to its performance, business and future events. Forward looking statements include, without limitation, any statement that may predict, forecast, indicate or imply future results, performance, or achievements, and may contain words like “believe”, “anticipate”, “expect”, “envisages”, “will likely result”, or any other words or phrases of similar meaning. Such statements are subject to a number of risks, uncertainties and assumptions. We caution you that a number of important factors could cause actual results to differ materially from the plans, objectives, expectations, estimates and intentions expressed in this report. In no event, neither the Company nor any of its subsidiaries, affiliates, directors, officers, agents or employees shall be liable before any third party (including investors) for any investment or business decision made or action taken in reliance on the information and statements contained in this document or for any consequential, special or similar damages.
CONTENT
Highlights
Relevant events
Subscribers
América Móvil Consolidated
Mexico
Argentina, Paraguay & Uruguay
Brazil
Chile
Colombia
Ecuador
Peru
Central America
Caribbean
USA
Austria & CEE
Glossary
Currency Exchange Rates
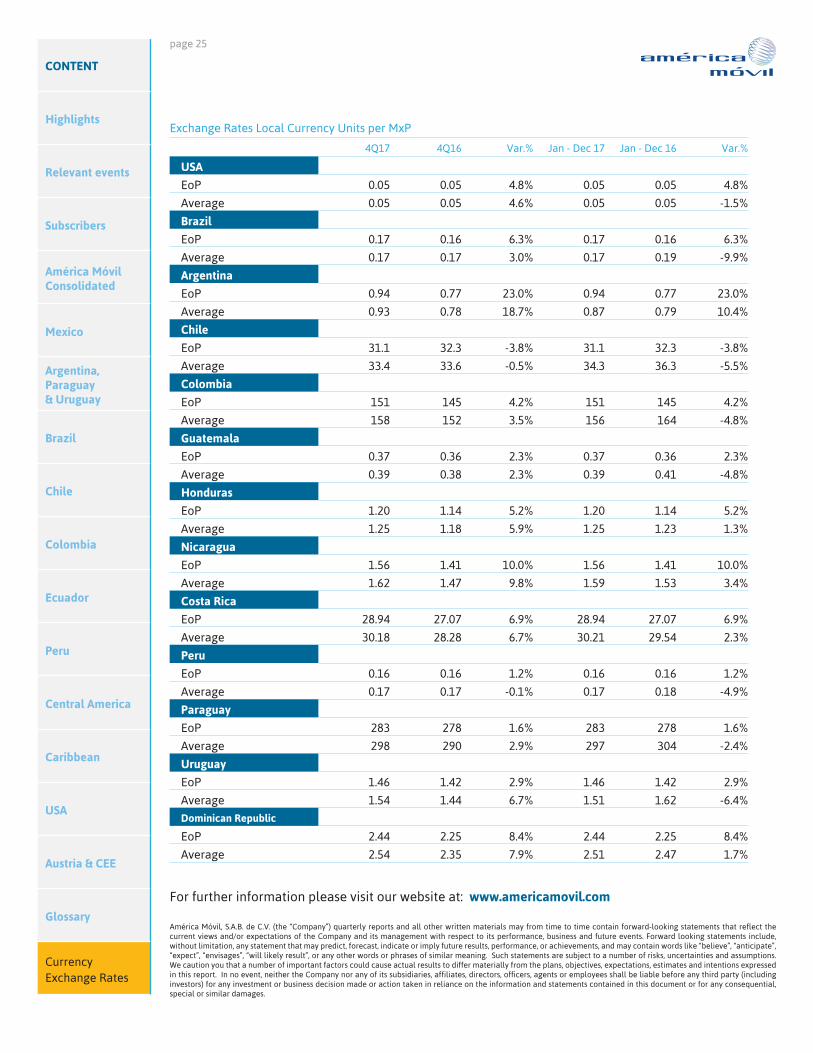
Exchange Rates Local Currency Units per MxP
4Q17 4Q16 Var.% Jan - Dec 17 Jan - Dec 16 Var.%
USA
EoP 0.05 0.05 4.8% 0.05 0.05 4.8%
Average 0.05 0.05 4.6% 0.05 0.05 -1.5%
Brazil
EoP 0.17 0.16 6.3% 0.17 0.16 6.3%
Average 0.17 0.17 3.0% 0.17 0.19 -9.9%
Argentina
EoP 0.94 0.77 23.0% 0.94 0.77 23.0%
Average 0.93 0.78 18.7% 0.87 0.79 10.4%
Chile
EoP 31.1 32.3 -3.8% 31.1 32.3 -3.8%
Average 33.4 33.6 -0.5% 34.3 36.3 -5.5%
Colombia
EoP 151 145 4.2% 151 145 4.2%
Average 158 152 3.5% 156 164 -4.8%
Guatemala
EoP 0.37 0.36 2.3% 0.37 0.36 2.3%
Average 0.39 0.38 2.3% 0.39 0.41 -4.8%
Honduras
EoP 1.20 1.14 5.2% 1.20 1.14 5.2%
Average 1.25 1.18 5.9% 1.25 1.23 1.3%
Nicaragua
EoP 1.56 1.41 10.0% 1.56 1.41 10.0%
Average 1.62 1.47 9.8% 1.59 1.53 3.4%
Costa Rica
EoP 28.94 27.07 6.9% 28.94 27.07 6.9%
Average 30.18 28.28 6.7% 30.21 29.54 2.3%
Peru
EoP 0.16 0.16 1.2% 0.16 0.16 1.2%
Average 0.17 0.17 -0.1% 0.17 0.18 -4.9%
Paraguay
EoP 283 278 1.6% 283 278 1.6%
Average 298 290 2.9% 297 304 -2.4%
Uruguay
EoP 1.46 1.42 2.9% 1.46 1.42 2.9%
Average 1.54 1.44 6.7% 1.51 1.62 -6.4%
Dominican Republic
EoP 2.44 2.25 8.4% 2.44 2.25 8.4%
Average 2.54 2.35 7.9% 2.51 2.47 1.7%