ballot f ormats, t ouchscreens, and underv otes · · 2009-01-06ballot f ormats, t ouchscreens,...
TRANSCRIPT

Ballot Formats, Touchscreens, and Undervotes:
A Study of the 2006 Midterm Elections in Florida1
Laurin Frisina2 Michael C. Herron3 James Honaker4
Jeffrey B. Lewis5
Initial Draft: November 23, 2006
This Draft: December 3, 2006
1The authors thank Greg Huber for comments on an earlier draft of this paper and thank election officialsin Charlotte, Collier, DeSoto, Hardee, Hillsborough, Lee, Manatee, Pinellas, and Sarasota Counties forproviding data and answering election-related questions. The most recent version of this paper can be foundat http://www.dartmouth.edu/˜herron.
2B.A. in Political Science, University of Rochester, June, 2006 ([email protected]).3Associate Professor, Department of Government, Dartmouth College and Visiting Associate Professor
of Political Economy, Wallis Institute of Political Economy, University of Rochester. 6108 Silsby Hall,Hanover, NH 03755 ([email protected]).
4Assistant Professor, Department of Political Science, University of California at Los Angeles. 4289Bunche Hall, Los Angeles, CA 90095-1472 ([email protected]).
5Assistant Professor, Department of Political Science, University of California at Los Angeles. 4289Bunche Hall, Los Angeles, CA 90095-1472 ([email protected]).

Abstract
The 2006 midterm elections in Florida have focused attention on undervotes, ballots on which novote is recorded on a particular contest. This interest was sparked by the high undervote count—more than 18,000 total undervotes out of 240,000 ballots cast—in Florida’s 13th CongressionalDistrict race, a race decided by a total of 369 votes. Using a combination of ballot-level andprecinct-level voting data, we show that the high undervote rate in the 13th Congressional Districtrace was almost certainly caused by the way that Sarasota County’s electronic touchscreen votingmachines placed the 13th Congressional District race above and on the same screen as the FloridaGovernor race. We buttress this claim by showing that extraordinarily high undervote rates werealso observed in the Florida Attorney General race in Charlotte and Lee Counties, places wherethat race appeared below the Governor race on voting machine screens. Using a precinct-levelstatistical imputation model to identify and allocate excess undervotes, we find that there is a 90percent chance that Sarasota undervotes were pivotal in the 13th Congressional District race. Withmore precise estimates that use ballot data, we find that there is essentially a 100 percent chancethat Jennings would have won the CD 13 race had Sarasota voters voted in Charlotte County.

1 Introduction
Despite widespread concerns that electronic voting machines adopted in the wake of the 2000
presidential election would wreak havoc on the recent 2006 midterm elections, reports of election-
altering ballot machine failures have thus far been relatively few. Although the midterm elections
included a number of closely contested United States Senate (e.g., Virginia), United States House
(e.g., the 2nd Congressional District in Connecticut), and state-level (e.g., the Vermont state audi-
tor) races, few observers or participants have claimed that problems in election administration are
to blame for the defeat of a preferred candidate.1 Indeed, compared to the controversies surround-
ing balloting in the 2000 Presidential race in Florida (e.g., Merzer 2001, Posner 2001), the 2004
Presidential race in Ohio (e.g., Freeman & Bleifuss 2006), and the 2004 Washington gubernatorial
race (in which the final margin separating winning from losing candidate was 261 votes out of
over 2.8 million total votes), the aftermath of the 2006 midterm elections has so far been relatively
pacific.
Prior to the 2006 elections, concerns over electronic voting focused primarily on its suscepti-
bility to tampering and a lack of independently verifiable audit trails (e.g., Feldman, Halderman
& Felten 2006). Nonetheless, it was widely agreed that electronic voting machines were superior
to the punchcard systems that in some cases they replaced insofar as electronic machines prevent
overvotes (selecting more than one candidate in a given contest) and produce fewer undervotes (in-
stances in which no candidate is selected) as well (Kimball 2003, Carrier 2005). A widely noted
virtue of touchscreen machines is that they can be configured to draw a voter’s attention to races
he or she initially overlooked or otherwise failed to record a preference (Celeste, Thornburgh &
Lin 2005). In addition, touchscreen machines can be programmed to operate in many different
languages.1Democrat Jim Webb defeated Republican incumbent George Allen by 9,329 votes in the Virginia Senate election;
Democrat Joe Cortney defeated incumbent Republican Rob Simmons by 91 votes in Connecticut’s 2nd CongressionalDistrict; and, Republican incumbent Randy Brock is at the time of this paper’s writing leading Democrat Tom Salmonby 137 votes in the Vermont state auditor election pending a recount.
1

Despite these seeming virtues, the 2006 elections revealed that touchscreen machines do not
uniformly produce low undervote rates. Indeed, in some instances touchscreen voting machines
are associated with very high undervote rates, most notably in Florida’s 13th Congressional District
(hereafter CD 13).
The election night canvass in CD 13 had Democrat Christine Jennings losing to Republican
Vern Buchanan by some 377 votes; under Florida election law, this very narrow margin triggered
an automatic recount.2 According to the recount, Buchanan beat Jennings by 119,142 to 118,741
votes—a margin of only 401 votes.3 The same count revealed that 21,303 ballots in CD 13, ap-
proximately 8.2 percent of those cast, recorded no candidate choice in the House race.4 These
undervotes were heavily concentrated in Sarasota County, the largest of the five counties that con-
tribute to CD 13. The other four counties are Charlotte, DeSoto, Hardee, and Manatee.5 Ignoring
absentee ballots, which are optical scan, and focusing only on touchscreen ballots, the CD 13
undervote rate was 14.8 percent.
What accounts for Sarasota County’s extraordinarily high undervote rate in the CD 13 contest
is the focus of this paper. Beyond what the prevalence of CD 13 undervotes might reveal about
touchscreen voting in general, they also form the basis of Jennings’s legal challenge to Buchanan’s
election victory. According to her legal complaint, “The vote totals in the certification are wrong
because they do not include thousands of legal votes that were cast in Sarasota County but not2See “Analysis suggests undervote caused by ballot design,” Herald Tribune, November 15, 2006,
downloaded from http://heraldtribune.com/apps/pbcs.dll/article?AID=/20061115/NEWS/611150751/-1/NEWS0521.
3The Florida Secretary of State calls this “2nd Set of Unofficial Returns,” See http://election.dos.state.fl.us/elections/resultsarchive/enight.asp. The recount vote totals cited here do not in-clude overseas and military ballots. As of this paper’s writing, the certified margin between Buchanan and Jenningshas shrunk to 369 votes, and Jennings has formally contested the election outcome.
4This count includes a handful of so-called overvotes in which a voter voted for more than one CD 13 candidate.Overvotes, which are invalid of course, can be cast by voters who use optical scan ballots but not by those using touch-screen machines. The latter are often called DRE (for Direct Recording Electronic) machines. Initial CD 13 recountresults were downloaded from http://election.dos.state.fl.us/pdf/certCanvasCom.pdf.
5Pre-recount and in some cases certified canvasses can be downloaded from http://www.charlottevotes.com/ (Charlotte County), http://www.hardeecountyelections.com/ (Hardee County), http://www.votemanatee.com/ (Manatee County), and http://www.srqelections.com/ (Sarasota County). Thepre-recount canvass from DeSoto County was faxed to the authors and is available from them.
2

counted due to the pervasive malfunctioning of electronic voting machines.”6 CD 13 undervotes
have also motivated a lawsuit by Sarasota voters who claim that they were disenfranchised by the
failure of Sarasota County’s touchscreen machines. The plaintiffs in this lawsuit are requesting a
re-vote.7
Whether it is correct to attribute Sarasota’s high undervote rate to “machine malfunction” is in
part a question of engineering and in part a question of semantics, i.e., what exactly constitutes a
“malfunction?” While we cannot directly address engineering issues here and do not presume to
provide a legal definition of “malfunction,” what we do provide is careful documentation of the
extent of the undervote problem and its likely effect on the election outcome in CD 13. Although
we cannot definitively rule out the possibility that there was some voting machine malfunction in
the sense that Sarasota County’s touchscreen machines failed to record and tabulate actual screen
touches for Buchanan and Jennings, we nonetheless show that such a malfunction must have been
very localized and specialized if it had occurred. The touchscreen voting machines used in Sarasota
did not produce unusually high undervote rates in other races. And, unusually high undervote rates
did not occur in other races in which candidate buttons were located in a similar position on the
screen to the candidate buttons for CD 13.
While within Sarasota County the undervote problem appears to be isolated to the CD 13 race, it
does not appear that the high undervote rate in this race is attributable to features of the candidates
themselves, the office they were contesting, or to features of the Buchanan-Jennings campaign.
Indeed, elevated undervoting was not observed in CD 13 outside of Sarasota County nor was it a
feature of absentee balloting within Sarasota. As we demonstrate below, the most likely culprit for
the high CD 13 undervote rate is ballot layout. As has been noted in a variety of press accounts,6The Jennings complaint was downloaded from http://www.heraldtribune.com/assets/pdf/
SH81371120.PDF on November 21, 2006.7This lawsuit is supported by various election advocacy groups. See the press release, titled “Sarasota Voters File
Lawsuit for Revote in Congressional Race,” issued by People for the American Way. The release, which points outthat the voter plaintiffs are both Democrats and Republicans, can be found at http://www.pfaw.org/pfaw/general/default.aspx?oid=23142.
3

among counties participating in the CD 13 race only in Sarasota was the CD 13 race itself placed
on the same ballot screen with the Governor’s race which included six alternative candidates plus
a write-in line. In other counties and on Sarasota’s absentee ballot, the CD 13 race appeared on its
own ballot screen, next to (in a horizontal sense) the Florida United States Senate race, or along
with a large number of other races in the case of optical scan ballots.
To buttress our conclusion that Sarasota County’s CD 13 undervote problem resulted from
the ballot layout used in this county, we show very similar effects in Charlotte and Lee Counties
where the race for Florida attorney general was combined with the Florida governor’s race on a
single ballot screen. We find that Charlotte County’s ballot format is associated with an excess
of undervotes that was roughly twice as prominent as found in Sarasota’s CD 13 ballots (and Lee
County’s ballot format in the attorney general race is similar although not quite as pronounced).
The focus in the public on the CD 13 race over the Attorney General contest presumably reflects
the fact that the former race was exceedingly close whereas the Florida attorney general was close
but not recount-close, so to speak.8
It remains possible, of course, that a programming or design flaw in Charlotte County’s, Lee
County’s, and Sarasota County’s touchscreen machines caused improper vote counts when a race
(either the CD 13 rate or the race for Florida attorney general) was placed on the same page as
the Florida governor’s race. Indeed, this possibility led the Florida Division of Elections, part of
the Florida Department of State, to devise a testing procedure with the intention of determining if
voting machine software or hardware problems were the sole cause or a contributing factor to the
CD 13 undervote in Sarasota County.9 The initial phase of the voting machine audit, a simulated
election in Sarasota County, has not uncovered any significant software or hardware issues.10
8According to official results from the Florida Department of State, the winning Florida Attorney General candi-date, Bill McCollum, received 52.7% of the popular vote. This winning percentage is presumably not sufficiently largeso as to think that voters could anticipated the results of the attorney general race prior to election day.
9For details of the Division of Election’s testing procedure see the “Parallel Test” design at http://election.dos.state.fl.us/pdf/parallelTestPlan.pdf.
10See, for example, “State says all discrepancies in test election due to ’human error’,” Herald Tribune, November30, 2006.
4

The question of disparate impact of an election administration practice—in the case at hand, a
ballot format—is central to any analysis of electoral institutions and is obviously of paramount in-
terest in CD 13 where the recorded electoral margin between Buchanan and Jennings is razor thin.
Whatever doubt remains about the fundamental cause of the large number of CD 13 undervotes
in Sarasota County, we can say with very high confidence that the undervote patterns observed in
the CD 13 race would not have obtained had Sarasota voters been presented with the same voting
machinery and ballot layouts used elsewhere in CD 13. Overall, as we explain in detail later, our
precinct-level statistical models suggest that there is a 90 percent chance that Jennings would have
won the CD 13 election had voting in Sarasota employed the machinery and ballots layouts used
elsewhere in the district. We obtain even stronger results by analyzing the individual ballots cast in
Sarasota and Charlotte counties. The ballot level analysis leaves little doubt that the election out-
come would been reversed in the absence of the excess Sarasota undervotes. Indeed, we find that
Jennings would have received a net advantage of between 3,068 and 3,359 votes if Sarasota voters
had voted in Charlotte precincts–far more than the roughly 400 required to reverse the election.
In Section 2 we provide some background on the CD 13 race and comment on three explana-
tions purporting to explain the high undervote rate in this contest. In Section 3 we present evidence
that the undervote patterns in CD 13 are consistent with election administration problems and not
with other claims about their causes, and we show by analysis of other races beyond CD 13 that the
mechanism behind the Sarasota undervote rate appears to be a ballot format problem. In Section 4
we show that the CD 13 outcome at the time of this paper’s writing—Buchanan over Jennings by
approximately 369 votes—could well have been reversed in the absence of said problems. Section
5 concludes.
5

2 Background
Florida has 25 Congressional Districts and 67 counties. Midway up the Florida’s Gulf Coast sits
Sarasota County. Sarasota and its 156 election day precincts lie completely within the 13th Con-
gressional District which includes parts of Charlotte County (eight election day precincts) and
Manatee County (134 election day precincts, some of which are split between CD 13 and CD
11, the 11th Congressional District in Florida) and all of DeSoto and Hardee Counties (15 and
12 election day precincts, respectively).11 The five CD 13 counties vary in their use of voting
technologies: Charlotte and Sarasota both use iVotronic touchscreens, manufactured by Election
Systems and Software (known popularly as ES&S), for their election day and early voters whereas
DeSoto, Hardee, and Manatee use optical scan voting. All five counties use optical scan ballots for
absentee voting.
The fact that some CD 13 ballots do not contain a vote for a given office does not imply a
failure of the machinery used to record votes nor does it imply the existence of any sort of election
administration deficiency. Intentional undervotes (also commonly known as roll-offs and drop-
offs) are a feature of every election. Indeed, the state of Nevada offers voters the explicit option of
“None of the Above Candidates” when voting in state-wide races, and this option was exercised
by an average of 4 percent of voters across the seven state-wide contests held in the 2006 midterm
election (Nevada turnout was 585,986 voters).12 Beyond discontent with available candidates,
deliberately choosing not to vote in a particular contest may reflect indifference among possible
candidates or uncertainty about how or why to vote.11What is typically called a “precinct” in the vernacular of United States elections is what we call an election day
precinct, i.e., a place where voters physically go to vote. In contrast, one can also speak of “absentee precincts,” whichare collections of absentee voters albeit not physical voting locations. Some counties (e.g., Hardee in 2004) have asingle absentee precinct which includes all of the county’s absentee votes; others have multiple absentee precincts(e.g., Sarasota in 2004), and others (e.g., Sarasota in 2006) associate every absentee voter with a single election dayprecinct at which she would have voted had she voted on election day.
12Data on vote choices are from the Nevada Secretary of State’s Official Vote Summary (http://sos.state.nv.us/nvelection/2006StateWideGeneral/ElectionSummary.htm). The turnoutfigure is from http://www.secretaryofstate.biz/nvelection/2006StateWideGeneral/VoterTurnout.htm.
6

Nonetheless, the 8.2 percent undervote rate in Florida’s CD 13, in conjunction with the 13 per-
cent percent such rate in Sarasota County, is clearly extraordinary. In modern presidential races,
the intentional undervote rates is generally thought to be around 2 percent. In the 2004 presidential
election, the overall Florida undervote rate was approximately 0.36 percent, this rate was 0.38 per-
cent in Sarasota County, and it was 0.43 percent in counties that used touchscreens manufactured
by ES&S (Florida Department of State 2005). In absolute terms presidential undervote rates are
not comparable to Congressional district undervote rates produced in a midterm election. Nonethe-
less, the numbers cited above suggest that there is no reason to think a priori that Sarasota County
is prone to high undervote rates.
In the sense of documenting what appears to be a disparate impact of an election administration
practice, this paper is similar to previous studies of undervoting and residual votes (undervotes
plus overvotes) more generally, many of which have focused on punchcard voting technology.
Literature on residual vote rates has demonstrated that high residual vote rates are associated with
particular kinds of voters and are often concentrated in low education, minority, and (consequently)
more Democratic precincts (Brady, Buchler, Jarvis & McNulty 2001, Tomz & van Houweling
2003, Mebane 2004, Ansolabehere & Stewart III 2005).
With respect to the matter of ballot format itself, paper-based optical scan ballot format issues,
like the way that optical scan ballots are filled out (either with circles or arrows to be connected),
shading, and the presence of instructions, influence undervote and overvote rates (Kimball & Kropf
2005). And, Wand, Shotts, Sekhon, Mebane, Jr., Herron & Brady (2001) show that the butterfly
ballot in Palm Beach County, Florida, altered the winner of the 2000 presidential election. Another
election administration practice known to have effects on vote totals, and hence on very close
election outcomes, is the order in which names appear on ballots (Koppell & Steen 2004, Ho &
Imai 2006). Finally, Herrnson, Bederson, Niemi, Conrad, Hanmer & Traugott (2006) show in a
sequence of experiments that different touchscreen formats affect the error rates that voters make
when selecting candidates.
7

2.1 Three Explanations for the Sarasota Undervote Rate
A number of competing explanations have been offered for the seemingly aberrant undervote rate
in CD 13 and in particular for Sarasota County’s undervote rate in the CD 13 race. As of this
paper’s writing, outright election fraud or deliberate manipulation of voting machines with an
intent to cause undervotes is not among the common conjectures. Rather, attention has focused on
“protest undervotes,” machine malfunction, and voter confusion arising from ballot formatting.
2.1.1 Protest Undervotes
One explanation is that of the “protest undervote” wherein voters abstain from casting a vote in a
particular race to express distaste for any and all candidates running in it. Vern Buchanan, the Re-
publican candidate in CD 13, has speculated that, as characterized by the Herald Tribune, “Voters’
disgust with the barrage of often negative campaign ads and mailers could have contributed to the
undervote.”13 Indeed, there is some evidence from U.S. Senate races that the degree of negativity
in a campaign is associated with relatively high undervote rates (Ansolabehere & Iyengar 1995).
2.1.2 Ballot Formatting
Nonetheless, hundreds of citizens who voted in Sarasota have complained about the ballot format
they faced, and that “The touch-screen [sic] ballot design concealed the candidates for the 13th
District.”14 In what sense might this race have been “concealed”? The most commonly cited
mechanism that may have led to voter confusion in the Sarasota part of CD 13 revolves around the
vertical stacking of multiple races on the same touchscreen page.
Recall that Charlotte and Sarasota Counties both use iVotronic touchscreens for their election
day and early voters. When a voter confronts an iVotronic, her “ballot” consists of a sequence of
pages of races and corresponding candidate choices. In both Charlotte and Sarasota Counties, the13See “Call for paper trail, new election,” Herald Tribune, November 16, 2006.14See “13th Congressional District recount: About the recount,” Herald Tribune, November 16, 2006.
8

first ballot page contained only one race, the Florida United States Senate race. Beyond their first
pages, though, Charlotte and Sarasota used different ballot layouts.
In Charlotte, the second ballot page contained the CD 13 race only, and the Florida gubernato-
rial race appeared on the third page along with the Florida attorney general race under it. Figure
1 displays the first four pages of the Charlotte County 2006 ballot.15 As detailed, note that the
second page of the ballot—Figure 1(b)—contains a single race and that the third page—Figure
1(c)—combines governor and attorney general races.
In contrast, the second page of the Sarasota ballot contained both the CD 13 race and the
Florida governor race. The third page of the Sarasota ballot included the attorney general, the
chief financial officer, and the commissioner of agriculture races. Figure 2 displays the first two
pages of the Sarasota County ballot. Note the Florida United States Senate race—Figure 2(a)—is
on its own page but that the CD 13 race is combined with the governor race—Figure 2(b).16
In DeSoto, Hardee, and Manatee Counties, election day and early voters voted with two-sided,
optical scan ballots. There is no sense in which optical scan voting involves repeated page-turning,
so to speak, as is common with touchscreens. The Manatee ballot is pictured in Figure 3.17 Absen-
tee voters in all five CD 13 counties used optical scan ballots roughly similar to Manatee’s election
day ballot.
It has been conjectured that the placement of the CD 13 contest (two candidates) next to the
gubernatorial contest (six candidates plus a write-in) led voters to miss the former.18 Why precisely
this might be true is beyond the scope of this paper. Presumably the questions, “How many races
on a page is too many?” and “How many candidate choices on a page is too many?” are amenable
to experimental research on human-computer interactions just as the butterfly ballot format was15The source for the Charlotte ballot pictures is email received on November 15, 2006 from the office of the Char-
lotte County Supervisor of Elections.16Source for the Sarasota County ballot picture is personal communication between the authors and Dan Wallach
on November 27, 2006.17Source for the Manatee County ballot is http://www.votemanatee.com/PollLocationPub.asp?
PollingId=856.18See “Analysis suggests undervote caused by ballot design,” Herald Tribune, November 15, 2006.
9

(a) Page 1 (b) Page 2
(c) Page 3 (d) Page 4
Figure 1: Pages One through Four of Charlotte County’s 2006 Midterm Election Ballot
studied experimentally by Sinclair, Mark, Moore, Lavis & Soldat (2000).
10

(a) Page 1 (b) Page 2
Figure 2: Pages One and Two of Sarasota County’s 2006 Midterm Election Ballot
2.1.3 Voting Machine Malfunctions
A third explanation for the high Sarasota undervote rate in CD 13 is machine or engineering fail-
ure.19 There are numerous possibilities in this area: software counting bugs that affected Sarasota’s
iVotronics in a way that caused undervotes; touchscreen misalignment problems that caused vot-
ers to “miss” candidates they intended to support; problems in touchscreen memory devices that
caused corruption of voting data, and so forth. The list of possible machine failures and their
associated consequences is long and beyond the scope of this paper. See Wallach (2006) for a
discussion.
Broadly speaking, then. we characterize the aforementioned three explanations for the CD 13
undervote as 1) deliberate voter abstention; 2) ballot formatting; 3) engineering problems. This
paper is purely a statistical exercise and as such cannot directly address the possibility that engi-
neering lies underneath the undervote rates we study. However, to the extent that voter intentions or
ballot formats appear to explain observed undervote rates, the conjecture that engineering flaws are19See “Buchanan declared winner; rival Jennings sues,” Herald Tribune, November 21, 2006.
11
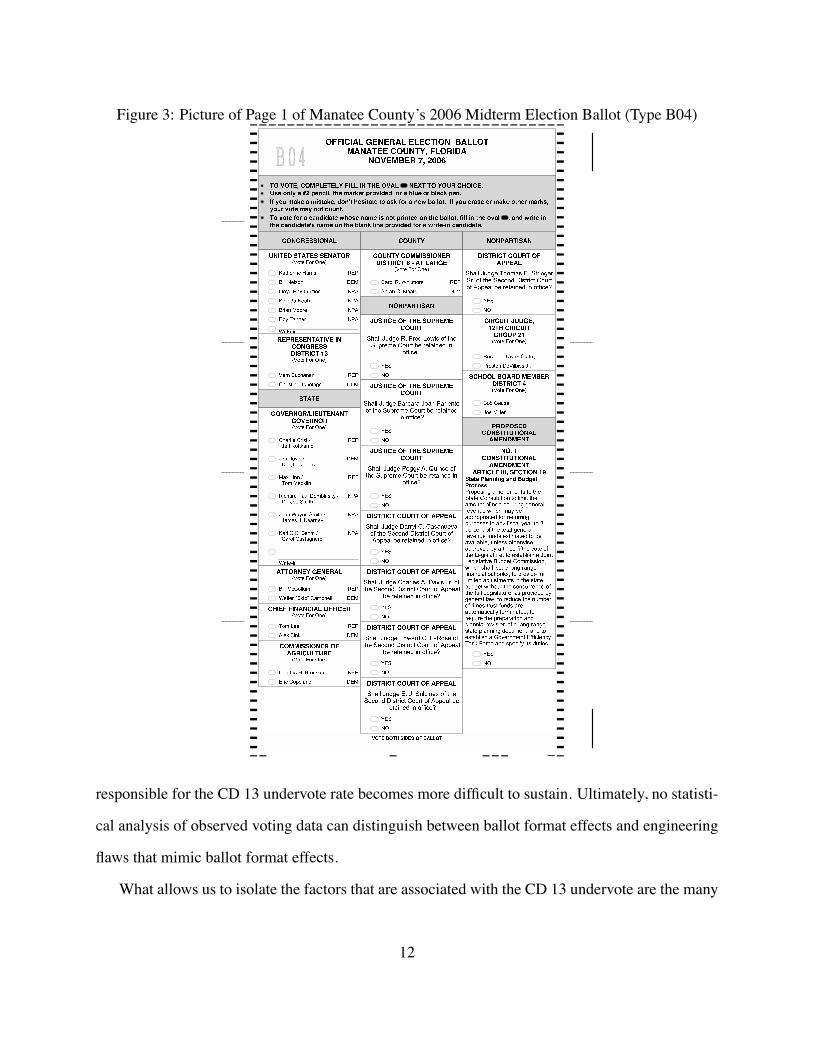
Figure 3: Picture of Page 1 of Manatee County’s 2006 Midterm Election Ballot (Type B04)
responsible for the CD 13 undervote rate becomes more difficult to sustain. Ultimately, no statisti-
cal analysis of observed voting data can distinguish between ballot format effects and engineering
flaws that mimic ballot format effects.
What allows us to isolate the factors that are associated with the CD 13 undervote are the many
12

sources of within- and across-county variance in voting technologies and ballot formats used in
and around CD 13. Recall, as we noted above, that Charlotte and Sarasota both used iVotronic
touchscreens in the 2006 midterm elections. Thus, if there were a generic iVotronic effect in the
CD 13 race, it would have affected both Charlotte and Sarasota undervote rates. And, if campaign
negativity unduly affected the CD 13 race, it should have affected all voters who participated in it,
not just those in one particular county. Finally, within CD 13 there is variance in ballot formats
across counties and across time of voting (election day/early and absentee). Below we exploit all
of these sources of variance and others as well.
3 Evidence of Anomalous Undervotes
In this section we first present a set of plots that highlight the anomalous CD 13 undervote in Sara-
sota County. Second, we present estimates of several statistical models applied to undervote rates
in CD 11, CD 13, and CD 14. Finally, we consider a set of four non-Congressional races (Florida
governor, Florida attorney general, Florida chief financial officer, and Florida commissioner of
agriculture) and show how results from these races shed light on the Sarasota undervote in CD 13.
3.1 Evidence of Unusually High Undervote Rates in CD 13
A sense of the magnitude of the Sarasota undervote rate in CD 13 is apparent in Figure 4.20 This
figure, which describes undervote rates for the five counties that contribute to CD 13, has two
notable features. First, it shows that among CD 13 counties Sarasota had the largest election day
minus absentee difference in undervote rates. Second, the figures shows that Sarasota County
contributed the most votes of the five counties in the CD 13 race. Thus, Sarasota’s prominence in20Figure 4 uses certified precinct returns except where they remain unavailable to the authors. As of this paper’s
writing the pre-recount, publicly-available canvass for DeSoto County does not break down CD 13 undervote countsby time of voting, i,e., election day, early, and absentee; moreover, we do not have access to a certified canvass fromDeSoto County. Finally, the Figure 4 does not include Manatee County precincts that were split between CD 11 andCD 13.
13

Figure 4 cannot be attributed to sampling variance. Note that Hardee County had approximately
50 times fewer ballots than Sarasota.
Regarding the election day versus absentee gap in CD 13 undervote rates, on election day the
CD 13 undervote rate was approximately 0.139 (σ̂ = 0.00116), but Sarasota absentee voters had
an undervote rate of approximately 0.0250 (σ̂ = 0.00104). This translates to a difference of 0.114
(σ̂ = 0.00239). Thus, election day voters in Sarasota County were over five times as likely to cast
an undervote in the CD 13 race than their absentee counterparts.
Absentee voters are a self-selected group, and perhaps Sarasota absentee voters are simply
more attentive than Sarasota election day voters to undervotes. This seems implausible in light of
Figure 5, which plots undervote rates in the Florida United States Senate race.21 As is evident in
this figure, there is not much of a gap between the election day (1.3 percent) and absentee (0.9
percent) Senate undervote rates in Sarasota.
Although not pictured, a plot of election day, early, and absentee undervote rates in CD 13
in 2004 shows no dramatic differences between undervote rates in various counties and time of
voting. This is an important point because, in theory, one could argue that Sarasota election day
voters are perhaps unique in their willingness to incur high undervote rates solely in Congressional
races. This argument is not very plausible in light of 2004 undervote rates.22
The election day versus absentee difference among CD 13 precincts between is a key one, and
one can see the importance of this in Figure 6. This figure plots for all CD 13 precincts except those
in DeSoto County an election day undervote rate versus an absentee undervote rate. Note that the
preponderance of Sarasota precincts (red dots plus confidence ellipses) lie above the pictured 45
degree line. This pattern implies that Sarasota precincts had election day CD 13 undervote rates
greater than corresponding absentee CD 13 undervote rates. Judging by the distribution of non-
Sarasota precincts (blue dots) and the way that this distribution is split by the 45 degree line, it is21The United States Senate race was the first on the ballot among all Florida counties. According to certified vote
totals, Bill Nelson (Democrat, 60.3 percent) easily beat Katherine Harris (Republican, 38.1 percent) in the race.22In 2004, Katherine Harris (Republican, 55.3 percent) defeated Jan Schneider (Democrat, 44.7 percent).
14

Figure 4: 2006 Undervote Rates among Counties Congressional District 13.
Charlotte(8955)
Desoto(6670)
Hardee(9102)
Manatee(93313)
Sarasota(141835)
Unde
rvot
e Ra
te
00.
050.
10.
150.
2
Election Day VotersEarly VotersAbsentee VotersAll Voters
Note: total number of ballots cast listed in parentheses.
clear that Sarasota is distinct from the rest of CD 13.
Finally, and to reinforce the point that undervoting in the CD 13 race in Sarasota County was
anomalous compared to neighboring counties, consider Figure 7, which describes the location of
15

Figure 5: 2006 United States Senate Undervote Rates among CD 13 Voters
Charlotte DeSoto Hardee Manatee Sarasota
Unde
rvot
e Ra
te
00.
050.
10.
150.
2
Election Day VotersEarly VotersAbsentee VotersAll Voters
undervotes among election day Sarasota voters who cast one and only one undervote among races
that all Sarasota voters could participate in (there were 10,428 such voters).23
The implication of this figure is relatively straightforward: among election day Sarasota voters
who cast one undervote, the modal category for this single undervote is the CD 13 race. Paradoxi-
cally, as indicated by shading in Figure 7, the CD 13 race was the closest race among the races in
which all Sarasota voters could participate. Furthermore, it was very close to the top of the ballot,
and the next closest race in terms of undervotes was the one-sided Sarasota Charter Review Board
District 2 race.
A comparable figure for Charlotte County is in Figure 8 (note the change in vertical axis scales
between Figures 7 and 8). The lack of an election day CD 13 spike is evident in Charlotte, but23Data from this figure was provided by the Sarasota Supervisor of Elections and in particular was generated from
the EL155.LST audit file produced by Sarasota’s touchscreen voting machines. The EL155.LST audit file lists voteprofiles by both machine and precinct, and touchscreen machines which appeared in multiple precincts are consideredto have been early voting machines.
16
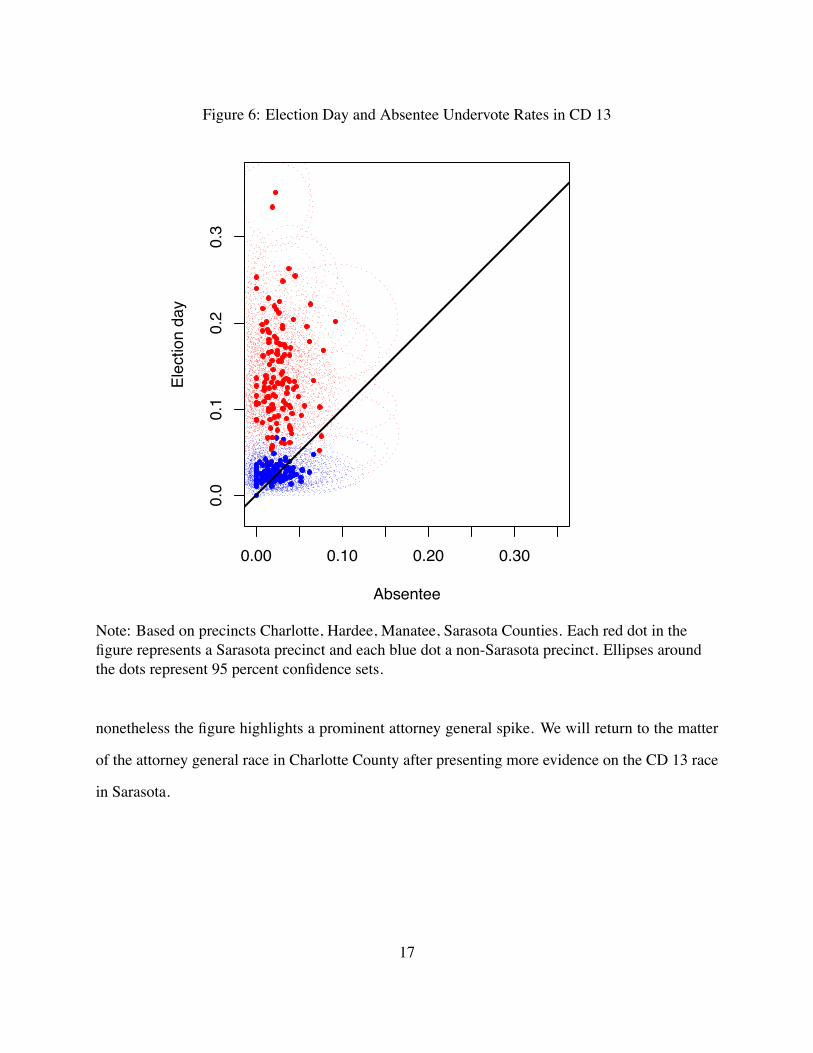
Figure 6: Election Day and Absentee Undervote Rates in CD 13
0.00 0.10 0.20 0.30
0.0
0.1
0.2
0.3
Absentee
Elec
tion
day
Note: Based on precincts Charlotte, Hardee, Manatee, Sarasota Counties. Each red dot in thefigure represents a Sarasota precinct and each blue dot a non-Sarasota precinct. Ellipses aroundthe dots represent 95 percent confidence sets.
nonetheless the figure highlights a prominent attorney general spike. We will return to the matter
of the attorney general race in Charlotte County after presenting more evidence on the CD 13 race
in Sarasota.
17
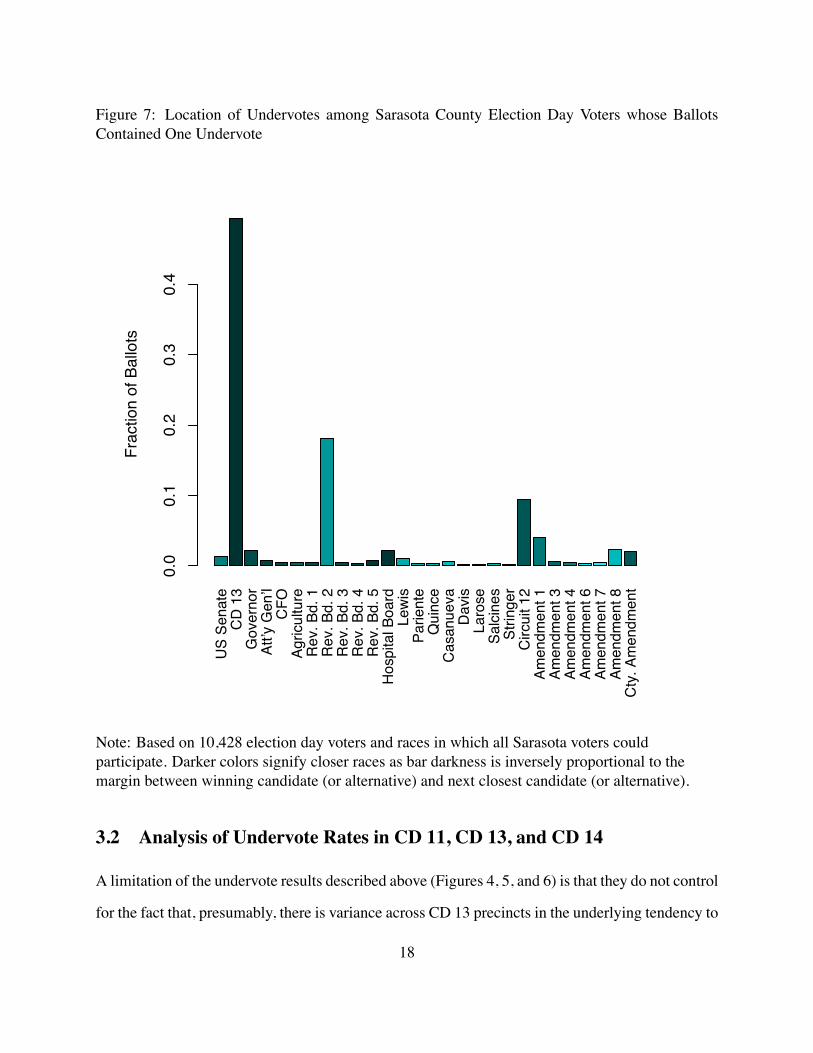
Figure 7: Location of Undervotes among Sarasota County Election Day Voters whose BallotsContained One Undervote
US S
enat
eCD
13
Gov
erno
rAt
t’y G
en’l
CFO
Agric
ultu
reRe
v. B
d. 1
Rev.
Bd.
2Re
v. B
d. 3
Rev.
Bd.
4Re
v. B
d. 5
Hosp
ital B
oard
Lewi
sPa
rient
eQ
uinc
eCa
sanu
eva
Davis
Laro
seSa
lcine
sSt
ringe
rCi
rcui
t 12
Amen
dmen
t 1Am
endm
ent 3
Amen
dmen
t 4Am
endm
ent 6
Amen
dmen
t 7Am
endm
ent 8
Cty.
Am
endm
ent
Frac
tion
of B
allo
ts
0.0
0.1
0.2
0.3
0.4
Note: Based on 10,428 election day voters and races in which all Sarasota voters couldparticipate. Darker colors signify closer races as bar darkness is inversely proportional to themargin between winning candidate (or alternative) and next closest candidate (or alternative).
3.2 Analysis of Undervote Rates in CD 11, CD 13, and CD 14
A limitation of the undervote results described above (Figures 4, 5, and 6) is that they do not control
for the fact that, presumably, there is variance across CD 13 precincts in the underlying tendency to
18

Figure 8: Location of Undervotes among Charlotte County Election Day Voters whose BallotsContained One Undervote
US S
enat
eCD
13
Gov
erno
rAt
t’y G
en’l
CFO
Agric
ultu
reCo
unty
Com
m.
Airp
ort
Lewi
sPa
rient
eQ
uinc
eCa
sanu
eva
Davis
Laro
seSa
lcine
sSt
ringe
r20
th C
ircui
t I20
th C
ircui
t II
Amen
dmen
t 1Am
endm
ent 3
Amen
dmen
t 4Am
endm
ent 6
Amen
dmen
t 7Am
endm
ent 8
Frac
tion
of B
allo
ts
0.0
0.1
0.2
0.3
0.4
0.5
0.6
Note: Based on 727 election day voters and races in which all Charlotte voters in CD 13 couldparticipate. Darker colors signify closer races as bar darkness is inversely proportional to themargin between winning candidate (or alternative) and next closest candidate (or alternative).
undervote. With this possibility in mind, we now consider regression analyses that seek to explain
precinct-level undervote rates while controlling for precinct partisanship and undervote proclivity.
We analyze three separate United States House races, those in CD 11, CD 13, and CD 14, and
19
this reflects the fact that it would be inappropriate for us to study CD 13 in isolation from other
Congressional Districts in Florida. If what happened in the CD 13 contest is unique, i.e., if the
undervote rate in this race had idiosyncratic features, then we should expect to see a lack of such
features in Congressional District races that are physically close to CD 13.
As a caveat, however, we note that the CD 11 and CD 14 races were not at all close elections.
In CD 11, the winning candidate received approximately 69.7% of the popular vote, and in CD
14 the corresponding winning percentage is approximately 64.4%. Non-competitive United States
House races are hardly atypical in Florida and outside of it. The only Congressional race recount
in Florida in the 2006 midterm elections took place in CD 13.
In the analyses that follow we divide each precinct in CD 11, CD 13, and CD 14 into election
day, absentee, and early voting components. We then regress at the precinct level the appropriate
Congressional race undervote rate (i.e., the total number of undervotes divided by number of ballots
cast) on the United States Senate undervote rate, the fraction of U.S. Senate ballots cast for the
Democratic candidate Bill Nelson, and indicator variables that control for county effects and time
of voting (election day, early, and absentee) effects.24
Before turning to regression results, though, consider Table 1, which describes election day
and early voting technologies used in the CD 11, CD 13, and CD 14 counties. Note that all such
counties used optical scan balloting for their absentee voters. Sarasota County, as made clear in the
table, is notable insofar as it used iVotronic touchscreens and did not have its Congressional district
race on a separate page. The same thing applies to Lee County, about which we have much more
to say later. As an aside, the order of top races in all Florida counties was United State Senate,
United States Congress, Florida governor, Florida attorney general race, Florida chief financial
officer, and Florida commissioner of agriculture.
Coefficient estimates from our CD 11, CD 13, and CD 14 regressions are in Table 2.25 We see24The intercepts in our regressions are suppressed, and all regressions are weighted by number of ballots cast per
precinct.25Undervote rates from the three Congressional district races can be modeled hierarchically (since precincts are
20

Table 1: Election Day Voting Technologies Across Congressional Districts 11, 13, and 14
District County Technology Type Location of Congressional District (CD) Race11 Hillsborough Touchscreen AVC Edge Two column ballot, CD race right of Senate
Manatee Optical Scan Accuvote Paper ballot, multiple pagesPinellas Touchscreen AVC Edge Two column ballot, CD race right of Senate
13 Charlotte Touchscreen iVotronic CD race on its own pageHardee Optical Scan Accuvote Paper ballot, multiple pagesManatee Optical Scan Accuvote Paper ballot, multiple pagesSarasota Touchscreen iVotronic CD race on same page as governor race
14 Charlotte Touchscreen iVotronic CD race on its own pageCollier Touchscreen iVotronic CD race race on its own pageLee Touchscreen iVotronic CD, governor, and atty. gen. races on same page
from this table that precincts with high Senate undervote rates tend to have high Congressional un-
dervote rates and that the precinct-level relationships between these two variables are statistically
significant at conventional confidence levels (the three p-values for Senate Undervote Rate are all
less than 1 ! 10!6). This is consistent with Herron & Sekhon (2003), who show using ballot data
that voters who undervote on one top race tend to undervote on others. Of course, it does not fol-
low from Table 2 that the same Florida voters who undervoted on the Senate race also undervoted
on the Congressional race. Nonetheless, we also see from the table that Democratically-leaning
precincts tend to produce disproportionately many undervotes, and this too is consistent with ex-
isting literature.
Table 2’s many indicator variables for county and time of voting effects are summarized in
Figure 9. This figure has one bar for each county and Congressional district, and the value of
a bar is the difference between an election day effect of undervoting minus the corresponding
absentee effect. For instance, the first bar in Figure 9 is valued at approximately 0.01 because, in
the CD 11 section in Table 2, the Hillsborough election day effect on undervoting is -0.00088, the
absentee effect is -0.01092, and the difference between these two effects is approximately 0.01.26
nested within counties), and future versions of the paper will take advantage of this structure and also add additionalCongressional districts to the three considered here.
26Standard errors for bar values depend on estimated covariances that are not depicted in Table 2. These covariances
21

Table 2: Results for Congressional District Regressions
District County Type Estimate Standard Error Summary Measures11 Hillsborough Election day -0.00088 0.00482 n = 659
Absentee -0.01092 0.00456 R2 = 0.89Early -0.00528 0.00517
Manatee Election day -0.00513 0.01074Absentee -0.00165 0.02168Early 0.02339 0.03194
Pinellas Election day 0.00945 0.00625Absentee 0.00039 0.00790Early 0.00894 0.00893
Senate Undervote Rate 1.01316 0.05720Senate Democratic Fraction 0.03806 0.00719
13 Charlotte Election day -0.0421 0.0131 n = 891Absentee -0.0388 0.0169 R2 = 0.90Early -0.0432 0.0144
Hardee Election day 0.0016 0.0088Absentee -0.0057 0.0185Early -0.0025 0.0126
Manatee Election day -0.0372 0.0096Absentee -0.0339 0.0093Early -0.0377 0.0119
Sarasota Election day 0.0737 0.0098Absentee -0.0334 0.0096Early 0.1111 0.0107
Senate Undervote Rate 1.1951 0.1849Senate Democratic Fraction 0.0904 0.0165
14 Charlotte Election day 0.00107 0.00309 n = 767Absentee -0.00220 0.00423 R2 = 0.87Early 0.00064 0.00372
Collier Election day 0.00061 0.00218Absentee 0.00105 0.00225Early -0.00133 0.00228
Lee Election day -0.00455 0.00233Absentee 0.01469 0.00232Early -0.00501 0.00251
Senate Undervote 0.50015 0.03548Senate Democratic Fraction 0.02388 0.00419
22
Since Figure 9 shows differences in effects, it implicitly controls for county effects. That is, if all
Hillsborough voters had, say, relatively low undervote rates on account of some factor unique to
election administration in Hillsborough County, then the effect of this factor would be present in
all three Hillsborough estimates in Table 2 and hence not present in the differences in Figure 9.
Positive values in the Figure 9 denote contexts where, controlling for precinct characteristics,
there was more election day undervoting than absentee undervoting. Clearly, the most dramatic
value in Figure 9 is that for Sarasota County in CD 13: the election day minus absentee difference is
on the order of 0.10, meaning that the election day undervote rate among Sarasota County precincts
was about ten percent higher than the absentee undervote rate, all things equal.27 Notably, of the
four CD 13 counties studied here, only Sarasota had a significant difference between election day
and absentee voters. Furthermore, the Sarasota election day minus absentee difference is easily
statistically significantly different than the other three CD 13 differences (calculations available on
request).
Figure 9’s other statistically significant election day versus absentee differences are in the Hills-
borough part of CD 11 and the Lee County part of CD 14. For the latter, we suspect that the ex-
planation lies in the partisanship of Lee County election day voters compared to absentee voters.
Namely, the former appear to be much more Democratic than the latter: approximately 53% of
them voted for the Democratic Florida United States Senate candidate versus approximately 43%
of absentee voters. If strong Democratic partisans simply dropped out of the CD 14 race on ac-
count of its being a certain Republican victory, then one might expect to see a negative Lee County
election day effect as in Figure 9. The same thing may explain the Hillsborough effect as well in
that strong Democratic partisans were more likely to participate in a lopsided Democratic victory.
Regardless, in terms of substantive significance Figure 9’s Sarasota effect is over five times as large
are available on request from the authors.27This 10 percent result is robust to inclusion of two additional variables in the CD 13 regression model: the fraction
of precinct voters who supported the first constitutional amendment vote on the 2006 Florida ballot (the amendmentpassed 59.8% to 40.2% and dealt with budgeting matters) and the fraction of undervotes cast in the first amendmentrace.
23
Figure 9: Effect Across Three Congressional Districts of Election Day versus Absentee Voting onUndervote Rates Controlling for County, Precinct Partisanship, and Precinct Tendency to Under-vote
District 11 District 13 District 14
!0.0
4!0
.02
0.00
0.02
0.04
0.06
0.08
0.10
Hillsborough
Manatee
Pinellas
Charlotte
Hardee
Manatee
Sarasota
Charlotte
Collier
Lee
Note: Values of bars are based on differences between election day and absentee indicatorvariables from Table 2. Bold county names denote bar values that are significantly different fromzero at the 0.05 level.
as its nearest competitor.
What might explain Sarasota’s prominence in Figure 9? In light of our three conjectures noted
24

earlier, it is hard to imagine that the Sarasota result reflects deliberate voter choices. If, say, CD
13 election day voters were driven away from participating in their Congressional race by a blitz
of last-minute negativity, then this should have affected all four counties in the CD 13 race and
not just Sarasota. As to the possibility that Sarasota voters are simply different than other CD 13
votes insofar as a willingness to undervote, this claim cannot explain the Sarasota effect in Figure
9 because the effect is calculated controlling for county effects and and precinct willingness to
undervote.
Rather, recall from Table 1 that among counties studied here Sarasota County was one of two in
its use of iVotronic machines in conjunction with a Congressional district race that did not appear
on its own ballot page. If, for reasons that transcend this paper, voters are more likely to undervote
in a two-candidate race that appears immediately above or conceivably immediately below a six-
candidate race that includes a write-in option, then we would expect to see a large Sarasota CD 13
effect, precisely what we observe in Figure 9. We might also expect to see a large Lee County CD
14 effect, which we do not see. However, the CD 14 effect, we suspect, reflects partisanship based
undervoting in a rather lopsided race.
Could the Sarasota effect in Figure 9 reflect engineering problems as discussed earlier? There
are several ways to think about this question. First, if voting hardware or software were the prob-
lem, then there must be something unique to Sarasota’s use of iVotronics that in November, 2006
did not dramatically affect, say, Charlotte County’s or Lee County’s machines. Whether iVotronic
software is tailored for individual counties is not something we know. If, though, it is not, then
there must be some sort of an interaction with a generic iVotronic software problem and Sarasota’s
use of it. Perhaps Sarasota’s iVotronic maintenance program is different than the maintenance
program in surrounding counties.
Second, if there were hardware or software problems among Sarasota’s iVotronics, then they
affected practically all such machines. This is an important point in light of our regression results
in Table 2. One can always ask, that is, if a small group of aberrant precincts affected a set
25

of regression. To see that the Sarasota undervote problem was not restricted to a few precincts,
consider Figure 10, which displays box plots of differences between election day and absentee
undervote rates among precincts in CD 13.
Figure 10: Differences in Congressional District 13 Election Day and Absentee Undervote Ratesamong Four Counties
Charlotte Hardee Manatee Sarasota
!0.2
!0.1
0.0
0.1
0.2
0.3
0.4
County
Elec
tion
Day
to A
bsen
tee
Diffe
renc
e
26

Figure 10 shows that the median election day minus absentee CD 13 undervote rate difference
in Sarasota County was much greater than the maximum such values in Charlotte, Hardee, and
Manatee counties. The box plot also shows the first quartile of differences, the third quartile, and
the minimum and maximum differences. The implication of Figure 10 is that the CD 13 regression
results in Table 2 do not reflect a few precincts with enormous undervote rate problems but rather a
consistent pattern among Sarasota precincts. Thus, if there were hardware and/or software issues at
play in Sarasota, they were reasonably pervasive and not restricted to a few problematic precincts
or even voting machines within precincts.
3.3 More Evidence of Ballot Format-Induced Undervotes
If Sarasota’s grouping of races on its iVotronic touchscreen machines drove the CD 13 undervote in
that county, then we should expect to see similar evidence of unusually high undervote rates when
we observe other groupings of races in counties that use iVotronics. To this end we turn to the top
four Florida races among the eight counties that comprise CD 11, CD 13, and CD 14. As before
we consider all election day, early voting, and absentee precincts in these counties and calculate
undervote rates for the following Florida races: governor, attorney general, chief financial officer,
and commissioner of agriculture. The latter three races are called cabinet races.
Among the eight counties we study four use iVotronics: Charlotte, Collier, Lee, and Sarasota.
For these four counties Table 3 describes notable groupings for the governor and cabinet races akin
to the way that the CD 13 race was grouped with the Florida gubernatorial race in Sarasota County.
As noted earlier, the governor’s race in Florida had six candidates plus a write-in slot whereas the
cabinet officers all had two candidates and no write-in possibilities.
In light of Table 3 and our CD 13 findings, we should expect to see large election day versus
absentee differences for the attorney general race in Charlotte and Lee Counties. These reflect the
most asymmetric groupings in the table just as Sarasota grouped a small CD 13 race with a multi-
candidate gubernatorial contest. We also might expect to see grouping effects in Collier County
27

Table 3: Groupings among Governor and Cabinet Races in iVotronic Counties
County GroupingsCharlotte Governor paired with Attorney GeneralCollier Governor alone, then three cabinet races on next pageLee Governor paired with Attorney GeneralSarasota Governor with CD 13, then cabinet races together
insofar as this county combined all cabinet races on a single page.
Before turning to precinct regression results we first examine some ballot data from Charlotte
County with an eye on the cabinet races. Such data were already displayed in Figure 8 and an
attorney general effect was noted there. Figure 11 shows similar effects.
The figure shows that Charlotte voters behaved very differently in the attorney general race
than in other top races. Namely, conditional on undervoting in attorney general, many Charlotte
voters had zero undervotes among a large set of races; the same thing is true conditional on not
undervoting in the attorney general race. However, conditional on undervoting in the Senate race
(or in the other races in Figure 11) the probability of zero undervotes among other races is small.
The point here is simple: attorney general undervoters in Charlotte are not very different than
attorney non-undervoters, but Senate undervoters are very different than Senate non-undervoters.
We now estimate four weighted least squares regressions, one for each top Florida race. Each
regression produces 26 slope estimates: a Senate undervote estimate, a Senate Democratic share
estimate, and 24 (eight by three) estimates for eight counties cross three different times of voting
(complete regression results are available from the authors). Figure 12 summarizes election day
minus absentee differences, controlling for precinct undervote tendencies and partisanship using,
as we did before, the fraction of Senate undervotes by precinct and the fraction of Democratic
Senate votes.
There are two notable features of Figure 12. First, with respect to the attorney general race,
Charlotte and Lee Counties had enormous gaps between election day and absentee voting propen-
28

Figure 11: Distribution of Undervote Counts by Ballot for Election Day Voters in Charlotte County
0.0
0.2
0.4
0.6
0.8
1.0
Frac
tion
of B
allo
ts
US Senate Governor Att’y Gen’l CFO Argiculture Amend. 1
Note: This figure depicts the distribution of undervote counts by ballot and across 18 commonraces in Charlotte County. For voters who had a U.S. Senate race undervote, the 19 rectangles inthe left stack of the U.S. Senate column describe the fraction of ballots that had zero undervotesignoring the Senate race (the lowest rectangle, i.e., approximately 15 percent), the fraction withone undervote ignoring the Senate race (the second lowest rectangle, i.e., another 10 percent), andso forth. The right hand stack of 19 rectangles in the U.S. Senate column describes thedistribution of undervotes by ballot (zero, one, two, and so forth through 18) for voters who didnot have a Senate race undervote.
29

Figure 12: Effect on Top Florida Races of Election Day versus Absentee Voting on UndervoteRates Controlling for County, Precinct Partisanship, and Precinct Tendency to Undervote
Governor Attorney General Chief Financial
Officer Commissioner of
Agriculture
0.00
0.05
0.10
0.15
0.20
CharlotteCollierHardeeHillsboroughLeeManateePinellasSarasota
30

sities to undervote. The difference here is on the order of 20 percent, all things equal, which is
about twice as large as the CD 13 effect identified in Sarasota County. These gaps are consistent
with the race grouping conjectures that follow from Table 3.
Second, Collier County shows a consistent effect of election day voting although nothing nearly
as dramatic as the Charlotte and Lee effects noted above. These Collier effects seem roughly
consistent with the consequences of grouping three races on a page, i.e., too many similarly sized
races on a single page leads to undervotes. However, this conclusion should be considered highly
speculative,
The reason that Figure 12 is so important is because it supports the reasoning offered here for
the CD 13 undervote. If one were to take seriously the notion that voter indifference, potentially
induced by campaign negativity, drove the CD 13 undervote rate in Sarasota, one would have to
argue that voter indifference over Florida attorney general candidates affected voters in Charlotte
and Lee Counties. How this might happen is not clear. If Florida voters were in general indifferent
between attorney general candidates, why would they act on their indifference only in two counties
and why on election day but not during absentee voting, controlling for precinct tendencies?
Similarly, the case for hardware and software problems in Sarasota becomes more difficult to
make given Figure 12. If Sarasota experienced a generic voting machine malfunction, then this
same malfunction affected two other neighboring counties but only in one particular race (and not
in the same race that the malfunction appeared in Sarasota). Of course this could have happened:
flaws in software code can interact in ways that are hard to predict, and we can never rule out
the possibility that the culprit here is engineering. Nonetheless, without laboratory evidence this
seems to be a hard case to make. At this point the argument that ballot formatting drove the CD 13
undervote in Sarasota and the attorney general undervote in Lee and Collier is more compelling.
31

4 Allocating CD 13 Undervotes to Buchanan and Jennings
We now consider the question, what would have happened in CD 13 if the undervotes cast in
Sarasota followed patterns similar to those cast elsewhere in the district? We answer this question
in two ways, first with precinct returns from eight counties and second with ballot data from two.
In Sarasota County, a total of 120,686 touch screen ballots were cast in either early or election
day voting. Of these, 17,811, or 14.8 percent, did not vote in the CD 13 race while only 2.6 percent
undervoted across other Charlotte, Hardee, Manatee Counties in this same race. If we assume that
a similar 2.6 percent of voters in Sarasota preferred to have undervoted in the CD 13 race, then
approximately 14,750 voters in Sarasota County would have cast a vote in this race if the Sarasota
touchscreen ballot had been no different than the ballots in Charlotte, Hardee, and Manatee.
4.1 Two Stylized Stories about the Source of Sarasota Undervotes
There are two stylized stories we might tell to explain why these 14,750 voters did not cast a vote in
the CD 13 race. One, the surplus level of undervoting in Sarasota might have been driven entirely
by some voters accidently not seeing the CD 13 candidates; or, two, it might have been driven by
indifference on the part of certain types of voters. That is, some Sarasota undervotes were caused
by individuals who saw the CD 13 race and chose not to vote in it while the rest were caused by
voters who did not initially see the CD 13 race because of the Sarasota ballot format but would
have seen it if given a better format. Call these suppressed ballots and the votes which would have
been cast from the suppressed ballots the intended votes.28
28Certainly, some suppressed voters who did not see the Congressional race on the ballot would have gone on toundervote deliberately in CD 13 if they had seen it. Thus, we assume that some fraction of intended votes would havebeen cast as undervotes.
32

4.1.1 Suppression by Random Accident
At one extreme, we might suppose that the rate of suppressed votes is explained entirely by ballot
mechanics, i.e., the touchscreen ballot format in Sarasota County led to a certain probability of
“accidents” where voters did not see the CD 13 race and did not ever face the choice they would
otherwise have made between voting for a Republican or Democratic candidate or indeed choosing
not to cast a CD 13 vote at all. If surplus undervoting in Sarasota County were driven by completely
random accidents, then the suppressed voters are a completely random sample of the voters in each
precinct.
From the assumption that ballot mechanics explain everything, two points can be made. First,
the distribution of intended votes should follow (within sampling variance) the distribution of votes
cast by voters who were not suppressed. If this model were true, then the roughly 15,000 intended
votes would have fallen in about the same split as the unsuppressed votes in Sarasota County
and thus split roughly 7,500 for Jennings and 6,500 for Buchanan. This would result in Jennings
picking up 1000 votes over Buchanan and overcoming the 369 vote deficit on the day.
Second, both candidates received fewer votes than they would have received if the intended
votes had been cast, as suppression transfered votes from each of their columns to the undervote
column. This second point can be clearly demonstrated with precinct data. Suppose that we
calculate vote shares as the percent of the votes cast for the Democratic candidate out of all ballots
cast including undervotes, such as:
Democratic Voteshare =Democratic Votes
Dem. Votes+ Rep. Votes+ Undervotes. (1)
Then, under the story of suppression caused by accident, we should expect some voters who in-
tended to vote Democratic to instead undervote, thus the numerator above gets smaller while the
denominator stays the same size as votes are simply transfered from Democratic votes to un-
dervotes. Thus the Democratic vote share, as a share of all votes cast, should be decreased by
33

0.0 0.2 0.4 0.6 0.8 1.0
0.0
0.2
0.4
0.6
0.8
1.0
Early Votes
Senate Democratic Voteshare
CD13
Dem
ocra
tic V
otes
hare
0.0 0.2 0.4 0.6 0.8 1.0
0.0
0.2
0.4
0.6
0.8
1.0
Early Votes
Senate Democratic Voteshare
CD13
Dem
ocra
tic V
otes
hare
0.0 0.2 0.4 0.6 0.8 1.0
0.0
0.2
0.4
0.6
0.8
1.0
Election Day Votes
Senate Democratic Voteshare
CD13
Dem
ocra
tic V
otes
hare
0.0 0.2 0.4 0.6 0.8 1.0
0.0
0.2
0.4
0.6
0.8
1.0
Election Day Votes
Senate Democratic Voteshare
CD13
Dem
ocra
tic V
otes
hare
Figure 13: Democratic Vote Shares in Senate and CD 13 Races for Early and Election Day Voters
Note: Each red dot in the figure represents a Sarasota precinct and each blue dot a non-Sarasotaprecinct.
accidents. The Republican vote share would similarly be reduced.
Is this accident theory plausible in any sense? Figure 13 plots the vote shares of Jennings
vertically and for the Democratic Senate candidate horizontally. These two vote shares should
predict each other: as more (or fewer) voters in a district cast ballots for the Senate Democratic
candidate, we would expect more (or fewer) voters to also cast a ballot for Jennings in her House
race.29
What is clear from Figure 13 is that, at any level of Democratic Senate support, the number
of Democratic votes for Jennings is below what is expected: red points are clustered horizontally
below blue points and the red summary line dips below the blue summary line. Similarly, Buchanan
vote share in Sarasota County falls below what would be expected given Senate vote shares.30 This29The United States Senate race is chosen for this example as of all races it has the strongest relationship with the
Congressional race.30The corresponding figure is not shown, but patterns in it are as predicted by accidents that suppress Republican
votes and change them into undervotes.
34

effect seems to be more pronounced in the early voting than in the election day voting, which is
consistent with the story that some poll workers were warned of the problematic Sarasota ballot
format problem and tried to pass on this warning to voters who voted on the day of the election.
The slope of the Sarasota lines in Figure 13 is smaller than the non-Sarasota lines, which is what we
would expect if some constant fraction of all votes were being randomly suppressed and converted
to undervotes.31
4.1.2 Suppression by Indifference
Beyond this accident story, there is an alternate stylized conjecture for how suppressed intended
votes would have turned out had they not been suppressed. Suppose that there are two types of
voters, engaged and disengaged. Engaged voters followed the CD 13 election closely, clearly
prefer one candidate over another, and care deeply about the outcome. When faced with a choice,
engaged voters vote for the candidate they prefer. Disengaged voters may have no information
about the CD 13 race, or are disenchanted with both candidates, or for some other reason they
do not care about the outcome of the House race. When faced with the choice, Buchanan versus
Jennings, disengaged voters may deliberately choose to undervote or they might choose between
the candidates in a random fashion out of a perceived duty to vote. Disengaged voters may be very
knowledgeable and care deeply about other races on the ballot; we simply assume that they are not
interested in the CD 13 House race.
In these two hypothetical extremes, engaged voters would be expected to search the ballot
for their preferred House candidate and would not likely be tripped up by a ballot design flaw.
Moreover, if an engaged voter initially and accidentally misses voting for her preferred House can-
didate, when an electronic review screen warns her that she has not voted in the House election,
she is inclined to make the added effort to go back and correct this oversight. Conversely, dis-31In every other statewide race voted on in the 2006 midterm elections in Florida, the relationship in Sarasota
County predicting vote share from other election results is exactly the same as the relationship outside of SarasotaCounty (these results to be presented in a forthcoming version of this paper).
35

engaged voters are not seeking out the House election on the ballot, they are consequently more
likely to accidentally miss voting, and when they are warned they have made this error they are
less likely to spend the effort to go back and correct an undervote. In this story, one about engaged
and disengaged voters, the former are less likely to be suppressed the latter, more likely.
According to this way of thinking, at the extreme, if all suppressed votes were wholly disen-
gaged voters, then intended votes would have been equally split between Buchanan and Jennings.
Thus, if about 15,000 votes were suppressed, each candidate would have received an equal appor-
tionment of about 7,500 each. Jennings would not pick up votes on her opponent, and Buchanan
would still have won the election by 369 votes.
Let us now redefine the vote share of the Democratic candidate among votes cast for the Demo-
cratic or Republican candidates, that is excluding undervotes, as:
Democratic Voteshare =Democratic Votes
Dem. Votes+ Rep. Votes(2)
If the story of suppression owing to indifference occurs, an equal number of votes should be re-
moved from Buchanan and Jennings. If Jennings were previously winning by some number of
votes, say 100, then subtracting an equal number of votes from her and from her opponent will
cause the vote share for the winning candidate to increase as a 100 vote lead, i.e., a smaller total
number of votes cast will look like a greater ratio. If the earlier story about undervotes was instead
correct and suppression was caused completely by accident, then votes would be removed from
Jennings vote share in proportion to how votes were cast. Thus, under the “accident” story Jen-
nings (or Buchanan) vote share, as calculated above, should not change when suppression occurs
but under the “indifference” story, the winner in any precinct should seem to have a greater share
of the cast ballots when indifferent voters are suppressed.
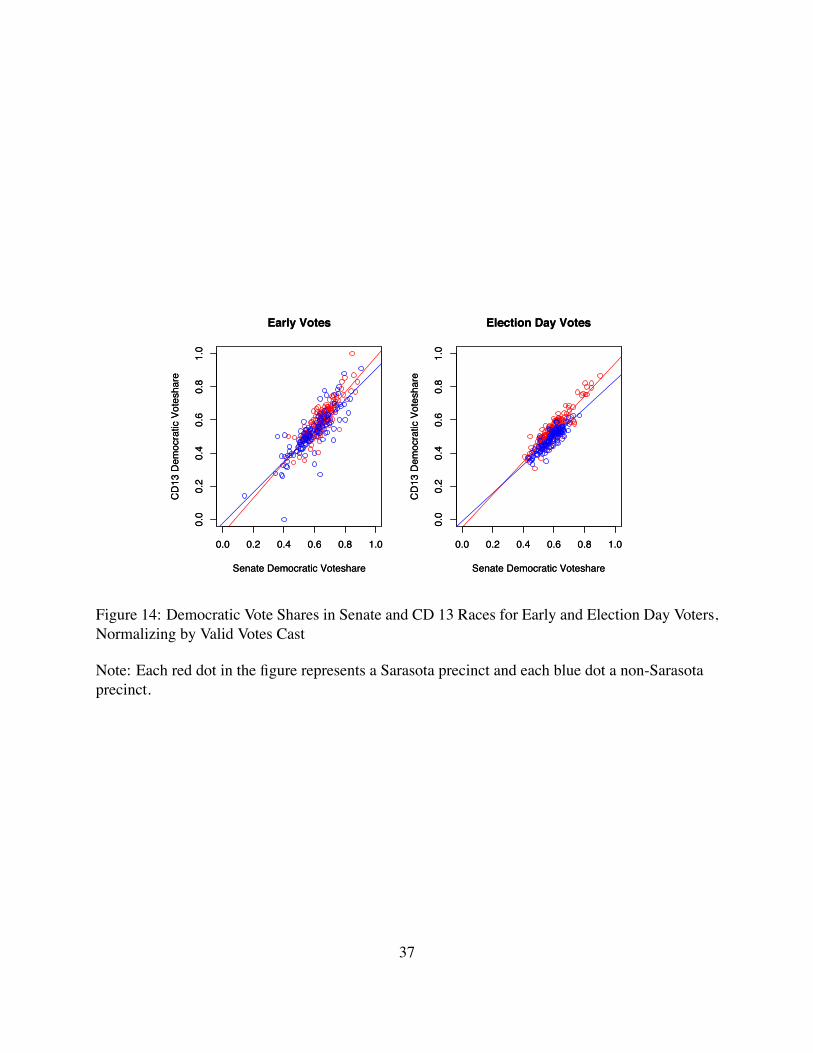
Figure 14 shows the relationship between Senate Democratic and CD 13 Democratic vote
shares but now using this different measure of vote share that excludes undervotes. What we see
36
0.0 0.2 0.4 0.6 0.8 1.0
0.0
0.2
0.4
0.6
0.8
1.0
Early Votes
Senate Democratic Voteshare
CD13
Dem
ocra
tic V
otes
hare
0.0 0.2 0.4 0.6 0.8 1.0
0.0
0.2
0.4
0.6
0.8
1.0
Early Votes
Senate Democratic Voteshare
CD13
Dem
ocra
tic V
otes
hare
0.0 0.2 0.4 0.6 0.8 1.0
0.0
0.2
0.4
0.6
0.8
1.0
Election Day Votes
Senate Democratic Voteshare
CD13
Dem
ocra
tic V
otes
hare
0.0 0.2 0.4 0.6 0.8 1.0
0.0
0.2
0.4
0.6
0.8
1.0
Election Day Votes
Senate Democratic Voteshare
CD13
Dem
ocra
tic V
otes
hare
Figure 14: Democratic Vote Shares in Senate and CD 13 Races for Early and Election Day Voters,Normalizing by Valid Votes Cast
Note: Each red dot in the figure represents a Sarasota precinct and each blue dot a non-Sarasotaprecinct.
37

here is that the Sarasota distribution, and the red line, is now above the blue distribution and blue
line. Thus the margin of victory is more dramatic in Sarasota precincts in the House race than
would have been predicted given the relationship between the margin of victory in Senate and
House races in other counties. This supports the theory that suppression did not occur completely
randomly; instead, voters who were indifferent were more likely to be suppressed causing the
margin of victory to increase.
4.1.3 Combining the Two Stylized Versions of Undervotes
The true process that occurred in Sarasota County is undoubtedly a mixture of our accident and
indifference stories. Almost certainly some Sarasota voters were suppressed by the grouped race
ballot design completely at random and completely by accident; these voters would be drawn
randomly from the set of voters in a given precinct. However, with respect to the CD 13 race
the iVotronic review screen that rescues some voters from being suppressed was probably more
likely to rescue engaged voters than voters who were indifferent and did not want to spend extra
effort voting in a race they had weak or no preference in. Thus some greater proportion of the
suppressed vote was indifferent voters who might be expected to split their votes evenly between
the candidates. This means that the observed margin of victory in suppressed precincts will be
greater than would have been observed if the precinct had not been suppressed.
4.2 Allocating Suppressed Votes with Precinct Returns
Our approach to the problem of suppressed votes is to use available aggregated precinct data to
estimate what the precinct vote totals in Sarasota County would have been if the ballot design and
equipment there had been equivalent to those used in the other counties in CD 13. Note that in
precincts in CD 13 which are outside Sarasota County we can observe all the relationships between
results in other races and the result in CD 13 race. These relationships will help us predict how we
would have expected the Congressional election in each Sarasota precinct to turn out, given that
38

we know how all the other races turned out in the same precinct.
In precincts inside Sarasota County, we obviously do not observe the counter-factual answer
we are seeking; thus, the Sarasota precincts cannot straightforwardly contribute information to our
model of the relationships between the CD 13 race and other races on the ballot. However, these
precincts do also contain some useful information. Although we do not know how the vote totals
in such precincts would have turned out if there had not been any ballot design issues, we do know
that, with respect to Buchanan and Jennings totals, these totals must be higher than the totals that
resulted on the day of the election. That is, the ballot design issue we have discussed could only
transfer intended votes from each candidate and turn them into undervotes. Therefore, although
we can not observe intended votes, we know Buchanan and Jennings would have received more
votes than he or she received, respectively, on election day.
Our statistical model of Sarasota undervote reallocation makes two key assumptions:
• The relationships between electoral races are the same across all precincts in CD 13. This
is not an assumption that all districts appear or vote the same. Clearly some vote heavily for
one candidate and some for another. Rather, we assume that the ability to predict one race
given knowledge of all the other races applies inside Sarasota in the same way that it applies
in non-Sarasota precincts.
• Both candidates, Buchanan and Jennings, would not have received fewer votes if the ballots
were correctly designed than they did on the day with the flawed ballot design. That is, the
issue of race grouping (CD 13 with Florida governor) did not add votes to either candidate
but only changed actual votes into undervotes.
From these assumptions, we derive a statistical model assuming that the vote shares for candi-
dates, as well as the proportion of voters intentionally undervoting, are additive-logistic-normally
distributed as in Katz & King (1999). Full technical are in Appendix A.
Our model gives us a probability density over all precinct results and thus cumulatively over all
39

election outcomes. We take one thousand random draws from this predicted density and calculate
one thousand predicted election outcomes. From our random draws we can answer key questions
such as, what fraction of Sarasota undervotes were suppressed votes of voters who intended to cast
a ballot for a candidate, how would those votes have broken between Buchanan and Jennings, and
how might that have influenced the election outcome. Additionally, and crucially, we can express
our degree of confidence in each of these quantities.
Our results are summarized in Table 4. This table provides estimated election results among
early and election day voters in Sarasota County. What is key is how many more votes Buchanan
and Jennings would have received if Sarasota undervotes had not been influenced by ballot design.
This is expressed as the pickup for each candidate and for undervotes as well. The undervote
pickup is negative as, according our reallocation, votes move from the undervote to Buchanan and
Jennings. The vote totals and pickups reported in Table 4 are the most likely, or expected, values.
In addition, associated 90% confidence interval estimates provide a measure of uncertainty in our
pickup totals.
Looking first at early voting, we can see that the confidence interval for the undervoting column
is -4396 to -4685, so we can be 90 percent confident that there would have been between 4396
and 4685 fewer early voting undervotes if there had been no ballot design problem in Sarasota
County. Our best guess is that 2436 suppressed voters intended to vote for Jennings and 2110
voters intended to vote for Buchanan in the early voting. Thus, Jennings would gain 326 votes
over Buchanan among early suppressed voters.
In election day voting we can be 90 percent confident that Jennings would gain between 5002
and 5861 more votes in Sarasota had there been no ballot design issues. Similarly, we can be 90
percent confident that between 4244 and 5060 voters intended to vote for Buchanan were instead
counted as undervotes.
Overall, what do these numbers mean? Looking to combined results, we can be 90 percent
confident that between 14,322 and 14,896 voters in Sarasota County were suppressed from voting
40

Table 4: Summary of Allocation Results
EARLY VOTING:Jennings Buchanan Undervote
Estimated Vote: 16903 12943 866Estimated Pickup: 2436 2110 -4546Lower bound of 90% Confidence Interval: 2176 1852 -4685Upper bound of 90% Confidence Interval: 2702 2362 -4396
ELECTION DAY VOTING:Jennings Buchanan Undervote
Estimated Vote: 45267 41123 2283Estimated Pickup: 5421 4647 -10068Lower bound of 90% Confidence Interval: 5002 4244 -10310Upper bound of 90% Confidence Interval: 5861 5060 -9811
EARLY + ELECTION DAY VOTING:Jennings Buchanan Undervote
Election Returns: 54313 47309 17763Estimated Totals: 62171 54066 3148Projected Pickup: 7858 6757 -14615Lower bound of 90% Confidence Interval: 7352 6267 -14896Upper bound of 90% Confidence Interval: 8383 7231 -14322
Predicted probability of Jennings’s pickup > 369: 0.896
in the thirteenth district race. Of these more than 14,000 votes, our best estimate is that Jennings
would have received 7858 and Buchanan, 6757. This would cause Jennings to gain 1101 votes
over Buchanan, thus overcoming her 369 vote deficit and changing the outcome of the CD 13 race.
However, it is important to realize that all of these numbers are simply best guesses. The truth
in each case (early and election day, Buchanan and Jennings) might be higher or lower. From
all our simulated election results, we calculated the total number of votes gained by Jennings
over Buchanan. When this number is greater than 369, then Jennings would have won the election;
when this number is less than 369 (and is possibly negative), Jennings would have lost the election.
41

Crucially, we are interested in the fraction of the time the vote gain by Jennings is greater than 369.
That is, we want to know the probability that if the suppressed votes in Sarasota had been recorded,
Jennings would have won the election to the House of Representatives. This probability, according
to our vote imputation model, is 89.6 percent.
4.3 Caveat to Precinct Allocation
While our precinct-level imputations provide reasonable results about what would have happened
in Sarasota County in the absence of a ballot format problem, they are not without limitations. In
particular, associated with them are several potential sources of bias, and the amount of information
contained in aggregate precinct returns is not sufficient to determine definitively whether balloting
problems resulted in Buchanan’s victory over Jennings by 369 votes. And, as mentioned above,
our statistical model cannot pin down the exact mechanism that led to excess undervotes in the
Attorney General and CD 13 elections when those elections were presented on the same ballot
screens as the Florida Governor race.
Our models are predicated on two fundamental assumptions: (1) Net of any voting machine
effects, precinct-level variation in early voting and election day undervote rates and support levels
for candidates is similar across counties conditional on precinct-level absentee voting and voting
in other races common to those counties. That is, we assume that, if elections were commonly
administered across counties, knowing that a precinct was located in a given county would provide
no additional predictive leverage on undervote rates or candidate support beyond what can be
learned by observing other election results from that precinct. (2) There are no further substantial
and systematic voting machine or ballot format effects beyond the grouping issues identified.
Violation of either assumption could bias our findings. However, in order to assess the validity
of these assumptions, we have performed a number of statistical experiments in which we imputed
election returns among CD 13 counties for offices in which there are no reasons to suspect ballot
format problems. In those experiments, our imputed values closely approximated observed election
42
returns.
Assuming that our two key assumptions are not grossly violated, the precinct-level data we
have described here pin down the magnitude of the undervoting problem in CD 13 to within plus or
minus 300 undervotes. Nonetheless, the allocation of those undervotes to Buchanan and Jennings
is not as precise as we would like given the closeness of the race, our assessment of the probability
of Jennings winning the election absent balloting problems in Sarasota County is more sensitive to
model assumptions and specification than we would like and, obviously, a confidence interval of
plus or minus 1,000 votes net pickup for Jennings while small in percentage terms is large relative
to the 369 vote difference that separates her and Buchanan.
4.4 Allocating Suppressed Votes with Ballot Data
Another way to estimate Sarasota’s excess early and election day undervotes in CD 13 to Buchanan
and Jennings is to compare patterns of undervotes on Charlotte County and Sarasota County ballots
(setting aside the problematic governor and attorney general races). To estimate the probability
that a given Charlotte voter would vote in the CD 13 race given her votes and undervotes for other
offices (specifically, U.S. Senate, chief financial officer, commissioner of agriculture, Amendment
8, and the retention of Supreme Court Justice Lewis), we use the simple logit models in Table
5, column one.32 Because only 7,326 of Charlotte’s election day and early voters lived in CD 13
and only 174 of those undervoted, we cannot accurately estimate the probability of participation
in the CD 13 race conditional on voting in other races in a fully non-parametric way. However,
by including a number of interaction terms in our logit specification, we do allow for a good
deal of flexibility. For reasons that will be become clear shortly, we also require estimates of the
probability that each voter in Sarasota County votes or undervotes in the CD 13 race given her
other voting decisions. The estimated parameters of this model are shown in the second column of32We are still trying various alternative specifications of our logit model, but thus far the results do not appear to
depend importantly on the exact specification used.
43

Table 5.
Table 5: Logit Models Predicting Voting and Candidate Choice in CD 13
Charlotte Sarasota SarasotaVariable (vote=1) (vote=1) (Dem. vote|vote=1)US Senate 1.99 0.55 2.47
(0.42) (0.09) (0.03)CFO 1.24 0.26 2.10
(0.55) (0.12) (0.05)Agriculture Commissioner 1.17 0.97 -1.99
(0.25) (0.04) (0.07)Amendment 8 0.38 0.16 0.31
(0.33) (0.04) (0.04)Supreme Court: Lewis -0.15 -0.10
(0.49) (0.05)Amendment 8 (No) ! Supreme Court 0.22 0.27
(0.53) (0.06)US Senate ! CFO 0.23 0.53 -0.22
(0.56) (0.12) (0.05)US Senate ! Agric. Comm. -0.46
(0.07)US Senate ! Amendment 8 -0.02
(0.05)Agric. Comm. ! Amendment 8 -0.46
(0.06)Intercept -0.86 -0.70 -2.70
(0.41) (0.09) (0.02)N 7,326 119,897 102,073Log likelihood -704.45 -483,329 -29,857Geometric Mean Probability 0.90 0.67 0.75
To estimate how the Sarasota CD 13 undervotes that should have been votes would be divided
between Buchanan and Jennings, we assume that conditional on votes in other races on the bal-
lot, those Sarasota voters undervoting in the CD 13 race were no more or less likely to support
Buchanan or Jennings than those who did not undervote in this race. That is, we assume that once
we observe the other choices made by a voter, there is no additional information about that voter’s
CD 13 candidate preference to be gained from knowing that she undervoted in that race. Under
44

this assumption, we can estimate the probability that any Sarasota voter would support Buchanan
or Jennings given her support for other candidates on the ballot by analyzing the Sarasota ballots
which contain a valid CD 13 vote. For this estimation problem, we employ the logit model in Table
5, column three. Here we model the probability of supporting Jennings as a function of variables
indicating whether Democrats were supported in the given races (or whether Amendment 8 was
opposed).
We pose the following counterfactual: what if each Sarasota voter had voted using Charlotte’s
machines? We assume the model governing Charlotte voters’ undervoting would apply to Sarasota
voters if they had voted in Charlotte.33 That is, if we apply the Charlotte undervote model to a
Sarasota voter, we would get a reasonable estimate of the probability that this voter would have
participated in the CD 13 election if she had been voting in Charlotte. Thus, for any voter i we can
consider two events, the event Ci in which she undervotes using a Charlotte machine and the event
Si in which she undervotes using a Sarasota machine. We assume that any voter who undervotes
in Charlotte would undervote if voting in Sarasota, thus the event Si obtains whenever the event
Ci obtains; formally, Si " Ci = Ci. To allocate Sarasota undervotes, we require estimates of the
probability of Ci given Si. That is, we need to know the probability that each Sarasota undervoter
would continue to undervote if using Charlotte machines. By the definition of conditional prob-
ability, P (Ci|Si) = P (Ci " Si) /P (Si), which in this case is simply P (Ci) /P (Si). Estimates of
P (Si) and P (Ci) are obtained from the logit regressions described above. Given these estimates of
P (Ci|Si) and the probability of voting for Buchanan or Jennings conditional on voting at all, it is a
simple matter of multiplication to assign to each Sarasota CD 13 undervoter a probability of con-
tinuing to undervote, supporting Buchanan, or supporting Jennings. Summing these probabilities
yields the reallocation in Table 6.34
33Among other thing this assumption requires that there were no other layout or machine issues in Sarasota orCharlotte that we are not accounting for.
34Confidence intervals are obtained through the use of a bootstrap oversampling the data used to produce the modelsshown in Table 5.
45
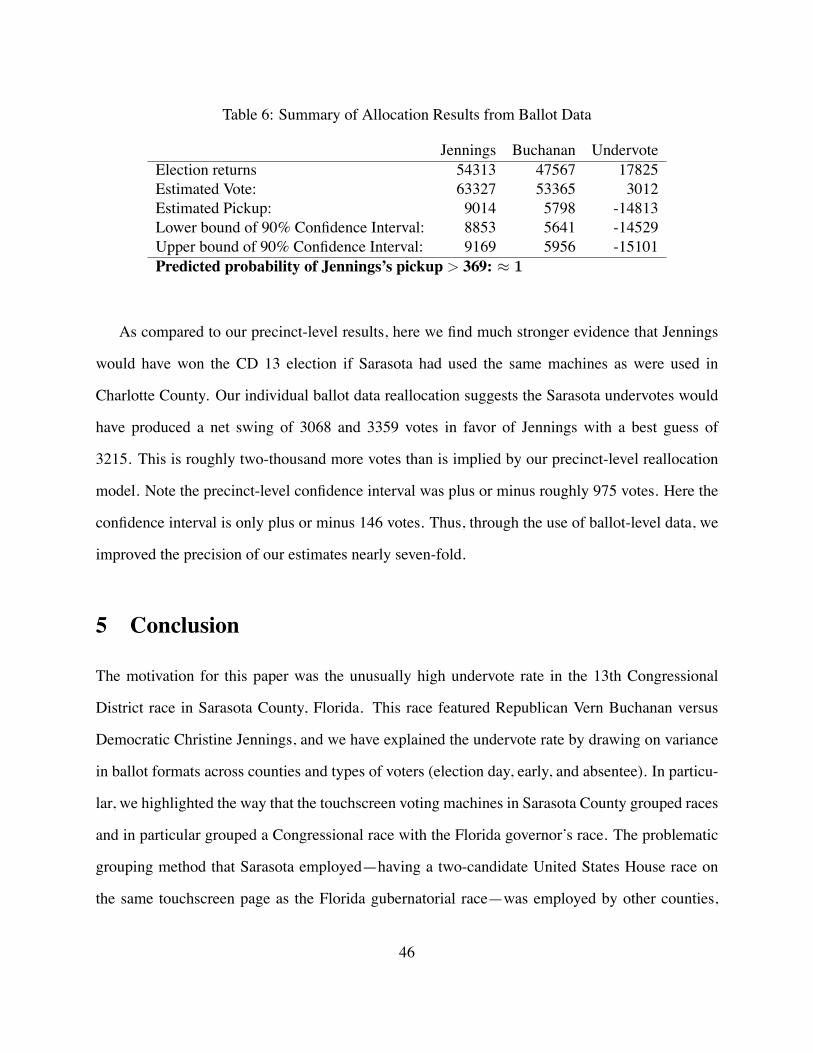
Table 6: Summary of Allocation Results from Ballot Data
Jennings Buchanan UndervoteElection returns 54313 47567 17825Estimated Vote: 63327 53365 3012Estimated Pickup: 9014 5798 -14813Lower bound of 90% Confidence Interval: 8853 5641 -14529Upper bound of 90% Confidence Interval: 9169 5956 -15101Predicted probability of Jennings’s pickup > 369: # 1
As compared to our precinct-level results, here we find much stronger evidence that Jennings
would have won the CD 13 election if Sarasota had used the same machines as were used in
Charlotte County. Our individual ballot data reallocation suggests the Sarasota undervotes would
have produced a net swing of 3068 and 3359 votes in favor of Jennings with a best guess of
3215. This is roughly two-thousand more votes than is implied by our precinct-level reallocation
model. Note the precinct-level confidence interval was plus or minus roughly 975 votes. Here the
confidence interval is only plus or minus 146 votes. Thus, through the use of ballot-level data, we
improved the precision of our estimates nearly seven-fold.
5 Conclusion
The motivation for this paper was the unusually high undervote rate in the 13th Congressional
District race in Sarasota County, Florida. This race featured Republican Vern Buchanan versus
Democratic Christine Jennings, and we have explained the undervote rate by drawing on variance
in ballot formats across counties and types of voters (election day, early, and absentee). In particu-
lar, we highlighted the way that the touchscreen voting machines in Sarasota County grouped races
and in particular grouped a Congressional race with the Florida governor’s race. The problematic
grouping method that Sarasota employed—having a two-candidate United States House race on
the same touchscreen page as the Florida gubernatorial race—was employed by other counties,
46

albeit with different races, and in these other counties and associated races we generally find high
undervote rates. The only times we see a problematic grouping without a large undervote is when
the associated race is not at all close.
Thus, what looks on the surface like a Sarasota County issue is in fact more general. Moreover,
like the butterfly ballot format used in Palm Beach County in the 2000 presidential race, it appears
that the Sarasota ballot format in the 2006 midterm elections was pivotal to the winner of tightly-
contested 13th Congressional District race in Florida. We estimate that, had Sarasota used a ballot
format akin to those in neighboring counties, with probability 0.9 Jennings would have beaten
Buchanan.
There remain two key issues over which we do not have leverage. The first is the precise reason
as to why grouping races on touchscreens is a problem. Is the issue asymmetry between races, i.e.,
a race with two candidate grouped with a race with multiple candidates? Or, is it total number of
candidates on a page? Or, is the issue vertical stacking of races versus horizontal grouping? Or,
is there a tradeoff between grouping races and the number of pages in a ballot wherein greater
number of pages itself leads to undervotes? We cannot address these questions at this time, but
work in the vein of Herrnson, Abbe, Francia, Bederson, Lee, Sherman, Conrad, Niemi & Traugott
(2005), Herron & Lewis (2006), and Herrnson et al. (2006) may be applicable here.
Second, and as mentioned previously on several occasions, because this paper presents a sta-
tistical analysis of vote patterns and not a physical examination of voting machines, we cannot
completely rule out voting machine malfunction as a source of the Sarasota undervote. Is it techni-
cally possible that software or hardware glitches are responsible for the Sarasota undervote and the
Charlotte and Lee undervotes? Yes, this is possible. However, it seems to be a significant stretch
of the imagination: if the issue is a software or hardware glitch, the glitch would have had to have
manifested itself among almost all voting machines in Sarasota County but affected only one race
and then have manifested itself in almost all machines in Charlotte and Lee Counties yet affected
a different race.
47
We conclude with what we believe is a simple and conservative implication of our main finding:
iVotronic touchscreen voting systems should not combine important races on the same voting page.
Regardless of why exactly combining races is a problem, this proposal seems likely to avoid it.
A Appendix
This technical appendix explains the procedures used to allocate Sarasota County’s election day
and early voting undervotes using precinct-level data.
A.1 Compositional Transformations
For the various counties considered here we know how many votes were cast in each precinct for
each ballot choice (Republican, Democratic, or Undervote) by each voting method (early voting,
election day voting, and absentee voting).35 Let V e,mi,c represent the vote share in precinct i, race e,
by methodm $ {early, e.d., abs.}, for choice c $ {D,R,U}.
For any given race and voting method (that is, temporarily ignoring superscripts), individual
vote shares are constrained to the simplex,
Vi,c $ [0, 1] % i, c, (3)
and the set of votes in a precinct across the three choices sums to unity,
Vi,R + Vi,D + Vi,U = 1 %i. (4)
The space of each vector Vi is therefore the three dimensional simplex. For compositional data in
a J-dimensional simplex, the transformation of Aitchison (1986) creates a set of J & 1 log ratios35We discard votes for the minor candidates who contested the gubernatorial race and for all write-ins, and we also
discard overvotes. All of the discarded votes are negligible totals in the races studied here.
48

each of which compare the vote of one party to that of a baseline or reference party. Without loss
of generality we use the Democratic party as our reference choice: transformations are:
Y e,mi,RD = ln
!V e,m
i,R
V e,mi,D
"(5)
Y e,mi,UD = ln
!V e,m
i,U
V e,mi,D
"(6)
The set of log vote ratios Y are now individually and collectively unconstrained. Examination of
such ratios in other contexts has found them to be well fitted by a multivariate t or multivariate
normal distribution (Katz & King 1999, Jackson 2002, Tomz, Tucker & Wittenberg 2002). Thus.
our key modeling assumption is that collectively Yi are joint multivariate normal across all relevant
c, e, and m. The reverse transformation from Y to V implies that the vote shares themselves are
distributed additive-logistic-normal.
A.2 Imputation
Define S as a dichotomous indicator that is one in Sarasota county and zero elsewhere; let V and
Y be observed votes shares and transformations as set out above; and, let"V and
"Y be the latent
vote shares and transformations that would have been observed if there were no ballot flaw in that
race. Clearly,"
Y CD13i = Y CD13
i , %si = 0, but elsewhere,"
Y CD13i is unobserved. However, many
other races and election methods are observed in Sarasota County and its neighbors.
The eight election methods that we include in our imputation model are listed in Table 7. The
vote shares from each method are transformed into two log vote ratios for sixteen fully observed
variables. We omit the gubernatorial race because it was the race that shared a ballot screen with
the CD 13 race in Sarasota County. Absentee votes for the CD 13 are included as forecasting
variables as these ballots are paper and not subject to any of the proposed mechanisms for the CD
13 ballot failure. We include all precincts in CD 13 from Charlotte, Hardee, Manatee, and Sarasota
49

Race MethodsCongressional District 13 AbsenteeUnited States Senate Early, Election Day, AbsenteeAgricultural Commissioner Early, Election DayChief Financial Officer Early, Election Day
Table 7: Races and Voting Methods used in Imputation Model
Note: The Sarasota County absentee ballots in the CD 13 race can be used to forecast early andelection day totals as the former did not suffer from any of the touchscreen formatting problems.
Counties except the small number of precincts in Manatee that were split between the CD 11 and
CD 13 races. At the time of this writing Desoto County data disaggregated by election method is
not available. As a point of notation, from this point onward we refer to the log vote ratios in the
early and election day voting in the CD 13 race as Y ’s and the log ratios of all these other races in
table 7 as X’s, although latter were constructed by equation 5.
If we consider"Y = Y for all si = 0 and all observations of
"Y = Y within Sarasota as completely
missing data (with observed covariates X), then our model has the same architecture as any con-
ventional multivariate normal imputation model (Schafer 1997, Donald B 1987, King, Honaker,
Joseph & Scheve 2001). We can estimate the posterior distribution of the missing values and draw
imputations from this distribution to create fully observed datasets from which it is straightforward
to create quantities of interest such as the vote totals of each candidate.
However, as there are only two patterns of missingness in our data, the critical complication
of imputation algorithms, running large numbers of simultaneous equations, can be avoided.36
Ignoring covariance between early and election day returns, within the CD 13 race the imputation36All observations are either fully observed or are missing the four log ratios of early and election day voting in the
CD 13 race.
50

model is simply two sets of bivariate normal regressions:
("
YRD,"
YUD) ! fbivariate normal(µRD, µUD, Σ)
µRD = Xβ
µUD = Xγ (7)
whereX consists of 16 log vote ratios from the elections in Table 7, plus a constant vector. Imputa-
tions of"Y from this model will give us completely observed data. However, given the simplicity of
the patterns of missingness in our model, we can elaborate on the conventional multivariate normal
model to include vote shares within Sarasota as censored observations.
A.3 Constraints
Observed CD 13 vote shares in Sarasota County contain some information about latent values. If
the Sarasota ballot had been equivalent to the ballots used in other CD 13 counties, then it is reason-
able to assume that some Sarasota ballots which contain CD 13 undervotes would have registered
a vote for a candidate while no votes successfully cast for either candidate would change. Thus, in
Sarasota County the vote shares for both Buchanan and Jennings must be strictly increasing in un-
dervotes allocation and the vote share of undervotes correspondingly decreasing. Moreover, there
are upper bounds for how much Buchanan and Jennings vote shares could change if all Sarasota
CD 13 undervotes were allocated to these two candidates. In the limit, all under votes could break
for Buchanan or Jennings. Thus, the observed vote shares in Sarasota give us a series of bounds
on the latent vote shares:
"V i,U ' Vi,U %i : si = 1 (8)
(Vi,R + Vi,U) ("V i,R ( Vi,R %i : si = 1 (9)
(Vi,R + Vi,U) ("V i,D ( Vi,D %i : si = 1 (10)
51

Vs
Vm
Undervote
JenningsBuchanan
Figure 15: Ternary plot of Hypothetical Sarasota and Manatee County Precincts
Note: The two precincts are denoted Vm (Manatee County) and Vs (Sarasota County). In Vs,which suffers from the ballot flaw described in the body of this paper, the latent vote share mustbe closer to the Buchanan and Jennings corners and thus can only fall in the red region. Thevertical dashed line defines which candidate won the plurality.
As an illustration, imagine reported results in two hypothetical precincts, Vs in Sarasota County
and Vm in neighboring Manatee County. In Manatee, where there was no ballot format problem,"
Vm= Vm. In the Sarasota precinct, assume Jennings received 45 percent of the vote and Buchanan
35 percent, and assume that the remaining 20 percent of ballots were CD 13 undervotes. In the
ternary plot in Figure 15, this precinct is represented by the point Vs. The region shaded in red
represents all points that are closer to both bottom vertices than Vs is, thus the set of possible
election results if the intended votes were counted. This red region is the space where"Vs might be
located.37 These bounds on"V imply a set of bounds on
"Y . The most straightforward is:
37The vertical dashed line separates points closer to Buchanan from points closer to Jennings. Neither candidatehas received a majority in this precinct, but Jennings currently has a plurality. Buchanan could still win the precinctplurality if enough undervotes fell his way, as the red region crosses this line.
52

"Y i,UD ' Yi,UD (11)
Additionally, if we knew the true undervote,"V i,U , we could define the functions:
Y +i,RD(
"V i,U) = ln
!Vi,R + (Vi,U&
"V i,U)
Vi,D
"(12)
Y !i,RD(
"V i,U) = ln
!Vi,R
Vi,D + (Vi,U&"V i,U)
", (13)
which provide bounds on
Y +i,RD(
"V i,U) (
"Y i,RD ( Y !
i,RD("V i,U) (14)
We simplify these functions to their limiting values as"V i,U) 0
Y +i,RD = ln
!Vi,R + Vi,U
Vi,D
"(15)
Y !i,RD = ln
!Vi,R
V qqi,D + Vi,U
"(16)
Using equation 11 and the simplified form of equation 14 we can set the limits of integration for:
L(β, γ, Σ|Si = 1) =
# Y +i,RD
Y −i,RD
# Yi,UD
!#pbvn(r, s|Xiβ,Xiγ, Σ)δs δr (17)
while the precincts outside Sarasota more straightforwardly contribute:
L(β, γ, Σ|Si = 0) = pbvn(Yi,RD, Yi,UD|Xiβ,Xiγ, Σ) (18)
53

A.4 Rejection Sampling
We parametrically bootstrap the parameters from our imputation model. From each bootstrapped
set of parameters we create one imputed dataset where all the election outcomes are the same
as observed values except that the early and election day CD 13 vote shares in Sarasota County
precincts are draws from their posterior distributions, conditional on other observed elections in
those precincts. Although five or ten imputed datasets is sufficient in most analyses, we want to
create confidence intervals of some quantities and so impute 1000 datasets.
Our imputation model as previously discussed is multivariate normal in the space of the Y s.
The quantities of interest to us, however, are the vote totals for each candidate. This requires
transforming imputed log vote ratios back to vote shares and then multiplying these vote shares by
the total turnout in each precinct. The reverse transformation is:
$V i,U = exp(
$Y i,UD)/Wi (19)
$V i,D = 1/Wi (20)$V i,R = exp(
$Y i,RD)/Wi (21)
where Wi = 1 + exp($Y i,RD) + exp(
$Y i,RD) (22)
Our imputed values are drawn from an untruncated conditional posterior yet we want values
conditional on V . Therefore we need draws from a truncated distribution that obeys$V i,U' Vi,U ,
$V i,D( Vi,D, and
$V i,R( Vi,R. Following Honaker, Katz & King (2002), we rejection sample each
vector$Vi until every observation passes all constraints. This rejection sampling needs to be done on
the imputations regardless of whether the CD 13 returns in Sarasota County are treated as entirely
missing or as censored values.
54

References
Aitchison, John. 1986. The Statistical Analysis of Composition Data. London: Chapman & Hall.
Ansolabehere, Stephen & Charles Stewart III. 2005. “Residual Votes Attributable to Technology.”
Journal of Politics 67(2):365–389.
Ansolabehere, Stephen & Shanto Iyengar. 1995. Going Negative: How Campaign Advertising
Shrinks and Polarizes the Electorate. New York: The Free Press.
Brady, Henry E., Justin Buchler, Matt Jarvis & John McNulty. 2001. “Counting All the Votes: The
Performance of Voting Technology in the United States.” Report published by the Survey
Research Center and Institute of Governmental Studies, University of California, Berkeley.
Carrier, Michael A. 2005. “Vote Counting, Technology, and Unintended Consequences.” St. John’s
Law Review 79(3):646–687.
Celeste, Richard F., Dick Thornburgh & Herbert Lin. 2005. Asking the Right Questions About
Electronic Voting. Washington, DC: National Academies Press.
Donald B, Rubin. 1987. Multiple Imputation for Nonresponse in Surveys. New York: John Wiley
& Sons.
Feldman, Ariel J., J. Alex Halderman & Edward W. Felten. 2006. “Security Analysis of the
Diebold AccuVote-TS Voting Machines.” Working paper, Center for Information Technol-
ogy Policy and Department of Computer Science, Princeton University.
Florida Department of State. 2005. “Analysis and Report of Undervotes and Overvotes for the
2004 General Election.” Study published pursuant to Florida Statute 101.595.
Freeman, Steven F. & Joel Bleifuss. 2006. was the 2004 presidential election stolen? New York:
Seven Stories Press.
55

Herrnson, Paul S., Benjamin B. Bederson, Richard G. Niemi, Frederick Conrad, Michael J. Han-
mer & Michael Traugott. 2006. “The Not So Simple Act of Voting: An Examination of Voter
Errors with Electronic Voting.” Unpublished working paper, University of Maryland, College
Park.
Herrnson, Paul S., Owen G. Abbe, Peter L. Francia, Benjamin B. Bederson, Bongshin Lee,
Robert M. Sherman, Fred Conrad, Richard G. Niemi & Michael Traugott. 2005. “Early
Appraisals of Electronic Voting.” Forthcoming, Social Science Computing Review.
Herron, Michael C. & Jasjeet S. Sekhon. 2003. “Overvoting and Representation: An examination
of overvoted presidential ballots in Broward and Miami-Dade counties.” Electoral Studies
22(1):21–47.
Herron, Michael C. & Jeffrey B. Lewis. 2006. “From Punchcards to Touchscreens: Some Evidence
from Pasco County, Florida on the Effects of Changing Voting Technology.” Unpublished
working paper, Dartmouth College.
Ho, Daniel E. & Kosuke Imai. 2006. “Randomization Inference With Natural Experiments: An
Analysis of Ballot Effects in the 2003 California Recall Election.” Journal of the American
Statistical Association 101(475):888–900.
Honaker, James, Jonathan Katz & Gary King. 2002. “A Fast, Easy, and Efficient Estimator for
Multiparty Electoral Data with Improved Lemon Scent.” Political Analysis 10(1):84–100.
Jackson, John E. 2002. “A Seemingly Unrelated Regression Model for Analyzing Multiparty
Elections.” Political Analysis 10(1):49–65.
Katz, Jonathan & Gary King. 1999. “A Statistical Model for Multiparty Electoral Data.” American
Political Science Review 93(1):15–32.
56

Kimball, David C. 2003. “VotingMethods Two Years After Florida.” Paper Presented at the Annual
Meeting of the Midwest Political Science Association.
Kimball, David C. & Martha Kropf. 2005. “Ballot Design and Unrecorded Votes on Paper-Based
Ballots.” Public Opinion Quarterly 69(4):508–529.
King, Gary, James Honaker, Anne Joseph & Kenneth Scheve. 2001. “Analyzing Incomplete Po-
litical Science Data: An Alternative Algorithm for Multiple Imputation.” American Political
Science Review 95(1):49–69.
Koppell, Jonathan GS & Jennifer A. Steen. 2004. “The Effects of Ballot Position on Election
Outcomes.” Journal of Politics 66(1):267–281.
Mebane, Jr., Walter R. 2004. “The Wrong Man is President! Overvotes in the 2000 Presidential
Election in Florida.” Perspectives on Politics 2(3):525–535.
Merzer, Martin. 2001. The Miami Herald Report: Democracy Held Hostage. New York: St.
Martin’s Press.
Posner, Richard A. 2001. Breaking the Deadlock: The 2000 Election, the Constitution, and the
Courts. Princeton, NJ: Princeton University Press.
Schafer, Joseph L. 1997. Analysis of Incomplete Multivariate Data. New York: Chapman and
Hall.
Sinclair, Robert C., Melvin M. Mark, Sean E. Moore, Carrie A. Lavis & Alexander S. Soldat.
2000. “An electoral butterfly effect.” Nature 408:665–666.
Tomz, Michael, Joshua A. Tucker & Jason Wittenberg. 2002. “An Easy and Accurate Regression
Model for Multiparty Electoral Data.” Political Analysis 10(1):66–83.
57

Tomz, Michael & Robert P. van Houweling. 2003. “How Does Voting Equipment Affect the Racial
Gap in Voided Ballots?” American Journal of Political Science 47(1):46–60.
Wallach, Dan S. 2006. “Declaration of Dan S. Wallach.” Unpublished legal declaration pursuant
to Christine Jennings’s election contest.
Wand, Jonathan N., Kenneth W. Shotts, Jasjeet S. Sekhon, Walter R. Mebane, Jr., Michael C.
Herron & Henry E. Brady. 2001. “The Butterfly Did It: The Aberrant Vote for Buchanan in
Palm Beach County, Florida.” American Political Science Review 95(4):793–810.
58